Abstract
Lysophosphatidic acid receptor 5 (LPAR5) is involved in mediating thyroid cancer progression, but the underlying mechanism needs to be further revealed. In this study, we confirmed that LPAR5 is upregulated in papillary thyroid carcinoma (PTC), especially in BRAF‐like PTC, by analyzing The Cancer Genome Atlas (TCGA) database and performing immunohistochemistry assay in human thyroid cancer tissues. LPAR5‐specific antagonist TC LPA5 4 treatment inhibited CGTH‐W3, TPC‐1, B‐CPAP, and BHT‐101 cell proliferation, CGTH‐W3 and TPC‐1 cell migration significantly. In vivo, TC LPA5 4 treatment could delay CGTH‐W3 xenograft growth in nude mice. We also found that LPAR5‐specific antagonist TC LPA5 4, PI3K inhibitor wortmannin, or mTOR inhibitor rapamycin pretreatment abrogated phosphorylation of Akt and p70S6K1 stimulated by LPA in CGTH‐W3 and TPC‐1 cells. Stimulating CGTH‐W3 cells transfected with pEGFPC1‐Grp1‐PH fusion protein with LPA resulted in the generation of phosphatidylinositol (3,4,5)‐triphosphate, which indicates that PI3K was activated by LPA directly. The p110β‐siRNA instead of p110α‐siRNA transfection abrogated the increase of levels of phosphorylated Akt and S6K1 stimulated by LPA. Furthermore, immunoprecipitation assay confirmed an interaction between LPAR5 and p110β. Overall, we provide new insights that the downregulation of LPAR5 decreased the proliferation and migration phenotype via the PI3K/Akt pathway. Inhibition of LPAR5 or the PI3K/Akt signal may be a novel therapeutic strategy for treating thyroid cancer.
Keywords: GPCR, LPAR5, p110β, PI3K, thyroid cancer
Lysophosphatidic acid receptor 5 (LPAR5) is upregulated in thyroid cancer and plays important roles in thyroid cancer proliferation and migration through activating PI3K kinase directly. Inhibition of LPAR5 or the PI3K/Akt pathway may be used for the therapy of metastatic and recurrent thyroid cancer expressing high levels of LPAR5.
1. INTRODUCTION
The incidence of thyroid cancer, the most common endocrine neoplasia, continues to rise, mostly as a result of increased use of imaging modalities. 1 , 2 Surgical resection together with radioactive iodine (RAI) therapy and thyroid‐stimulating hormone (TSH)‐suppressive therapy remains the foundation of treatment for thyroid cancer, 3 and the overall 5‐year survival for patients with papillary thyroid carcinomas (PTCs) is up to 95%. However, the incidence of recurrence and metastasis is still as high as 20%‐30%, 4 and the overall survival in patients with locally recurrent PTC is decreased to 70%‐85%. 5 In addition, a certain proportion of advanced and local recurrent and/or metastatic thyroid cancer is unresponsive to current therapeutics and often not curable. 6 , 7 Therefore, the underlying mechanism of thyroid cancer development and novel treatments have been evaluated. Here, we performed bioinformatics analysis of The Cancer Genome Atlas (TCGA) database and found the differential mRNA expression gene lysophosphatidic acid receptor 5 (LPAR5) between thyroid cancer tissue and adjacent normal thyroid tissue (see supplementary.xlsx files).
Lysophosphatidic acid (LPA) and lysophosphatidic acid receptor (LPAR) axis signaling plays important roles in the development of cancer. 8 , 9 , 10 LPAR5, the most recently found member of the LPAR family, is overexpressed in various cancers and mediates cancer survival, invasion and metastasis. 11 , 12 Recently, Wu et al and Gang et al showed that high LPAR5 expression is associated with lymph node metastasis of thyroid carcinoma, and when the expression of LPAR5 is knocked down, the activation of Akt is also decreased. 10 , 13 Meanwhile, Plastira et al also showed that TC LPA5 4, which is a selective antagonist targeting LPAR5, can attenuate the activity of Akt in microglial cell lines. 14 Although it has been reported that Akt mediates LPAR5’s function in thyroid cancer development, the precise mechanism underlying the activation of Akt by LPAR5 remains elusive because there are various upstream molecules of Akt.
In the present study, we show that LPA activates the LPAR5 receptor and interacts with the p110β catalytic subunit, activating it and its downstream signaling pathway, including the phosphorylation of Akt and p70S6K1. LPAR5 inhibitor TC LPA5 4 inhibits cell proliferation and migration of thyroid cancer cells. We propose that inhibitors targeting the LPAR5 pathway may be used for the therapy of thyroid cancer.
2. MATERIALS AND METHODS
2.1. TCGA data
The thyroid cancer tissue samples and corresponding clinical parameters for these patients were downloaded from TCGA database. We selected 501 PTC tissues and 58 adjacent normal tissue. For TCGA data, the edgeR package was used for screening differentially expressed genes (DEGs), setting adj. P‐ value < 0.01, log2 |FC| > 2 as the cutoff line.
2.2. Protein‐protein interaction (PPI) network construction
We used the online tool Search Tool for the Retrieval of Interacting Genes (STRING, http://string‐db.org) to construct the functional PPI analysis of the DEGs. The interaction score > 0.6 was used as the cutoff criterion. Subsequently, the Cytoscape software (http://www.cytoscape.org/) was used for constructing and visualizing a PPI network of DEGs. The plugin cytoHubba was used to select the top 10 hub genes from the PPI network according to the maximal clique centrality (MCC) ranking. Meanwhile, the plugin MCODE was used to analyze all DEGs to get the seed gene.
2.3. Cell culture and reagents
CGTH‐W3 and TPC‐1 were obtained from Taizhou Central Hospital. B‐CPAP and BHT‐101 were purchased from ATCC. Cells were maintained in an appropriate medium as protocol and incubated in a humidified atmosphere of 95% air plus 5% CO2 at 37℃. TC LPA5 4 was purchased from Tocris Bioscience. Wortmannin was obtained from MCE. Rapamycin was purchased from LC Laboratories. LPA (18:1) was purchased from Avanti Polar‐Lipids. pEGFP‐C1‐Grp1‐PH was obtained from Addgene.
2.4. Immunohistochemistry (IHC)
Thyroid carcinoma samples were obtained from Taizhou Municipal Hospital. Immunohistochemical study was performed according to standard procedure. Briefly, after deparaffinization, rehydration, antigen retrieval, neutralization of endogenous peroxidase, and blocking with 10% normal serum, primary antibodies (LPAR5 antibodies, 1:200, Thermo Fisher Scientific) were incubated with slices at −4°C overnight, and then the slices were washed three times with PBS before the secondary antibodies were added (anti‐Rb IgG/HRP was obtained from Proteintech; the dilution rate was 1:1000). After incubation at room temperature for 1 hour, slices were washed three times with PBS and then colored with 3,3’‐diaminobenzidine. Finally, they were counterstained with H&E at room temperature. Microscope and ImageJ was used to analyze stained slices. Only brown color was considered positive marking regardless of the color intensity.
2.5. Immunofluorescence
Cells were seeded on sterile coverslips and cultured for 24 hours. Cells were fixed with 4% paraformaldehyde for 15 minutes at room temperature, followed by blocking with 3% BSA for 1 hour. Immunofluorescence staining was performed with antibodies to LPAR5 (1:200, LifeSpan BioSciences, Inc) diluted in the PBS and incubated at 4°C overnight. The cells were washed with PBS and incubated with goat anti‐rabbit IgG‐FITC (Absin BioSciences) secondary antibody. Nuclei were stained using DAPI, and plasma membranes were stained using DiI perchlorate (Absin BioSciences). The cells were visualized using FV‐3000 laser scanning confocal microscopes. Images were captured using a fluorescence microscope (Olympus IX‐83 FV3000).
2.6. Cell proliferation
For the assessment of viability and proliferation rate of cells, we used MTT (3‐[4, 5‐dimethylthiazol‐2‐yl]‐2, 5‐diphenyl tetrazolium bromide) assay. The cells were seeded in a 96‐well plate in a complete culture medium (2 × 10³ cells per well). After 24 hours incubation, the indicated drugs were added to achieve final concentrations of 0 ~ 300 μM. The MTT reagent was used for 4 hours at 37°C. The it was removed, and dimethyl sulfoxide (DMSO) was added. Absorbance was measured at 520 nm.
2.7. Migration assay
Migration assay was performed using an 8‐mm‐pore‐size filter in the insert chamber (Costar). A total of 2 × 10⁵ cells were resuspended in serum‐free culture medium and then added to the upper chambers of the transwell in the presence of TC LPA5 4 (5 μM), or in its absence as control. For the lower wells, LPA (10 μM) and TC LPA5 4 were added into serum‐free culture medium. The total cells were incubated for 12 hours, after which migrating to the lower surface of the membrane was fixed, followed by staining with 10% crystal violet and washing with PBS. Cells were counted in five random fields for each well under microscope.
2.8. Animals and antitumor activity assay in vivo
BALB/C‑nu/nu mice, aged 4‑5 weeks, were obtained from Shanghai SIPPR‐BK LAB ANIMAL CO., LTD and housed in sterile cages under laminar airflow hoods in a specific pathogen‐free room with a 12‐hour light and 12‐hour dark schedule. The mice were fed autoclaved chow and water ad libitum. All experiments were done according to institutional ethical guidelines on animal care. A total of 1 × 10⁷ cells were transplanted s.c. into the flank of the nude mice. When the tumor volume reached ∼100 mm3, the mice were randomly assigned into control and treatment groups. Control groups were given vehicle, and treatment groups received TC LPA5 4 administration (10 mg/kg, i.p.) 5 days/week for 2 weeks. The sizes of the tumors were measured twice per week.
2.9. Transfection of siRNA
The synthetic siRNAs targeting p110 subunits LPAR5 and p85 were obtained from Gene Pharma with sequences as follows: 5’‐GGUGGACCACGAAGAGUUATT‐3’ (p110α); 5’‐GCUGUCAAUCAAGUGGAAUAAACUU‐3’ (p110β); 5’‐GGAUCAAGUUGUCAAAGAATT‐3’(p85); 5’‐CCGCUGGUGUACUACUUUATT‐3’(LPAR5); 5’‐UUCUCCGAACGUGUCACGUTT‐3’. Scrambled siRNA was used as a negative control. Cells were transfected at 60%‐70% confluence using Lipofectamine 2000 (Invitrogen) with a final siRNA concentration of 100 nM.
2.10. Immunoblot
Cells were lysed in RIPA buffer containing cocktail. Concentration of the protein from cell extracts was determined by Pierce BCA protein assay kit (Thermo Fisher Scientific). Equal amounts of proteins were denatured by sample buffer, separated by SDS‐PAGE (10%), and transferred to polyvinylidene difluoride membranes (PVDF). Membranes were blocked with 5% low‐fat milk and incubated with the following primary antibodies at 4°C overnight: S6K1, phosphorylated S6K1, Akt, phosphorylated Akt473, and p110α (Cell Signaling Technology); p110β (ProteinTech group) and GAPDH (Santa Cruz Biotechnology); LPAR5 antibodies were obtained from LifeSpan Biosciences and Thermo Fisher Scientific. Then, the membranes were further incubated with anti‐rabbit 1:10 000 and anti‐mouse 1:10 000 secondary antibodies for 1 hour at room temperature. The immunoreactive bands were visualized using ECL system.
2.11. Akt translocation assay
CGTH‐W3 transfected with pEGFP‐C1‐Grp1‐PH was seeded on coverslips and further incubated in serum‐free medium for 24 hours. After addition of LPA (10 μM) for 10 minutes, one drop of DAPI was used to seal the coverslips. The fluorescent images of the cells were captured with confocal microscopy.
2.12. Co‐immunoprecipitation (Co‐IP)
Cells were pretreated with cell lysis buffer for Western blot and Co‐IP, which contained cocktail. The supernatants were pretreated with normal IgG and protein A + G agarose. Removing the beads, the supernatants were collected and mixed with primary antibodies or normal rabbit IgG and protein A + G agarose overnight at 4°C. The beads were collected by centrifugation at 1000 rpm for 3 minutes at 4°C and washed three times with lysis buffer. Subsequently, the protein bound to beads was denatured by boiling at 100°C for 10 minutes in 30 µL SDS‐PAGE sample loading buffer. The proteins were separated by 10% SDS‐PAGE with subsequent immunoblotting analysis.
2.13. Statistical analysis
Statistical significance was assessed by paired Student's t test. The results were shown as mean ± SD. Student's t tests were performed using Graphpad Prism software (Graphpad Software). A P‐value < 0.05 was considered significant.
3. RESULTS
3.1. Overexpression of LPAR5 in thyroid cancer cells
We explored the expression profile of LPAR5 in thyroid cancer tissues using TCGA dataset. There were 559 samples in the dataset, including 501 thyroid cancer tissues and 58 normal thyroid tissues. Through a comparison of the gene mRNA levels in cancer and normal tissues, 1090 DEGs were screened out (false discovery rate < 0.01), in which there were 842 genes with higher mRNA levels in cancer tissues than in normal tissues, and 248 genes expressed lower levels (Figure 1A).
FIGURE 1.
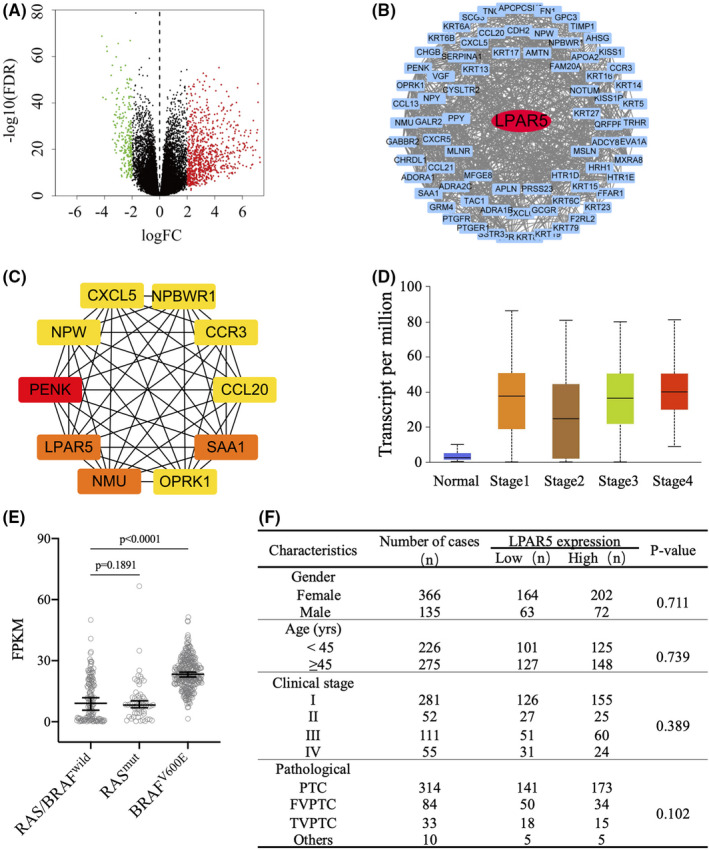
Analysis of lysophosphatidic acid receptor 5 (LPAR5) expression profile using data from TCGA. A, Volcano plots of differentially expressed genes (DEGs) between thyroid cancer and normal thyroid tissue. Red: upregulation; green: downregulation; black plots: normally expressed mRNAs. B, The protein‐protein interaction (PPI) network was constructed by MCODE. Red nodes represent the seed DEGs in the network. C, The top 10 hub genes were identified by cytoHubba. The higher the MCC ranking, the darker the red color. D and E, LPAR5 differently expressed in different stages of papillary thyroid carcinoma (PTC) tissues, RAS‐like or BRAFV600E‐like PTC tissues. F, The relationship between clinicopathological data and LPAR5 expression from TCGA database
Protein‐protein interaction networks were constructed to analyze the interaction between DEGs based on STRING database and visualized by Cytoscape. After removing the disconnected nodes in the network, there were 749 nodes and 1622 edges. As shown in Figure 1B, only LPAR5 is the seed of DEGs in the network according to MCODE. LPAR5 also belongs to the top 10 hub genes identified by cytoHubba, including PENK, LPAR5, NMU, HP, AHSG, ADCY8, NPY, FN1, APOA2, and SERPINA1 (Figure 1C). TCGA database analysis results indicate that LPAR5 is one of the key factors in mediating thyroid cancer development (Figure 1D and 1F).
TCGA database analysis shows that RAS mutation rate is 10.70% in PTC, while BRAF V600E mutation rate is 58.99%. As shown in Figure 1D, LPAR5 mRNA expression level is higher in BRAFV600E‐like PTC.
To further confirm the differential expression of LPAR5 between thyroid cancer tissues and normal thyroid tissues, we detected the expression levels of LPAR5 protein in 10 pairs of thyroid cancer and adjacent normal thyroid tissue samples using IHC assay. As shown in Figure 2A, the IHC assay results also revealed that LPAR5 expression was significantly upregulated in thyroid cancer tissues. In Figure 2B, we can find that fluorescent foci of LPAR5 (green) colocalized with cell membrane stain (red), indicating that LPAR5 is expressed on cellular membrane.
FIGURE 2.
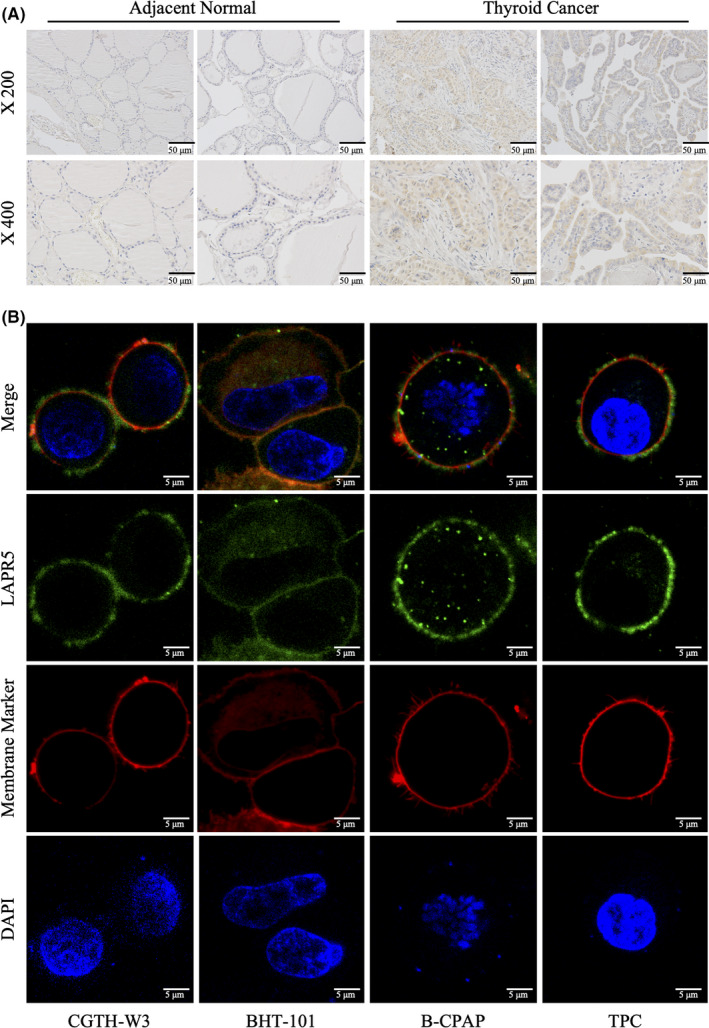
Lysophosphatidic acidreceptor5 (LPAR5) expression in thyroid cancer. A, Representative immunohistochemistry assay images of LPAR5 staining in thyroid cancer and normal tissues. B, Subcellular localization of LPAR5 in thyroid cancer cell lines. The immunostained LPAR5 protein is shown as green color and the membrane marker is red. Magnification × 1000. Data shown are representative of at least three independent experiments
3.2. Inhibition of LPAR5 restrained proliferation and migration of thyroid cancer cells
To test the roles of LPAR5 thyroid cancer, the MTT assay and transwell assay were utilized to detect proliferation and migration of thyroid cancer cells in the presence of LPAR5 inhibitor TC LPA5 4. TC LPA5 4 (CAS No.1393814‐38‐4) is a diphenyl pyrazole carboxylic acid as the small‐molecule inhibitor for LPA5.
As shown in Figure 3A, LPAR5 antagonist TC LPA5 4 inhibited the proliferation on thyroid cancer cells CGTH‐W3, TPC‐1, B‐CAPAP, and BHT101 significantly with IC50 at 103.0 μM, 84.9 μM, 55.9μM, and 57.17 μM. In addition, treatment of TC LPA5 4 at 5 μM for 24 hours significantly inhibited LPA‐stimulated migration of CGTH‐W3 and TPC‐1 cells, with an inhibitory rate of ~ 30% (Figure 3B).
FIGURE 3.
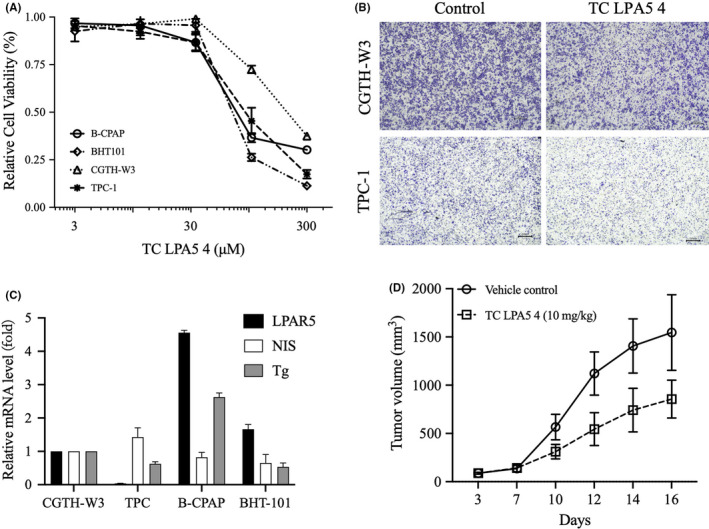
Inhibition of lysophosphatidic acid receptor 5 (LPAR5) suppresses thyroid cancer cell proliferation and migration. A, Relative cell viability was detected by MTT assay upon treatment with TC LPA5 4 at different concentrations for 72 h. B, The effect of TC LPA5 4 on the migration abilities of thyroid cancer cells was detected by transwell assay (magnification × 4). **Compared with control group, P < .01. C, Relative mRNA expression of thyroid‐specific genes, such as NIS, TPO, and Tg in CGTH‐W3, TPC‐1, B‐CAPAP, and BHT101 cells. D, Inhibition of tumor growth by TC LPA5 4 against CGTH‐W3 xenografts
We also analyzed the expression of thyroid‐specific genes, NIS and Tg, in thyroid cancer cells CGTH‐W3, TPC‐1, B‐CAPAP, and BHT101. As shown in Figure 3C, we did not find the associated profiles between LPAR5 and NIS or Tg. However, LPAR5 expression significantly correlated with LPAR5 inhibitor TC LPA5 4 sensitivity in tumor cells. B‐CPAP and BHT101 cells expressed higher LPAR5 mRNA. TC LPA5 4 inhibited these two cell lines’ proliferations with IC50 at 55.9μM and 57.17 μM. CGTH‐W3 and TPC‐1 cells expressed lower LPAR5 mRNA. TC LPA5 4 displayed differential antitumor activity with IC50 at 103.0 μM and 84.9 μM. We computed the correlation of LPAR5 expression and TC LPA5 4 antitumor activities in these cells and found that LPAR5 gene expression is positively correlated with TC LPA5 4 activity (r = −0.69; P < .05).
To further detect the antitumor activity of the LPAR5 inhibitor in vivo, we built a CGTH‐W3 xenograft model in nude mice. Figure 3D data showed that TC LPA5 4 significantly inhibits CGTH‐W3 xenograft growth with inhibitory rates of 46.7%.
These results indicated that compounds targeting the LPAR5 protein inhibit the survival and motility of thyroid cancer cells mediated by the LPA/LPAR5 axis.
3.3. Activation of the PI3K/Akt/mTOR pathway by LPA
It was reported that LPAR5 knockdown mediated by siRNA decreases the levels of phosphorylated Akt in thyroid cancer cells, which indicates that LPAR5 may play a significant role in thyroid cancer via the PI3K/Akt pathway. 10 , 13 We also knocked down LPAR5 by transfecting LPAR5‐siRNA in TPC‐1 and CGTH‐W3 cells and confirmed the decrease of phosphorylated Akt levels along with LPAR5‐knockdown (Figure 4A). However, the underlying mechanism needs to be disclosed and confirmed further. Here, we test whether LPA activates the PI3K/Akt pathway in human thyroid carcinoma cells. As shown in Figure 4A, phosphorylated Akt and phosphorylated p70S6K1 increased significantly 1 minute right after stimulation with LPA in CGTH‐W3 and TPC‐1 cells, which lasted for at least 10 minutes. Moreover, pretreatment of LPAR5‐specific antagonist TC LPA5 4, PI3K inhibitor wortmannin, or mTOR inhibitor rapamycin blocked phosphorylation of Akt or p70S6K1 induced by LPA stimulation (Figure 4B). These data demonstrated that LPA activated LPAR5 and then activated the PI3K/Akt/mTOR signaling cascade.
FIGURE 4.
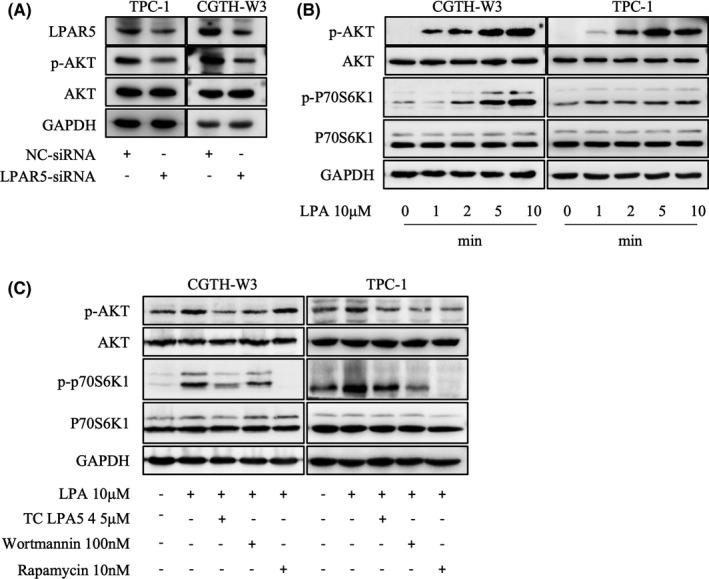
The lysophosphatidic acid/lysophosphatidic acid receptor5 (LPA/LPAR5) axis activates the PI3K/Akt/mTOR signaling cascade. A, Downregulation of LPAR5 mediated by siRNA decreased phosphorylated Akt levels in CGTH‐W3 and TPC‐1 cells. B, LPA enhanced phosphorylation of Akt and p70S6K in CGTH‐W3 and TPC‐1 cells. Serum‐deprived thyroid cells were treated with LPA (10 μM) for the indicated times. Total Akt and p70S6K protein, as well as their phosphorylated forms were detected using Western blot assay. GAPDH was employed as a loading control. B, LPAR5‐specific inhibitor TC LPA5 4 (5 μM), PI3K inhibitor wortmannin (100 nM), or mTOR inhibitor rapamycin (10 nM) pretreatment for 2 h blocks PI3K/Akt/mTOR signal activation induced by LPA (10 μM) stimulation
3.4. LPAR5 interacting with p110β catalytic isoform and activating PI3K signaling
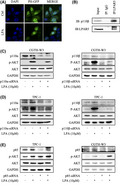
To further identify that phosphorylation of Akt and p70S6K1 is due to the activation of PI3K in thyroid cancer cells, the redistribution of the Grp1‐PH domain after stimulation of LPA was detected in CGTH‐W3 cells transfected with Grp1‐PH domain fused to EGFP. As shown in Figure 5A, the EGFP‐Grp1‐PH was distributed in the cytoplasm and nucleus in serum‐deprived cells, while it translocated to the cellular membrane after LPA stimulation, which indicates that LPA activates PI3K, results in the production of PtdIns3‐5P3 on the cellular membrane, and then recruits Akt.
FIGURE 5.
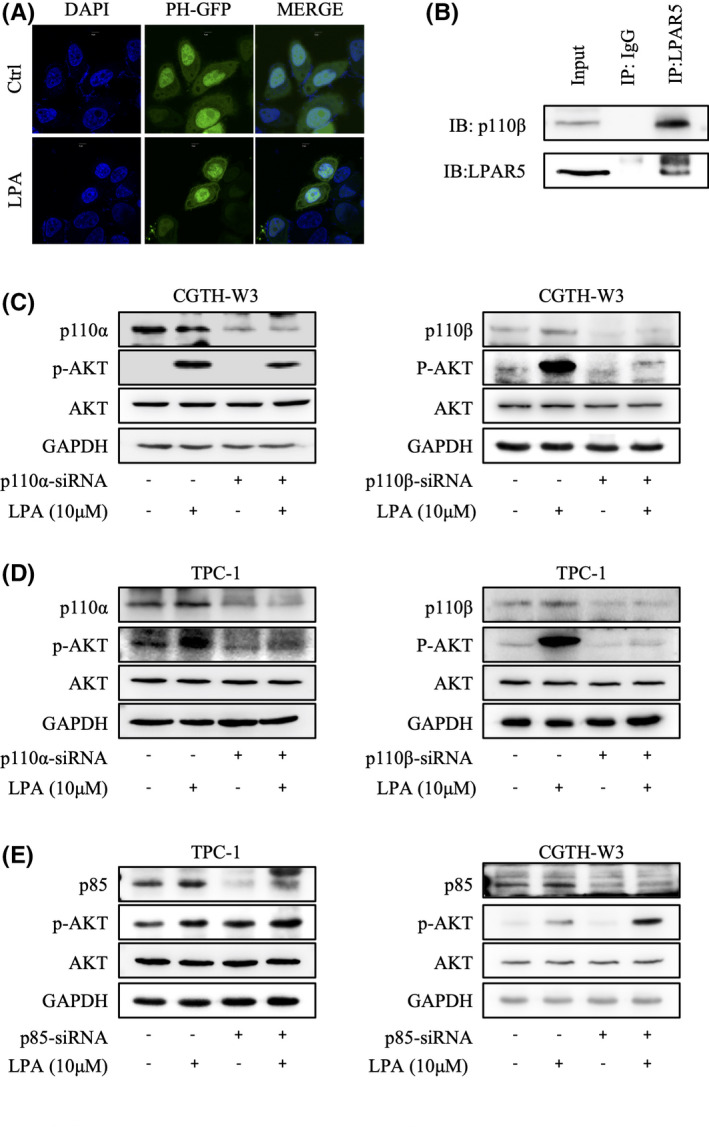
Lysophosphatidic acid receptor5 (LPAR5) activates PI3K kinase through p110β catalytic isoform. A, Lysophosphatidic acid(LPA) increased PIP3 generation. CGTH‐W3 cells transfected with pEGFP‐C1‐Grp1‐PH were incubated in serum‐free media for 24 h. After addition of LPA (10 μM) for 5 min, the fluorescent images of the cell were captured with confocal microscopy. B, LPAR5 associates with p110β catalytic isoform in thyroid cancer cells. In immunoprecipitation assay, the pulling antibody was LPAR5. Control immunoprecipitation was performed using rabbit IgG. Protein samples from whole‐cell lysates were used to point at the position of the protein examined. IP, immunoprecipitated; IB, immunoblot. C, D, E, The expression of phosphorylated Akt and p70S6K induced by LPA is lower in the cells transfected with p110β‐siRNA. After transfection with the respective siRNA for 24 h, CGTH‐W3 and TPC‐1 cells were maintained in FBS‐free medium and then stimulated with LPA (10 μM) for 10 min. Phosphorylated Akt and p70S6K were analyzed by immunoblotting; GAPDH was employed as loading control
PI3K catalytic enzymes comprise four classes by their structure and substrate specificity. We next investigated which catalytic isoform would provide an access to the LPA/LPAR5 axis–activated PI3K/Akt/mTOR signaling pathway. We further showed that LPAR5 coprecipitated with p110β in the immunoprecipitation assay in CGTH‐W3 cells (Figure 5B). Next, we examined the LPA‐stimulated PI3K/Akt/mTOR signaling pathway after knocking down p110α or p110β by transfection of siRNA targeting p110α or p110β. As shown in Figure 5C and 5D, the transfection of the isoform‐specific siRNA in CGTH‐W3 and TPC‐1 cells reduced the protein level of p110α or p110β, respectively. Compared with the p110α‐specific siRNA, the expression level of phosphorylation of Akt by blocking the p110β‐specific siRNA is significantly lower. Thus, these results demonstrated that LPAR5 interacted with p110β and activated its downstream signaling. In addition, we knocked down the p85 regulation subunit in both CGTH‐W3 and TPC‐1 cells. Without p85 inhibition, phosphorylated Akt was upregulated and LPA stimulation induced stronger Akt phosphorylation (Figure 5E).
4. DISCUSSION
Due to more aggressive behavior, including the development of lymph‐nodal and visceral metastasis, and decreased RAI responsiveness, the recurrence rate of thyroid cancer in older patients is high, which is parallel to the mortality rates. 2 , 15 Thus, deciphering the molecular mechanisms underlying thyroid cancer progression is essential for the individualized treatment of these patients. TCGA is a public‐funded project that aims to catalogue and discover major cancer‐causing genomic alterations to create a comprehensive "atlas" of cancer genomic profiles. Here, we performed a TCGA database analysis and found the DEGs between thyroid cancer and adjacent normal thyroid tissue. LPAR5 was one of the DEGs and was even supposed to be one of the most important protein by PPI network analysis.
Previous studies have reported that LPAR5 overexpression in papillary thyroid cancer and breast carcinoma is correlated with lymph node metastasis. 13 , 16 In this report, we also showed that LPAR5‐specific antagonist TC LPA5 4 could inhibit thyroid cancer cell proliferation and migration, which confirms the important roles of LPAR5 in thyroid cancer progression.
It has been reported that LPAR5 has an association with Gα12/13 and Gαq/11. 17 , 18 In addition, reversing the inhibitory effect of LPAR5 on cell migration and proliferation by Akt activator SC79 reveals the interaction of LPAR5 and Akt. Meanwhile, the downregulation of LPAR5 mediated by siRNA also reduces the levels of phosphorylated Akt. 13 , 14 In our study, using phosphorylated Akt as an indirect marker for the activation of PI3K, we showed that LPA stimulation activated the PI3K/Akt/mTOR signaling cascade in thyroid cancer CGTH‐W3 and TPC‐1 cells, which is consistent with a previous study. 19 Moreover, the generation of PtdIns3‐5P3 and the translocation of protein‐containing PH domain to the cellular membrane by the stimulation of LPA provide direct evidence that LPA activates PI3K. To further substantiate the results, we revealed that p110β is the main PI3K isoform coupled with LPAR5 signal in thyroid cancer cell, whereas the way LPAR5 interacts with p110β needs to be further studied. The PI3K/Akt signaling pathway plays an important role in a variety of tumors, including thyroid cancer, and is closely related to metastasis, tumorigenesis, and proliferation 20 , 21 , 22 .
In conclusion, we show that LPAR5 is upregulated in thyroid cancer and plays important roles in thyroid cancer proliferation and migration through activating PI3K kinase directly. Inhibition of LPAR5 or the PI3K/Akt pathway may be used for the therapy of metastatic and recurrent thyroid cancer expressing high levels of LPAR5.
DISCLOSURE
The authors declare no conflict of interest.
ACKNOWLEDGMENTS
This study was, in part, funded by the National Natural Science Foundation of China (No. 81802657 and 81201530), Public Technology Research Projects of the Science Technology Department of Zhejiang Province (No.LY20H310003, LGF19H050004 and LGD20H310001), Scientific Research Foundation of the Education Department of Zhejiang Province (Y201941713), Medical Health Science and Technology Project of Zhejiang Provincial Health Commission (2020385091), and Technology Research Projects of the Science Technology Department of Taizhou (No. 20ywb97, 1901ky77, 1901ky54 and 1902ky45).
Zhao W‐J, Zhu L‐L, Yang W‐Q, et al. LPAR5 promotes thyroid carcinoma cell proliferation and migration by activating class IA PI3K catalytic subunit p110β. Cancer Sci. 2021;112:1624–1632. 10.1111/cas.14837
Wei‐Jun Zhao, Liu‐Lian Zhu and Wei‐Qiang Yang contributed equally to this work.
Contributor Information
Xiao‐Fei Ding, Email: dxfei@tzc.edu.cn.
Yong Liang, Email: liangytu@aliyun.com.
Guang Chen, Email: gchen@tzc.edu.cn.
REFERENCES
- 1. Cabanillas ME, Ryder M, Jimenez C. Targeted therapy for advanced thyroid cancer: kinase inhibitors and beyond. Endocr Rev. 2019;40(6):1573‐1604. [DOI] [PMC free article] [PubMed] [Google Scholar]
- 2. Cabanillas ME, McFadden DG, Durante C. Thyroid cancer. Lancet. 2016;388(10061):2783‐2795. [DOI] [PubMed] [Google Scholar]
- 3. Brose MS, Cabanillas ME, Cohen EE, et al. Vemurafenib in patients with BRAF(V600E)‐positive metastatic or unresectable papillary thyroid cancer refractory to radioactive iodine: a non‐randomised, multicentre, open‐label, phase 2 trial. Lancet Oncol. 2016;17(9):1272‐1282. [DOI] [PMC free article] [PubMed] [Google Scholar]
- 4. Yip L, Sosa JA. Molecular‐directed treatment of differentiated thyroid cancer: advances in diagnosis and treatment. JAMA Surg. 2016;151(7):663‐670. [DOI] [PubMed] [Google Scholar]
- 5. Shaha AR. Recurrent differentiated thyroid cancer. Endocr Pract. 2012;18(4):600‐603. [DOI] [PubMed] [Google Scholar]
- 6. Haddad RI, Nasr C, Bischoff L, et al. NCCN Guidelines Insights: thyroid carcinoma, version 2.2018. J Natl Compr Canc Netw. 2018;16(12):1429‐1440. [DOI] [PubMed] [Google Scholar]
- 7. Llamas‐Olier AE, Cuéllar DI, Buitrago G. Intermediate‐risk papillary thyroid cancer: risk factors for early recurrence in patients with excellent response to initial therapy. Thyroid. 2018;28(10):1311‐1317. [DOI] [PubMed] [Google Scholar]
- 8. Choi JW, Herr DR, Noguchi K, et al. LPA receptors: subtypes and biological actions. Annu Rev Pharmacol Toxicol. 2010;50:157‐186. [DOI] [PubMed] [Google Scholar]
- 9. Hisano Y, Hla T. Bioactive lysolipids in cancer and angiogenesis. Pharmacol Ther. 2019;193:91‐98. [DOI] [PMC free article] [PubMed] [Google Scholar]
- 10. Xue G, Lin X, Wu JF, et al. Identification of key genes of papillary thyroid carcinoma by integrated bioinformatics analysis. Biosci Rep. 2020;40(8):BSR20201555 [DOI] [PMC free article] [PubMed] [Google Scholar]
- 11. Liu L, He C, Zhou Q, Wang G, Lv Z, Liu J. Identification of key genes and pathways of thyroid cancer by integrated bioinformatics analysis. J Cell Physiol. 2019;234(12):23647‐23657. [DOI] [PubMed] [Google Scholar]
- 12. Lee SC, Fujiwara Y, Liu J, et al. Autotaxin and LPA1 and LPA5 receptors exert disparate functions in tumor cells versus the host tissue microenvironment in melanoma invasion and metastasis. Mol Cancer Res. 2015;13(1):174‐185. [DOI] [PMC free article] [PubMed] [Google Scholar]
- 13. Wu CY, Zheng C, Xia EJ, et al. Lysophosphatidic Acid Receptor 5 (LPAR5) plays a significance role in papillary thyroid cancer via Phosphatidylinositol 3‐Kinase/Akt/Mammalian Target of Rapamycin (mTOR) pathway. Med Sci Monit. 2020;26:e919820. [DOI] [PMC free article] [PubMed] [Google Scholar]
- 14. Plastira I, Bernhart E, Goeritzer M, et al. Lysophosphatidic acid via LPA‐receptor 5/protein kinase D‐dependent pathways induces a motile and pro‐inflammatory microglial phenotype. J Neuroinflammation. 2017;14(1):253. [DOI] [PMC free article] [PubMed] [Google Scholar]
- 15. Hollenbeak CS, Boltz MM, Schaefer EW, Saunders BD, Goldenberg D. Recurrence of differentiated thyroid cancer in the elderly. Eur J Endocrinol. 2013;168(4):549‐556. [DOI] [PubMed] [Google Scholar]
- 16. Zheng YQ, Miao X, Li J, et al. Trichostatin A alleviates the process of breast carcinoma by downregulating LPAR5. Eur Rev Med Pharmacol Sci. 2020;24(11):6417‐6425. [DOI] [PubMed] [Google Scholar]
- 17. Stoddard NC, Chun J. Promising pharmacological directions in the world of lysophosphatidic acid signaling. Biomol Ther (Seoul). 2015;23(1):1‐11. [DOI] [PMC free article] [PubMed] [Google Scholar]
- 18. Zhou Y, Little PJ, Ta HT, Xu S, Kamato D. Lysophosphatidic acid and its receptors: pharmacology and therapeutic potential in atherosclerosis and vascular disease. Pharmacol Ther. 2019;204:107404. [DOI] [PubMed] [Google Scholar]
- 19. Chen G, Chen SM, Wang X, Ding XF, Ding J, Meng LH. Inhibition of chemokine (CXC motif) ligand 12/chemokine (CXC motif) receptor 4 axis (CXCL12/CXCR4)‐mediated cell migration by targeting mammalian target of rapamycin (mTOR) pathway in human gastric carcinoma cells. J Biol Chem. 2012;287(15):12132‐12141. [DOI] [PMC free article] [PubMed] [Google Scholar]
- 20. Wang N, Li Y, Wei J, et al. TBX1 functions as a tumor suppressor in thyroid cancer through inhibiting the activities of the PI3K/AKT and MAPK/ERK pathways. Thyroid. 2019;29(3):378‐394. [DOI] [PubMed] [Google Scholar]
- 21. Nikiforov YE, Nikiforova MN. Molecular genetics and diagnosis of thyroid cancer. Nat Rev Endocrinol. 2011;7(10):569‐580. [DOI] [PubMed] [Google Scholar]
- 22. Ricarte‐Filho JC, Ryder M, Chitale DA, et al. Mutational profile of advanced primary and metastatic radioactive iodine‐refractory thyroid cancers reveals distinct pathogenetic roles for BRAF, PIK3CA, and AKT1. Cancer Res. 2009;69(11):4885‐4893. [DOI] [PMC free article] [PubMed] [Google Scholar]


