Abstract
Targeting mutated oncogenes is an effective approach for treating cancer. The 4 main driver genes of pancreatic ductal adenocarcinoma (PDAC) are KRAS, TP53, CDKN2A, and SMAD4, collectively called the “big 4” of PDAC, however they remain challenging therapeutic targets. In this study, ArfGAP with SH3 domain, ankyrin repeat and PH domain 2 (ASAP2), one of the ArfGAP family, was identified as a novel driver gene in PDAC. Clinical analysis with PDAC datasets showed that ASAP2 was overexpressed in PDAC cells based on increased DNA copy numbers, and high ASAP2 expression contributed to a poor prognosis in PDAC. The biological roles of ASAP2 were investigated using ASAP2‐knockout PDAC cells generated with CRISPR‐Cas9 technology or transfected PDAC cells. In vitro and in vivo analyses showed that ASAP2 promoted tumor growth by facilitating cell cycle progression through phosphorylation of epidermal growth factor receptor (EGFR). A repositioned drug targeting the ASAP2 pathway was identified using a bioinformatics approach. The gene perturbation correlation method showed that niclosamide, an antiparasitic drug, suppressed PDAC growth by inhibition of ASAP2 expression. These data show that ASAP2 is a novel druggable driver gene that activates the EGFR signaling pathway. Furthermore, niclosamide was identified as a repositioned therapeutic agent for PDAC possibly targeting ASAP2.
Keywords: ASAP2, driver gene, drug repositioning, niclosamide, pancreatic cancer
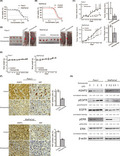
In this study, we identified ArfGAP with SH3 domain, ankyrin repeat and PH domain 2 (ASAP2) as a potentially druggable driver gene using bioinformatics analysis in pancreatic ductal adenocarcinoma (PDAC), which is one of the most lethal cancers worldwide. Then, we showed that ASAP2 promoted cell migration and proliferation by facilitating cell cycle progression through phosphorylation of EGFR. Finally, we identified niclosamide, an antiparasitic drug, as a repositioned therapeutic agent for PDAC, possibly targeting ASAP2.
1. INTRODUCTION
Pancreatic ductal adenocarcinoma (PDAC) is one of the most lethal cancers worldwide, with a 5‐y survival rate of 9%. 1 Genomic analyses of PDAC revealed that 4 common driver genes (KRAS, TP53, CDKN2A, and SMAD4), called the “big 4,” are mutated with high frequencies, and many other genes are altered at lower frequencies, including potential clinical targets. Activating mutations in KRAS that occur early in tumorigenesis are observed frequently, and tend to be followed by inactivating mutations of CDKN2A, TP53, and SMAD4 at late stages. 2 , 3 , 4 TP53 and SMAD4 mutations have been shown to be associated with widespread metastatic disease. 5 However, all these mutations cannot currently be targeted by available agents and are responsible for poor prognosis in PDAC patients. 6 , 7 To address this issue, it is imperative to identify novel therapeutic targets for patients with PDAC.
Recent pan‐cancer genomic database analyses uncovered a positive correlation between the frequency of chromosomal gains and density of potential oncogenes, suggesting that chromosomal amplification is a strong driving force during cancer development. 8 Mutational phenomena, such as chromothripsis and polyploidization, have been linked to tumor instability 9 , 10 and aggressive tumor behavior, 11 indicating that they play a role in PDAC development. 12 DNA copy number gains are crucial for transformation from the preneoplastic phase to invasive disease and are sustained early during tumorigenesis in PDAC. 12 Furthermore, our multiregional genomic analysis of colorectal cancer (CRC) showed that amplification of chromosome 7 occurs in all regions of an individual tumor, 13 , 14 , 15 indicating that these amplifications are fundamental and predominant events in CRC tumorigenesis, and that these chromosomes harbor driver genes that are overexpressed due to chromosome amplification. 16
Based on insight from previous findings and our multiregional genomic analysis, we have identified novel oncogenes, including elF5‐mimic protein 1 (5MP1), DEAD‐Box Helicase 56 (DDX56), and general transcription factor 2I repeat domain‐containing protein 1 (GTF2IRD1), located on amplified chromosome 7 in CRC. 17 , 18 , 19 Therefore, we focused on genes that were overexpressed due to gene amplification as potential therapeutic targets in PDAC, because these genes can be targeted with gene‐specific medicines, including neutralizing antibodies or small chemicals.
In this study, we identified ArfGAP with SH3 domain, ankyrin repeat and PH domain 2 (ASAP2), a member of the ArfGAP family, as a novel driver gene in PDAC. Next, we examined the biological role and mechanism of ASAP2 in PDAC progression in vitro and in vivo by knocking out or stably overexpressing ASAP2 in PDAC cells. Furthermore, using the gene perturbation correlation (GPC) method, we identified niclosamide, an anthelmintic drug, as a repositioned therapeutic agent for PDAC targeting ASAP2.
2. MATERIALS AND METHODS
2.1. Selection of candidate genes
Using The Cancer Genome Atlas (TCGA), GSE15471, and GSE28735 datasets, we extracted candidate genes that satisfied the following 2 criteria, as described previously 18 , 19 : (a) DNA copy number and mRNA expression levels were positively correlated with each other (correlation coefficient cut‐off set at .5); and (b) the gene of interest was significantly overexpressed in tumor tissues compared with normal tissues. Genes selected using this strategy were found to be candidate driver genes in PDAC, accompanied by DNA amplification.
2.2. Cell lines and cell culture
Human PDAC cell lines Panc1 and MiaPaCa2 were purchased from RIKEN BioResource Center in 2018. Both cell lines were cultured in appropriate medium supplemented with 10% fetal bovine serum (FBS) in a humidified atmosphere containing 5% CO2 at 37°C.
2.3. RNA extraction and reverse transcription‐quantitative polymerase chain reaction (RT‐qPCR)
Total RNA from cell lines was extracted using the ISOGEN‐II kit (Nippon Gene). RT was performed, and qPCR was carried out as previously described. 20 Expression levels of ASAP2 mRNA were normalized to the expression level of GAPDH mRNA as an internal control. Primer sequences for qPCR were as follows: ASAP2, forward 5′‐AATAAGCGGAGCGGAAATTGC‐3′ and reverse 5′‐GTTTCAATGGAAGGTTTGAGGC‐3′; and GAPDH, forward 5′‐AGCCACATCGCTCAGACAC‐3′ and reverse 5′‐GCCCAATACGACCAAATCC‐3′.
2.4. Immunohistochemical staining
Immunohistochemical analysis of 6 cases of PDAC tissues that were surgically removed and tissue specimens from a xenograft mouse model was performed as previously described. 21 Anti‐ASAP2 and anti‐Ki67 primary antibodies were used at dilutions of 1:200 and 1:10 000, respectively, and were purchased from Abcam. Anti‐phospho‐EGFR and anti‐phospho‐ERK1/2 primary antibodies were used at dilutions of 1:1000 and 1:100, respectively, and were purchased from Cell Signaling Technology. Histological analysis was independently performed by experienced research pathologists at Kyushu University (AF and TT).
2.5. Protein extraction and immunoblotting
Cells were lysed in RIPA buffer. Western blot analysis was performed as previously described. 22 The blot was probed with primary antibodies against ASAP2 (Santa Cruz Biotechnology), EGFR, phospho‐EGFR, ERK1/2, phospho‐ERK1/2 (Cell Signaling Technology), and β‐actin antibody (Santa Cruz Biotechnology).
2.6. Generation of ASAP2 knockout PDAC cells
ASAP2 knockout Panc1 cells and MiaPaCa2 cells were generated using the All‐in‐One CRISPR‐Cas9D10A nickase‐based system, as described previously. 23 , 24 Specific guide RNAs targeting different regions of the human ASAP2 gene were designed by the online tool CRISPRdirect (http://crispr.dbcls.jp/) and cloned into the All‐in‐One CRISPR‐Cas9 vector (Addgene). GFP‐labeled Cas9 nickase was transfected using Lipofectamine 3000 reagent (Thermo Fisher Scientific) in accordance with the manufacturer's instructions. GFP‐positive cells were sorted 48 h after transfection. Single‐cell cloning was performed to obtain different monoclonal cell populations. Correctly targeted DNA clones were identified using PCR. Primers used for PCR were as follows: forward 5′‐CGGCCGTTTATCTTGTGCTC‐3′ and reverse 5′‐CACCTAGGCGGGAACAAAGG‐3′. Furthermore, cells were validated as ASAP2 knockout clones using western blot and Sanger sequencing.
2.7. Generation of MiaPaCa2 cells stably overexpressing ASAP2
The full‐length cDNA of human ASAP2 was amplified using PCR and subcloned into the plasmid pcDNA3.3 (Invitrogen). The insertion and orientation of the fragment were confirmed using sequence analysis. Cells were transfected with plasmids using Lipofectamine 3000 reagent (Thermo Fisher Scientific) in accordance with the manufacturer's instructions. Control cells were generated by transfecting cells with an empty vector. Cells were subjected to selection for stable integrants 48 h after transfection by exposure for 2 wk to 1000 μg/mL geneticin (Gibco) in complete medium containing 10% FBS. Cells were then assessed for the overexpression of ASAP2 using PCR and western blot analysis.
2.8. MTT assay
Cell proliferation was evaluated using MTT assay (Roche Applied Science) in accordance with the manufacturer's instructions. In brief, 20 000 cells/well were seeded in triplicate onto 24‐well plates in 1000 μL medium. The color reaction was quantitated as previously described. 18
2.9. Colony formation assay
For knockout studies and overexpression studies, cells were plated at a density of 1000 cells/well in triplicate onto 6‐well plates. For siRNA‐mediated ASAP2 knockdown studies, cells were plated at a density of 1000 cells/well onto 6‐well plates and transfected with siASAP2 or negative‐control siRNA in triplicate. After 10 d, colonies were stained, and visible colonies were photographed and counted as previously described. 18
2.10. Flow cytometry and cell cycle assay
Cells were synchronized at the G1 phase of the cell cycle by serum starvation for 48 h and re‐stimulated by changing medium containing 10% FBS, as described previously. 17 Cells were harvested, washed with PBS twice, and fixed in 70% ethanol at −20°C. Fixed cells were incubated in 0.25 mg/mL RNase for 10 min at 37°C. Subsequently, cells were washed with PBS and stained with propidium iodide (Sigma‐Aldrich). Cell cycle distribution was measured using a SH800 cell sorter (Sony Biotechnology).
2.11. Wound healing assay
For knockout and overexpression studies, cells were plated on 6‐well plates at a density of 3 × 10⁵/well. After cells grew to 80%‐90% confluency, vertical scratches were generated in the cell layer using 1000 μL pipette tips. For siRNA‐mediated ASAP2 knockdown studies, cells were plated on 6‐well plates at a density of 3 × 10⁵ cells/well. After cells grew to 80%‐90% confluency, vertical scratches were generated in the cell layer using 1000 μL pipette tips. Cells were then transfected with siASAP2 or negative‐control siRNA in triplicate. Photographs of the wound area were taken at 0, 24, and 48 h after scratching to calculate the cell migration rate.
2.12. Treatment with niclosamide
Niclosamide (2′,5‐dichloro‐4′‐nitrosalicylanilide) was obtained from Sigma‐Aldrich and solubilized in DMSO for in vitro application. For in vivo application, niclosamide was administered in a solution containing 10% Cremophor EL (Nacalai Tesque) and 0.9% NaCl solution. Control mice were treated with the appropriate volume of solvent solution (10% Cremophor EL and 0.9% NaCl).
2.13. Cytotoxicity assay
MTT assays were used to evaluate the cytotoxic effect of niclosamide. Cells were plated at a density of 6 × 10⁴ cells/well onto 24‐well plates and allowed to attach for 10 h. Cells were treated with niclosamide at concentrations ranging from 0 to 10 μmol/L for 48 h. Color reactions were then quantitated.
2.14. Murine xenograft model
All animal procedures were performed in compliance with the Guidelines for the Care and Use of Experimental Animals established by the Committee for Animal Experimentation of Kyushu University. Murine xenograft model analysis was conducted as described previously. 17 Five‐wk‐old female BALB/cSlc nu/nu mice were purchased from Japan SLC, Inc and maintained under specific pathogen‐free conditions. For subcutaneous xenograft assays, 1 × 10⁶ ASAP2 knockout Panc1 and MiaPaCa2 cells, MiaPaCa2 cells stably overexpressing ASAP2, or control cells were suspended in 100 μL 50% Matrigel (Corning) in PBS and subcutaneously injected bilaterally into nude mice. To assay the effects of treatment with the compounds identified, 1 × 10⁶ Panc1 and MiaPaCa2 cells were suspended in 100 μL 50% Matrigel (Corning) in PBS, and injected subcutaneously into the left flanks of mice. There were 4 mice in each group. After visual detection of tumors, niclosamide was administered intraperitoneally at 25 mg/kg daily for 3 wk in MiaPaCa2 xenografts and 4 wk in Panc1 xenografts. Weights of mice and tumor sizes were measured twice a week. Tumor volume was calculated using the formula: length × width2 × 0.5.
2.15. Statistical analysis
Associations between variables were assessed using the Mann‐Whitney U test, Student t test, or Fisher exact test. The degree of linearity was estimated by Pearson correlation coefficient. For survival analysis, cases were divided into 2 groups as having higher or lower ASAP2 expression levels compared with the median. Overall survival (OS) and recurrence‐free survival (RFS) were estimated using the Kaplan‐Meier method, and survival curves were compared using the log‐rank test. The value P < .05 was considered significant. Data analyses were performed using R software version 3.5.1 (The R Foundation). Other experimental procedures are described in Appendix S1.
3. RESULTS
3.1. ASAP2 is a candidate driver gene in PDAC
ASAP2 was selected as a candidate driver gene using TCGA, GSE15471, and GSE28735 datasets through the screening method described in the Materials and Methods section. ASAP2, a member of the ArfGAP family, exhibits strong GTPase‐activating protein activity toward the small GTPases Arf1 and Arf5 and weak activity toward Arf6. 25 , 26 The gene is located on chromosome 2, which was found to be amplified in PDAC (Figure 1A). ASAP2 mRNA expression levels were elevated in PDAC tissues in TCGA, GSE15471 and GSE28735 datasets (Figure 1B), and immunohistochemical staining revealed that ASAP2 was localized in the cytoplasm and cell membrane of tumor cells, but weak staining in normal pancreatic duct epithelial cells (Figure 1C), suggesting that ASAP2 was significantly highly expressed in PDAC cells. Amplification of ASAP2 DNA copy number was observed in 72.3% (133/184) of PDAC tissues and 72.7% (32/44) of PDAC cell lines in TCGA and the Cancer Cell Line Encyclopedia (CCLE) datasets, respectively (Figure 1D,E). However, only 0.57% of ASAP2 gene changes with missense mutations were detected in TCGA dataset (Figure 1F). Moreover, ASAP2 mRNA expression was positively correlated with ASAP2 DNA copy number in both datasets (P < .001 [TCGA] and P < .05 [CCLE]; Figure 1D). These observations indicated that ASAP2 was overexpressed in tumor cells due to increased DNA copy numbers in PDAC. Furthermore, patients with high ASAP2 mRNA expression had lower OS and RFS compared with patients with low expression in TCGA dataset (Figure 1G). Finally, Gene Set Enrichment Analysis (GSEA) of TCGA dataset showed that ASAP2 expression was positively correlated with cell cycle pathways (Figure 1H). These results suggested that ASAP2 is a candidate driver gene that could be associated with cell cycle progression induced by genomic amplification in PDAC.
FIGURE 1.
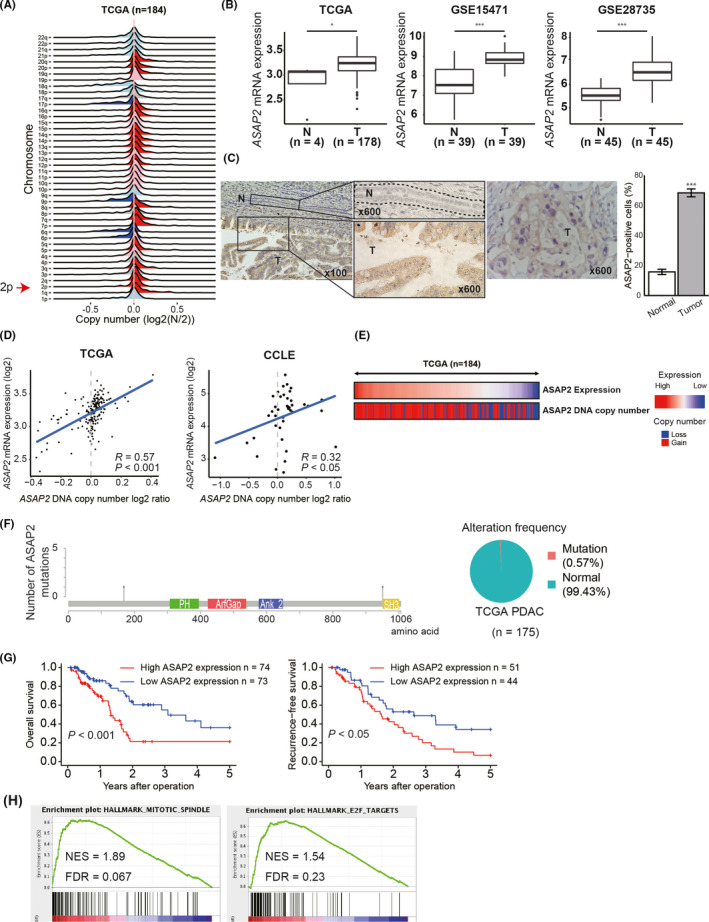
Clinical significance of ASAP2 expression in PDAC. A, DNA copy number variations according to chromosome arm in 184 PDAC tissues from TCGA dataset. B, ASAP2 mRNA expression in PDAC and normal pancreatic tissues in TCGA GSE15471 and GSE28735 datasets. T: tumor tissue, N: normal tissue. C, Immunohistochemical staining for ASAP2 in PDAC tissues and normal tissues that were surgically removed (n = 6). The cells surrounded by the dotted line are normal pancreatic duct epithelial cells. Bar graph represents the percentage of ASAP2‐positive cells in normal and tumor tissues. T: tumor tissue, N: normal tissue. D, Correlation between mRNA expression and DNA copy number of ASAP2 in TCGA and CCLE datasets. R is the Pearson correlation coefficient. E, An integrated view of mRNA expression of ASAP2 and DNA copy number of ASAP2 in 184 PDAC cases from TCGA. Samples are sorted according to ASAP2 mRNA expression level. F, Positions and frequencies of mutations in ASAP2 among PDAC cases in TCGA dataset. Mutation was only observed in 1 case, for a frequency of 0.57%. G, Kaplan‐Meier OS and RFS curves of patients with PDAC according to ASAP2 mRNA expression in TCGA dataset. H, GSEA using TCGA dataset
3.2. Pathway analysis of ASAP2 in PDAC
To investigate the impact of ASAP2 on PDAC, we knocked out ASAP2 in PDAC cell lines (Panc1 and MiaPaCa2) using CRISPR‐Cas9 technology. To explore the possible oncogenic pathways modulated by ASAP2 expression, RNA‐seq was conducted using ASAP2 knockout PDAC cell lines (Panc1 and MiaPaCa2). From this analysis, 2793 genes were significantly upregulated, and 2748 genes were significantly downregulated in ASAP2 knockout Panc1 cells compared with wild‐type Panc1 cells (q‐value < .01; Figure 2A). Furthermore, 617 genes were significantly upregulated, and 1005 genes were significantly downregulated in ASAP2 knockout MiaPaCa2 cells compared with wild‐type MiaPaCa2 cells (q‐value < .01; Figure 2A). Gene Ontology (GO) analysis revealed that genes downregulated by ASAP2 knockout were highly enriched for GO terms associated with cell cycle, cytoskeleton, and cell migration both in Panc1 and MiaPaCa2 cells (Figure 2B). We next performed GSEA to identify significant changes in ASAP2 knockout cells, and observed the downregulation of many genes involved in cell cycle‐related pathways (Figure 2C). These data suggest that ASAP2 expression was associated with cell cycle progression and migration in PDAC cells.
FIGURE 2.
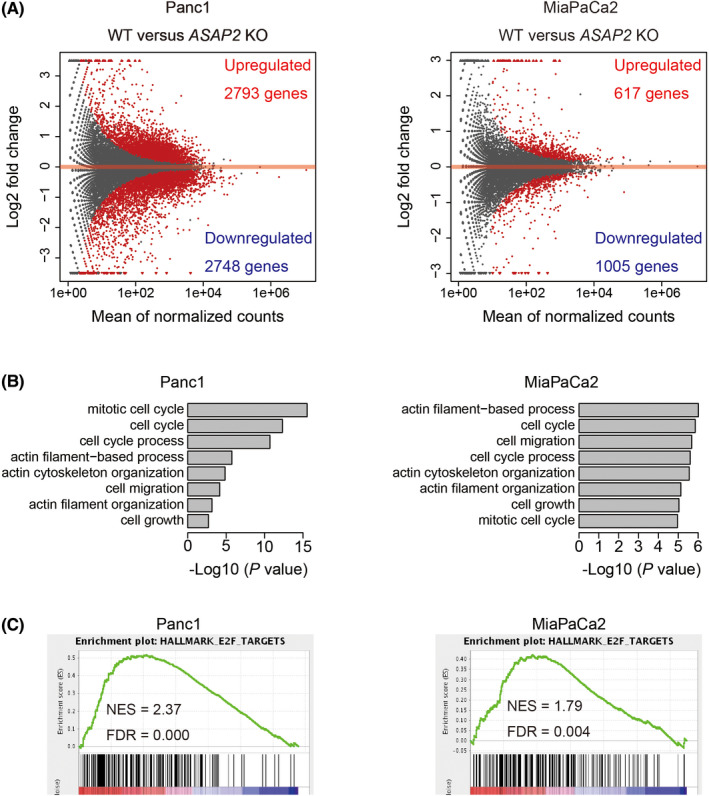
RNA sequencing of ASAP2 knockout cells and wild‐type cells. A, MA plot of differentially expressed genes (DEGs) comparing wild‐type and ASAP2 knockout Panc1 and MiaPaCa2 cells. DEGs are represented as red dots. B, GO analysis of significantly upregulated genes in wild‐type cells. C, GSEA plots for selected hallmark gene sets
3.3. ASAP2 facilitates cell cycle progression of PDAC cells
Based on pathway analysis (Figures 1H and 2A‐C), we hypothesized that ASAP2 could promote tumor growth by facilitating cell cycle progression. Genotyping using direct sequencing and RT‐PCR were performed to confirm that we knocked out ASAP2 in PDAC cell lines (Figure 3A). In addition, we were able to completely abolish ASAP2 expression in these cells (Figure 3A).
FIGURE 3.
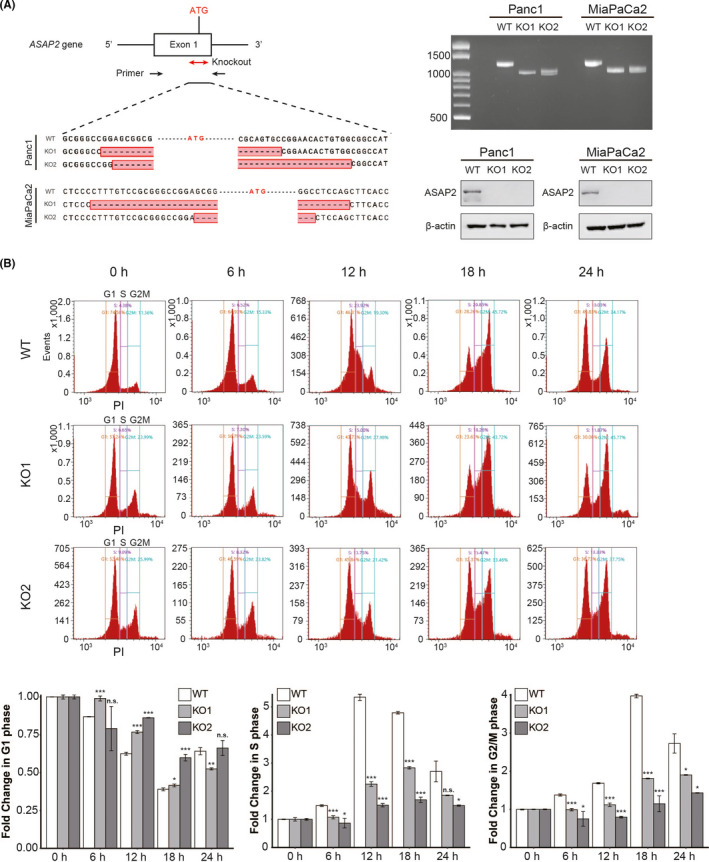
ASAP2 promotes cell cycle progression. A, Direct sequencing analysis confirmed successful genome editing of ASAP2 exon 1. Approximately 200 nucleotides, including the initiator codon, were deleted (left). RT‐PCR of gene‐targeted ASAP2. WT: 1220 bp, KO: approximately 1000 bp (top right). ASAP2 western blot analysis in ASAP2 knockout cells and wild‐type cells (bottom right). B, Knockout of ASAP2 suspends cell cycle progression of PDAC cells. Cell cycle assay after refeeding of FBS using flow cytometry in wild‐type cells and ASAP2 knockout cells. n.s. not significant; (*) P < .05; (**) P < .01; (***) P < .001
Then, we conducted cell cycle analysis of ASAP2 knockout MiaPaCa2 cells using flow cytometry. We observed that wild‐type cells had a significantly higher proportion of cells in S‐phase and G2/M‐phase compared with ASAP2 knockout cells at 12 h after re‐stimulation by exchanging medium containing 10% FBS (Figure 3B). Conversely, wild‐type cells had a significantly lower proportion of cells in G1‐phase compared with ASAP2 knockout cells at 12 h (Figure 3B). These data suggested that ASAP2 promotes the G1/S transition of the cell cycle.
3.4. ASAP2 promotes PDAC tumor growth in vitro and in vivo
MTT assays demonstrated that ASAP2 knockout significantly suppressed cell proliferation in both Panc1 and MiaPaCa2 cells (Figure 4A). Colony formation assays showed that ASAP2 knockout significantly reduced colony formation in both Panc1 and MiaPaCa2 cells (Figure 4B). Similarly, ASAP2 knockdown by siRNA in Panc1 and MiaPaCa2 cells also showed decreased proliferative ability (Figure S1A,B).
FIGURE 4.
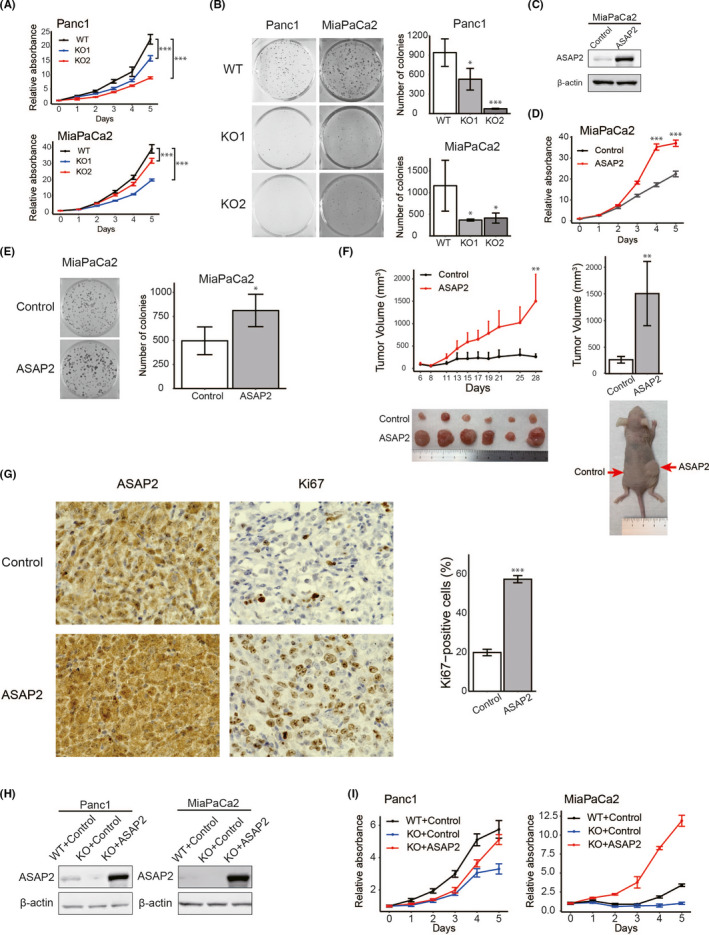
ASAP2 is associated with growth of PDAC cells. A, MTT assays using ASAP2 knockout Panc1 and MiaPaCa2 cells. (***) P < .001. B, Colony formation assays using ASAP2 knockout Panc1 and MiaPaCa2 cells. (*) P < .05; (***) P < .001. C, ASAP2 protein expression was assessed by western blot analysis of MiaPaCa2 cells stably overexpressing ASAP2 and control cells. D, MTT assay using MiaPaCa2 cells stably overexpressing ASAP2. (***) P < .001. E, Colony formation assay using MiaPaCa2 cells stably overexpressing ASAP2. (*) P < .05. F, In vivo analysis using a tumor xenograft model. The growth curve of xenograft tumors from MiaPaCa2 cells stably overexpressing ASAP2 (n = 6) and control cells (n = 6) (left). Bar graphs represent the tumor volume, respectively (right). (**) P < .01. G, Immunohistochemical staining for ASAP2 and Ki67 in tumor tissues from control cells and MiaPaCa2 cells stably overexpressing ASAP2 (left). Bar graphs represent the percentage of Ki67‐positive cells in tumor tissues from MiaPaCa2 cells stably overexpressing ASAP2 (n = 6) and control tumor tissues (n = 6) (right). Original magnification, ×600. (***) P < .001. H, ASAP2 protein levels in the indicated cells. ASAP2 protein expression using western blot analysis in these rescued cells. I, MTT assay using indicated cells
Next, we attempted to construct MiaPaCa2 and Panc1 cells that stably overexpressed ASAP2 (Figures 4C and S1C). However, we could not establish Panc1 cells stably overexpressing ASAP2. Therefore, we used only MiaPaCa2 cells stably overexpressing ASAP2 for subsequent experiments. As expected, ASAP2 overexpression significantly increased cell proliferation in vitro (Figure 4D,E). Additionally, ASAP2 overexpression significantly increased PDAC tumor volumes in xenograft mice models (Figure 4F). Immunohistochemical analysis of tumor xenografts revealed that tumor tissues from MiaPaCa2 cells stably overexpressing ASAP2 displayed stronger ASAP2 and Ki67 staining compared with control (n = 6) (Figure 4G). Immunohistochemical staining for Ki67 indicated significantly enhanced proliferation in tumors from MiaPaCa2 cells stably overexpressing ASAP2 (Figure 4G). Conversely, ASAP2 knockout Panc1 and MiaPaCa2 cells did not engraft in mice, although control cells engrafted in mice (Figure S1D).
Finally, ASAP2 knockout cells were transiently transfected with a vector expressing ASAP2 to rescue ASAP2; western blot analysis confirmed that ASAP2 expression was rescued in ASAP2 knockout Panc1 and MiaPaCa2 cells (Figure 4H). Rescue of ASAP2 expression in ASAP2 knockout cells also restored the proliferative capacity of these cells (Figure 4I).
Taken together, these results indicated that ASAP2 could promote PDAC tumor growth in vitro and in vivo.
3.5. ASAP2 promotes cell migration of PDAC cells
PDAC has a high metastasis rate, which is thought to be due to its high migration ability. 27 Furthermore, based on the results of pathway analysis (Figure 2B), we hypothesized that ASAP2 could promote the migratory ability of PDAC cells. Therefore, we examined the relationship between the motility of PDAC cells and ASAP2. To evaluate the potential role of ASAP2 on the migratory capacity of PDAC cells, wound healing assays were performed. ASAP2 knockout Panc1 and MiaPaCa2 cells had a significantly lower migration rates compared with their respective control cells (Figure 5A). Similarly, ASAP2 knockdown by siRNA in MiaPaCa2 cells also decreased migration ability (Figure S2). Furthermore, MiaPaCa2 cells stably overexpressing ASAP2 showed significantly increased migration (Figure 5B). These findings indicated that ASAP2 contributes to the migratory ability of PDAC cells.
FIGURE 5.
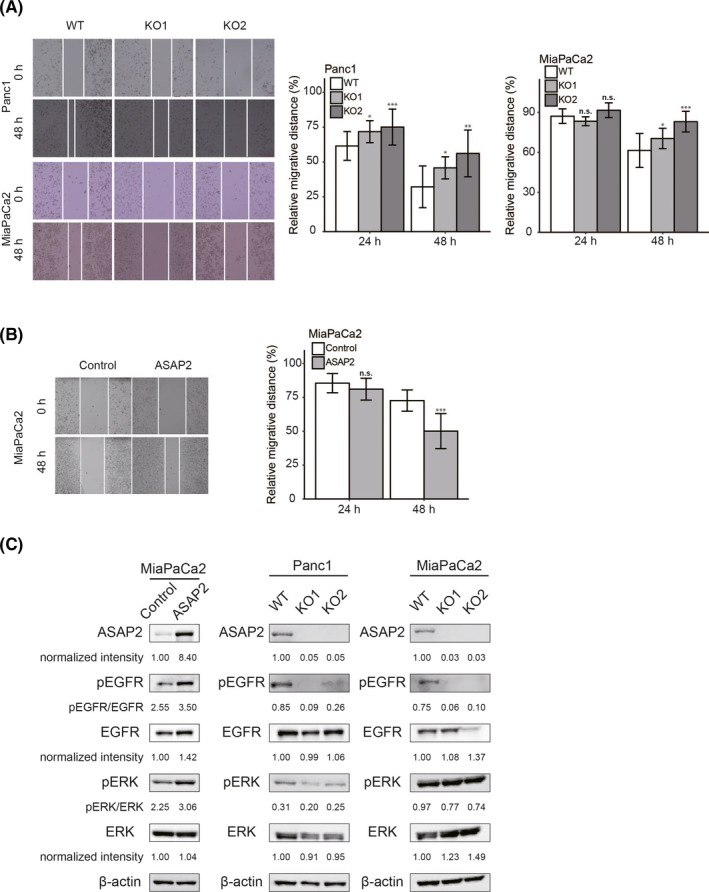
ASAP2 promotes cell migration and positively regulates the EGFR/ERK signaling pathway in PDAC cells. A, Wound healing assays using ASAP2 knockout Panc1 and MiaPaCa2 cells. The migrated distance was quantified by measuring the difference at 0, 24, and 48 h and was normalized to 0 h. n.s. not significant; (*) P < .05; (**) P < .01; (***) P < .001. B, Wound healing assays using MiaPaCa2 cells stably overexpressing ASAP2. The migration distance was quantified by measuring the difference at 0, 24, and 48 h and was normalized to 0 h. n.s. not significant; (***) P < .001. C, ASAP2 overexpressing or control MiaPaCa2 cells and ASAP2 knockout or wild‐type Panc1 and MiaPaCa2 cells were analyzed for levels of phosphorylated or total EGFR and ERK using western blotting. β‐Actin was used as the loading control for relative protein quantification. The normalized intensities of each protein and ratios of pEGFR/EGFR and pERK/ERK are shown
3.6. ASAP2 upregulates the EGFR/ERK signaling pathway
ASAP2 has been reported to form a complex with Pyk2 and Src. 25 Furthermore, the Src/Pyk2 complex associates with and activates EGFR and subsequently the ERK phosphorylation cascade. 28 Therefore, we hypothesized that ASAP2 may promote cell proliferation, cell cycle progression, and cell migratory ability by activating the EGFR/ERK signaling pathway in PDAC cells. We performed western blotting experiments to investigate whether ASAP2 could activate the EGFR/ERK signaling pathway in PDAC. MiaPaCa2 cells stably overexpressing ASAP2 showed increased phosphorylation levels of EGFR and ERK compared with control cells (Figure 5C). In contrast, ASAP2 knockout Panc1 and MiaPaCa2 cells showed decreased ratios of pEGFR/EGFR and pERK/ERK (Figure 5C). These results suggested that ASAP2 facilitates tumor growth and migration potential, possibly through activation of the EGFR/ERK signaling pathway in PDAC cells.
3.7. Prediction of potential inhibitors of ASAP2 by a bioinformatics approach using the GPC method
We attempted to identify inhibitors of ASAP2 by a drug repositioning approach, a method for identifying new indications for existing approved drugs that can decrease the time and cost of development compared with traditional new drug discovery approaches. 29 , 30 , 31 This has become a powerful strategy for developing anticancer agents. 32 Here, we employed the GPC method to comprehensively predict novel drug candidates based on chemically and genetically perturbed gene expression data. 33 We evaluated 4 types of transcriptional correlations between chemically perturbed signatures and genetically perturbed signatures. As a result of chemically perturbed signatures and ASAP2 knockout signatures being positively correlated and chemically perturbed signatures and ASAP2 overexpression signatures being inversely correlated, candidate drugs were identified (Figure 6A,B). Among them, niclosamide is reported to have had an antitumor effect in various cancers. 34 , 35 , 36 , 37 Therefore, we performed the experiments described below to evaluate the antitumor effects resulting from targeting ASAP2 in PDAC.
FIGURE 6.
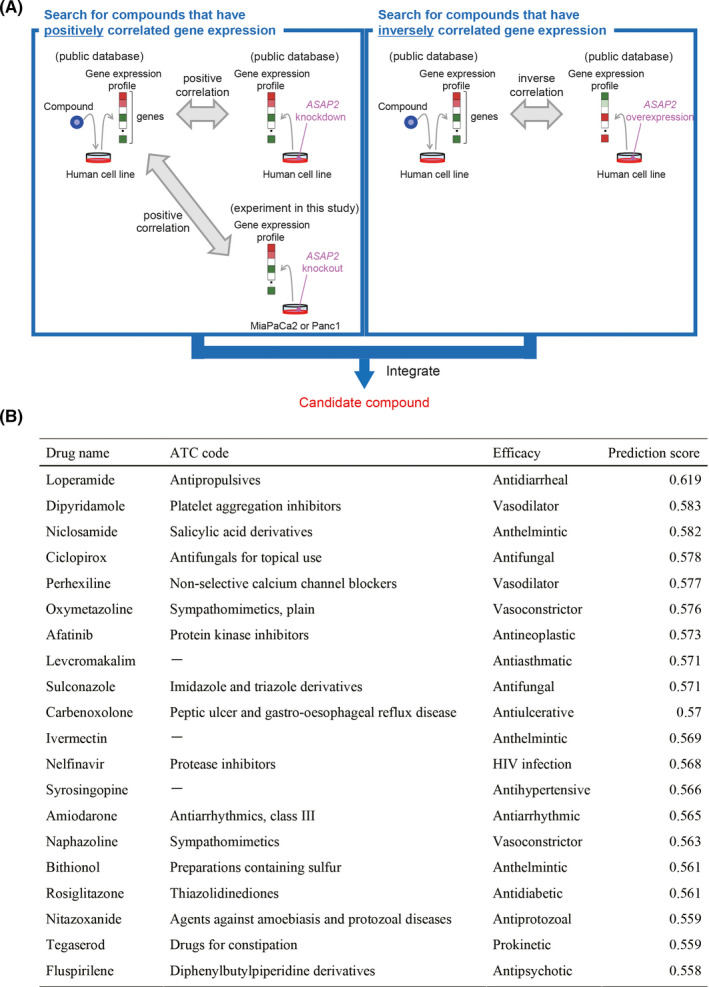
Prediction of potential ASAP2 inhibitors. A, B, Niclosamide was identified as a compound for which the gene expression profiles induced by compound administration and ASAP2 knockout were correlated and the gene expression profiles induced by compound administration and ASAP2 overexpression were inversely correlated
3.8. Niclosamide suppresses PDAC growth in vitro and in vivo
To examine whether niclosamide suppresses the proliferation of PDAC cells, Panc1 and MiaPaCa2 cells were treated with varying concentrations of niclosamide for 48 h. The IC50 value of niclosamide was 1.30 μmol/L in Panc1 cells and 1.62 μmol/L in MiaPaCa2 cells (Figure 7A). As shown in Figure 7B, the IC50 value of niclosamide was 1.28 μmol/L in MiaPaCa2 cells stably overexpressing ASAP2 and 1.70 μmol/L in control cells. MiaPaCa2 cells stably overexpressing ASAP2 were more sensitive to niclosamide compared with control cells. These results demonstrated that overexpression of ASAP2 conferred sensitivity to niclosamide in PDAC cells.
FIGURE 7.
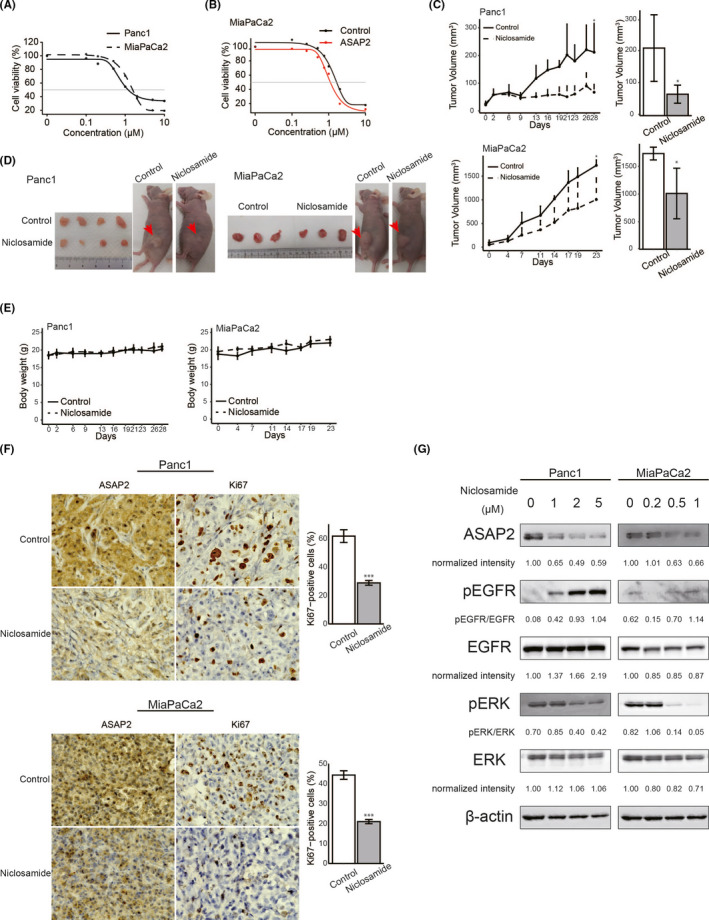
Niclosamide inhibited the growth of PDAC cells in vitro and in vivo. A, B, Sensitivity of PDAC cells to niclosamide. Cell viability was measured using MTT assays in PDAC cells treated with the indicated concentrations of niclosamide for 48 h. A, MTT assay using Panc1 and MiaPaCa2 cells. B, MTT assay using MiaPaCa2 cells stably overexpressing ASAP2 and control cells. C, Panc1 and MiaPaCa2 tumor growth in control (n = 4) and niclosamide‐treated mice (n = 4). Bar graphs represent the tumor volume, respectively. (*) P < .05. D, Subcutaneous tumors from control and niclosamide‐treated mice. E, Body weights of control and niclosamide‐treated mice during the entire experimental period. F, Immunohistochemical staining for ASAP2 and Ki67 in tumor tissues from control and niclosamide‐treated mice. Bar graphs represent the percentage of Ki67‐positive cells in tumor tissues from control (n = 4) and niclosamide‐treated mice (n = 4). Original magnification, ×600. (***) P < .001. G, Panc1 and MiaPaCa2 cells treated with the indicated concentrations of niclosamide for 48 h were analyzed to determine the levels of phosphorylated or total ERK and the expression of ASAP2 using western blotting. β‐Actin was used as the loading control for relative protein quantification. The normalized intensities of each protein and ratios of pEGFR/EGFR and pERK/ERK are shown
Next, to investigate the antitumor activity of niclosamide in vivo, PDAC xenografts were generated using Panc1 cells and MiaPaCa2 cells. Then, mice bearing Panc1 and MiaPaCa2 PDAC xenografts were treated with niclosamide (25 mg/kg/d). Niclosamide treatment reduced tumor growth in test mice compared with controls in Panc1 and MiaPaCa2 xenograft models (Figure 7C). Macroscopically, niclosamide‐treated tumors were smaller compared with control tumors (Figure 7D). In addition, the body weights of mice from the niclosamide‐treated group were similar to those of control mice during the entire treatment period (Figure 7E). Finally, immunohistochemical analysis of xenograft tumor tissues showed that niclosamide‐treated xenografts displayed weaker ASAP2 expression compared with control mice (Figure 7F). Furthermore, the proportion of Ki67‐positive cells was significantly lower in tumor tissue from niclosamide‐treated mice than in tumor tissue from control mice (Figure 7F).
Finally, western blotting experiments were performed to examine whether niclosamide inhibits ASAP2 activation. Niclosamide reduced the expression of ASAP2 and ratios of pERK/ERK in Panc1 cells and MiaPaCa2 cells in a dose‐dependent manner (Figure 7G). Unexpectedly, niclosamide increased the phosphorylation of EGFR in Panc1 and MiaPaCa2 cells (Figure 7G). Furthermore, immunohistochemical analysis of xenograft tumor tissues showed that niclosamide‐treated xenografts displayed weaker pERK and stronger pEGFR expression compared with control mice (Figure S3).
Taken together, these findings showed that niclosamide efficiently attenuated tumor growth, suggesting that inhibition of phosphorylation of ERK with niclosamide may be a potential therapeutic strategy for PDAC treatment.
4. DISCUSSION
In this study, we identified ASAP2 as a novel driver gene that can activate migration and proliferation in PDAC, possibly by activation of the EGFR/ERK signaling pathway. Furthermore, we found that niclosamide could be repositioned as a novel drug for the treatment of PDAC through its effects on inhibition of ASAP2 expression. To the best of our knowledge, this is the first study to explore the oncogenic function of ASAP2 and its potential as a novel therapeutic target in PDAC.
ASAP2, a member of the ArfGAP family, activates small GTPases 26 and binds to Pyk2 and Src via its SH3 domain. 25 The Src/Pyk2 complex activates the EGFR/ERK signaling pathway, 28 which plays crucial roles in G1/S‐phase transition, 38 cancer cell proliferation, 39 and regulation of the actin cytoskeleton, 40 contributing to the hypothesis that ASAP2 promotes cell proliferation and cell migratory ability by regulation of the dynamin‐actin cytoskeleton activated by the EGFR/ERK signaling pathway. Indeed, we demonstrated that ASAP2 could facilitate tumor growth and cell migration, possibly through the phosphorylation of EGFR, by knocking out and stably overexpressing ASAP2 in PDAC cells. Moreover, erlotinib, an inhibitor of EGFR, inhibits the growth of PDAC cells. 41 Therefore, the ASAP2/EGFR axis may be a crucial pathway for PDAC progression.
Although a previous study demonstrated that changes in the “big 4” genes are associated with PDAC patient outcomes, 7 none of these are currently druggable targets, because RAS proteins bind very tightly to GDP/GTP, making it difficult to identify competitive analogs, 42 and TP53 restoration leads to incomplete tumor regression due to the stage‐heterogeneity of tumor cell populations. 43 Of note, ASAP2 is amplified and overexpressed in 72.3% of PDAC cases, and PDAC patients with high expression of ASAP2 experience a significantly poorer prognosis compared with patients without ASAP2 overexpression. These findings suggested that ASAP2 is a ubiquitous driver gene and could be a promising therapeutic target in PDAC.
Here, we identified niclosamide, an anthelmintic drug, as an inhibitor of ASAP2 by a bioinformatics approach using the GPC method, which is based on identification of genes with expression levels that are inversely correlated in the context of disease and drug treatment. 44 , 45 Niclosamide is an FDA‐approved drug that has been used for treating various tapeworm infections in humans. Recently, niclosamide has been recognized as an antitumor agent for various cancers, 34 , 35 , 36 , 37 and has been reported to inhibit the STAT3, 46 Wnt, 47 Notch, 48 and RAS 49 signaling pathways associated with cell proliferation. Moreover, niclosamide can inhibit cancer stemness. 37 However, the effect of niclosamide on PDAC has not been studied. We demonstrated that niclosamide had significant antitumor effects on PDAC cells in vitro and in vivo by inhibition of ASAP2 and phosphorylation of ERK in a dose‐dependent manner. Unexpectedly, niclosamide led to an increase in phospho‐EGFR, implying that niclosamide directly suppresses ERK phosphorylation, and its negative feedback enhances EGFR phosphorylation. Furthermore, these results suggested that niclosamide may suppress the expression of ASAP2 and phosphorylation of ERK, respectively. However, the mechanism underlying niclosamide‐mediated suppression of ASAP2 and phosphorylation of ERK is unclear. Further experiments are required to clarify this. In addition, our experimental data suggested that niclosamide is more effective against cells highly expressing ASAP2 compared with cells weakly expressing ASAP2, and that ASAP2 was weakly expressed in normal pancreatic duct epithelial cells. Furthermore, previous reports reported that niclosamide did not exert a significant effect against proliferation in normal cells. 37 , 47 Taken together, it is considered that niclosamide has low toxicity to normal pancreatic duct epithelial cells under the adequate concentration of niclosamide.
In conclusion, we identified a novel druggable driver gene, ASAP2, that showed frequent amplification and may promote tumor progression by activating the EGFR/ERK signaling pathway in PDAC cells. Furthermore, we found that niclosamide could be a repositioned therapeutic drug by targeting ASAP2, pERK, or other pathways in PDAC.
DISCLOSURE
The authors declare no conflicts of interest for this article.
Supporting information
Figs S1‐S3
Appendix S1
ACKNOWLEDGMENTS
This work was supported by the following grants and foundations: Japan Society for the Promotion of Science (JSPS) (grant numbers JP19K09176, JP19H03715 and JP20H05039); OITA Cancer Research Foundation. The authors thank K. Oda, M. Kasagi, S. Sakuma, N. Mishima, and T. Kawano for their technical assistance. We thank Tyler Lahusen for helpful comments and English proofreading.
Fujii A, Masuda T, Iwata M, et al. The novel driver gene ASAP2 is a potential druggable target in pancreatic cancer. Cancer Sci. 2021;112:1655–1668. 10.1111/cas.14858
REFERENCES
- 1. Rahib L, Smith BD, Aizenberg R, et al. Projecting cancer incidence and deaths to 2030: the unexpected burden of thyroid, liver, and pancreas cancers in the united states. Cancer Res. 2014;74:2913‐2921. [DOI] [PubMed] [Google Scholar]
- 2. Kanda M, Matthaei H, Wu J, et al. Presence of somatic mutations in most early‐stage pancreatic intraepithelial neoplasia. Gastroenterology. 2012;142:730‐733. [DOI] [PMC free article] [PubMed] [Google Scholar]
- 3. Wilentz RE, Geradts J, Maynard R, et al. Inactivation of the p16 (INK4A) tumor‐suppressor gene in pancreatic duct lesions: loss of intranuclear expression. Cancer Res. 1998;58:4740‐4744. [PubMed] [Google Scholar]
- 4. Wilentz RE, Su GH, Dai JL, et al. Immunohistochemical labeling for Dpc4 mirrors genetic status in pancreatic adenocarcinomas: a new marker of DPC4 inactivation. Am J Pathol. 2000;156:37‐43. [DOI] [PMC free article] [PubMed] [Google Scholar]
- 5. Yachida S, White CM, Naito Y, et al. Clinical significance of the genetic landscape of pancreatic cancer and implications for identification of potential long‐term survivors. Clin Cancer Res. 2012;18:6339‐6347. [DOI] [PMC free article] [PubMed] [Google Scholar]
- 6. Kleeff J, Korc M, Apte M, et al. Pancreatic cancer. Nat Rev Dis Primers. 2016;2(1):1‐23. [DOI] [PubMed] [Google Scholar]
- 7. Qian ZR, Rubinson DA, Nowak JA, et al. Association of alterations in main driver genes with outcomes of patients with resected pancreatic ductal adenocarcinoma. JAMA Oncol. 2018;4:1‐6. [DOI] [PMC free article] [PubMed] [Google Scholar]
- 8. Davoli T, Xu A, Mengwasser K, et al. Resource cumulative haploinsufficiency and triplosensitivity drive aneuploidy patterns and shape the cancer genome. Cell. 2013;155:948‐962. [DOI] [PMC free article] [PubMed] [Google Scholar]
- 9. Stephens PJ, Greenman CD, Fu B, et al. Massive genomic rearrangement acquired in a single catastrophic event during cancer development. Cell. 2011;144:27‐40. [DOI] [PMC free article] [PubMed] [Google Scholar]
- 10. Zack TI, Schumacher SE, Carter SL, et al. Pan‐cancer patterns of somatic copy number alteration. Nat Genet. 2013;45:1134‐1140. [DOI] [PMC free article] [PubMed] [Google Scholar]
- 11. Rausch T, Jones D, Zapatka M, et al. Genome sequencing of pediatric medulloblastoma links catastrophic DNA rearrangements with TP53 mutations. Cell. 2012;148:59‐71. [DOI] [PMC free article] [PubMed] [Google Scholar]
- 12. Notta F, Chan‐Seng‐Yue M, Lemire M, et al. A renewed model of pancreatic cancer evolution based on genomic rearrangement patterns. Nature. 2016;538:1‐20. [DOI] [PMC free article] [PubMed] [Google Scholar]
- 13. Uchi R, Takahashi Y, Niida A, et al. Integrated multiregional analysis proposing a new model of colorectal cancer evolution. PLoS Genet. 2016;12:1‐24. [DOI] [PMC free article] [PubMed] [Google Scholar]
- 14. Saito T, Niida A, Uchi R, et al. A temporal shift of the evolutionary principle shaping intratumor heterogeneity in colorectal cancer. Nat Commun. 2018;9:1‐11. [DOI] [PMC free article] [PubMed] [Google Scholar]
- 15. Niida A, Nagayama S, Miyano S, et al. Understanding intratumor heterogeneity by combining genome analysis and mathematical modeling. Cancer Sci. 2018;109:884‐892. [DOI] [PMC free article] [PubMed] [Google Scholar]
- 16. Calabrese C, Davidson NR, Demircioğlu D, et al. Genomic basis for RNA alterations in cancer. Nature. 2020;578:129‐136. [DOI] [PMC free article] [PubMed] [Google Scholar]
- 17. Sato K, Masuda T, Hu Q, et al. Novel oncogene 5MP1 reprograms c‐Myc translation initiation to drive malignant phenotypes in colorectal cancer. EBioMedicine. 2019;44:387‐402. [DOI] [PMC free article] [PubMed] [Google Scholar]
- 18. Kouyama Y, Masuda T, Fujii A, et al. Oncogenic splicing abnormalities induced by DEAD‐Box Helicase 56 amplification in colorectal cancer. Cancer Sci. 2019;110:3132‐3144. [DOI] [PMC free article] [PubMed] [Google Scholar]
- 19. Nambara S, Masuda T, Kobayashi Y, et al. GTF2IRD1 on chromosome 7 is a novel oncogene regulating the tumor‐suppressor gene TGFβR2 in colorectal cancer. Cancer Sci. 2020;111:343‐355. [DOI] [PMC free article] [PubMed] [Google Scholar]
- 20. Masuda TA, Inoue H, Nishida K, et al. Cyclin‐dependent kinase 1 gene expression is associated with poor prognosis in gastric carcinoma. Clin Cancer Res. 2003;9:5693‐5698. [PubMed] [Google Scholar]
- 21. Ueda M, Iguchi T, Nambara S, et al. Overexpression of transcription termination factor 1 is associated with a poor prognosis in patients with colorectal cancer. Ann Surg Oncol. 2015;22:1490‐1498. [DOI] [PubMed] [Google Scholar]
- 22. Kurashige J, Hasegawa T, Niida A, et al. Integrated molecular profiling of human gastric cancer identifies DDR2 as a potential regulator of peritoneal dissemination. Sci Rep. 2016;6:1‐11. [DOI] [PMC free article] [PubMed] [Google Scholar]
- 23. Chiang T‐W, le Sage C, Larrieu D, et al. CRISPR‐Cas9D10A nickase‐based genotypic and phenotypic screening to enhance genome editing. Sci Rep. 2016;6:1‐17. [DOI] [PMC free article] [PubMed] [Google Scholar]
- 24. Belotserkovskaya R, Raga Gil E, Lawrence N, et al. PALB2 chromatin recruitment restores homologous recombination in BRCA1‐deficient cells depleted of 53BP1. Nat Commun. 2020;11:819. [DOI] [PMC free article] [PubMed] [Google Scholar]
- 25. Andreev J, Simon J‐P, Sabatini DD, et al. Identification of a new Pyk2 target protein with Arf‐GAP activity. Mol Cell Biol. 1999;19:2338‐2350. [DOI] [PMC free article] [PubMed] [Google Scholar]
- 26. Shiba Y, Randazzo PA. ArfGAP1 function in COPI mediated membrane traffic: currently debated models and comparison to other coat‐binding arfGAPs. Histol Histopathol. 2012;27:1143‐1153. [DOI] [PMC free article] [PubMed] [Google Scholar]
- 27. Wang C, Liu P, Wu H, et al. MicroRNA‐323‐3p inhibits cell invasion and metastasis in pancreatic ductal adenocarcinoma via direct suppression of SMAD2 and SMAD3. Oncotarget. 2016;7:14912‐14924. [DOI] [PMC free article] [PubMed] [Google Scholar]
- 28. Shah BH, Catt KJ. Calcium‐independent activation of extracellularly regulated kinases 1 and 2 by angiotensin II in hepatic C9 cells: roles of protein kinase Cδ, Src/proline‐rich tyrosine kinase 2, and epidermal growth factor receptor trans‐activation. Mol Pharmacol. 2002;61:343‐351. [DOI] [PubMed] [Google Scholar]
- 29. Abrutyn E. New uses for old drugs. Infect Dis Clin North Am. 1989;3:653‐664. [PubMed] [Google Scholar]
- 30. Ashburn TT, Thor KB. Drug repositioning: identifying and developing new uses for existing drugs. Nat Rev Drug Discov. 2004;3:673‐683. [DOI] [PubMed] [Google Scholar]
- 31. Novac N. Challenges and opportunities of drug repositioning. Trends Pharmacol Sci. 2013;34:267‐272. [DOI] [PubMed] [Google Scholar]
- 32. Masuda T, Tsuruda Y, Matsumoto Y, et al. Drug repositioning in cancer: the current situation in Japan. Cancer Sci. 2020;111:1‐8. [DOI] [PMC free article] [PubMed] [Google Scholar]
- 33. Sawada R, Iwata M, Tabei Y, et al. Predicting inhibitory and activatory drug targets by chemically and genetically perturbed transcriptome signatures. Sci Rep. 2018;8:1‐4. [DOI] [PMC free article] [PubMed] [Google Scholar]
- 34. You S, Li R, Park D, et al. Disruption of STAT3 by niclosamide reverses radioresistance of human lung cancer. Mol Cancer Ther. 2014;13:606‐616. [DOI] [PMC free article] [PubMed] [Google Scholar]
- 35. Lu LU, Dong J, Wang L, et al. Activation of STAT3 and Bcl‐2 and reduction of reactive oxygen species (ROS) promote radioresistance in breast cancer and overcome of radioresistance with niclosamide. Oncogene. 2018;37:5292‐5304. [DOI] [PubMed] [Google Scholar]
- 36. Wang C, Zhou X, Xu H, et al. Niclosamide inhibits cell growth and enhances drug sensitivity of hepatocellular carcinoma cells via STAT3 signaling pathway. J Cancer. 2018;9:4150‐4155. [DOI] [PMC free article] [PubMed] [Google Scholar]
- 37. Park S‐Y, Kim J‐Y, Choi J‐H, et al. Inhibition of LEF1‐mediated DCLK1 by niclosamide attenuates colorectal cancer stemness. Clin Cancer Res. 2019;25:1415‐1429. [DOI] [PubMed] [Google Scholar]
- 38. Meloche S, Pouysségur J. The ERK1/2 mitogen‐activated protein kinase pathway as a master regulator of the G1‐ to S‐phase transition. Oncogene. 2007;26:3227‐3239. [DOI] [PubMed] [Google Scholar]
- 39. Tanoue LT. EGFR antagonists in cancer treatment. Yearb Pulm Dis. 2009;2009:177‐179. [Google Scholar]
- 40. Yamaguchi H, Condeelis J. Regulation of the actin cytoskeleton in cancer cell migration and invasion. Biochim Biophys Acta Mol Cell Res. 2007;1773:642‐652. [DOI] [PMC free article] [PubMed] [Google Scholar]
- 41. Miyabayashi K, Ijichi H, Mohri D, et al. Erlotinib prolongs survival in pancreatic cancer by blocking gemcitabine‐induced MAPK signals. Cancer Res. 2013;73:2221‐2234. [DOI] [PubMed] [Google Scholar]
- 42. McCormick F. KRAS as a therapeutic target. Clin Cancer Res. 2015;21:1797‐1801. [DOI] [PMC free article] [PubMed] [Google Scholar]
- 43. Feldser DM, Kostova KK, Winslow MM, et al. Stage‐specific sensitivity to p53 restoration during lung cancer progression. Nature. 2010;468:572‐575. [DOI] [PMC free article] [PubMed] [Google Scholar]
- 44. Yamanishi Y, Kotera M, Kanehisa M, et al. Drug‐target interaction prediction from chemical, genomic and pharmacological data in an integrated framework. Bioinformatics. 2010;26:246‐254. [DOI] [PMC free article] [PubMed] [Google Scholar]
- 45. Iwata M, Sawada R, Iwata H, et al. Elucidating the modes of action for bioactive compounds in a cell‐specific manner by large‐scale chemically‐induced transcriptomics. Sci Rep. 2017;7:1‐15. [DOI] [PMC free article] [PubMed] [Google Scholar]
- 46. Li R, You S, Hu Z, et al. Inhibition of STAT3 by niclosamide synergizes with erlotinib against head and neck cancer. PLoS One. 2013;8:1‐13. [DOI] [PMC free article] [PubMed] [Google Scholar]
- 47. Osada T, Chen M, Yang XY, et al. Antihelminth compound niclosamide downregulates Wnt signaling and elicits antitumor responses in tumors with activating APC mutations. Cancer Res. 2011;71:4172‐4182. [DOI] [PMC free article] [PubMed] [Google Scholar]
- 48. Suliman MA, Zhang Z, Na H, et al. Niclosamide inhibits colon cancer progression through downregulation of the Notch pathway and upregulation of the tumor suppressor miR‐200 family. Int J Mol Med. 2016;38:776‐784. [DOI] [PMC free article] [PubMed] [Google Scholar]
- 49. Ahn SY, Yang JH, Kim NH, et al. Anti‐helminthic niclosamide inhibits Ras‐driven oncogenic transformation via activation of GSK‐3. Oncotarget. 2017;8:31856‐31863. [DOI] [PMC free article] [PubMed] [Google Scholar]
Associated Data
This section collects any data citations, data availability statements, or supplementary materials included in this article.
Supplementary Materials
Figs S1‐S3
Appendix S1


