Abstract
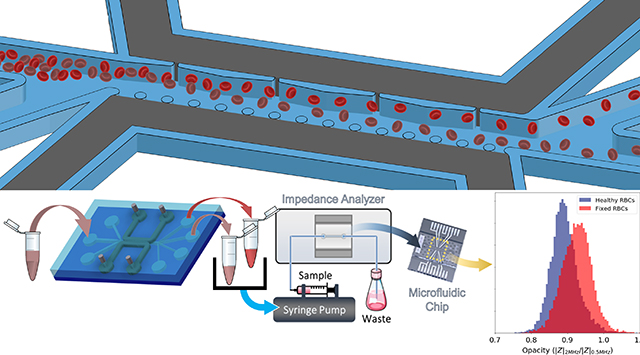
Dielectrophoresis (DEP) enables the separation of cells based on subtle subcellular phenotypic differences by controlling frequency of the applied field. However, current electrode-based geometries extend over a limited depth of the sample channel, thereby reducing the throughput of the manipulated sample (sub-μL/min flow rates and <105 cells/mL). We present a flow through device with self-aligned sequential field non-uniformities extending laterally across the sample channel width (100 μm) that is created by metal patterned over the entire depth (50 μm) of the sample channel sidewall using a single lithography step. This enables single-cell streamlines to undergo progressive DEP deflection with minimal dependence on the cell starting position, its orientation versus the field and intercellular interactions. Phenotype-specific cell separation is validated (>μL/min flow and >106 cells/mL) using heterogeneous samples of healthy and gluraldehyde-fixed red blood cells, with single-cell impedance cytometry showing that the DEP collected fractions are intact and exhibit electrical opacity differences consistent with their capacitance-based DEP crossover frequency. This geometry can address the vision of an “all electric” selective cell isolation and cytometry system for quantifying phenotypic heterogeneity of cellular systems.
Graphical Abstract
Introduction
The phenotypic heterogeneity of biological systems, wherein subpopulations of a cell type can exhibit distinct structure and function,1 presents challenges to cell biologists and clinicians seeking to associate biological function and disease with particular cell-level markers.2–4 While cell populations are routinely quantified by flow cytometry after fluorescent staining of their characteristic cell surface proteins and are enriched by fluorescent activated cell sorting,5 there is an increasing recognition that many rare cancer,6 stem7, and immune cells8 do not exhibit identifying biochemical surface markers that can be associated with key functions, such as metastasis,9 differentiation lineage,10 and surface activation,8 respectively. Hence, there is much interest in the complementary utilization of biophysical properties,11,12 so that cell subpopulations can be identified and separated in a label-free manner based on inherent differences, without the selection bias often imposed by antibody receptors used for fluorescent labelling of cell surface proteins.
Label-free biophysical metrics, such as cell deformability are essential for discerning functional differences,13,14 but they lack the ability to carry out distinctions based on subcellular properties.15 Cell electrophysiology, on the other hand, is a biophysical property that exhibits sensitive variations as a function of cellular electrical size and subcellular features, such as membrane morphology and interior structure. Using an external electric field at a frequency wherein particular cells are selectively polarized based on their subcellular electrophysiology characteristics, cells of interest can be separated under dielectrophoresis (DEP) using spatial field non-uniformities,16 with positive DEP (pDEP) translation towards the high field due to polarization of the cell or negative DEP (nDEP) translation away from the high field due to polarization of the media around the cell.17,18 While the applied electric field is screened completely around the cell at low frequencies19 to cause separations based on cell size, membrane polarization occurs at successively higher frequencies to enable separations based on electrical capacitance differences that depend on cellular membrane morphology20,21 and activation.22 At even higher frequencies wherein the membrane is short circuited, cytoplasmic conductivity differences drive the separation based on the cellular interior structure.23
While DEP separations have been demonstrated using a wide variety of device geometries over the last couple of decades, the field non-uniformities can be broadly classified as those based either on: (i) electrode-based planar geometries that are highly effective for field coupling,24 but extend over only a limited channel depth; or (ii) insulator-based geometries that extend over the entire device depth,25 but exhibit weak field coupling due to the physically distant electrodes from the field non-uniformity.26 Hence, limitations in the spatial extent of the field in the former case or in magnitude of field coupling in the latter case have led to the poor throughput of DEP separations, in spite of the high subcellular phenotypic specificity of DEP, due to its frequency-selective polarization ability.27 This low throughput is apparent in terms of the low flow rates28,29 (sub-μL/min scale) and/or low sample concentrations30 (<105 cells/mL) typically used in DEP separations, to ensure sufficient time for each cell to interact with the limited field non-uniformities points in the device for enabling effective DEP deflection. Alternate approaches that create field non-uniformities using media conductivity gradients to enable cell separation based on their iso-dielectric point at the crossover frequency,31 lack tunability for pDEP and nDEP. Several 3D metal electrode patterning approaches have emerged to enhance the field extent across the channel depth, 32,33 while maintaining the high field coupling, but these geometries have posed various fabrication challenges, such as the need for labour-intensive interlayer alignment and highly specialized deposition methods that are available only in limited facilities. Easier fabrication methods based on Ag-PDMS electrodes34,35 exhibit lower conductivity that reduces field coupling, while recessed planar electrodes at orifices36 do not enable separation under high flow rates.
An emerging strategy for facile fabrication of 3D metal geometries in the sample microchannel is based on cofabrication of adjoining electrode and sample channels,37 so that the liquid metal alloy filled in the electrode channel after room temperature solidification can function to stimulate or measure the contents in the sample channel.38 The chief advantage of this strategy is that it creates patterned metal sidewall electrodes extending over the entire device depth, without the need for interlayer alignment between the metal and microchannel layers.39 Such an approach has been used for electrodes in microfluidic channels for free-flow electrophoresis,39 electrical measurement of deforming cells,40, 41 and electrical manipulation of cell stretching.42 However, dielectrophoresis requires a spatial field non-uniformity that should ideally extend laterally across the entire sample microchannel width and be invariant over the sample microchannel depth. Furthermore, these lateral field non-uniformities need to be sequentially placed along the length of the microchannel for enabling repeated deflections.43 Hence, electric field lines in the sample channel need to be created sequentially using adjoining electrode channels with a sharp profile on one side and a wide profile on the other side, so that the cells of interest can be progressively deflected from their streamlines for enabling separation and collection at different outlets of the channel.
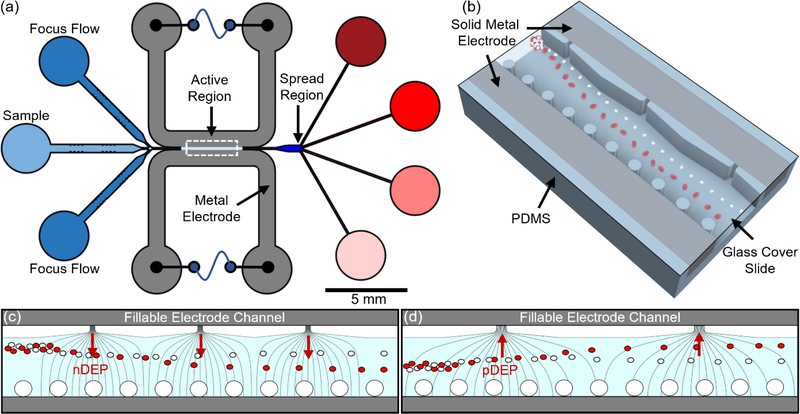
We present the realization of this flow through geometry for progressive DEP deflection (Fig. 1a and 1b) by using an array of orifices to create high field points and posts on the other side to contain the metal over a uniform profile. This creates self-aligned sequential field non-uniformities extending laterally across the sample channel width (100 μm), with a facile method for patterning metal at the sidewalls of the sample channel over its entire depth (50 μm). In this manner, the sequentially patterned field non-uniformities created using a single lithography step can progressively deflect cells by DEP for enabling separations at enhanced flow rates and at greater cell concentration levels in the sample channel, with minimal dependence on the cell’s starting position, its orientation with respect to the field and intercellular interactions. Based on 3D images of the microchannel sidewall to validate fabrication of this structure, electric field and particle flow simulations are used to optimize the architecture for placement of field non-uniformities to enable nDEP (Fig. 1c) and pDEP deflection (Fig. 1d) in the same device structure. Device operation for nDEP and pDEP deflection is validated using homogeneous samples of healthy human red blood cells (h-RBCs) at concentration of levels of 1.13 × 10⁸ cells/mL and at flow rates in the 0.24–12 μL/min range (sample throughput of 6.78 × 10⁵ cells/min), with a clear separation of superimposed streamlines of h-RBCs versus 1% glutaraldehyde-fixed RBCs (f-RBCs). Phenotype-specific cell separation on this device is validated using heterogeneous samples of h-RBCs and f-RBCs (50% each), based on electrical opacity differences44,45,46 between the respective collected fractions after DEP separation that reflects the expected capacitance differences, while invariance of electrical opacity of DEP collected versus input h-RBCS confirms the maintenance of cell functionality after DEP separation. Based on this, we envision application of this device configuration in future work for selective cell isolation towards quantifying phenotypic heterogeneity of cellular systems.
Figure 1.
(a) Schematic of microfluidic device with focusing flow on input sample to fix its position with respect to the sequential field non-uniformities for separation. (b) The 3D field non-uniformity created across channel width by orifices on one side and posts on the other side for field generated by the solidified liquid metal electrodes. Field lines to cause particle deflection from initial focused position by: (c) negative DEP (nDEP) and (d) positive DEP.
MATERIALS AND METHODS
Device Design
A single-layer PDMS microchannel structure was designed for a sample channel (light blue region of Fig. 1a) flanked by two so-called electrode channels47 (grey region of Fig. 1a), with inlet regions for sample and focusing flows, an active region with the field non-uniformity for selective deflection, a spread region to enhance spatial separations and collection regions for each separated fraction. The active region (3D view in Fig. 1b) with the field non-uniformities extends 4 mm in length, 100 μm in width and 50 μm in depth. For applying the electric field, recessed electrodes (150 μm apart) were constructed by filling liquid metal in the electrode channels, followed by room temperature solidification. To create and tune the field non-uniformity, the field lines were patterned across the sample channel (Fig. 1c and Fig. 1d) using orifices on one side (each 10 μm or 20 μm orifices separated by 215 μm and 430 μm from each other for nDEP and pDEP, respectively) and posts on the other side (an array of 25 μm diameter posts spaced 35 μm apart). The orifices, designed with rounded edges to avoid electroosmotic vortexing, act to create parallelized high field points, while the post side acts to reduce fields from the neighbouring electrode, with a critical level of post separation needed to contain the liquid metal in the electrode channel due to its high surface tension. In this manner, by optimizing the geometry of the field non-uniformity (number and periodicity of the orifices) and the initial focusing position of the cells based on flow rates of focusing versus sample flow, the geometry can be designed for nDEP (Fig. 1c) and pDEP (Fig. 1d).
Device Fabrication
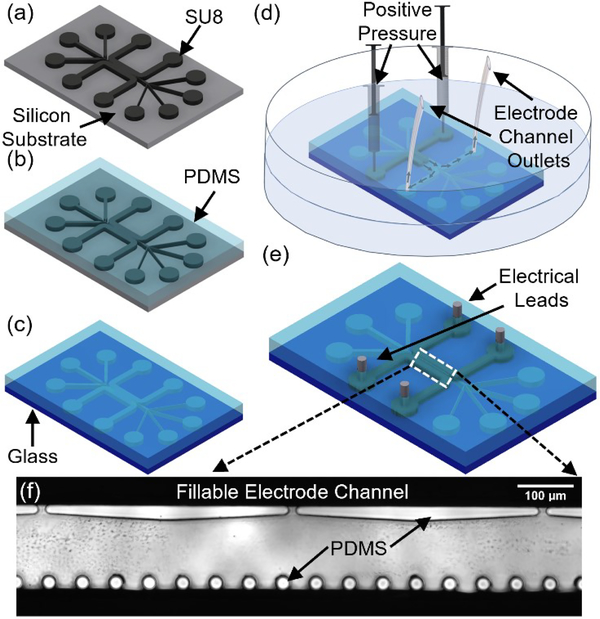
The device was fabricated using SU-8 patterned photoresist (SU-8 3050, Kayaku Advanced Materials) master constructed on a 4” silicon wafer (University Wafer, Inc), per Fig. 2a. The exposure and alignment step were done by a mask aligner (EVG 620, EV Group). A 5:1 PDMS base to PDMS crosslinker (SylgardTM 184, DOW Corning) was used for micromolding into the SU-8 master mold, per Fig. 2b. The PDMS and substrate were crosslinked at 60 °C for 12 hours. After demolding, a biopsy punch was used to create the inlets and outlets for the sample channels and electrode channel. The chip was then oxygen plasma bonded to glass with plasma system (Tergeo, Pie Scientific) for 30 seconds at 20 W power, per Fig. 2c. The electrode channels were filled with liquid metal (Field’s Metal RotoMetals) using a syringe under an estimated positive pressure of 13 kPa while the device was submerged in a 65 °C water bath (Fig. 2d). The chip was removed from the water bath and cooled to room temperature allowing the Field’s metal to solidify. Wire leads were made to interface with the in-channel electrodes. Field’s metal is a low melting indium alloy (InBiSn 51% In, 32.5% Bi, 16.5% Sn) that is filled in the electrode channel as a viscous liquid at 65°C, but its high surface tension restrains its flow around the orifices on one side and around the separated posts on the other side, thereby self-aligning the recessed electrodes at a pre-determined distance across the sample channel upon room temperature solidification.
Figure 2.
Microfabrication process flow. (a) SU-8 lithography. (b) PDMS micromolding. (c) Oxygen plasma bonding of PDMS to glass. (d) Metal introduced in its melted state into the electrode channel under positive pressure (estimated at ~13 kPa38) is applied to syringes until the electrode channel is filled with metal. (e) Final device with leads ready for electrical interface. (f)Inverted microscope image of the DEP active region.
Biological Sample preparation
Healthy RBCs (h-RBCs) were from stock solution of blood type A+ human RBCs from Valley Biomedical (Winchester, VA) and suspended in RPMI 1640 HEPES (Sigma Aldrich, St. Louis, MO), supplemented with 0.5% Albumax II Lipid-Rich BSA (Sigma Aldrich, St. Louis, MO) and 50mg/L hypoxanthine (Thermo Fisher Scientific, Waltham, MA) for storage and diluted as needed (1.13 × 10⁸ cells/mL). The f-RBCs were prepared by washing diluted h-RBCs in 1X PBS three times and resuspending the packed cells in 1 mL of 1X PBS mixed with 20μL of glutaraldehyde, followed by incubation at room temperature for an hour for the membrane fixation process. The h-RBCs and f-RBCs were washed three times and resuspended in the DEP buffer, composed of: 8% sucrose, 1% BSA, and 1X PBS that is adjusted to conductivity levels of 280 μs/cm, 450 μs/cm, 570 μs/cm, 720 μs/cm, based on three independent measurements with a conductivity meter (LAQUAtwin, Horiba).
Microfluidic Operation and Cytometry
Two syringe pumps (Nemesys, Cetoni GmbH) were used to drive the sample and focusing flows. A function/arbitrary waveform generator (33220A LXI, Agilent technologies) coupled with an amplifier48,49 (A400DI, FLC Electronics) was used to deliver ~80 Vpp over the investigated frequency range. The cells were imaged using a CMOS camera (Orca flash 4.0 V2, Hamamatsu) connected to an inverted microscope (Axio Observer 7, Zeiss). Post processing of cell position measurements were made using ImageJ (see S2 ESI† for details). The collected sample at each outlet after DEP deflection was analysed by single-cell impedance cytometry44,47 to study the phenotypes based on their electrical opacity (see S6 ESI† for details).
COMSOL Simulation
COMSOL Multiphysics (COMSOL Inc.) was used to study the geometric effects of parallelized asymmetric electrodes and its DEP response in both a 2D and 3D model, for optimizing the design and to analyze the effectiveness of three dimensional and planar electrodes, respectively. The electric current module was used to study the electric field extent from the high field point. The electric current module was coupled with the laminar flow and particle tracing modules to study the DEP force deflection on RBCs (5μm diameter) and Platelets (1.8μm diameter). (See S7 ESI† for simulation parameters)
RESULTS
Optimizing field non-uniformities
The micro-devices could be fabricated with a high degree of control on the placement of the solidified liquid metal, as recessed electrodes (Fig. 3a & 3b) that extend across the depth of the sample channel (Fig. 3c & 3d). To optimize the field non-uniformity across the sample channel for enabling the appropriate geometries for nDEP and pDEP deflection of cells, we explored electric field and particle tracing simulations.
Figure 3.
Optical microscopy of the microfabricated channel with solidified liquid metal, showing the PDMS mold of a single orifice with an empty (a) and filled (b) electrode channel. (c) Cross-section view of an orifice with exposed metal (d) Cross-section view of the PDMS post designed to confine the liquid metal across from the orifices.
Specifically, we present two geometries to highlight the ability to modulate the electric field profile based on the orifice size and its periodicity within a fixed device layout. Per the simulations in Fig. 4, geometry I consists of 10 μm wide orifices that are spaced 215 μm apart and geometry II consists of 20 μm wide orifices that are spaced 430 μm. Based on this, it is apparent that geometry I enables significant differences in DEP deflection levels of model RBCs and platelets, as indicated by the streamlines after the focused heterogenous sample passes beyond the orifices. Since magnitude of the high field point increases sharply with decreasing orifice size, we choose 10 μm orifices in Fig. 4a to ensure a force level that is just sufficient for nDEP deflection of the focused heterogeneous sample of cells, while avoiding the likelihood of pDEP trapping by utilizing higher flow rates, higher media conductivity levels and lower field frequencies. However, for cell separation by deflection under pDEP, cells must be focused at a critical distance from the orifices to avoid pDEP trapping, which can disrupt the field profile for subsequent cell streamlines. Per Fig. 4b, geometry I is unable to cause sufficient levels of deflection of the respective cells under pDEP, due to the limited spatial extent of the field non-uniformity across the sample channel width. Hence, to cause the field non-uniformity to extend across a greater proportion of the sample channel width, geometry II with wider orifices (20 μm) and greater spacing (430 μm) was designed. Per Fig. 4c, this enhanced spatial extent of the field from the orifice is sufficient to cause differential levels of pDEP deflection of the respective cells that are focused at the center of the sample channel, thereby providing a wider spatial range for cell separations under pDEP deflection (up to half of the sample channel width). The line profiles of the field in Fig. 4d show that the spatial extent of the electric field can be enhanced by geometry II, through increasing the orifice size and decreasing the periodicity. The criterion of the minimum field level for pDEP deflection (horizontal dashed line in Fig. 4d) is set as the level just sufficient to cause a displacement level to a particle that is at least one diameter of itself in the lateral direction, since this will make the pDEP deflection distinguishable from the trajectory of an undeflected particle (details in S1 section of ESI†). This minimum field level for pDEP deflection is available for cells focused up to 53 μm away from the orifice for geometry II versus only up to 40 μm away from the orifice for geometry I. Hence, the self-aligned field non-uniformity in the sample channel due to field from the electrode channel can be geometrically tuned for nDEP deflection (smaller orifices of high periodicity) or for pDEP deflection (larger orifices of low periodicity), with up to half of the sample channel width available for successive DEP deflection to further separate the spatial streamlines of the deflected cells.
Figure 4.
2D simulation of the electric field normal and particle trajectories under DEP force in geometry I (10 μm wide orifices and 215 μm apart) versus geometry II (20 μm wide orifices and 430 μm apart) for application towards: (a) nDEP (150 Vpp and 40 kHz) in geometry I; (b) pDEP (150 Vpp and 500 kHz) in geometry I; and (c) pDEP in geometry II. (d) Line profile of the Electric Field in Geometry I versus Geometry II along the center of the orifices extending across the sample channel.
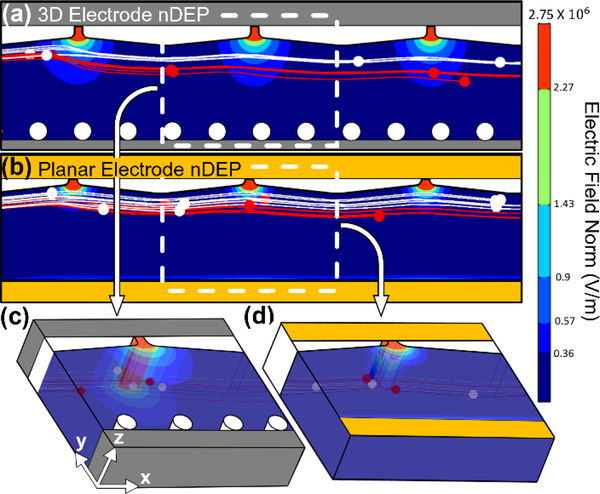
In order to highlight the role of the 3D field profile from metal electrodes that extend over the entire depth of the sample channel, as obtained within our microfabricated devices in Fig. 3c, we compare the field profiles obtained using geometry I (3D electrodes) to that obtained from a representative device with the same active region, but with a planar gold electrode layer. Based on the standard levels of alignment precision in microfluidics, these planar electrodes are assumed to protrude into the sample channel by 5 μm on either side of the sample channel. Comparing the field and particle tracing simulations for the 3D electrode design, per the top-view of Fig. 5a and the cross-sectional view of Fig. 5c, versus for the planar electrode design, per the top-view of Fig. 5b and the cross-sectional view of Fig. 5d, the far greater spatial separation of model RBCs from platelets is apparent using the 3D versus the planar electrode design. The improved separation is due to the field non-uniformity in the x-y plane extending uniformly down the entire depth in the z plane of the channel Fig. 5c, whereas for planar electrodes, the x-y field non-uniformity is only high near the top surface of the sample channel and steadily drops over the channel depth Fig. 5d. Hence, only cells close to the top surface with the planar electrodes are deflected, whereas cells at any z position are deflected by the 3D field profile in the presented device.
Figure 5.
3D simulation of electric field norm and particle trajectory under DEP force generated with: (a) 3D versus (b) planar electrodes by 150 Vpp at 40 kHz. Isometric view of the respective electric field norm of a single orifice (dashed box) along the depth and across the width of the channel with: (c) 3D and (d) planar electrodes.
High throughput DEP deflection
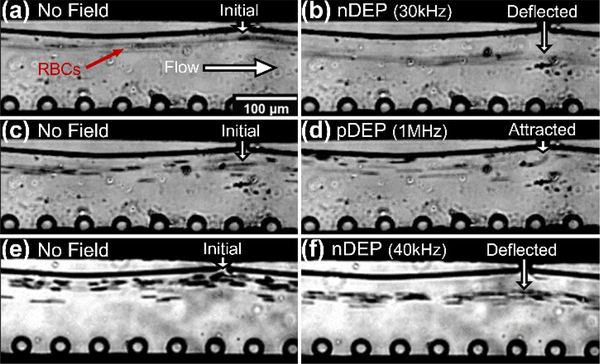
Application of the sequential field non-uniformities in the microfluidic device for high throughput and phenotype-selective cell deflection is presented based on nDEP and pDEP deflection of red blood cell streamlines at flow rates in the 0.2–12 μL/min range (sample throughput of 105−106 cells/min based on an RBC concentration of 1.13 × 10⁸ /mL). Using a sample of healthy RBCs (h-RBCs) suspended in media of different conductivities (280 μs/cm, 450 μs/cm, 540 μs/cm and 720 μs/cm), the crossover frequency was determined based on a frequency sweep. This was used to compute the h-RBC membrane capacitance as: 11.13 ± 1.28 mF/m2 (see ESI: S3†), which is close to that of prior work27,50,51 thereby validating the frequency selectivity of DEP manipulation of RBCs within this device. Choosing a media conductivity of 280 μs/cm, the flow through streamlines of h-RBCs at 0.24 μL/min are shown before (Fig. 6a) and after field application (Fig. 6b) at 80 Vpp at 30 kHz, to initiate nDEP. In fact, this causes a net displacement of ~30 μm in the sample streamlines to enable its facile collection into an alternate outlet point from the original undeflected flow. The same media conductivity is used to demonstrate pDEP deflection of the hRBC flow streamlines at 0.24 μL/min, using 80 Vpp at 1 MHz, as shown before Fig. 6c and after field application Fig. 6d. Under pDEP, the RBCs are deflected by ~10μm towards the orifices, from an initial streamline position of 20μm in the lateral direction from the orifice to enable collection into an alternate outlet point from the original undeflected flow. To demonstrate the potential of this device for cell deflection at even higher throughput levels (12 μL/min), the nDEP levels were increased using a higher media conductivity (570 μs/cm) and a higher stimulation signal (100 Vpp at 40 kHz). Comparison of Fig. 6e versus Fig. 6f shows that these alterations in nDEP conditions allowed for the maintenance of equivalent levels of net displacement in the sample streamlines (~30 μm) at the ~50-fold higher flow rates that are comparable to hydrodynamic separation strategies.
Figure 6:
Dielectrophoretic (DEP) deflection of h-RBCs: (a) before (0.24 μL/min sample flow) versus (b) after nDEP deflection initiated by 80 Vpp at 30 kHz, for cells in buffer of 280 μs/cm media conductivity, to cause net displacement of ~30 μm from the original sample streamline; (c) before (0.24 μL/min sample flow) versus (d) after pDEP deflection initiated by 80 Vpp at 1 MHz, for cells in buffer of 280 μs/cm media conductivity, to cause net displacement of ~10 μm from the original sample streamline. The ability to cause nDEP at even higher sample flow rates (12 μL/min) is apparent from images before (e) versus after nDEP (f), using 100 Vpp at 40 kHz to displace RBCs in buffer of 570 μs/cm media conductivity to ~30 μm from the original sample streamline (video in ESI).
Phenotypic selectivity of DEP deflection:
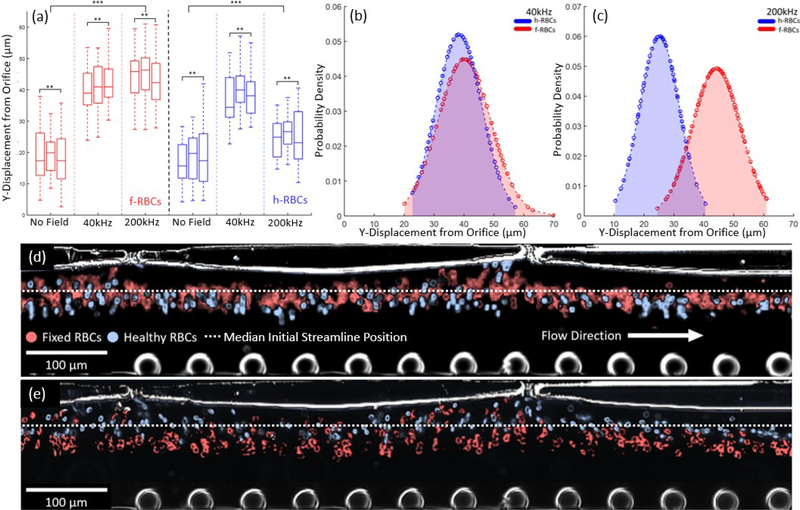
To demonstrate cell phenotype-selective DEP deflection, we compare DEP deflection for a sample of h-RBCs versus of f-RBCs. This is performed by a frequency sweep at 80 Vpp for cells suspended in 450 μs/cm buffer, using a lowered flow rate of 0.144 μL/min to improve image distinction. While h-RBCs show strong nDEP at 40kHz, with a mean lateral displacement of 21 μm (p value of 7.1 × 10⁻⁵ per ESI S4†) from their starting position along the channel wall adjoining the orifice, the crossover frequency was reached at 200kHz, as apparent from a mean lateral displacement of 6.4 μm (p value of 0.003 per ESI S4†) from their starting position (Fig. 7a & 7b). On the other hand, f-RBCs show nDEP over this measured frequency range, with mean lateral displacement levels of ~40 μm in the 40–200 kHz range. Fixation of RBCs is known to lower ion mobility at the cell membrane to significantly lower the membrane capacitance of f-RBCs44, which likely increases their crossover to well-beyond 200 kHz and explains the nDEP observations presented herein. Furthermore, based on three sets of images taken from three independent frames of the video demonstrating DEP for the respective samples at frequencies of 40 kHz and 200 kHz, the data was processed by ImageJ to determine the position of their respective streamlines away from the channel wall adjoining the orifice (Example of 1 frame in ESI S2†). Based on deflected distances determined from the three images for each set, a mean deflection distance and standard deviation was calculated for the f-RBCs and h-RBCs at 40 kHz and at 200 kHz. From the determined mean and standard deviation of the positional data, a normal probability density function was used to compare the normalized deflected events under nDEP and pDEP of h-RBCs and f-RBCs at the respective frequencies, per Fig. 7b and 7c. Based on this, it is clear that while the Gaussian functions for net positions of h-RBCs and f-RBCs strongly overlap at 40 kHz due to their strong nDEP behaviour (Fig. 7b), the respective Gaussian functions show a high degree of separation at 200 kHz, with h-RBCs continuing to exhibit pDEP and f-RBCs continuing to exhibit strong nDEP. Hence, a collection gate can be set at 34 μm from the channel wall adjoining the orifices for obtaining h-RBCs at a separation purity of 88% on one side and f-RBCs on the other side at a separation purity of 91.5%. To visually present this data, colour correction images of h-RBCs (blue) and f-RBCs (red) from selected frames under DEP deflection were stacked to simulate a heterogeneous sample of h-RBCs and f-RBCs at 40 kHz Fig. 7d and 200 kHz Fig. 7e. It is noteworthy that cell deflection was not strongly influenced by vortices due to electroosmotic flow fields52,53, which we attribute to the recessed profile of the metal and the rounded PDMS edges (Figure 3b) and to the use of fields in the higher frequency range (30 kHz – 1 MHz).
Figure 7.
(a) Box plot of lateral displacement of streamlines from orifice for samples of healthy RBCs (h-RBCs) and fixed RBCs (f-RBCs) (1% glutaraldehyde) under conditions of: no stimulation and 80Vpp stimulation at 40kHz and 200kHz, to indicate the spatial separation under the respective conditions. Normalized distance probability densities under: (b) 80Vpp at 40kHz stimulation wherein h-RBCs and f-RBCs show nDEP; and (c) 80Vpp at 200kHz wherein h-RBCs show pDEP and f-RBCs show nDEP. Color corrected stacked images of h-RBCs and f-RBCs under 80Vpp at: (d) 40kHz; and (e) 200 kHz (video in ESI).
DEP separation of heterogeneous samples:
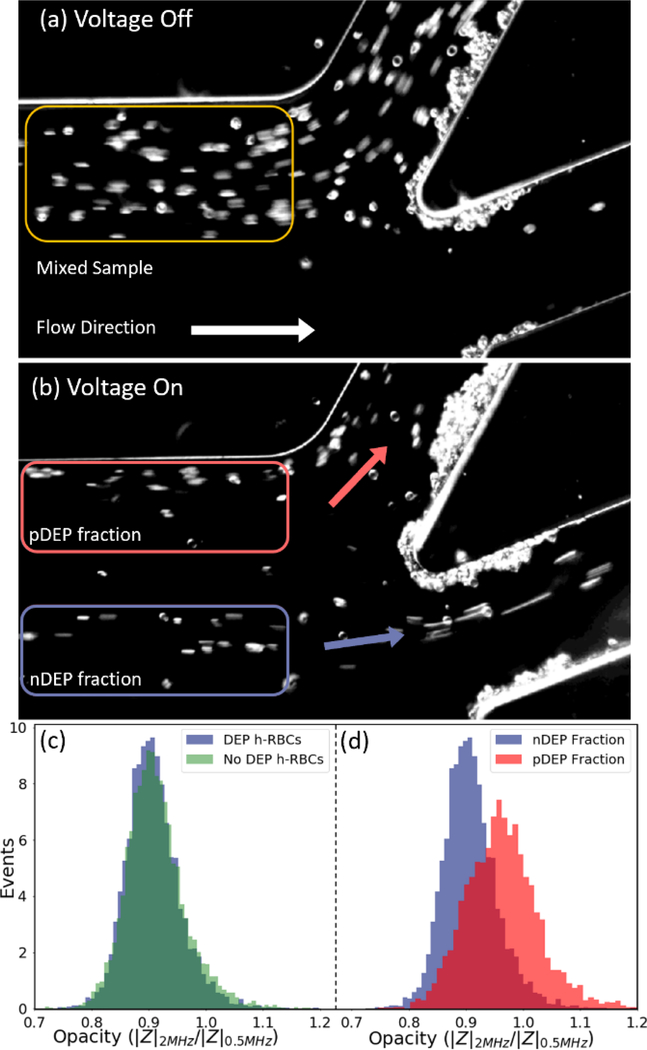
Based on these collection gates, outlets were designed to separate a heterogeneous sample of h-RBCs and f-RBCs (50%-50%) under 3.6 μL/min flow rate using 100 Vpp at 300 kHz, so that sufficient levels of each separated fraction (Fig. 8a & 8b) could be collected for downstream phenotypic measurement by single-cell impedance cytometry in differential mode54. In this manner, cells in each separated fraction can be characterized based on their electrical opacity levels (inverse membrane capacitance) to ascertain: (i) maintenance of cell membrane fidelity after DEP separation by comparison to the sample before DEP separation; and (ii) selectivity of separation for membrane capacitance differences. At low frequencies (e.g. 0.5 MHz), the lipid cell membrane has an insulator-like behaviour, as the field screens around the cell, which can be used to estimate their size. However, for increasing frequencies (e.g. 2 MHz), capacitive coupling across the cell membrane renders cells to become more conductive and present a Debye relaxation. Electrical opacity, calculated as the ratio of impedance magnitude at mid-frequency (2 MHz) to that at low frequency (0.5 MHz), is used as a size-normalized metric for inverse of the cell membrane capacitance to compare the respective cells55. The high degree of overlap of the histograms (~10,000 measured events) for h-RBCs before and after DEP collection (Fig. 8c) validates the maintenance of cell viability during DEP separation in this device. Alternate metrics of electrical diameter and impedance phase at 2 MHz to compare h-RBCs before vs. after DEP are shown in ESI: Fig. S5. On the other hand, the higher electrical opacity of the nDEP collected versus the pDEP collected fraction (Fig. 8d) is attributed to the nDEP fraction composed of f-RBCs and pDEP fraction composed of h-RBCs, as shown in ESI: Fig. S4. This validates the phenotypic selectivity of the DEP separation of cells in this device, based on phenotypic metrics determined from impedance cytometry.
Figure 8.
Imaged cell streamlines at the collection channels before (a) and after (b) DEP separation, shows a low membrane capacitance fraction (presumably f-RBCs) exhibiting nDEP and a high membrane capacitance fraction (presumably h-RBCs) exhibiting pDEP under 100 Vpp at 300 kHz, at a sample flow rate of 3.6 μl/min. The separated fractions measured downstream by single-cell impedance cytometry (10,000 events for each cell type) show: (c) invariance of electrical opacity of collected h-RBCs before versus after DEP through the device; (d) distinctly higher electrical opacity (lower membrane capacitance) for the collected nDEP fraction versus the pDEP fractions. (video in ESI)
Conclusion
We present a facile method to create a sequential set of self-aligned field non-uniformities across the sample channel for enabling progressive dielectrophoretic deflection of cells under nDEP and pDEP, as obtained by controlling frequency of the applied field. The geometry of the field non-uniformity and focusing position of the starting sample could be optimized to enable nDEP and pDEP deflection within the same device structure. The metal electrodes in the microfabricated device extend along the entire depth of the channel (50 μm) and the sequential field non-uniformities extend over much of the channel width (100 μm). As a result, by adjusting the stimulation field to low frequencies (40 kHz), nDEP deflection of healthy RBCs was possible at high sample flow rates (12 μL/min) and high sample throughput levels (6.78 × 10⁵ cells/min), while pDEP was apparent at higher frequencies (>200 kHz) using intermediate flow rate levels (0.24–5 μL/min). Based on this, a collection gate was set to separate the streamlines of healthy RBCs that exhibit pDEP versus those of fixed RBCs that exhibit nDEP at 200 kHz stimulation voltage. Phenotype-specific cell separation on this device is validated using heterogeneous samples of healthy and fixed RBCs (50% each), based on electrical opacity differences between the respective collected fractions after DEP separation that reflects their expected capacitance differences, while invariance of electrical opacity of DEP collected versus input h-RBCS confirms the maintenance of cell functionality after DEP separation.
Supplementary Material
Acknowledgements
This research was sponsored by the Office of the Secretary of Defense under Agreement Number W911NF-17–3-003 (Subcontract T0163) and National Center for Advancing Translational Sciences of the National Institutes of Health (NIH) under Award Number UL1TR003015, and Seed Grants from University of Virginia’s Cancer Center, the Global Infectious Diseases Institute and the 3 Cavalier’s grant.
Footnotes
Electronic Supplementary Information (ESI) available: on field profile simulations, image and statistical analysis, membrane capacitance validation, impedance cytometry methods and full videos of the separations from Fig. 6 – Fig. 8. See DOI: 10.1039/D0LC01211D
Conflicts of interest
The authors have no financial interests related to this work.
Notes and references
- 1.Perkins TJ and Swain PS, Mol Syst Biol, 2009, 5, 326. [DOI] [PMC free article] [PubMed] [Google Scholar]
- 2.K K and F F, Anal Chim Acta, 2013, 800, 12–21. [DOI] [PubMed] [Google Scholar]
- 3.Rubakhin SS, Romanova EV, Nemes P and Sweedler JV, Nat Methods, 2011, 8, S20–29. [DOI] [PMC free article] [PubMed] [Google Scholar]
- 4.Cros J, Raffenne J, Couvelard A and Poté N, PAT, 2018, 85, 64–71. [DOI] [PubMed] [Google Scholar]
- 5.Wlodkowic D, Skommer J and Darzynkiewicz Z, Cytometry A, 2010, 77, 591–606. [DOI] [PMC free article] [PubMed] [Google Scholar]
- 6.Friedman AA, Letai A, Fisher DE and Flaherty KT, Nat Rev Cancer, 2015, 15, 747–756. [DOI] [PMC free article] [PubMed] [Google Scholar]
- 7.Lee AP, Aghaamoo M, Adams TNG and Flanagan LA, Curr Stem Cell Rep, 2018, 4, 116–126. [DOI] [PMC free article] [PubMed] [Google Scholar]
- 8.McGrath JS, Honrado C, Moore JH, Adair SJ, Varhue WB, Salahi A, Farmehini V, Goudreau BJ, Nagdas S, Blais EM, Bauer TW and Swami NS, Anal Chim Acta, 2020, 1101, 90–98. [DOI] [PMC free article] [PubMed] [Google Scholar]
- 9.Yale AR, Nourse JL, Lee KR, Ahmed SN, Arulmoli J, Jiang AYL, McDonnell LP, Botten GA, Lee AP, Monuki ES, Demetriou M and Flanagan LA, Stem Cell Reports, 2018, 11, 869–882. [DOI] [PMC free article] [PubMed] [Google Scholar]
- 10.Petchakup C, Tay HM, Li KHH and Hou HW, Lab Chip, 2019, 19, 1736–1746. [DOI] [PubMed] [Google Scholar]
- 11.Wlodkowic D and Cooper JM, Anal Bioanal Chem, 2010, 398, 193–209. [DOI] [PubMed] [Google Scholar]
- 12.Yang R, Fu L and Hou HH, Sensors and Actuators B: Chemical, 2018, 266, 26–45 [DOI] [PMC free article] [PubMed] [Google Scholar]
- 13.Guck J, Schinkinger S, Lincoln B, Wottawah F, Ebert S, Romeyke M, Lenz D, Erickson HM, Ananthakrishnan R, Mitchell D, Käs J, Ulvick S and Bilby C, Biophysical Journal, 2005, 88, 3689–3698. [DOI] [PMC free article] [PubMed] [Google Scholar]
- 14.Kraning-Rush CM, Califano JP and Reinhart-King CA, PLOS ONE, 2012, 7, e32572. [DOI] [PMC free article] [PubMed] [Google Scholar]
- 15.Gascoyne PRC and Shim S, Cancers (Basel), 2014, 6, 545–579. [DOI] [PMC free article] [PubMed] [Google Scholar]
- 16.Pohl HA, Journal of Applied Physics, 1951, 22, 869–871. [Google Scholar]
- 17.Pethig R, Biomicrofluidics, 2010, 4, 022811. [DOI] [PMC free article] [PubMed] [Google Scholar]
- 18.Morgan H and Green NG, AC electrokinetics: Colloids and Nanoparticles, Research Studies Press, Philadeliphia, PA, 2003 [Google Scholar]
- 19.Gagnon ZR, Electrophoresis, 2011, 32, 2466–2487. [DOI] [PubMed] [Google Scholar]
- 20.Gascoyne PRC, Shim S, Noshari J, Becker FF and Stemke-Hale K, Electrophoresis, 2013, 34, 1042–1050. [DOI] [PMC free article] [PubMed] [Google Scholar]
- 21.Fernandez RE, Rohani A, Farmehini V and Swami NS, Anal Chim Acta, 2017, 966, 11–33. [DOI] [PMC free article] [PubMed] [Google Scholar]
- 22.Jundi B, Ryu H, Lee D-H, Abdulnour R-EE, Engstrom BD, Duvall MG, Higuera A, Pinilla-Vera M, Benson ME, Lee J, Krishnamoorthy N, Baron RM, Han J, Voldman J and Levy BD, Nat Biomed Eng, 2019, 3, 961–973. [DOI] [PMC free article] [PubMed] [Google Scholar]
- 23.Rohani A, Moore JH, Kashatus JA, Sesaki H, Kashatus DF and Swami NS, Anal. Chem, 2017, 89, 5757–5764. [DOI] [PMC free article] [PubMed] [Google Scholar]
- 24.Martinez-Duarte R, Electrophoresis, 2012, 33, 3110–3132. [DOI] [PubMed] [Google Scholar]
- 25.Cummings EB and Singh AK, Anal. Chem, 2003, 75, 4724–4731. [DOI] [PubMed] [Google Scholar]
- 26.Lapizco-Encinas BH, Electrophoresis, 2019, 40, 358–375. [DOI] [PubMed] [Google Scholar]
- 27.Wang X-B, Yang J, Huang Y, Vykoukal J, Becker FF and Gascoyne PRC, Anal Chem, 2000, 72, 832–839. [DOI] [PMC free article] [PubMed] [Google Scholar]
- 28.Piacentini N, Mernier G, Tornay R and Renaud P, Biomicrofluidics, 2011, 5, 034122–034122–8. [DOI] [PMC free article] [PubMed] [Google Scholar]
- 29.Sun M, Agarwal P, Zhao S, Zhao Y, Lu X and He X, Anal Chem, 2016, 88, 8264–8271. [DOI] [PMC free article] [PubMed] [Google Scholar]
- 30.Zhang J, Yuan D, Zhao Q, Yan S, Tang S-Y, Tan SH, Guo J, Xia H, Nguyen N-T and Li W, Sensors and Actuators B: Chemical, 2018, 267, 14–25. [Google Scholar]
- 31.Vahey MD and Voldman J, Anal Chem, 2009, 81, 2446–2455. [DOI] [PMC free article] [PubMed] [Google Scholar]
- 32.Wang L, Lu J, Marchenko SA, Monuki ES, Flanagan LA, Lee AP, Electrophoresis, 2009, 30, 782–791 [DOI] [PubMed] [Google Scholar]
- 33.Beech JP, Keim K, Ho BD, Guiducci C and Tegenfeldt JO, Advanced Materials Technologies, 2019, 4, 1900339. [Google Scholar]
- 34.Lewpiriyawong 34N, Yang C and Lam YC, Electrophoresis, 2010, 31, 2622–2631. [DOI] [PubMed] [Google Scholar]
- 35.Lewpiriyawong 35N, Kandaswamy K, Yang C, Ivanov V and Stocker R, Anal Chem, 2011, 83, 9579–9585. [DOI] [PubMed] [Google Scholar]
- 36.Zhao 36K, Larasati, Duncker BP and Li D, Anal. Chem, 2019, 91, 6304–6314. [DOI] [PubMed] [Google Scholar]
- 37.Siegel 37AC, Tang SKY, Nijhuis CA, Hashimoto M, Phillips ST, Dickey MD and Whitesides GM, Acc Chem Res, 2010, 43, 518–528. [DOI] [PMC free article] [PubMed] [Google Scholar]
- 38.So J-H and Dickey MD, Lab Chip, 2011, 11, 905–911. [DOI] [PubMed] [Google Scholar]
- 39.Herling TW, Müller T, Rajah L, Skepper JN, Vendruscolo M and Knowles TPJ, Appl. Phys. Lett, 2013, 102, 184102. [Google Scholar]
- 40.Yang D, Zhou Y, Zhou Y, Han J and Ai Y, Biosens Bioelectron, 2019, 133, 16–23. [DOI] [PubMed] [Google Scholar]
- 41.Panwar J, Roy R, Microelectronic Engineering, 2019, 215, 111010. [Google Scholar]
- 42.Zhu B, Cai Y, Wu Z, Niu F and Yang H, IEEE Access, 2019, 7, 152224–152232. [Google Scholar]
- 43.Moon H-S, Kwon K, Kim S-I, Han H, Sohn J, Lee S and Jung HI, Lab Chip, 2011, 11, 1118–1125. [DOI] [PubMed] [Google Scholar]
- 44.Cheung K, Gawad S, Renaud P, Cytometry Part A, 2005, 65, 124–132. [DOI] [PubMed] [Google Scholar]
- 45.Honrado C, McGrath JS, Reale R, Bisegna P, Swami NS, Caselli F, Anal Bioanal Chem, 2020, 412, 3835–3845 [DOI] [PMC free article] [PubMed] [Google Scholar]
- 46.Moore JH, Salahi A, Honrado C, Warburton C, Warren CA, Swami NS, Biosensors and Bioelectronics, 2020, 15, 166: 112440. [DOI] [PMC free article] [PubMed] [Google Scholar]
- 47.Salahi A, B Varhue W, Farmehini V, R Hyler A, Schmelz EM, Davalos RV, Swami NS, Analytical and bioanalytical chemistry, 2020, 412 (16), 3881–3889. [DOI] [PMC free article] [PubMed] [Google Scholar]
- 48.Farmehini V, Rohani A, Su Y-H, Swami NS; Lab Chip, 2014, 14, 4183–4187 [DOI] [PubMed] [Google Scholar]
- 49.Farmehini V, Varhue W, Salahi A, Hyler AR, Cemažar J, Davalos R and Swami NS, IEEE Trans. Biomed. Eng, 2020, 67, 1664–1671. [DOI] [PubMed] [Google Scholar]
- 50.Torres-Castro K, Honrado C, Varhue WB, Farmehini V, Swami NS, Anal. Bioanal. Chem, 2020, 412, 3847–3857. [DOI] [PMC free article] [PubMed] [Google Scholar]
- 51.Cottet J, Fabregue O, Berger C, Buret F, Renaud P, Frénéa-Robin M, Biophysical journal, 2019, 116, 12–8. [DOI] [PMC free article] [PubMed] [Google Scholar]
- 52.Ren Y, Liu W, Jia Y, Tao Y, Shao J, Ding Y, Jiang H, Lab Chip. 2015; 15, 2181–2191. [DOI] [PubMed] [Google Scholar]
- 53.Ren Y, Liu W, Tao Y, Hui M, Wu Q, Micromachines 2018, 9, 102. [DOI] [PMC free article] [PubMed] [Google Scholar]
- 54.Honrado C, Bisegna P, Swami NS, Caselli F, Lab Chip 2021, 21, 22–54. [DOI] [PMC free article] [PubMed] [Google Scholar]
- 55.Honrado C, Michel N, Moore JH, Salahi A, Porterfield V, McConnell MJ, and Swami NS, ACS Sensors 2021, DOI: 10.1021/acssensors.0c02022. [DOI] [PubMed] [Google Scholar]
Associated Data
This section collects any data citations, data availability statements, or supplementary materials included in this article.


