Abstract
In this paper, a wheel structured Zeonex-based hexagonal packing photonic crystal fiber (PCF) sensor has been proposed for sensing camel milk with a refractive index of 1.3423 and cow milk with a refractive index of 1.3459. This sensor has been investigated for porosities of 85%, 90%, and 98% within a terahertz (THz) region ranging from 0.2 to 2.0 THz. At an operating frequency of 2 THz, this sensor has shown a maximum sensitivity of 81.16% and 81.32% for camel and cow milk, respectively. EML of 0.033013 cm−1 and 0.03284 cm−1 has been found for camel and cow milk, respectively, at the same operating conditions with negligible confinement losses of 8.675 10–18 cm−1 1.435 10–18 cm−1. Several other parameters, such as the effective area, flattened dispersion, and numerical aperture, have also been obtained during the investigation. Since considerable attention has not been given yet in detecting various types of dairy products using PCF terahertz sensors, this design will pave a whole new path in further implementing THz sensing in the dairy industry.
Keywords: PCF, MTIR, THz Sensor, Sensitivity, Core power fraction, Porosity, Confinement loss
Introduction
The dairy farming industry is significantly expanding in Australia, the United States, New Zealand, and other developing countries even in this period of COVID-19 due to its impressive nutritional characteristics and affordability. Milk is packed with all vital nutrients like proteins, vitamins, milk sugar, and low fat of about 3%, making it a complete food. Among all the animal milk, cow and camel milk have excellent health benefits for all age groups, from the weaning age to the elderly. They are rich in minerals such as calcium, sodium, potassium, riboflavin, phosphorus, magnesium, zinc, etc. They are also enriched with healthy fats, containing hundreds of saturated and unsaturated fatty acids, such as conjugated linoleic acid, omega-3 fatty acids, and so forth. Surprisingly, milk's fat contents help reduce risks that come with obesity and protect brain and heart health. Due to these advantages, biosensors have been proposed for cow and camel milk sensing. This is crucial in dairy industries for the study of physiochemical properties of milk for quality checking and production, etc. [1]
Sensing with terahertz (THz) radiation has drawn much attention in recent years. THz band in the electromagnetic spectrum ranges from 100 GHz to 10 THz or wavelengths between 3 mm and 30 μm. Due to its low penetration depth, non-destructiveness, and non-invasiveness, THz technology is making rapid progress in spectroscopy, telecommunication, medical imaging, sensing, and what not [2]. Specifically for sensing applications, this band has shown excellent results compared to microwave or IR bands. An ordinary THz system has three main components: source, detector, and wave guidance. THz sources and detectors are commercially available, whereas the THz waveguide medium needs much attention due to its high loss property. Recently, micro-structured fiber or Photonic crystal fiber (PCF) [3, 4] has been gradually becoming popular as THz waveguide for sensing mechanism due to its high core power fraction, low confinement loss, low material absorption loss, low scattering, and so [5–7]. Moreover, PCF sensors tend to have a substantial interaction property of THz power with various analytes, which results in higher sensitivity. All these unique characteristics make it an excellent candidate for sensing applications in the THz region. The light-matter interaction in a PCF sensor can occur on the outside fiber or in the core of the fiber. Only the inside core-light interaction is considered here.
In the recent decade, there have been extensive designing and use of PCF sensors in THz territory in the fields of medical imaging [8], telecommunication [5, 9–11], spectroscopy [12–14], bio-sensing [15–20], healthcare [21, 22], environmental applications [23], pharmaceutical drug testing [24, 25], and sensing applications [26–28] owing to its high flexibility in structural fabrications achieved by variations in the designing of core and cladding features. Recently, PCF-based biosensors have been employed for detecting a variety of bio-targets, proteins, nucleic acids, chemical and biological components [6, 29–31] with high efficiency and selectivity.
PCF is a relatively new optical fiber category where periodic micro-capillaries are formed as fiber cladding in a background material with different refractive indexes. PCF can also be used as a sensor when these micro-capillaries or cladding holes are filled with materials to be sensed along with transmission purposes. The light-guiding mechanism in PCF is quite different from the conventional optical fibers and dependent on the fiber structure. Traditional optical fibers utilize total internal reflection (TIR) to guide the light via the fiber core. This is accomplished by keeping the core refractive index bigger than that of cladding, and this difference in refractive indexes causes the light confinement within the core. In the case of PCF, light is guided by two principal schemes. One is modified total internal reflection (MTIR) used in solid core PCFs, where light is confined in a higher refractive index region [4, 8]. The other one is the photonic bandgap (PBG) mechanism employed in hollow-core fibers, where the light is confined in a lower refractive index region than that of the adjacent area [32–34]. In recent times, another class of PCF has been getting more attention from researchers. Both core and cladding of this PCF are micro-structured. Several regular and irregular structures of PCF like square [35], hexagonal [36], elliptical [37], octagonal [38], decagonal [39], kagome [40], and honeycomb cladding [41] are developed to attain more efficiency and to use in versatile applications. Other modified geometric structures have also been proposed in the THz regime for sensing and bio-sensing applications to improve performance.
In 2018, Islam et al. [42] presented a modified hexagonal PCF-based chemical sensor and experimented with different chemicals along with ethanol to observe its performance. The numerical demonstration showed 53.22% sensitivity in ethanol detection, which was highest for the porous core at that time. It also gave significantly better results in confinement loss, beam divergence, and nonlinearity. In the same year, Islam et al. [43] proposed a chemical analyte detector based on complex kagome architecture, and it attained the highest relative sensitivity of 86% using asymmetric core structure. However, irregular structures like kagome are quite difficult to implement using existing fabrication techniques. In 2019, Hasan et al. [44] proposed a heptagonal photonic crystal fiber (H-PCF) to identify various chemical substances in the terahertz regime. Their proposed sensor had relative sensitivity of 63.24% for benzene at f = 1.0 THz with a better core power fraction outcome. In June 2020, Md. Jayed Bin Murshed Leon et al. [45] proposed a highly birefringent and low loss liquid sensing PCF with porous core. It produced a high birefringence of 0.008; however, the low sensitivity of 49.13%. In the same year, Rahman et al. [21] mentioned a PCF-based THz sensor to sense cholesterol in liquid samples, such as human blood, cooking oil, liquid foods, etc., with an octagonal-shaped hollow core with eight head star cladding structure. This PCF structure exhibits a high sensitivity of 98.75% for cholesterol-sensing situations.
Another Zeonex-based PCF with a hollow core design surrounded by asymmetric cladding is proposed by Islam et al. [15] for biochemical analyte detection in the THz band. This sensor yields a maximum chemical sensitivity of 99.76%, a lowest EML record of 0.0002 cm−1, and waveguide dispersion of 0.055 ps/THz/cm at 1.8 THz frequency [38]. Further dispersion from 1.8 to 3 THz is noticed as flat. This flat nature in dispersion is very much desirable in PCF sensor designing as it indicates a reduction in pulse broadening, thereby decreasing the probability of bit error rate. In [25], Islam et al. suggested a new PCF design consisted of a spiderweb-like hollow core for chemical sensing and achieved nearly 100% sensitivity, an extremely low EML, and a more improved dispersion than previously proposed papers. The noticeable thing among these papers is that hollow-core PCFs provide more sensitivity (~ 100%) than porous core PCFs (~ 80%). Although hollow-core fibers show high sensitivity, low loss, and low dispersion characteristics, they are very much prone to other problems such as micro and macro-bending losses [46], polarization mode dispersion, and multipath interference. Additionally, the fabrication of hollow-core photonic crystal fibers is significantly more complex than solid fibers due to the high precision controlling of hollow microstructure during the draw. Micro-structured core or porous core PCF has been innovated in sensing applications to avoid the hollow core's undesirable effects.
Along with the core-cladding arrangements, the background material in PCF also significantly impacts sensing characteristics, confinement loss, bulk absorption loss, effective area, and few other matters. Several polymer materials such as Topas, Teflon, and Zeonex are preferred as surrounding substances in the photonic crystal fiber (PCF) to achieve high relative sensitivity, high effective area, enhanced core power fraction, and low confinement loss [47].
Apparently, various PCF sensors have been proposed in the THz domain to sense chemicals, liquids, or even vapors. Very recently, Biswas et al. [48, 49] presented a 2-D photonic crystal-based micro-ring resonator (PhC-based MRR) as an RI sensor to sense water and other fat contents in milk samples. The experiments were done in the infrared frequency range.
In this paper, a unique porous core PCF design has been proposed for sensing camel and cow milk. The investigation is performed in a frequency range between 0.2 and 2.0 THz. The PCF structure is designed with a circular sectored cladding and a hexagonal-shaped core composed of air holes. The maximum sensitivity of 81.16% and 81.32% is attained at a frequency of f = 2 THz for camel and cow milk, respectively. Negligible confinement losses of 8.675 10–18 cm−1 for camel milk and 1.435 10–18 cm−1 for cow milk are achieved. Flattened dispersion of is also obtained here. Fabrication feasibility and numerical outcomes indicate that our proposed PCF sensor can be highly acceptable in milk sensing. As far as we know, no previous study yielded PCF sensors for milk sensing. Thus, this type of sensor can unlock a whole new approach in dairy industries. Moreover, employing THz power may bring new insights into milk sensing applications.
Design methodology
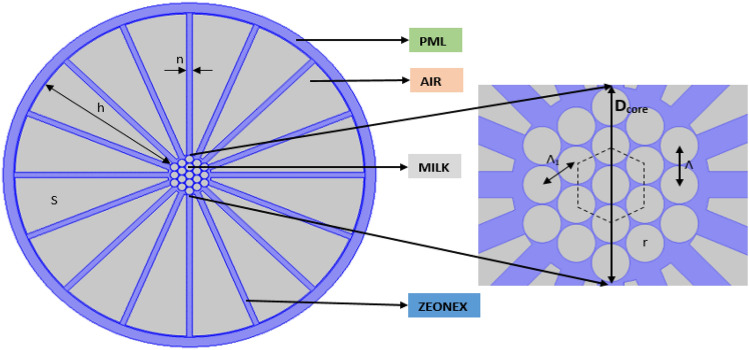
The 2D cross-sectional arrangement of the proposed Zeonex-based THz PCF sensor is shown in Fig. 1, along with a comprehensive view of the hexagonal core structure. The structure of the following fiber is designed by using the finite element method (FEM)-based commercially available software COMSOL Multiphysics 5.3b.
Fig. 1.
Cross-sectional view of the proposed PCF sensor with an amplified view of the core section
Air is used as a material for the cladding region. Zeonex is used as a background material due to its various useful properties in comparison to other materials. It has a constant refractive index of 1.529 over a wide range of frequencies [50]. Another benefit of Zeonex is its low bulk material absorption loss of 0.2 cm−1. The symmetrical cladding structure is formed by placing sixteen non-circular air segments identified by s. This distance between end to endpoints of each segment is n. The height of each air segment is denoted by h. The height is constant for all segments, which is 2065 µm. Nineteen circular holes are hexagonally arranged in the core. The radius of each circular hole is denoted by r. Two hexagon-shaped rings surround the central circular hole in the core region. The first hexagonal ring comprises six circular air holes, while 12 circular holes are used in the second hexagonal ring. The distance between two adjacent circular holes lying in the same ring is denoted by and lying in the other ring denoted by 1. The total diameter of the core region is represented by Dcore. Camel milk with a refractive index of 1.3423 and cow milk with a refractive index of 1.3459 are used in the core section as sensing analytes [1]. The proposed PCF is surrounded by a (PML) perfectly matched layer, which acts as a boundary of the computational domain allowing waves to pass through without any reflection. It also acts as an anti-reflective layer. The PML of this proposed fiber is 5.7% of the total radius of the fiber.
Results and discussion
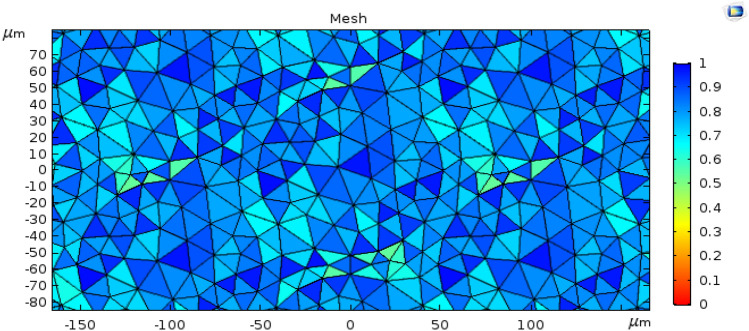
In order to get the utmost exact result in the simulation, a user-controlled mesh size is employed. The complete mesh of the fiber consists of 75,200 domain elements, 8145 edge elements, 148 vertex elements, and the average element quality is 0.8213, minimum element quality 0.4095, element area ratio 0.001483, mesh area 19,320,000 µm2. The maximum and minimum element size of the mesh is 3137 µm and 29.8 µm, respectively, maximum element growth rate 1.5, curvature factor 0.6, resolution of narrow region 1. The mesh resolution can be seen in Fig. 2.
Fig. 2.
Mesh resolution
The electromagnetic field distribution for the proposed sensor, with camel milk and cow milk as the target analyte, was observed between a frequency region of 0.2 THz to 2.0 THz, and the results are shown in Fig. 3. It is suggested that the light is tightly constricted within the core, indicating strong interactions with the core and target samples for both x and y polarization modes, whereas little interaction is seen with the cladding section. Here, only x-polarization was considered to find the several sensor parameters. The EM field interaction was also investigated at different porosities of the air holes, which can be seen in Fig. 3a–f, respectively.
Fig. 3.
Mode field scheme of the proposed fiber for a and b x-polarization and y polarization at 98%porosity c and d x-polarization and y-polarization at 90% porosity, e and f x-polarization and y-polarization at 85% porosity
Several important guiding characteristics of the THz waveguide have been analyzed in this section.
To determine the responsiveness of the PCF, one of the crucial factors is its relative sensitivity. It determines the amount of light interaction with the analyte sample. It can be numerically evaluated by the given expression [40]:
| 1 |
where, and are the refractive index of the targeted sample and effective refractive index at that particular frequency, respectively. The percentage ratio of the air hole power and total power, i.e., the power fraction, is denoted by . It can be calculated by the given expression:
| 2 |
where, distinctly represent transverse electric fields and represent transverse magnetic fields of the fundamental guided mode [15].
The impact of various frequencies on the sensitivity of the PCF with cow milk as the analyte can be seen in Fig. 4. It can be observed that the sensitivity increases with an increment in frequency up to 1.4 THz then remains unchanged. The characteristics of higher-frequency electromagnetic signals are responsible for this phenomenon since they always try to propagate inside a zone of higher refractive index [51]. As frequency increases, more light propagates through the core and, thus, confined within the core region, resulting in higher light-analyte interaction and higher sensitivities.
Fig. 4.
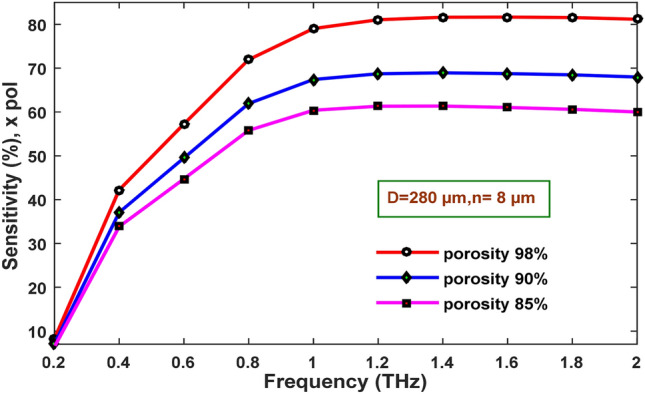
Relative Sensitivity versus frequency for different core porosities with cow milk as the target sample
The porosity of the core also affects the sensitivity of the PCF, as shown in Fig. 4. The porosity of the core is defined as the fraction of the air holes area in the core region compared to the total core area. At higher core porosities, the air holes expanded in size enable more light guidance through the core, and hence more interaction of light with the analyte occurs. This results in higher sensitivities at higher porosities. At 98% core porosity, a maximum sensitivity of 81.16% is obtained at frequency 2 THz for x-polarization mode.
An overall relationship of the frequency with the sensitivity for both kinds of dairy analyte samples, i.e., cow milk and camel milk, is shown in Fig. 5. The curves depict that cow and camel milk's sensitivities increase within a low-frequency range of 0.2–1.6 THz and afterward initiate to reduce with the high-frequency range from 1.6 to 2.0 THz. The initial rise is due to greater light-analyte interaction. The relative sensitivity of cow milk is found to be slightly higher than camel milk due to its higher refractive index.
Fig. 5.
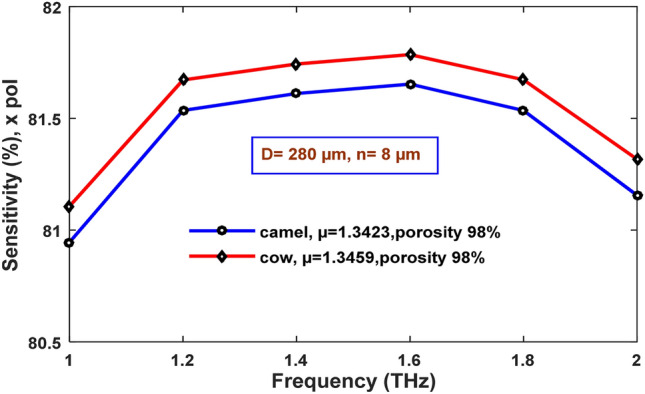
The sensitivity variation with frequency for different dairy milk over the frequency ranging from 1.0 to 2.0 THz
It is to be noted that due to the small difference in the refractive index of the analytes under investigation, there are almost similar sensitivities for both the samples at optimum design parameter of 98% porosity, strut size 8 µm, and core diameter 280 µm.
The fraction of power transmitted through core air holes of the proposed PCF with increasing frequency is shown in Fig. 6. An increase in power fraction with incremental frequency indicates a larger proportion of light propagated through the core air holes, suggesting that the intensity of the beam is more concentrated within the core [52].
Fig. 6.
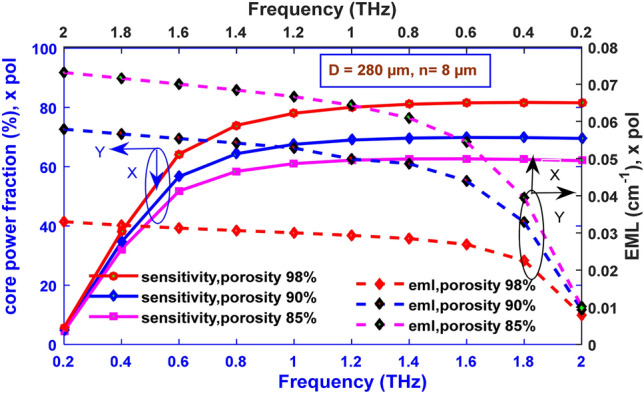
Core Power fraction and EML versus frequency for a frequency ranging from 0.2 to 2.0 THz for camel milk
One of the most significant performance parameters for a PCF is the effective material loss (EML) or effective absorption loss. To enhance the sensing capabilities of a PCF for the THz wave guidance, a minimal amount of material absorption loss is imperative. This is obtained by selecting proper background material for both the core and cladding regions and proper geometrical arrangements.
The behavior of EML with various frequencies at different porosities is indicated in Fig. 6. For instance, at an operating frequency of 2 THz, a minimum EML of 0.033013 cm−1 at a porosity of 98% and 0.057901 cm−1 at a porosity of 90% are found for camel milk.
At higher core porosities, EML losses are lower since a higher porosity indicates that the volume of the air holes in the core is larger in contrast to that of the background material. As a result, a lesser amount of light is associated with the background material resulting in lower material losses [23]. More light resides within the core region and is trapped by the solid material at a higher frequency. As a result, the EML increases with frequency at a particular geometric condition [53].
At optimum values of porosity of 98%, the core diameter of 280 µm, and strut of 8 µm, the EML variations with frequency are illustrated in Fig. 7. With the rise of frequency, background material Zeonex absorbs more light, indicating higher material loss [52]. This relation between EML and frequency can also be explained by the empirical equation (dB/cm) The operating frequency is stated as in this equation [54]. This equation shows that EML increases linearly with frequency.
Fig. 7.
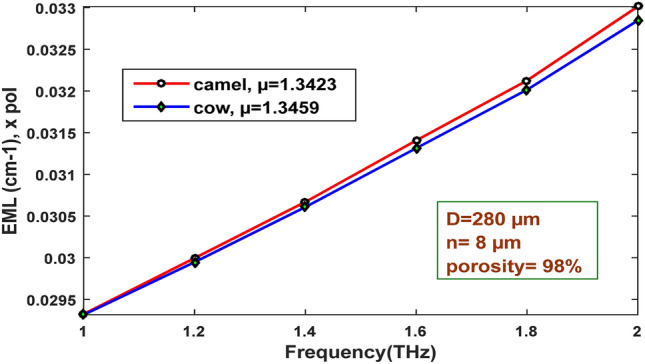
EML variation with respect to frequency for porosity 98%, D = 280 µm, n = 8 µm for cow and camel milk
There is a slight difference in the refractive indexes for cow and camel milk. Thus, the values of EML at different frequencies are quite similar to each other for both kinds of milk. For the above-mentioned optimum design parameters, the EML of camel milk is found to be 0.033013 cm−1 for an operating frequency of 2 THz, whereas that for cow milk is 0.032824 cm−1.
The sensitivity of the proposed design increases with an increase in porosity, which is depicted in Fig. 8. A rise in porosity indicates the greater volume of analyte interacts with the light, hence impacting the overall sensitivity of the design. It is also noticeable from Fig. 9 that a change in core diameter has a lesser influence on the sensitivity of the fiber because the operating frequency is 2 THz (operating wavelength = 150 µm), and the wavelength of this light is lower than that of the core diameter which is between 260 and 400 µm. As a result, the light is wholly confined within the core, and the sensor has minor changes in sensitivity regardless of diameter variations. The sensitivity of 81.626% and 77.272% can be found for porosity 98% at core diameter of 260 µm and 400 µm, respectively. For 90% and 85% of porosities, maximum sensitivities of 69.714% and 62.319% are found for a core diameter of 260 µm. A similar trend is being followed in Fig. 9 in the case of core power fraction with respect to the change of core diameter.
Fig. 8.
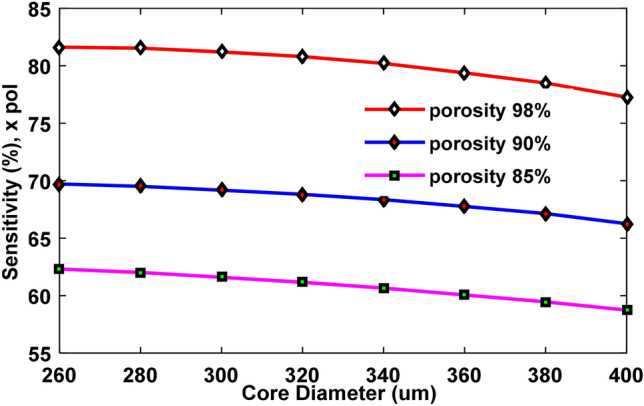
Variation of sensitivity with respect to core diameter ranging from 260 to 400 µm for n = 8 µm and f = 2 THz and different porosities
Fig. 9.
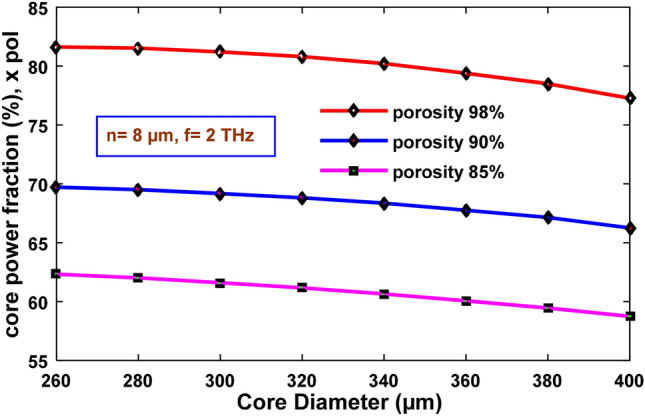
Variation of core power fraction with respect to core diameter ranging from 260 to 400 µm for n = 8 µm and f = 2 THz and different porosities
For 98% porosity, the core power fraction changes from 81.626 to 77.272% for the core diameter ranging from 260 to 400 µm. The highest core power fractions are 69.714% and 62.319% for 90% and 85% porosities, respectively, for 260 µm core diameter.
The sensitivity of the proposed design reduces with an enlargement of strut size ranging from 8 to 50 µm, as illustrated in Fig. 10. The highest sensitivities achieved are 81.16%, 67.96%, and 60% for respective 98%, 90%, and 85% porosities when the strut value is fixed at 8 µm.
Fig. 10.
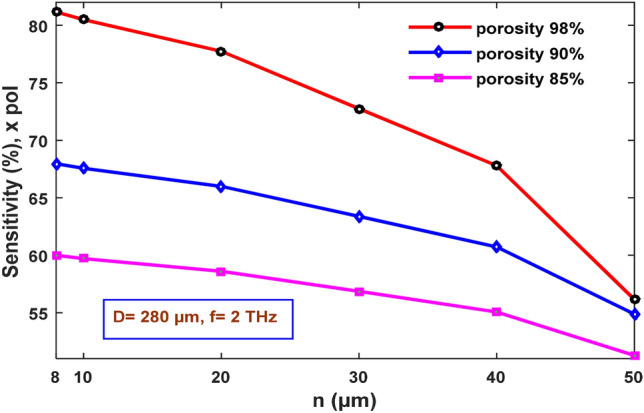
Variation of sensitivity with respect to strut values ranging from 8 to 50 μm for 98%, 90%, and 85% porosity and D = 280 µm and f = 2 THz
Higher core power fraction and lower EML are two desirable factors in the case of designing terahertz sensors. In Fig. 11, the core power fraction is seen to decline with the enhancement of strut size. Core power fraction changes from 81.573 to 57.184% for the strut value ranging from 8 to 50 µm in the case of 98% porosity. The highest values of core power fractions of 69.538% and 62.041% are found for the porosities of 90% and 85% when the strut value is kept 8 μm for both cases.
Fig. 11.
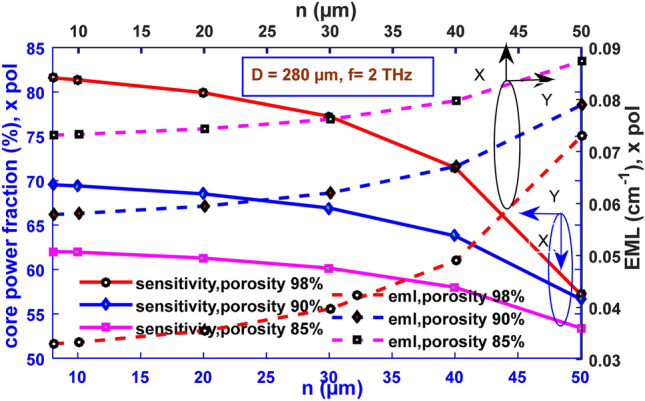
Core power fraction and EML as functions of strut ranging from 8 to 50 µm for D = 280 µm and f = 2 THz
Since a rise in strut size indicates the extension of the amount of background material used, it aids in higher values of effective material loss. The lowest values of EML are found to be 0.033013 cm−1, 0.057901 cm−1, 0.073161 cm−1 for porosity of 98%, 90% and 85%, respectively, for the strut value of 8 μm. From Figs. 10, 11, it can be concluded that the highest values of sensitivity, core power fraction, and lowest value of EML are found for the strut size of 8 μm for which it is taken as the optimum value of strut in this design.
The effective estimation of the area within the core which is confined by light is called the effective cross-sectional area (). Electromagnetic wave propagation happens within this region. The effective area can be calculated as follows [55].
| 3 |
It is also related to the intensity distribution of transverse electric field, .
Figure 12 indicates the effects of various frequencies on the effective area at various porosities, while Fig. 13 suggests a similar relation but for optimum design parameters. At higher frequency, the light gets more confined within the core, so the effective cross-sectional area is seen to decline [56]. In case of camel milk, at a porosity of 98%, the effective area changes from 4.97 10–6 m2 to 9.38 10–8 m2, within the given frequency range between 0.2 and 2 THz. Similarly, it changes from 4.92 10–6 m2 to 8.74 10–8 m2 for the porosity of 90% and from 8.43 10–8 m2 to 9 10–6 m2 at a porosity of 85%. The lowest effective area of 9.30 10–8 m2 is found at 2 THz frequency when cow milk is used as the analyte. Due to an increase in the vacant area within the core, the difference of refractive index between cladding and core region reduces, increasing the area of wave propagation [57]. Thus for 98% porosity, the highest effective areas are found for both camel and cow milk.
Fig. 12.
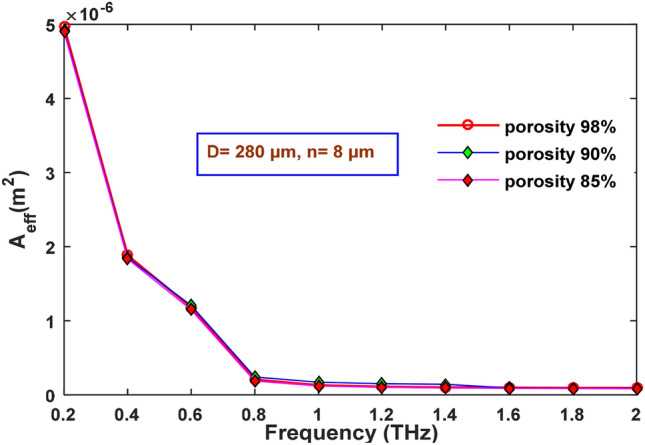
Change of effective area with frequency for D = 280 µm and n = 8 µm for different porosities
Fig. 13.
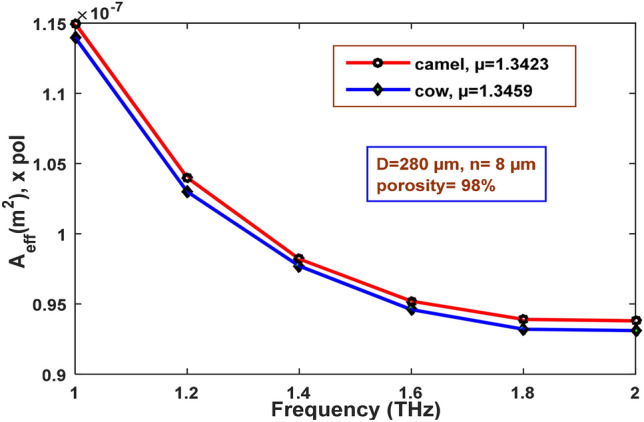
Change of effective area with frequency for different refractive index
With core diameter, the area of electromagnetic propagation increases; hence an effective cross-sectional area is shown in Fig. 14. Varying the core diameter from 260 to 400 µm, the effective area changes from 7.35 10–8 m2 to 1.74 10–7 m2 for 85% porosity and from 7.6 10–8 m2 to 1.894 10–7 m2 for 90% porosity.
Fig. 14.
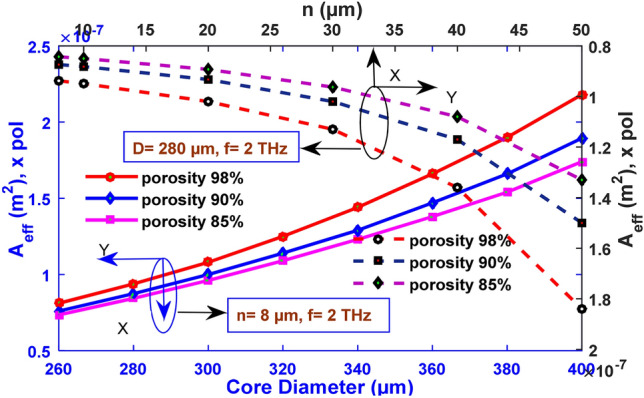
Change of effective area with core diameter ranging from 260 to 400 µm (n = 8 µm and f = 2 THz) and strut value from 8 to 50 μm (D = 280 µm and f = 2 THz)
A minimum value of 8.11 10–8 m2 and maximum value of 2.18 10–7 m2 are found for the effective area for core diameter of 260 μm and 400 μm, respectively, when the porosity is kept 98% for camel milk. In the same figure, the change in the effective area has also been observed by changing the strut size from 8 to 50 µm. With the increase of strut size, the effective area reduces. Strut value of 8 μm possesses the lowest effective area of 8.43 10–8 m2, 8.74 10–8 m2, 9.38 10–8 m2 for 85%, 90%, and 98% porosities respectively.
Effective refractive index () can be characterized as the proportion of the light speed in a vacuum to the light speed in the medium for the provided polarization toward the direction of light propagation through the guiding structure. The effective refractive index of any material can be found using the expression given below [58].
| 4 |
Here, is the polarization (TM or TE), and m is the th mode of the polarization. is the propagation constant, is the number of waves in a vacuum, is the wavelength, and is the frequency in the vacuum. From the equation, it can be concluded that an effective index is also a function of frequency as it is of propagation constant.
The relation between effective refractive index and frequency at different porosity of core is presented in Fig. 15. It can be seen that the effective refractive index increases from 0.92838 to 1.3492 when the frequency is increased from 0.2 to 2 THz for 98% porosity. This occurs because more light can interact with the back material of the core at a higher frequency leading to an increase of the effective refractive index. The porosity of the core also affects the effective index as decrement of core porosity leads to an increment of background material in the core, resulting in more interaction of light with Zeonex. As a result, the effective index of 1.3879 is achieved for 85% porosity, which is more than the case of 90% and 98% at the operating frequency.
Fig. 15.
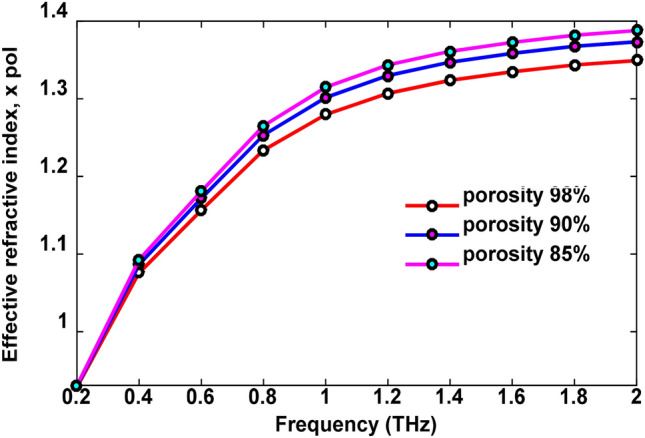
Change of effective refractive index with increasing frequency from 0.2 to 2 THz for different porosity
Next, the variation of effective refractive index is observed by varying the core diameter from 260 to 400 µm, keeping other parameters fixed. It can be concluded that the effective refractive index rises if the core diameter is increased, as shown in Fig. 16. Furthermore, the variation of effective refractive index is also observed by varying strut size, from 10 to 50 µm keeping other parameters constant. The refractive index increases from 1.3881 to 1.3976 for 85% porosity, higher than those for 90% and 95% porosity. In both cases, the amount of Zeonex in the core increases, which leads to more interaction of light with it. As a result, the effective refractive index increases. From the proposed sensor, an effective refractive index of 1.3492 is obtained at 2 THz operating frequency and optimum structure.
Fig. 16.
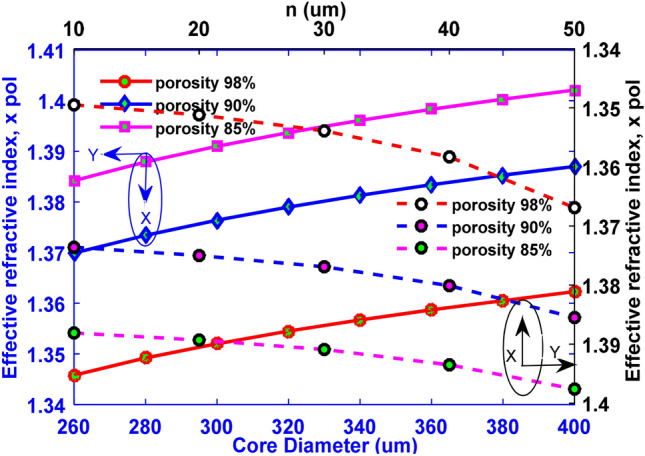
Change of effective refractive index for core diameter of 260 µm to 400 µm and strut of 10 µm to 50 µm for different porosity
Confinement loss is another important factor on which the performance of a PCF sensor depends. This loss occurs when mode leakage to cladding happens during the confinement of light in the core by MTIR. In recent research works, various designs of core have been proposed to reduce confinement loss. Confinement loss can change due to variation in geometrical structure with operating frequency. It can be calculated using the expression given below [21].
| 5 |
Here is the operating frequency, is the speed of light and indicates an imaginary part of the effective refractive index.
The behavior of confinement loss is observed by varying frequency from 0.2 to 2 THz for camel milk. As the light gets more constricted at the core at a higher frequency, better confinement of light in the core happens. This is why the confinement loss curve shows a reducing characteristic with increasing frequency in Fig. 17. A minimum loss of 8.584 10–18 cm−1 is obtained for 85% porosity. However, in 98% porosity, the reduction of confinement loss is higher than 90% and 85% porosity. Furthermore, for 98% porosity, this sensor shows 8.675 10–18 cm−1 of confinement loss at an optimum 2 THz frequency. As the low value of confinement loss ensures better propagation of light, this sensor shows better performance than many porous core sensors such as the sensor proposed in [56].
Fig. 17.
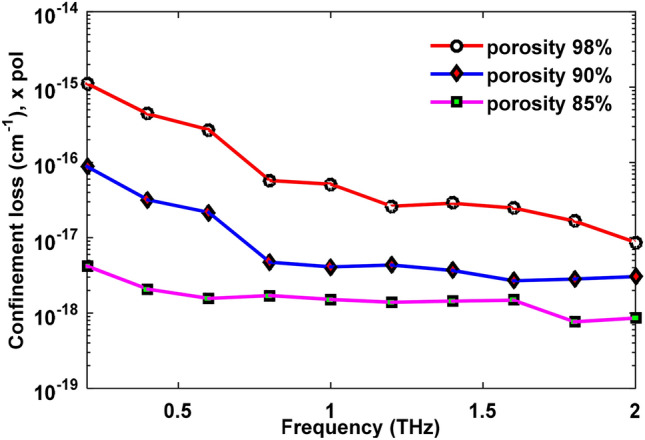
Change of confinement loss due to variation of frequency
Numerical aperture is a measure of the light coupling ability of a fiber. A higher numerical aperture is desirable for a PCF sensor as it enriches the light-gathering within the core. The numerical aperture follows the relation in [15].
| 6 |
Here, f is the frequency, is the speed of light and is the effective area. So, the numerical aperture value is affected by both the frequency and modal effective area values. In Fig. 18, we observe that with increasing frequency, numerical aperture behaves in an upward manner first till frequency of 0.6 THz and then downward until the frequency of 2 THz. Previously, the effective area initially decreased a lot with only a slight increment of 0.4 THz. That is why the highest value of NA is found to be 0.55 at 0.6 THz, and then the value of NA starts to decrease as the effective area starts to saturate for different porosity even though there was an increment of frequency.
Fig. 18.
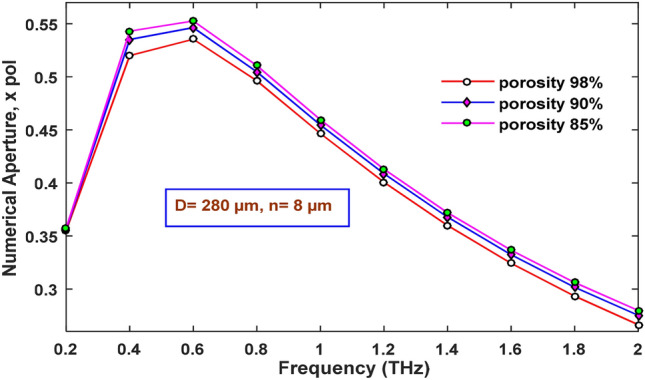
Response of numerical aperture with varying frequency for different porosity
From Fig. 19, it can be seen that the behavior of numerical aperture is observed by varying core diameter keeping other parameters fixed. This variation is also observed by varying the strut, n, keeping other parameters fixed. Both observations show the decreasing value of numerical aperture, which is not desirable for a sensor. Therefore, we can conclude that the optimum value of core diameter and strut should be = 280 µm and n = 8 µm as they were decided before.
Fig. 19.
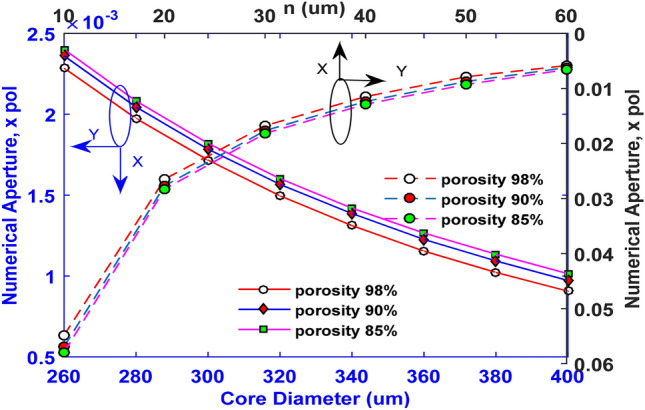
Response of numerical aperture for varying core diameter and strut
As our primary consideration is sensitivity, the highest value of numerical aperture cannot be taken at 0.6 THz frequency. This sensor achieved NA of 0.256 and 0.267 respectively for camel and cow milk at optimum frequency and structure. Since this value indicates the coupling capability of fiber, our sensor shows better performance than previous fiber sensors, such as the hollow core sensor designed in [15].
Finally, one of the most essential properties of the fiber is observed is dispersion. Dispersion indicates the spreading of light pulses as light propagates along the path of a fiber structure. Mainly two kinds of dispersion are there. They are material and waveguide dispersion. Dispersion of material is dependent on the refractive index of back material. As it was said before that the effective refractive index of Zeonex is 1.53, which remains unchanged from 0.1 to 2 THz. Hence, material dispersion can be ignored in the proposed sensor. As a result, only waveguide dispersion remains, which can be measured using the equation given below.
| 7 |
Here, is the speed of light in a vacuum, is the effective refractive index of the core, and is the angular frequency [52].
From Fig. 20, it can be observed that the dispersion curve shows downward behavior as frequency increases. It occurs due to lower refractive index differences at a higher frequency that was seen from Fig. 15. For different porosities, the values are almost the same. It can also be visualized that dispersion gets flattened for 0.8 THz to 2 THz frequency range. The broader flatten spectrum shows better performance in multichannel optical sensing and communication applications. The proposed sensor obtains 1 ± 0.5 ps/THz/cm dispersion at the optimum structure for all porosities, which can be comparable to many previously proposed sensors, such as the sensor in [58].
Fig. 20.
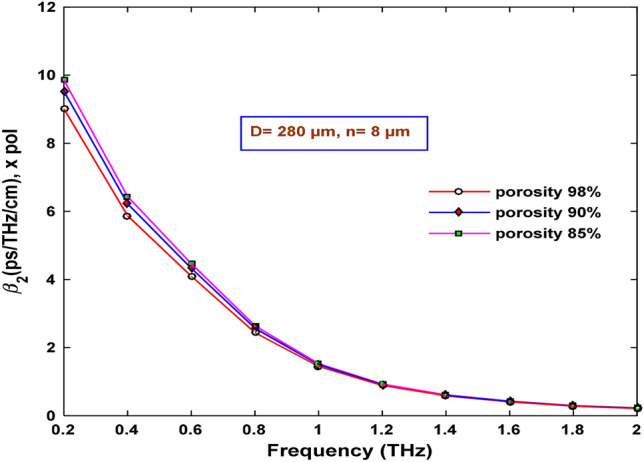
Change of dispersion with varying frequency for different porosity
Fabrication possibilities
Many fabrication methods are already in practice for PCF sensors. Since the proposed sensor is a porous core Zeonex-based sensor, preform-molding (fiber-inflation technique) can be used in fabricating this type of sensor. In this process, the fiber preform is cast in a micro-structured mold. Maximum porosity of 86% was achieved using preform-molding (fiber inflation technique) [47]. There is also another method that can be followed, which is extrusion. Through this process, polymer preforms can be fabricated directly from the granules. As these two methods are already in use for fabrication purposes of PCF sensors, we think these two verified methods can be used for the practical realization of this PCF sensor.
Performance parameters of the proposed sensor with prior sensors are presented in Table 1. From there, it can be seen that our sensor shows better sensitivity than the sensors in [42, 45, 58]. Though the sensor mentioned in [43] has higher sensitivity, this proposed sensor has lower confinement loss. As our sensor has a porous core, wastage of analyte is minimum here. Considering all structural and performance parameters, our sensor shows remarkable performance in milk sensing and opens a whole new approach in the study of dairy products sensing.
Table 1.
Performance Parameters of the proposed sensor with the prior sensors
| Sensor | Max sensitivity | EML (cm−1) | Confinement loss | Numerical aperture | Dispersion |
|---|---|---|---|---|---|
| [45] | 49.13% | – | 5.583 10–5 dB/m | – | – |
| [57] | – | 0.07 | 1.14 10–3 cm−1 | – | 1.1 ± 0.02 |
| [42] | 55.56% | – | – | – | – |
| [59] | – | 0.047 | |||
| [53] | – | 0.035 | 6.3 10−3 cm−1 | – | 0.46 ± 0.07 |
| [58] | 80.93% | – | 1.23 10−11 dB/cm | – | 3.32 ± 1.82 |
| [56] | – | 0.05 | 7.24 10−7 cm−1 | – | 0.49 ± 0.05 |
| [43] | 85.7% | – | 1.7 10−7 cm−1 | 0.372 | – |
| Proposed sensor (Camel milk) | 81.16% | 0.033 | 8.675 10–18 cm−1 | 0.256 | 1 ± 0.5 |
| Proposed sensor (Cow milk) | 81.32% | 0.032824 | 1.435 10–18 cm−1 | 0.267 | 1 ± 0.5 |
Experimental setup
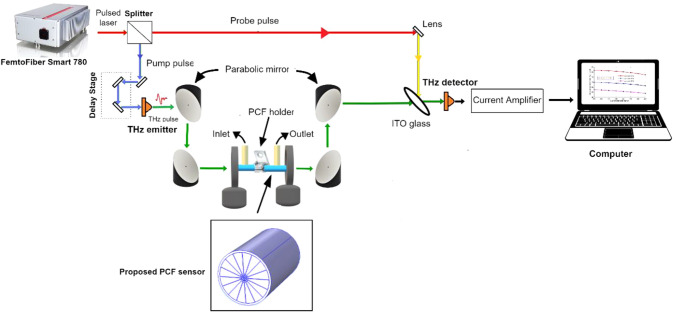
THz-TDS is a widely used method to detect and identify gas, liquid, and chemicals [47]. Hence a THz-TDS system can be a better choice to implement our sensor. The possible experimental setup is given schematically in the figure. This system consists of five main parts: ultra-fast femtosecond laser, THz emitter, PCF sensor, THz detector, and a delay unit. Here FemtoFiber smart 780 can be used as a femtosecond laser. The laser beam is first launched into a splitter, which splits the beam into pump and probe beams. Later the pump beam is incident on THz emitter to initiate THz pulses. An InGaAs-based photoconductive antenna can be used as a THz emitter yielding a spectrum range of 0.1–3 THz. THz pulses are then synchronized and centered on the core region of our proposed sensor by parabolic mirrors. The sensor is fixed between the two irises.
As shown in Fig. 21, two channels are incorporated in the sensor's core region with the milk analyte, which will control the milk flow in the PCF. When THz pulse is incident upon the sensor, milk will absorb a fraction of it. THz pulses will then be resynchronized and refocused on the THz detector. An InGaAs-based photoconductive antenna can also be used as a THz detector, the same as the emitter. The probe beam gates the detector, and helps measure the THz electric field instantaneously along with amplitude attenuation and time delay based on the THz pulse absorption of milk. A delay unit is employed to offset the pump and probe pulses and permits the repetitive sampling of THz temporal analysis. A Fourier transform is then used to convert this time-domain spectroscopy into a frequency domain spectrum, and we can acquire our desired parameters.
Fig. 21.
Simplified diagram of the experimental setup for milk sensing
Conclusion
In this work, a Zeonex-based wheel structured PCF sensor with the porous core is proposed to detect camel milk and cow milk in the Terahertz frequency regime. Using the finite element method (FEM), sensing performance has been analyzed and discussed in this paper. This sensor shows maximum sensitivity of 81.16% for 98% porosity, 67.96% for 90% porosity, and 60% for 85% porosity for camel milk at optimum condition. In addition, this sensor shows ultra-low confinement loss of 8.675 10–18 cm−1 with EML loss of 0.033 cm−1. Furthermore, a very high core power fraction of 81.573%, a better numerical aperture of 0.256, and a flattened dispersion over a wide bandwidth can be achieved by this PCF sensor. Hence with all these advantages, it can be inferred that this sensor will provide a new path in the dairy industry and will further contribute to the control of the quality of dairy products.
Footnotes
Publisher's Note
Springer Nature remains neutral with regard to jurisdictional claims in published maps and institutional affiliations.
References
- 1.Yoganandi J, Mehta BM, Wadhwani KN, Darji VB, Aparnathi KD. Comparison of physico-chemical properties of camel milk with cow milk and buffalo milk. J. Camel Pract. Res. 2014 doi: 10.5958/2277-8934.2014.00045.9. [DOI] [Google Scholar]
- 2.Pawar AY, Sonawane DD, Erande KB, Derle DV. Terahertz technology and its applications. Drug Invent. Today. 2013;5(2):157–163. doi: 10.1016/j.dit.2013.03.009. [DOI] [Google Scholar]
- 3.Knight JC. Photonic crystal fibres. Nature. 2003;424(6950):847–851. doi: 10.1038/nature01940. [DOI] [PubMed] [Google Scholar]
- 4.Russell P. Applied physics: photonic crystal fibers. Science. 2003 doi: 10.1126/science.1079280. [DOI] [PubMed] [Google Scholar]
- 5.Islam MS, et al. Extremely low material loss and dispersion flattened TOPAS based circular porous fiber for long distance terahertz wave transmission. Opt. Fiber Technol. 2017 doi: 10.1016/j.yofte.2016.11.014. [DOI] [Google Scholar]
- 6.Rodriguez GA, et al. Photonic crystal nanobeam biosensors based on porous silicon. Opt. Express. 2019;27(7):9536–9549. doi: 10.1364/OE.27.009536. [DOI] [PubMed] [Google Scholar]
- 7.Islam MS, Rana S, Islam MR, Faisal M, Rahman H, Sultana J. Porous core photonic crystal fibre for ultra-low material loss in THz regime. IET Commun. 2016;10(16):2179–2183. doi: 10.1049/iet-com.2016.0227. [DOI] [Google Scholar]
- 8.Mittleman DM. Twenty years of terahertz imaging. Opt. Express. 2018;26(8):9417–9431. doi: 10.1364/oe.26.009417. [DOI] [PubMed] [Google Scholar]
- 9.M. Lucki, Photonic crystal fibers with optimized dispersion for telecommunication systems, in Recent Progress in Optical Fiber Research, 2012
- 10.S.M.S. Bappy, M.M. Huq, M.E. Rahman, A. Shariar, M.S. Ali, Dispersion compensating photonic crystal fiber for telecommunication band with a dispersion compensation over 300 nm bandwidth, in 2nd International Conference on Electrical Engineering and Information and Communication Technology, iCEEiCT 2015, 2015, 10.1109/ICEEICT.2015.7307426.
- 11.Islam MS, Sultana J, Atai J, Abbott D, Rana S, Islam MR. Ultra low-loss hybrid core porous fiber for broadband applications. Appl. Opt. 2017;56(4):1232–1237. doi: 10.1364/AO.56.001232. [DOI] [PubMed] [Google Scholar]
- 12.Paul BK, et al. Investigation of gas sensor based on differential optical absorption spectroscopy using photonic crystal fiber. Alex. Eng. J. 2020;59(6):5045–5052. doi: 10.1016/j.aej.2020.09.030. [DOI] [Google Scholar]
- 13.Eravuchira PJ, Banchelli M, D'Andrea C, de Angelis M, Matteini P, Gannot I. Hollow core photonic crystal fiber-assisted Raman spectroscopy as a tool for the detection of Alzheimer's disease biomarkers. J. Biomed. Opt. 2020 doi: 10.1117/1.jbo.25.7.077001. [DOI] [PMC free article] [PubMed] [Google Scholar]
- 14.Habib A, Anower S, Haque I. Highly sensitive hollow core spiral fiber for chemical spectroscopic applications. Sens. Int. 2020 doi: 10.1016/j.sintl.2020.100011. [DOI] [Google Scholar]
- 15.Islam MR, Hossain MA, Talha KMA, Munia RK. A novel hollow core photonic sensor for liquid analyte detection in the terahertz spectrum: design and analysis. Opt. Quantum Electron. 2020 doi: 10.1007/s11082-020-02532-0. [DOI] [Google Scholar]
- 16.Das S, Singh VK. Refractive index sensor based on selectively liquid infiltrated birefringent photonic crystal fiber. Optik. 2020 doi: 10.1016/j.ijleo.2019.163489. [DOI] [Google Scholar]
- 17.Ramya KC, Monfared YE, Maheswar R, Dhasarathan V. "Dual-core twisted photonic crystal fiber salinity sensor: a numerical investigation. IEEE Photon. Technol. Lett. 2020 doi: 10.1109/LPT.2020.2987949. [DOI] [Google Scholar]
- 18.Wang G, Lu Y, Duan L, Yao J. A refractive index sensor based on PCF with ultra-wide detection range. IEEE J. Sel. Top. Quantum Electron. 2021 doi: 10.1109/JSTQE.2020.2993866. [DOI] [Google Scholar]
- 19.Aminul Islam M, Rakibul Islam M, Moinul Islam Khan M, Chowdhury JA, Mehjabin F, Islam M. Highly birefringent slotted core photonic crystal fiber for thz wave propagation. Phys. Wave Phenom. 2020 doi: 10.3103/S1541308X20010021. [DOI] [Google Scholar]
- 20.Rakibul Islam M, Khan MMI, Mehjabin F, Alam Chowdhury J, Islam M. Design of a fabrication friendly and highly sensitive surface plasmon resonance-based photonic crystal fiber biosensor. Res. Phys. 2020 doi: 10.1016/j.rinp.2020.103501. [DOI] [Google Scholar]
- 21.Rahman MM, Mou FA, Bhuiyan MIH, Islam MR. Photonic crystal fiber based terahertz sensor for cholesterol detection in human blood and liquid foodstuffs. Sens. Bio-Sensing Res. 2020 doi: 10.1016/j.sbsr.2020.100356. [DOI] [Google Scholar]
- 22.Hossain MB, Podder E, Bulbul AAM, Mondal HS. Bane chemicals detection through photonic crystal fiber in THz regime. Opt. Fiber Technol. 2020 doi: 10.1016/j.yofte.2019.102102. [DOI] [Google Scholar]
- 23.Mou FA, Rahman MM, Islam MR, Bhuiyan MIH. Development of a photonic crystal fiber for THz wave guidance and environmental pollutants detection. Sen. Bio-Sensing Res. 2020;29:100346. doi: 10.1016/j.sbsr.2020.100346. [DOI] [Google Scholar]
- 24.Hossain MS, Sen S. Design and performance improvement of optical chemical sensor based photonic crystal Fiber (PCF) in the Terahertz (THz) wave propagation. Silicon. 2020 doi: 10.1007/s12633-020-00696-8. [DOI] [Google Scholar]
- 25.Islam MR, Mamadou M. Spider web ultrasensitive terahertz photonic crystal fiber for chemical sensing. Opt. Eng. 2020 doi: 10.1117/1.oe.59.8.087103. [DOI] [Google Scholar]
- 26.Pinto AMR, Lopez-Amo M. Photonic crystal fibers for sensing applications. J. Sens. 2012 doi: 10.1155/2012/598178. [DOI] [Google Scholar]
- 27.Z. Gong, Y. Meng, H. Wei, F. Pang, T. Wang, S. Krishnaswamy, Design of high-sensitive optical fiber acoustic sensor based on a photonic crystal fiber. In: Proc SPIE 11554, Advanced sensor systems and applications X, 115540Q (2020). 10.1117/12.2573133
- 28.Hemalatha R, Revathi S. Photonic crystal fiber for sensing application. Int. J. Eng. Adv. Technol. 2020;9(5):481–494. doi: 10.35940/ijeat.e9613.069520. [DOI] [Google Scholar]
- 29.Bahabady AM, Olyaee S, Arman H. Optical biochemical sensor using photonic crystal nano-ring resonators for the detection of protein concentration. Curr. Nanosci. 2017 doi: 10.2174/1573413713666170405161211. [DOI] [Google Scholar]
- 30.Hossain MB, Podder E. Design and investigation of PCF-based blood components sensor in terahertz regime. Appl. Phys. A Mater. Sci. Process. 2019 doi: 10.1007/s00339-019-3164-x. [DOI] [Google Scholar]
- 31.Islam MR, Iftekher ANM, Mou FA, Rahman MM, Bhuiyan MIH. Design of a Topas-based ultrahigh-sensitive PCF biosensor for blood component detection. Appl. Phys. A. 2021 doi: 10.1007/s00339-020-04261-3. [DOI] [Google Scholar]
- 32.Cregan RF, et al. Single-mode photonic band gap guidance of light in air. Science. 1999 doi: 10.1126/science.285.5433.1537. [DOI] [PubMed] [Google Scholar]
- 33.Pottage J, et al. Robust photonic band gaps for hollow core guidance in PCF made from high index glass. Opt. Express. 2003 doi: 10.1364/oe.11.002854. [DOI] [PubMed] [Google Scholar]
- 34.Knight JC, Broeng J, Birks TA, Russell PSJ. Photonic band gap guidance in optical fibers. Science. 1998 doi: 10.1126/science.282.5393.1476. [DOI] [PubMed] [Google Scholar]
- 35.Islam MA, Islam MR, Al Naser AM, Anzum F, Jaba FZ. Square structured photonic crystal fiber based THz sensor design for human body protein detection. J. Comput. Electron. 2020 doi: 10.1007/s10825-020-01606-2. [DOI] [Google Scholar]
- 36.Olyaee S, Taghipour F. Ultra-flattened dispersion hexagonal photonic crystal fibre with low confinement loss and large effective area. IET Optoelectron. 2012 doi: 10.1049/iet-opt.2011.0031. [DOI] [Google Scholar]
- 37.Hao R, Li Z, Sun G, Niu L, Sun Y. Analysis on photonic crystal fibers with circular air holes in elliptical configuration. Opt Fiber Technol. 2013 doi: 10.1016/j.yofte.2013.04.005. [DOI] [Google Scholar]
- 38.Islam MA, Islam MR, Tasnim Z, Islam R, Khan RL, Moazzam E. Low-loss and dispersion-flattened octagonal porous core PCF for Terahertz transmission applications. Iran. J. Sci. Technol. Trans. Electr. Eng. 2020 doi: 10.1007/s40998-020-00337-1. [DOI] [Google Scholar]
- 39.Abdur Razzak SA, Namihira Y, Khan MAG, Begum F, Kaijage S. Guiding properties of a decagonal photonic crystal fiber. J. Microw. Optoelectron. 2007;6(1):44–49. [Google Scholar]
- 40.Hasan MR, Akter S, Khatun T, Rifat AA, Anower MS. Dual-hole unit-based kagome lattice microstructure fiber for low-loss and highly birefringent terahertz guidance. Opt. Eng. 2017 doi: 10.1117/1.oe.56.4.043108. [DOI] [Google Scholar]
- 41.Islam MR, Kabir MF, Talha KMA, Arefin MS. Highly birefringent honeycomb cladding terahertz fiber for polarization-maintaining applications. Opt. Eng. 2020 doi: 10.1117/1.oe.59.1.016113. [DOI] [Google Scholar]
- 42.Islam MS, et al. Liquid-infiltrated photonic crystal fiber for sensing purpose: design and analysis. Alex. Eng. J. 2018 doi: 10.1016/j.aej.2017.03.015. [DOI] [Google Scholar]
- 43.Islam MS, et al. A novel approach for spectroscopic chemical identification using photonic crystal fiber in the terahertz regime. IEEE Sens. J. 2018 doi: 10.1109/JSEN.2017.2775642. [DOI] [Google Scholar]
- 44.M.M. Hasan et al., Heptagonal photonic crystal fiber based chemical sensor in THz regime, in 2019 Joint 8th International Conference on Informatics, Electronics and Vision, ICIEV 2019 and 3rd International Conference on Imaging, Vision and Pattern Recognition, icIVPR 2019 with International Conference on Activity and Behavior Computing, ABC 2019, 2019. 10.1109/ICIEV.2019.8858555.
- 45.Leon MJBM, Kabir MA. Design of a liquid sensing photonic crystal fiber with high sensitivity, bireferingence and low confinement loss. Sens. Bio-Sensing Res. 2020 doi: 10.1016/j.sbsr.2020.100335. [DOI] [Google Scholar]
- 46.E.N. Fokoua, Y. Chen, D.J. Richardson, F. Poletti, Microbending effects in hollow-core photonic bandgap fibers, in European Conference on Optical Communication, ECOC, 2016
- 47.Islam MS, Cordeiro CMB, Franco MAR, Sultana J, Cruz ALS, Abbott D. Terahertz optical fibers. Opt. Express. 2020 doi: 10.1364/oe.389999. [DOI] [PubMed] [Google Scholar]
- 48.U. Biswas, G.K. Bharti, J.K. Rakshit, Design of photonic crystal based optical sensor for analyzing water content in milk. in Intelligent Techniques and Applications in Science and Technology. ICIMSAT 2019. Learning and Analytics in Intelligent Systems ed. by S. Dawn, V. Balas, A. Esposito, S. Gope (vol. 12, Springer, Cham, 2020). 10.1007/978-3-030-42363-6_17
- 49.Biswas U, Rakshit JK, Bharti GK. Design of photonic crystal microring resonator based all-optical refractive-index sensor for analyzing different milk constituents. Opt. Quantum Electron. 2020 doi: 10.1007/s11082-019-2140-1. [DOI] [Google Scholar]
- 50.Islam MS, et al. Experimental study on glass and polymers: determining the optimal material for potential use in terahertz technology. IEEE Access. 2020 doi: 10.1109/ACCESS.2020.2996278. [DOI] [Google Scholar]
- 51.Kaijage SF, Ouyang Z, Jin X. Porous-core photonic crystal fiber for low loss terahertz wave guiding. IEEE Photon. Technol. Lett. 2013 doi: 10.1109/LPT.2013.2266412. [DOI] [Google Scholar]
- 52.Yakasai IK, Abas PE, Ali S, Begum F. Modelling and simulation of a porous core photonic crystal fibre for terahertz wave propagation. Opt. Quantum Electron. 2019 doi: 10.1007/s11082-019-1832-x. [DOI] [Google Scholar]
- 53.Habib A. Ultra low loss and dispersion flattened microstructure fiber for terahertz applications. Brill. Eng. 2020 doi: 10.36937/ben.2020.003.001. [DOI] [Google Scholar]
- 54.Islam S, et al. Extremely low-loss, dispersion flattened porous-core photonic crystal fiber for terahertz regime. Opt. Eng. 2016 doi: 10.1117/1.oe.55.7.076117. [DOI] [Google Scholar]
- 55.Islam MR, Kabir MF, Talha KMA, Islam MS. A novel hollow core terahertz refractometric sensor. Sens. Bio-Sensing Res. 2019 doi: 10.1016/j.sbsr.2019.100295. [DOI] [Google Scholar]
- 56.Islam MS, Sultana J, Dinovitser A, Ng BWH, Abbott D. A novel Zeonex based oligoporous-core photonic crystal fiber for polarization preserving terahertz applications. Opt. Commun. 2018 doi: 10.1016/j.optcom.2017.12.061. [DOI] [Google Scholar]
- 57.Ahasan Habib M, Shamim Anower M, Rabiul Hasan M. Highly birefringent and low effective material loss microstructure fiber for THz wave guidance. Opt. Commun. 2018 doi: 10.1016/j.optcom.2018.04.022. [DOI] [Google Scholar]
- 58.Ahmed K, et al. Refractive Index-based blood components sensing in terahertz spectrum. IEEE Sens. J. 2019 doi: 10.1109/JSEN.2019.2895166. [DOI] [Google Scholar]
- 59.Reza MS, Habib MA. Extremely sensitive chemical sensor for terahertz regime based on a hollow-core photonic crystal fibre. Ukr. J. Phys. Opt. 2020 doi: 10.3116/16091833/21/1/8/2020. [DOI] [Google Scholar]


