Abstract
Objective
To simulate the process of transcranial direct current stimulation (tDCS) on patients after decompressive craniectomy (DC), and to model cortical electric field distributions under different electrode montages, we constructed a finite element model that represented the human head at high resolution.
Methods
Using computed tomography images, we constructed a human head model with high geometrical similarity. The removed bone flap was simplified to be circular with a diameter of 12 cm. We then constructed finite element models according to bioelectrical parameters. Finally, we simulated tDCS on the finite element models under different electrode montages.
Results
Inward current had a linear relationship with peak electric field value, but almost no effect on electric field distribution. If the anode was not over the skull hole (configuration 2), there was almost no difference in electric field magnitude and focality between the circular and square electrodes. However, if the anode was right over the hole (configuration 1), the circular electrodes led to higher peak electric field values and worse focality. In addition, configuration 1 significantly decreased focality compared with configuration 2.
Conclusion
Our results might serve as guidelines for selecting current and electrode montage settings when performing tDCS on patients after DC.
Keywords: Transcranial direct current stimulation, decompressive craniectomy, finite element method, electrode introduction, electrode montage, current settings, electrode settings, cortical electric field distributions
Introduction
Uncontrolled brain swelling can lead to impairments in brain function or even be fatal in patients with traumatic brain injury, ischemic stroke, or acute subdural hematoma.1–3 Brain swelling within a limited space can increase the intracranial pressure (ICP), negatively influencing normal cortical function. Thus, treatments that can maintain the ICP are vital.4 Clinically, several strategies can be used to reduce ICP, including removing cerebrospinal fluid (CSF), reducing blood volume, and reducing cerebral metabolic demands.5 Decompressive craniectomy (DC) is the final option among these strategies.5–7
During the process of DC, a large skull segment (or bone flap) is removed to enlarge the cranial cavity, resulting in ICP reduction.3,8–10 DC is currently the most effective technique for reducing ICP; however, it remains a life-saving procedure only for specific patients because it has complications that are difficult to avoid.11 Common complications include the disruption of CSF dynamics,12–14 cerebral ischemia, infection, wound dehiscence, seizures, and syndrome of the trephined.5 With these complications, patients who undergo DC surgery tend to suffer from cortical lesions, which can influence normal functions and lead to cognitive impairment, motor disfunction, dyskinesia, and hemiplegia.
Transcranial direct current stimulation (tDCS) is a non-invasive brain stimulation technology based on the use of weak currents, and the induced electric field can modify cortical excitability.15 During tDCS, the weak current is transferred to the brain through two pads on the scalp surface. There are different kinds of tDCS: anodal tDCS increases cortical excitability, whereas cathodal tDCS decreases cortical excitability.16 Clinical studies have shown that tDCS has positive effects on cognitive function and motor rehabilitation, and in the treatment of diseases such as stroke.17–19 Because of these positive results, tDCS is believed to be beneficial for rehabilitation in patients with DC complications.
The main factors limiting the clinical use of tDCS are the poor focality of the electric field and the difficulty in locating the high-field area. The finite element method (FEM) is a promising approach for designing and optimizing the clinical parameters of tDCS. Several FEM studies on tDCS have been reported.15,20–22 From these previous studies, we have obtained valuable knowledge about setting better stimulating parameters to obtain better clinical effects. However, these studies did not investigate patients after DC. The skull defects in patients after DC might alter the electric field distributions on the skull and cortical areas in tDCS, because the hole in the skull may alter the passage of the current. To the best of our knowledge, the only FEM study of tDCS on human heads with skull defects was reported by Datta et al., in 2010.23 In this study, the authors researched the electric field that was induced by weak currents through two electrodes, and included a simulation of DC. They also studied the effects of anode locations, as well as hole diameters, on the cortical electric field. However, for the complex structure of the brain, we still do not know how electrode sizes and shapes can influence electric field distributions, which are critical in the clinical use of tDCS.
The objective of the present study was to build a three dimensional (3D) finite element model of a human head, with a circular hole in the skull representing DC. We aimed to use this model to analyze the effects of different electrode sizes and shapes on the electric field distribution that was induced by tDCS under different electrode configurations. To do this, we performed simulations with different electrode areas, shapes, and configurations, and analyzed the location of the maximum electric field value and the electric field focality. Our results have the potential to optimize tDCS parameters, thus improving the effects of this treatment.
Materials and methods
Study overview
To research the influence of electrode areas, shapes, and configurations on electric field distributions in the cortex through FEM, we built a 3D geometry representing the human head to construct finite element models. According to these finite element models, we simulated the process of tDCS stimulation on the head after DC under different electrode montages.
Model construction
We built a human head model with highly geometrical similarity, based on computed tomography (CT) images from a healthy young man with no identified lesions within the head. The CT images were imported into MIMICS software (Materialise Inc., Leuven, Belgium) to execute the segmentation and reconstruction. By choosing an appropriate thres hold., the pixels of each component—namely the skull, scalp, and brain—were segmented. Through pixel editing and smoothing, the 3D part of each component was then obtained and exported in STL format. Next, these surface triangular files with STL format were imported into the reverse software Geomagic Studio (Geomagic Inc., Morrisville, NC, USA) and treated one by one. We first fixed and removed any identified surface defects and then remeshed the surface. Second, using an exact surfacing module, we fitted these triangular surfaces into NURBS surfaces, thus obtaining the geometry with IGES format, which could be used directly for the finite element model building. Finally, the geometry of the skull, scalp, and brain was obtained. This study was performed with agreement from the Clinical Medical Ethics Committee of the First Affiliated Hospital of Nanchang University, and the participant gave his informed consent.
It is difficult to precisely recognize the brain contour in CT images because CT is mainly appropriate for hard tissue scanning. We therefore simplified the brain contour into relatively smooth surfaces. Compared with brain 3D geometry with detailed cortical information, the main contour was retained, and the overall electric field distribution differences were not expected to be significant. The domain between the cranial cavity and the brain was considered to be the CSF domain, so that CSF contacted the skull and the brain, and the dura mater was not included. The muscle, fatty tissue, eyes, and blood vessels were assigned the same properties as the scalp;23 therefore, these components were constructed into one single geometry.
The removed bone flap was simplified to be circular shaped, and the diameter was set to 12 cm, which is a clinically appropriate size24–26 We located the center of the hole approximately over the left primary motor cortex area.
Electrode montages
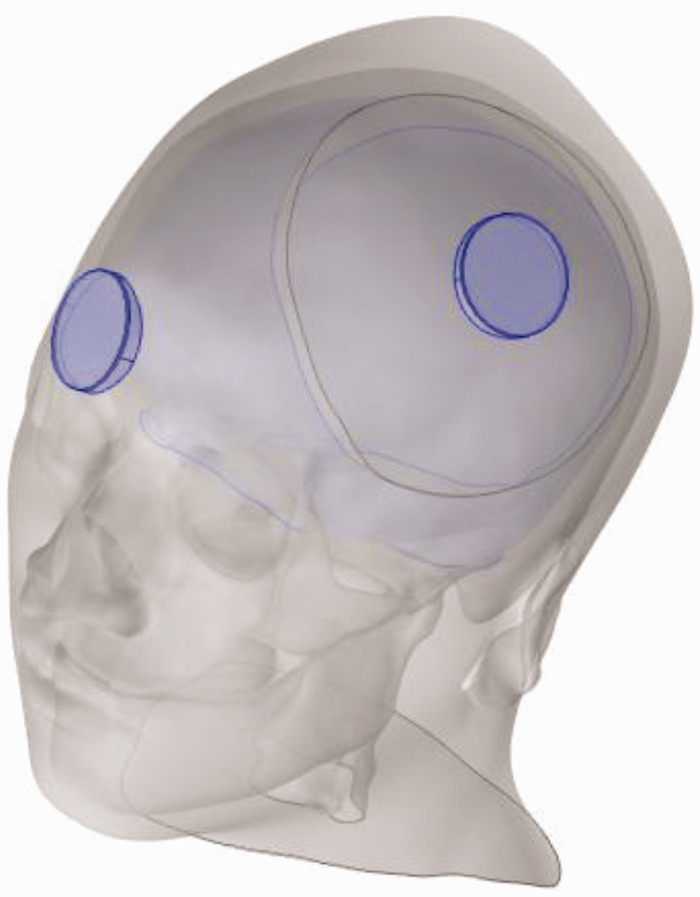
We chose conventional “sponge-based” electrodes for our models. That is, a sponge pad was placed between the electrode and the scalp surface, and the section sizes were the same as the electrodes. The thickness of the electrodes was approximately 1 mm and the thickness of the sponges was 2.5 mm.20 Two electrode shapes were considered: one was circular, and the other was square. To analyze the influence of electrode size on electric field distribution, five different electrode areas were used: 2 cm2, 5 cm2, 10 cm2, 20 cm2, and 30 cm2. The same shape and size were assigned for each pair of anodes and cathodes. In addition, two electrode configurations were modeled. For configuration 1, the anode was placed over the primary motor cortex, with its center right over the hole (corresponding to the C3 area), and the cathode was placed over the contralateral supraorbital area. For configuration 2, the anode was placed over the primary occipital cortex (corresponding to the O1 area), and the cathode was placed over the contralateral supraorbital area. In the latter configuration, the skull hole was located approximately in the middle of the two electrodes, along the outside scalp surface. Thus, there were a total of four electrode montages: (A) circular electrodes with configuration 1; (B) square electrodes with configuration 1; (C) circular electrodes with configuration 2; and (D) square electrodes with configuration 2. For each montage, five different electrode areas were simulated.
Figure 1 shows the geometry of the head and electrode montage A, where the electrode area was 10 cm2. From the outer surface inward, there were electrodes, sponges, scalp, skull, CSF, and brain. There was a circular hole (diameter 12 cm) on the left side of the skull, representing the DC.
Figure 1.
The geometry of the head and electrode montage A.
Simulations
The electrical conductivity of each component was assumed to be isotropic and homogeneous, and the following values (in S/m) were assigned: 0.2 for the brain, 1.65 for the CSF, 0.01 for the skull, 0.465 for the scalp, 5.8 × 10⁷ for the electrodes, and 1.4 for the sponge. A stationary state solver was used for the finite element models. The inward current flow was applied to the outer surface of the anode, and a parameter sweep for the current value from 0.1 mA to 2.0 mA was used, with increments of 0.1 mA. Ground was applied to the outer surface of the cathode electrode, and all other outer surfaces were insulated. The second-order tetrahedral element was used for the total model. For montage A with an electrode area of 10 cm2, the total element number was 1,197,374. The relative tolerance was 1 × 10⁻³, and the conjugate gradient iterating algorithm was used.
For the results, the peak electric field values of the cortex with the different inward currents were first computed, to analyze the influence of the current on the electric field. Second, the variation of the peak electric field values around the electrode area were compared. Finally, to analyze the electric field focality on the cortex, we calculated the areas on the cortical surface where the electric field magnitude was higher than 50%, 80%, and 90% of the peak values under the four montages with different electrode areas. The 50%, 80%, and 90% of the peak values were labeled as A50, A80, and A90, respectively. A50, A80, and A90 can be used to measure the focality of the electric field distributions on the cortex, which is an important index for the effect of tDCS.
Results
In the present study, we simulated tDCS on patients after DC, and 20 models were built and computed. Through these models, we simulated the cortical electric field magnitude and the electric field distributions based on different electrode montages and different inward currents. We then compared and analyzed the electric field distributions and focalities under varying electrode configurations, shapes, and sizes.
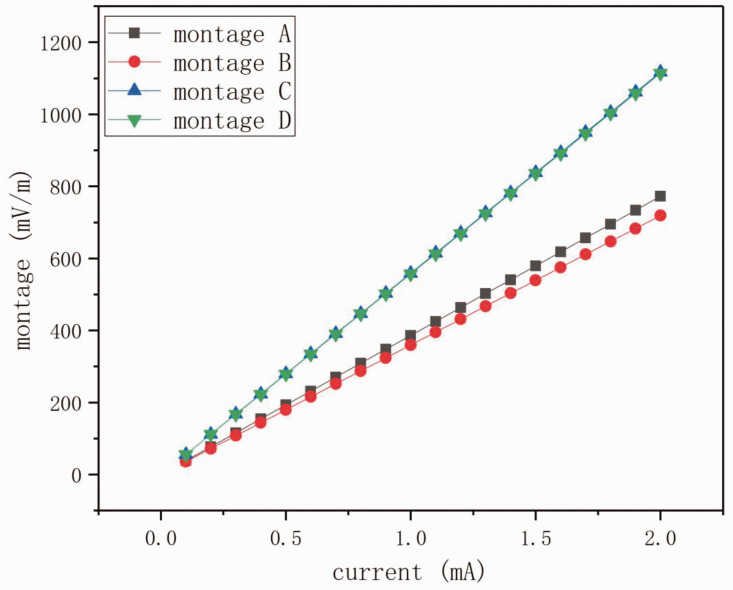
Figure 2 shows the relationship between the inward currents and the peak values of the induced electric field magnitude. The peak values were derived from the montages when the electrode area was 10 cm2. There was an approximately linear relationship between the current and the maximum electric field in the investigated current range (Figure 2). Under the same electrode configuration, the current difference between different electrode shapes was quite subtle (as small as 6.92% and 0.27% for configuration 1 and configuration 2, respectively). The electric field values for montage A and montage C were slightly higher than those for montage B and montage D, respectively, indicating that we can obtain slightly higher electric field magnitudes with circular electrodes. When we compared the electric field values between configuration 1 and configuration 2, the peak values for configuration 2 (when the anode was placed over the primary occipital cortex) were significantly higher than those for configuration 1 (when the anode was placed over the primary motor cortex).
Figure 2.
Peak values of the induced electric field magnitude on the cortex, for the four montages with different currents. The electrode area was 10 cm2.
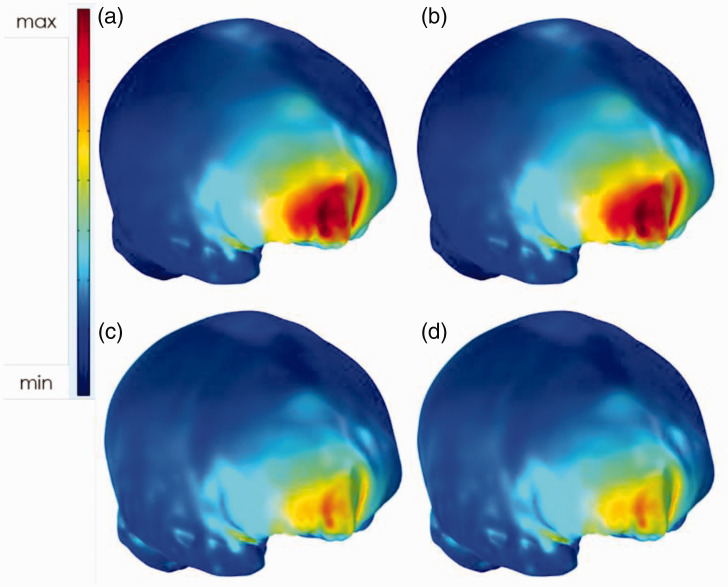
To investigate whether the current affected the electric field distribution, we compared the peak values of electric field for montage A and montage C with inward currents of 1.0 mA and 2.0 mA (Figure 3). In Figure 3, only the electric field distributions were plotted, and the electric field magnitude values were not considered. For different current values, there was very little difference in the distributions. As a result, we chose just one specific current for analyzing the electric field distributions and focalities.
Figure 3.
Electric field distributions of montage A (a, b) and montage C (c, d). The inward currents were 1.0 mA (a, c) and 2.0 mA (b, d). There was almost no difference in electric field distribution between the different currents.
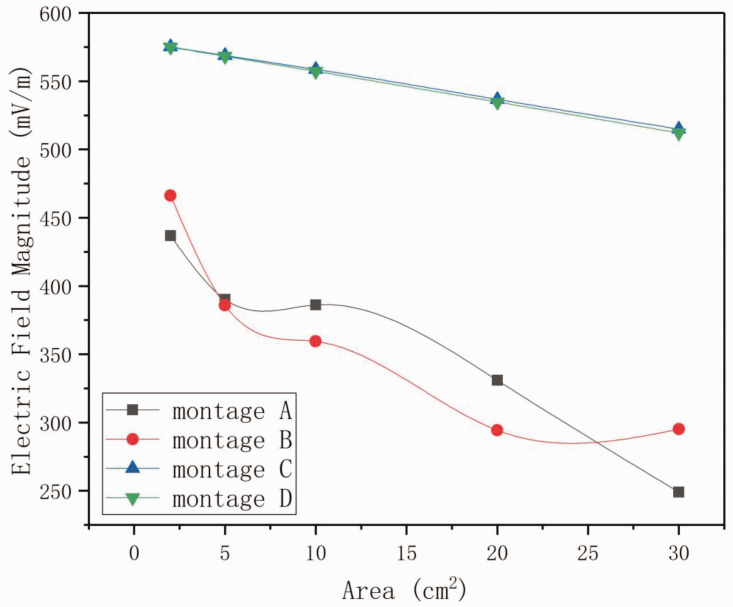
Figure 4 shows the variations in peak electric field values relating to the electrode areas. We calculated the peak values of the cortical electric field for the four montages with a current of 1.0 mA. The peak values decreased monotonically as the electrode area increased from 2 cm2 to 30 cm2; however, the variations for montage A and montage B were quite different from those of montage C and montage D. For montage A and montage B, the anode was right over the hole resulting from DC, and the peak values were very close to one another. These peak values were markedly smaller than those of montage C and montage D. Furthermore, when the electrode area increased to 5 cm2, 10 cm2, and 20 cm2, the values for montage A were larger than those for montage B. This was different from what was observed in montage C and montage D, where the peak electric field values for the circular electrodes were always slightly larger than those for the square electrodes.
Figure 4.
Peak electric field values relating to different electrode areas for the four montages. The inward current was 1.0 mA.
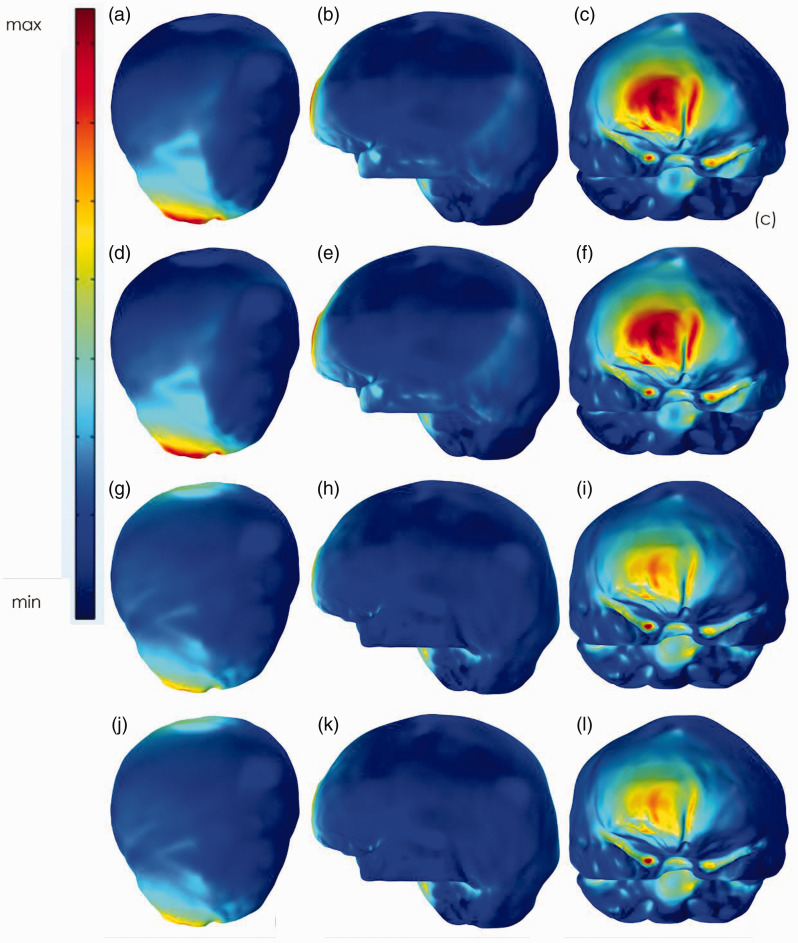
Figure 5 shows the overall cortical electric field distributions for the four montages, with a current of 1.0 mA and an electrode area of 10 cm2. The values of A50, A80, and A90 for the four montages, with all five electrode area values, are listed in Table 1. From Figure 5 and Table 1 we can observe how the electric fields were distributed and focalized under different montages. Table 1 shows that when larger electrodes were used, the focality increased quickly if the skull hole was under the anode, while it decreased slowly if the skull hole was between the two electrodes. Comparing the variations of A50, A80, and A90 for the same montage, the high value areas declined more steeply for montage C and montage D compared with montage A and montage B. This indicates that the electric field was much more focalized when the hole was in the middle of the two electrodes. Figure 5 shows that when the hole was under the anode, the electric field was mainly distributed around the supraorbital area, and a large proportion of this area had very high values. In contrast, when the hole was between the two electrodes, the electric field was mainly distributed around the two electrode areas, which were larger than those of the earlier cases. However, the areas of very high values (for example A80 and A90) were very small. In addition, for montage B, there were special cases that caused the variations to not be perfectly monotonic. This finding might be attributed to the greater influence of the hole when the electrode areas were relatively large.
Figure 5.
Electric field distributions for the four montages from different views. The electrode area was 10 cm2. (a–c) correlates to montage A, (d, f) correlates to montage B, (g–i) correlates to montage C, and (j–l) correlates to montage D. The left row is the top view, the middle row is the left view, and the right row is the front view.
Table 1.
The values of A50, A80, and A90 for the four montages with five different electrode areas.
| Electrode area (cm2) |
Montage A (mm2) |
Montage B (mm2) |
Montage C (mm2) |
Montage D (mm2) |
|||||||||
|---|---|---|---|---|---|---|---|---|---|---|---|---|---|
| A50 | A80 | A90 | A50 | A80 | A90 | A50 | A80 | A90 | A50 | A80 | A90 | ||
| 2 | 7682.1 | 2771.2 | 2069.8 | 6789.0 | 2413.1 | 1586.0 | 9233.1 | 1405.8 | 586.2 | 9226.5 | 1396.7 | 569.7 | |
| 5 | 9414.0 | 3059.0 | 2252.1 | 9717.9 | 3384.3 | 2619.3 | 9128.1 | 1142.3 | 157.4 | 9052.8 | 1108.4 | 144.9 | |
| 10 | 9528.0 | 3312.3 | 2577.8 | 10,791.0 | 3665.2 | 2682.4 | 8238.8 | 491.3 | 86.4 | 8114.7 | 423.0 | 82.2 | |
| 20 | 12,220.0 | 3639.4 | 2369.6 | 16,200.0 | 5526.4 | 3761.3 | 7759.3 | 116.9 | 37.9 | 7621.0 | 112.7 | 34.4 | |
| 30 | 21,750.0 | 7249.9 | 5426.2 | 14,808.0 | 4132.1 | 2200.3 | 7386.1 | 79.6 | 16.6 | 7284.2 | 77.6 | 15.0 | |
Discussion
In the present study, we built a human head finite element model to simulate tDCS effects in patients after DC. Four electrode montages, as well as inward currents that varied from 0.1 mA to 2.0 mA, were considered as the simulating parameters to analyze the cortical electric field distributions. We analyzed the electric field variations and focalities for different currents, electrode configurations, electrode shapes, and electrode areas.
The head structure is complex, and when an inward current is applied on the electrode, the induced electric field immediately penetrates the scalp, skull, and CSF to reach the brain cortex. If the head undergoes DC, there will be a skull defect, which changes the ways through which the electric field can enter the cortex. Datta et al. modeled DC as an ideal hole with a diameter of 10 cm.23 However, several researchers have suggested that a hole of at least 11 to 12 cm diameter is more clinically relevant for DC,24–26 and that an even larger hole would be better.27 We thus considered that a hole of 10 cm diameter was not sufficient to simulate DC, and we created a 12 cm hole in the skull. In addition, Datta et al.23 considered that, like small holes caused by traumatic brain injury or other injuries, the skull hole from DC would be filled with CSF or scar tissue. However, we have observed clinically that the holes are usually not filled with anything in patients after DC. In our model, we therefore only simulated the skull with a hole, without considering any fillings.
In tDCS, a weak current is delivered through the anode and cathode to induce an electric field. Clinically, a current of no more than 2 mA is generally considered safe.28 However, the optimal current strength remains unknown, as does the way in which the electric field is distributed in the cortex, and how the montage factors influence the electric field. This is especially true for a head that has undergone DC. When investigating the electric field distribution, the head is to some extent like a black box. When treating DC complications with tDCS, we often hope that the electric field in the cortex focalizes as much as possible on the injured area, and the peak value as well as the focality in the cortex are the two most useful indexes. The objective of this study was to investigate the effects of these factors on cortical electric field distribution.
When performing tDCS, the factor that directly affects electric field distribution is the current density from the electrode, which is determined by the electrode size. Figure 1 and Figure 3 demonstrate that, when the skull hole was in the middle of the electrodes, there was almost no difference in the peak values of electric fields between the different electrode shapes; however, a difference appeared when the skull hole was under the anode. This might because the hole changes the passage of the electric field through the skull. When the skull is intact, the electric field induced by the current penetrates directly through the skull, and the influence of electrode shape is therefore subtle under the same current density. However, when the hole is right under the anode, the passage for the current to travel through is broken, and the current first has to transfer tangentially. Under this condition, the route is difficult to predict, and may be easily changed by the electrode shape.
In the present study, we used FEM to analyze the influence of both electrode montages and current on cortical electric field distributions during tDCS. We concluded that the inward current has a linear relationship with the peak electric field value, but has little effect on the electric field distribution. If the anode was not over the skull hole, there was almost no difference in electric field magnitude and focality between circular and square electrodes. However, if the anode was right over the skull hole, a difference was noted, and the circular electrodes led to higher peak electric field values and worse focality. In addition, configuration 1 significantly decreased the focality, in contrast to configuration 2. The results from our study provide a theoretical guideline for current and electrode montage settings when performing tDCS on patients after DC.
Footnotes
Declaration of conflicting interest: The authors declare that there is no conflict of interest.
Funding: The author(s) disclosed receipt of the following financial support for the research, authorship, and/or publication of this article: This work was supported by the National Natural Science Foundation of China (31760276, 31960171), Jiangxi Natural Science Foundation (20171BAB204019, 20192ACB20022), and Science and Technology Project of Health Commission of Jiangxi Province (202130250; 20204225).
ORCID iD: Weiming Sun https://orcid.org/0000-0002-2041-0328
References
- 1.Taşkapılıoğlu MÖ, Özmarasali AI, Ocakoğlu G. Retrospective analysis of decompressive craniectomy performed in pediatric patients with subdural hematoma. Ulus Travma Acil Cerrahi Derg 2019; 25: 383–388. [DOI] [PubMed] [Google Scholar]
- 2.Hutchinson PJ, Kolias AG, Czosnyka M, et al. Intracranial pressure monitoring in severe traumatic brain injury BMJ 2013; 346: f1000. [DOI] [PubMed] [Google Scholar]
- 3.Fletcher TL, Kolias AG, Hutchinson PJA, et al. Development of a finite element model of decompressive craniectomy. PLoS One 2014; 9: e102131. [DOI] [PMC free article] [PubMed] [Google Scholar]
- 4.Phan K, Moore JM, Griessenauer C, et al. Craniotomy versus decompressive craniectomy for acute subdural hematoma: systematic review and meta-analysis. World Neurosurg 2017; 101: 677–685.e2. [DOI] [PubMed] [Google Scholar]
- 5.Young AMH, Kolias AG, Hutchinson PJ. Decompressive craniectomy for traumatic intracranial hypertension: application in children. Childs Nerv Syst 2017; 33: 1745–1750. [DOI] [PMC free article] [PubMed] [Google Scholar]
- 6.Kolias AG, Adams H, Timofeev I, et al. Decompressive craniectomy following traumatic brain injury: developing the evidence base. Br J Neurosurg 2016; 30: 246–250. [DOI] [PMC free article] [PubMed] [Google Scholar]
- 7.Walcott BP, Kahle KT, Simard JM. The DECRA trial and decompressive craniectomy in diffuse traumatic brain injury: is decompression really ineffective? World Neurosurg 2013; 79: 80–81. [DOI] [PubMed] [Google Scholar]
- 8.Bor-Seng-Shu E, Figueiredo EG, Amorim RLO, et al. Decompressive craniectomy: a meta-analysis of influences on intracranial pressure and cerebral perfusion pressure in the treatment of traumatic brain injury. J Neurosurg 2012; 117: 589–596. [DOI] [PubMed] [Google Scholar]
- 9.Timofeev I, Czosnyka M, Nortje J, et al. Effect of decompressive craniectomy on intracranial pressure and cerebrospinal compensation following traumatic brain injury. J Neurosurg 2008; 108: 66–73. [DOI] [PubMed] [Google Scholar]
- 10.Timofeev I, Santarius T, Kolias AG, et al. Decompressive craniectomy - operative technique and perioperative care. Adv Tech Stand Neurosurg 2012; 38: 115–136. [DOI] [PubMed] [Google Scholar]
- 11.Walcott BP, Kuklina EV, Nahed BV, et al. Craniectomy for malignant cerebral infarction: prevalence and outcomes in US hospitals. PLoS One 2011; 6: e29193. [DOI] [PMC free article] [PubMed] [Google Scholar]
- 12.Aarabi B, Hesdorffer DC, Ahn ES, et al. Outcome following decompressive craniectomy for malignant swelling due to severe head injury. J Neurosurg 2006; 104: 469–479. [DOI] [PubMed] [Google Scholar]
- 13.Kurland DB, Khaladj-Ghom A, Stokum JA, et al. Complications associated with decompressive craniectomy: a systematic review. Neurocrit Care 2015; 23: 292–304. [DOI] [PMC free article] [PubMed] [Google Scholar]
- 14.Schuss P, Borger V, Güresir Á, et al. Cranioplasty and ventriculoperitoneal shunt placement after decompressive craniectomy: staged surgery is associated with fewer postoperative complications. World Neurosurg 2015; 84: 1051–1054. [DOI] [PubMed] [Google Scholar]
- 15.Ciechanski P, Carlson HL, Yu SS, et al. Modeling transcranial direct-current stimulation-induced electric fields in children and adults. Front Hum Neurosci 2018; 12: 268. [DOI] [PMC free article] [PubMed] [Google Scholar]
- 16.Nitsche MA, Paulus W. Excitability changes induced in the human motor cortex by weak transcranial direct current stimulation. J Physiol 2000; 527: 633–639. [DOI] [PMC free article] [PubMed] [Google Scholar]
- 17.Buch ER, Santarnecchi E, Antal A, et al. Effects of tDCS on motor learning and memory formation: a consensus and critical position paper. Clin Neurophysiol 2017; 128: 589–603. [DOI] [PubMed] [Google Scholar]
- 18.Hummel F, Celnik P, Giraux P, et al. Effects of non-invasive cortical stimulation on skilled motor function in chronic stroke. Brain 2005; 128: 490–499. [DOI] [PubMed] [Google Scholar]
- 19.Kirton A, Ciechanski P, Zewdie E, et al. Transcranial direct current stimulation for children with perinatal stroke and hemiparesis. Neurology 2017; 88: 259–267. [DOI] [PubMed] [Google Scholar]
- 20.Datta A, Bansal V, Diaz J, et al. Gyri-precise head model of transcranial direct current stimulation: improved spatial focality using a ring electrode versus conventional rectangular pad. Brain Stimul 2009; 2: 201–207. [DOI] [PMC free article] [PubMed] [Google Scholar]
- 21.Rezaee Z, Dutta A. Transcranial direct current stimulation of the leg motor area - is it partly somatosensory? Conf Proc IEEE Eng Med Biol Soc 2018; 2018: 4764–4767. [DOI] [PubMed] [Google Scholar]
- 22.Seo H, Jun SC. Relation between the electric field and activation of cortical neurons in transcranial electrical stimulation. Brain Stimul 2018; 12: 275–289. [DOI] [PubMed] [Google Scholar]
- 23.Datta A, Bikson M, Fregni F. Transcranial direct current stimulation in patients with skull defects and skull plates: high-resolution computational FEM study of factors altering cortical current flow. Neuroimage 2010; 52: 1268–1278. [DOI] [PMC free article] [PubMed] [Google Scholar]
- 24.Li LM, Kolias AG, Guilfoyle MR, et al. Outcome following evacuation of acute subdural haematomas: a comparison of craniotomy with decompressive craniectomy. Acta Neurochir (Wien) 2012; 154: 1555–1561. [DOI] [PubMed] [Google Scholar]
- 25.Tagliaferri F, Zani G, Iaccarino C, et al. Decompressive craniectomies, facts and fiction: a retrospective analysis of 526 cases. Acta Neurochir (Wien) 2012; 154: 919–926. [DOI] [PubMed] [Google Scholar]
- 26.Wagner S, Schnippering H, Aschoff A, et al. Suboptimum hemicraniectomy as a cause of additional cerebral lesions in patients with malignant infarction of the middle cerebral artery. J Neurosurg 2001; 94: 693–696. [DOI] [PubMed] [Google Scholar]
- 27.De Bonis P, Pompucci A, Mangiola A, et al. Post-traumatic hydrocephalus after decompressive craniectomy: an underestimated risk factor. J Neurotrauma 2010; 27: 1965–1970. [DOI] [PubMed] [Google Scholar]
- 28.Lee HK, Ahn SJ, Shin YM, et al. Does transcranial direct current stimulation improve functional locomotion in people with Parkinson's disease? A systematic review and meta-analysis. J Neuroeng Rehabil 2019; 16: 84. [DOI] [PMC free article] [PubMed] [Google Scholar]


