Abstract
Per capita fructose consumption has increased 100-fold over the last century1. Epidemiological studies suggest that excessive fructose consumption, and especially consumption of sweet drinks, is associated with hyperlipidaemia, non-alcoholic fatty liver disease, obesity and diabetes2–7. Fructose metabolism begins with its phosphorylation by the enzyme ketohexokinase (KHK), which exists in two alternatively spliced forms8. The more active isozyme, KHK-C, is expressed most strongly in the liver, but also substantially in the small intestine9,10 where it drives dietary fructose absorption and conversion into other metabolites before fructose reaches the liver11–13. It is unclear whether intestinal fructose metabolism prevents or contributes to fructose-induced lipogenesis and liver pathology. Here we show that intestinal fructose catabolism mitigates fructose-induced hepatic lipogenesis. In mice, intestine-specific KHK-C deletion increases dietary fructose transit to the liver and gut microbiota and sensitizes mice to fructose’s hyperlipidaemic effects and hepatic steatosis. In contrast, intestine-specific KHK-C overexpression promotes intestinal fructose clearance and decreases fructose-induced lipogenesis. Thus, intestinal fructose clearance capacity controls the rate at which fructose can be safely ingested. Consistent with this, we show that the same amount of fructose is more strongly lipogenic when drunk than eaten, or when administered as a single gavage, as opposed to multiple doses spread over 45 min. Collectively, these data demonstrate that fructose induces lipogenesis when its dietary intake rate exceeds the intestinal clearance capacity. In the modern context of ready food availability, the resulting fructose spillover drives metabolic syndrome. Slower fructose intake, tailored to intestinal capacity, can mitigate these consequences.
To modulate fructose catabolism in an organ-specific manner, we generated KHK-C floxed mice by inserting loxP sites flanking a KHK-C-specific exon by using the CRISPR–Cas9 system (Extended Data Fig. 1a). Ablation of KHK-C in intestinal epithelial cells with the Villin-Cre driver eliminated KHK-C messenger RNA and protein in the intestine. Expression in the liver was unaltered (Extended Data Fig. 1b). KHK-A, an alternatively spliced isoform that carries out the same reaction14, was modestly induced in the intestine (Extended Data Fig. 1c). Thus, genetic manipulation decreased but did not eliminate intestinal KHK activity.
Fructose and glucose are present in equal amounts in common table sugar, sucrose. High-fructose corn syrup also contains a blend of fructose and glucose. To probe intestinal fructose metabolism, we administered mice stable-isotope-labelled fructose (13C-fructose) and unlabelled glucose in a 1:1 ratio via oral gavage. Production of labelled fructose-1-phosphate (F1P), the enzyme’s product8, was strongly decreased in the duodenum and jejunum of intestine-specific KHK-C knockout mice (Extended Data Fig. 1d,e). Metabolic intermediate concentrations do not always correlate with pathway flux15. Thus, rather than relying on depleted intestinal F1P to indicate impaired intestinal fructose catabolism, we performed quantitative analysis of intestinal fructose catabolic flux based on portal-systemic differences in serum metabolite labelling13. Consistent with some residual intestinal KHK activity due to retained KHK-A, the analysis indicated an approximately 50% decrease in small-intestinal conversion of fructose into glucose and other metabolites (Fig. 1a,b). After fructose gavage in wild-type mice, the smaller change in flux than F1P levels may reflect F1P levels saturating downstream enzymes. Despite the residual intestinal fructose catabolism, its approximately 50% decreased flux was impactful: while we did not detect differences in fructose levels in the lumen of the large intestine (Extended Data Fig. 1f), isotope-labelled short-chain fatty acids (acetate, propionate and butyrate) generated from fructose by colonic microbiota were increased in knockout mice, suggesting reduced small-intestinal fructose absorption (Extended Data Fig. 1g). In addition, intestinal KHK-C knockout led to more than twice as much fructose passed intact to the liver via the portal circulation (Fig. 1c). Consequently, hepatic F1P production increased markedly (Fig. 1d). Thus, small-intestinal fructose metabolism decreases fructose spillover to the liver and colonic microbiome. Such spillover can stimulate hepatic lipogenesis by activating lipogenic gene transcription and providing microbiome-derived lipogenic carbon substrates such as acetate16.
Fig. 1 |. Intestine-specific KHK-C ablation enhances hepatic fructose exposure and lipogenesis.
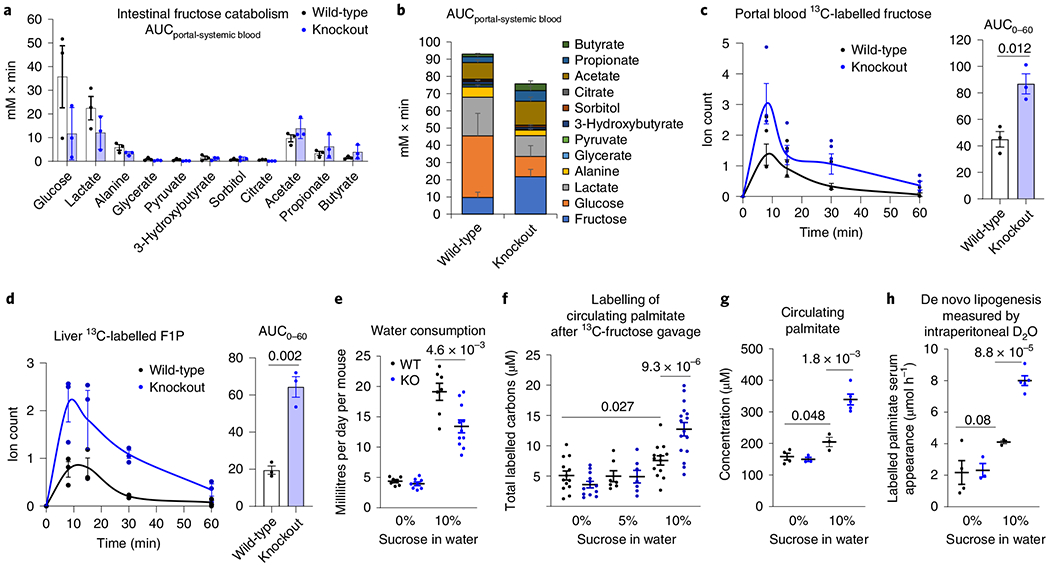
a,b, The intestine-specific KHK-C knockout mice showed decreased intestinal fructose catabolism, quantified by less release of fructose catabolic products into the portal vein. a, Measurements are based on the labelled metabolite concentration differences between portal and systemic blood (n = 3 mice per group). b, Stacked bars with fructose data added. c,d, Intestinal fructose catabolism suppresses fructose spillover to the liver. Mice received a 1:1 mixture of 13C-fructose and unlabelled glucose (1 g kg−1 each) via oral gavage and the levels of labelled fructose in the portal circulation (c) and F1P in the liver (d) were measured (n = 3 mice for each time point). The AUC is shown on the right. e, Daily consumption of normal water or 10% sucrose water in wild-type and knockout mice (n = 8, 8, 7, 11 mice). f–h, Ablation of intestinal fructose catabolism augments lipogenesis. After 8 weeks drinking normal water, 5% or 10% sucrose water, mice received a 1:1 mixture of 13C-fructose and unlabelled glucose (1 g kg−1 each) via oral gavage; the total 13C-labelled carbons in saponified circulating palmitate were measured after 6 h (f) (n = 13, 12, 7, 7, 13, 16 mice). Alternatively, mice received 100% D2O via intraperitoneal injection. Then, the total saponified circulating palmitate concentration was measured (g) and the rate of appearance of newly synthesized palmitate in circulating lipids based on the measurement of saponified palmitate labelling after 6 h was determined (h) (n = 4, 3, 3, 5 mice). Data are the mean ± s.e.m. The numbers in the graphs indicate P values obtained by two-sided Student’s t-test.
In human patients with non-alcoholic steatohepatitis, hepatic lipogenesis accounts for up to 38% of liver palmitate17, reflecting an important contribution of lipogenesis. To examine whether ablation of intestinal fructose catabolism affects hepatic lipogenesis, we switched knockout and littermate control (wild-type) mice from normal to sucrose-containing drinking water (10% sucrose, equivalent to the concentration of fructose in typical soda18,19). Chronic sucrose drinking for 8 weeks strongly induced intestinal expression of fructolytic enzymes in wild-type but had a lesser effect in knockout mice (Extended Data Fig. 2a), indicating that intestinal KHK-C is required for the intestinal induction of fructolytic genes9. Both knockout and wild-type mice drank more sweetened water than normal water, although knockout mice drank less sweetened water than wild-type mice (Fig. 1e). Compensating for this, when on sucrose water, knockout mice tended to eat more chow, resulting in indistinguishable total energy intake (Extended Data Fig. 2b). Unlike whole-body KHK-A/C double knockout mice10, which urinated copious fructose, intestine-specific KHK-C knockout mice did not, reflecting intact fructose catabolism in other organs. Fasting glucose, insulin levels, body weight changes and epididymal fat pad weights were similar between wild-type and knockout mice (Extended Data Fig. 2c,d).
To measure the usage of fructose carbons for lipogenesis, we administered mice 13C-fructose with unlabelled glucose via oral gavage. To assess total fatty acids, whether free or esterified in lipids, samples were saponified before fatty acid labelling analysis. We observed extensive palmitate labelling in serum and liver, but not in the small intestine (Extended Data Fig. 3a). The relative abundances of different labelled forms were similar across liver, serum and intestine, consistent with the labelled intestinal fat having been synthesized in the liver and exported to the intestine via the circulation. We next exposed wild-type and intestinal KHK-C knockout mice to sweetened water for 8 weeks and thereafter tested lipogenesis from fructose by 13C-fructose gavage. The sweetened water (10% sucrose) enhanced the propensity for fructose-driven lipogenesis (Fig. 1f) and correspondingly increased the amount of palmitate in circulating fat (Fig. 1g). Importantly, both of these increases were greater in knockout mice. This difference is particularly noteworthy given that knockout mice actually consumed less sweetened water (Fig. 1e); nevertheless, they responded more strongly to it.
To examine whether this increased fatty acid synthesis from fructose reflects increased total lipogenic flux, after chronic exposure to sweetened water, we performed deuterated water (D2O) tracing experiments in these mice. In knockout mice, compared to wild-type mice, overnight drinking of sucrose water containing D2O resulted in a greater abundance of deuterium-labelled saponified circulating fatty acids (Extended Data Fig. 3b). To eliminate the confounding effects of differential D2O drinking, we also administered D2O via intraperitoneal injection. We then measured saponified palmitate labelling using palmitate’s mass isotope distribution to calculate the rate of release of newly synthesized palmitate from the liver into the circulation. This rate was markedly higher in sucrose-drinking intestinal KHK-C knockout mice (Fig. 1h).
We also assessed the fractional contribution of fructose to lipogenic acetyl coenzyme A (acetyl CoA), based on the mass isotope distribution of saponified circulating palmitate after 13C-fructose gavage or overnight drinking. Fructose contributed a substantial minority of lipogenic acetyl CoA, with the fractional fructose contribution indistinguishable between wild-type and knockout mice (Extended Data Fig. 3c,d). Thus, although fructose can be a material contributor of lipogenic carbon, intestinal KHK-C impacts overall lipogenesis, rather than specifically the lipogenic contribution from fructose16.
We next examined whether impaired intestinal fructose clearance exacerbates fructose-elicited systemic and hepatic pathologies20–26. Five-month drinking of 10% sucrose water did not alter glycogen levels in the liver or intestines or induce obesity (Fig. 2a,b). However, chronic sucrose feeding induced lipogenic genes in the liver (Fig. 2c), with significantly increased total circulating triglyceride levels (Fig. 2d); this elevation was somewhat stronger in knockout mice.
Fig. 2 |. Intestine-specific KHK-C ablation worsens fructose-induced hyperlipidaemia and hepatic steatosis.
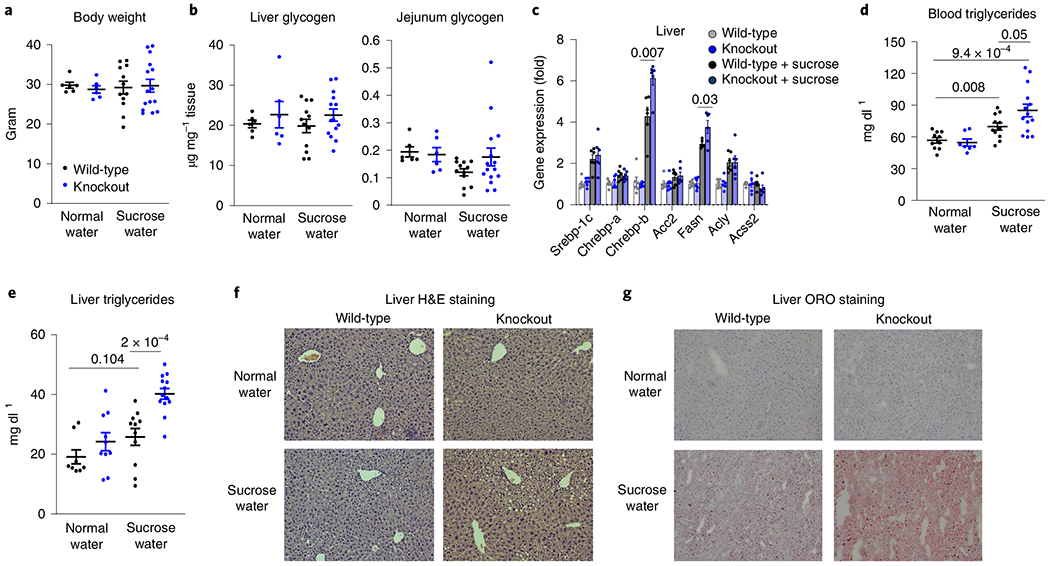
a–g, Mice received 10% sucrose water for 5 months. a, Body weights (n = 7, 8, 5, 7 mice). b, Liver and jejunum glycogen levels (n = 6, 6, 12, 15 mice). c, Hepatic lipogenic gene expression (n = 6 mice per group). d, Total circulating triglycerides (n = 10, 7, 11, 14 mice). e, Total hepatic triglycerides (n = 8, 10, 11, 13 mice). f,g, Representative liver sections after H&E (f) or ORO staining (g) from two independent experiments. Data are the mean ± s.e.m. The numbers in the graphs indicate P values obtained by two-sided Student’s t-test.
On sucrose drinking, in intestinal KHK-C knockout mice, serum lipidomics revealed elevation of circulating lipid species, including triglycerides, diglycerides and ceramides (Extended Data Fig. 4). Triglycerides also accumulated in the liver (Fig. 2e). Hepatic lipid profiling showed a preferential build-up of highly saturated triglycerides (Extended Data Fig. 5a,b). Gene expression markers for hepatic gluconeogenesis and inflammation trended up with sucrose drinking in intestinal KHK-C knockout mice, with no increase in fibrotic gene expression (Extended Data Fig. 6a–c). The observed changes in triglyceride profile are consistent with increased de novo lipogenesis, which generates saturated and monounsaturated fatty acids (for example, C16:0, C18:0, C18:1)27,28. Histological examination of the liver showed more extensive lipid accumulation in intestinal KHK-C knockout mouse livers (Fig. 2f,g). Therefore, on chronic drinking of sweetened water, mimicking routine fructose-sweetened beverage consumption in humans, intestinal fructose catabolism mitigates fructose-induced hyperlipidaemia and hepatic steatosis.
We next investigated whether genetically engineered enhancement of intestinal fructose clearance could reduce fructose spillover and associated hepatic pathology. To this end, we generated intestine-specific KHK-C overexpressing transgenic mice using a recombination-based knock-in system (Extended Data Fig. 7a). Both KHK-C mRNA and protein were selectively induced in the intestine but not in the liver (Extended Data Fig. 7b). Expression of KHK-A was unaltered (Extended Data Fig. 7c). In the intestines of transgenic mice, oral gavage of 13C-fructose produced higher levels of labelled F1P and of glycerate, a metabolite preferentially generated from fructose, whose accumulation in humans with inborn errors of metabolism can cause seizures8,13,29 (Extended Data Fig. 7d,e). Quantitative analysis revealed markedly increased intestinal conversion of incoming fructose into portal vein glucose and glycerate (Fig. 3a,b). The increased intestinal fructose catabolism led to less fructose passage into the portal circulation (Fig. 3c). Consequently, hepatic labelled F1P was decreased (Fig. 3d).
Fig. 3 |. Intestine-specific KHK-C overexpression suppresses fructose spillover and hepatic lipogenesis.
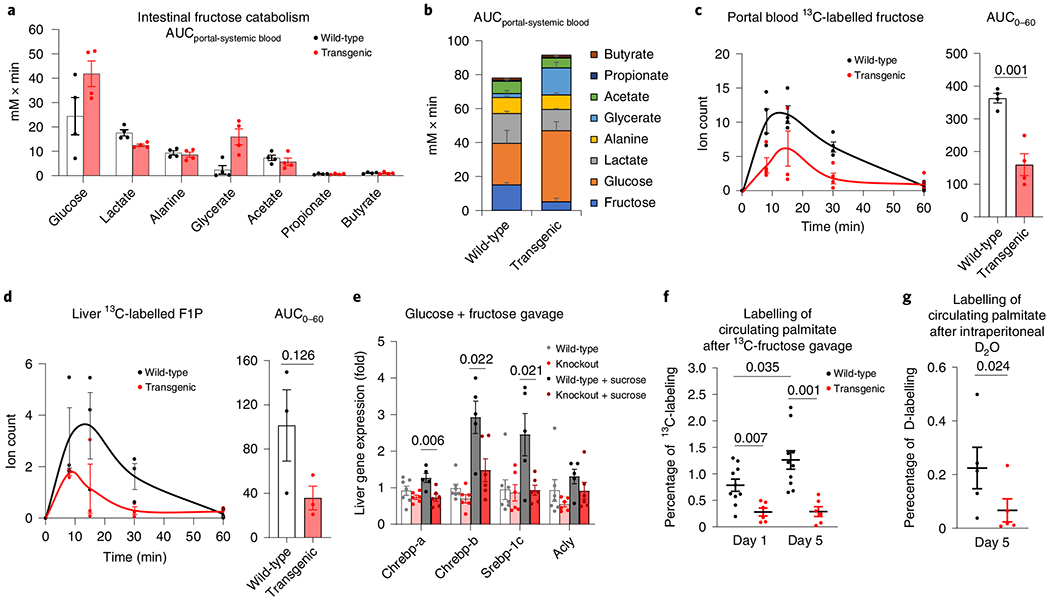
a,b, Intestine-specific KHK-C transgenic mice showed increased intestinal fructose catabolism, quantified by more release of fructose catabolic products into the portal vein (n = 4 mice per group) (a); stacked bars with fructose data added (b). c,d, Mice received a 1:1 mixture of 13C-fructose and unlabelled glucose (1 g kg−1 each) via oral gavage. The levels of labelled fructose in the portal circulation (c, n = 4 mice for each time point) and F1P in the liver (d, n = 3 mice for each time point) were measured. The AUC is shown on the right. e, Mice received saline or a 1:1 mixture of fructose and glucose (2 g kg−1 each) via oral gavage. After 2 h, the mRNA levels of the indicated genes in the liver were measured (n = 7, 6, 5, 5 mice). f,g, Mice received a 1:1 mixture of fructose and glucose (2 g kg−1 each) via oral gavage twice a day for 5 d. On the first (day 1) or last day (day 5), mice received a 1:1 mixture of 13C-fructose and unlabelled glucose (2 g kg−1 each) via oral gavage and the 13C-labelling of blood palmitate was measured after 6 h (f) (n = 10 wild-type mice, n = 6 transgenic mice). Alternatively, on day 5, mice received 100% D2O via intraperitoneal injection and deuterium labelling of blood palmitate was measured after 6 h (g) (n = 5 mice). Data are the mean ± s.e.m. The numbers in the graphs indicate P values obtained by two-sided Student’s t-test.
To examine whether intestine-specific KHK-C transgenic mice were protected from the lipogenic effects of fructose, we gave the transgenic mice and littermate controls sucrose water. Both groups of mice retained normal body weight (Extended Data Fig. 8a). Encouragingly, while wild-type mice showed marked triglyceride alterations, these were absent in transgenic mice (Extended Data Fig. 8b). However, this experiment was complicated by transgenic mice showing fructose aversion (Extended Data Fig. 8c). Fructose aversion is a classic symptom of an inborn error of human metabolism, hereditary fructose intolerance, which results from impaired aldolase B enzyme activity and thus F1P accumulation30,31. We reasoned that enhanced intestinal KHK-C activity could induce an imbalance between F1P production (accelerated) and consumption (normal). Indeed, consistently with the concept that the downstream steps of fructose catabolism can be saturated, we observed dramatic F1P accumulation in the caecum of transgenic mice after fructose gavage (Extended Data Fig. 9a). Thus, although intestinal histology and fructose absorption were unaltered (Extended Data Fig. 9b,c), we speculate that, in transgenic mice, caecal aldolase activity is insufficient to keep up with the elevated KHK-C (Extended Data Fig. 9d), resulting in F1P build-up and fructose aversion32.
Because of this aversion phenotype, we did not perform long-term fructose feeding studies with the intestine-specific KHK-C transgenic mice. Instead, to control their fructose intake, we administered high-dose fructose and glucose by oral gavage (2 g kg−1 twice daily) to induce lipogenesis33. After 5 d of daily fructose gavage, fructolytic enzymes downstream of KHK-C were similarly induced in the jejunum across wild-type and transgenic mice (Extended Data Fig. 9e). Lipogenic transcription factors were strongly induced in the livers of wild-type mice and this stimulation was blunted in transgenic mice (Fig. 3e). We then gavaged mice with 13C-fructose and unlabelled glucose to measure lipogenesis. Wild-type mice displayed significantly increased fructose conversion to circulating fat at day 5 compared to day 1 (Fig. 3f and Extended Data Fig. 9f), indicating induction of fructose-mediated lipogenesis. Strikingly, on both days, transgenic mice showed much lower labelled fatty acids from fructose (Fig. 3f and Extended Data Fig. 9f). D2O tracing also indicated lower total lipogenesis (Fig. 3g and Extended Data Fig. 9g). Thus, enhanced intestinal fructose clearance suppressed fructose from inducing hepatic lipogenesis.
Our genetic data suggest potential benefits of activating intestinal fructose catabolism. However, an alternative strategy is to slow dietary fructose intake, to avoid overwhelming the capacity of intestinal clearance. While there is extensive discussion in the literature about the importance of fructose consumption rate, controlled experiments are needed34–37. To this end, we fed mice, via oral gavage, high-dose fructose once (2 g kg−1 ×1) or the same total dose divided into fourths, administered every 15 min (0.5 g kg−1 ×4) (Fig. 4a). Compared to mice receiving the single high dose, those receiving the divided doses showed greater intestinal F1P generation and conversion of fructose into lactate (Fig. 4b and Extended Data Fig. 10a). Fructose spillover into the portal circulation and F1P generation in the liver were decreased (Fig. 4c,d). After the bolus dose, not only fructose spillover, but also fructose conversion into glucose increased (Fig. 4c and Extended Data Fig. 10a), resulting in enhanced liver exposure to both glucose and fructose and induction of hepatic lipogenic genes (Fig. 4e). D2O administration before fructose gavage revealed lipogenesis induction only after the single high-fructose dose (Fig. 4f). Consistent with the stronger lipogenic effects of fructose than glucose33, induction of lipogenesis was much weaker after gavage with glucose alone (Fig. 4g).
Fig. 4 |. Slow fructose consumption augments intestinal fructose clearance and suppresses lipogenesis.
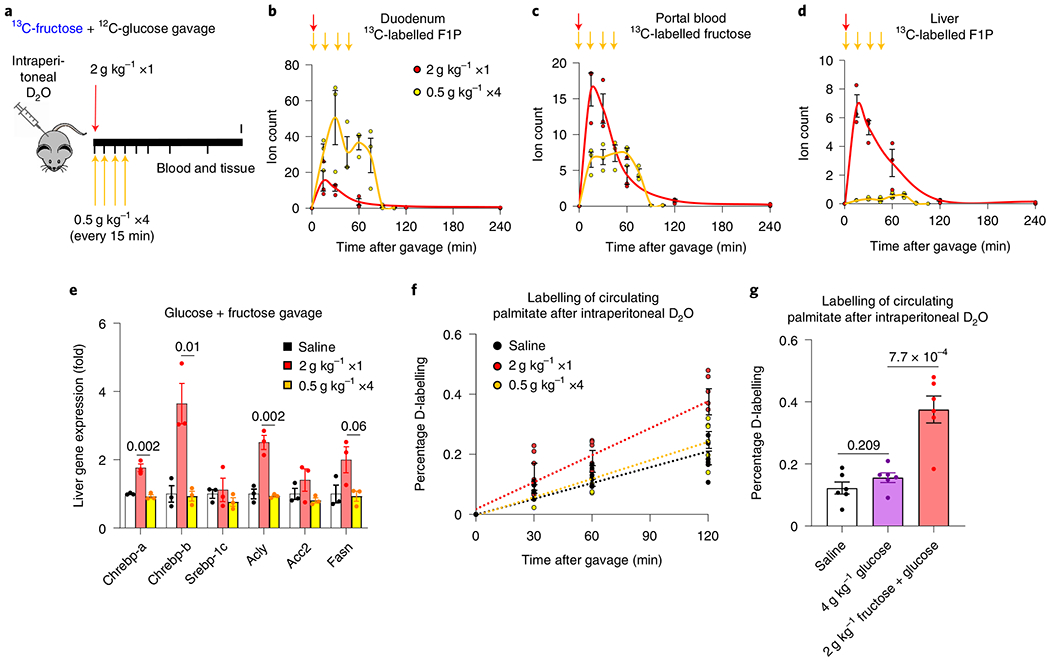
a, Experimental design for bolus versus divided-dose fructose feeding. Mice received a 1:1 mixture of 13C-fructose and unlabelled glucose (2 g kg−1) via oral gavage. The same total quantity of fructose was administered as a single high dose or divided doses over 45 min. b–d, Then, the labelled F1P in the duodenum (b), fructose in the portal circulation (c) and F1P in the liver (d) were measured (n = 3 mice for each time point). The arrows indicate the timing of gavages. e, Two hours after the last gavage, the mRNA levels of the indicated genes in the liver were measured (n = 3 mice per group). f, Mice received D2O via intraperitoneal injection. After 30 min, mice received saline or bolus versus divided doses of glucose and fructose (1:1 mixture). Then, deuterium labelling of blood palmitate was measured (n = 6 mice per group). Time 0 indicates the first gavage. g, Mice received D2O via intraperitoneal injection. After 30 min, mice received saline, glucose alone or glucose and fructose (1:1 mixture). After 2 h, deuterium labelling of blood palmitate was measured (n = 6 mice per group). Data are the mean ± s.e.m. The numbers in the graphs indicate P values obtained by two-sided Student’s t-test.
We also compared fast versus slow fructose exposure over a longer duration by providing mice 10% sucrose in drinking water (liquid) or hydrogel (solid) for 7 d (Extended Data Fig. 10b). On the last day, we added D2O to the sweetened drinking water or hydrogel. The D2O served two purposes: (1) quantitative assessment of consumption based on resulting circulating D2O enrichment; and (2) lipogenesis quantitation. Both groups of mice consumed similar amounts of the sweetened substrate (water or hydrogel) (Extended Data Fig. 10c), but mice that received the sweetened hydrogel showed less deuterium-labelled fat (Extended Data Fig. 10d). Thus, slower fructose consumption, even without changing total intake, can prevent fructose-induced hepatic lipogenesis.
Consistent with this notion, a recent mouse study showed that sucrose water, but not equivalent levels of sucrose chow, led to increased adipose mass and glucose intolerance38. Indeed, despite containing fructose, fruit seems to be healthful, probably because its fibre content slows fructose absorption39–43. In contrast, the rapid consumption of sugary beverages (soda, juice) appears to be especially problematic due to enhanced fructose spillover both to the liver, which elevates hepatic F1P and thereby lipogenic signalling, and to the colonic microbiota, which convert fructose into acetate, a preferred hepatic lipogenic carbon substrate16,34–37,44–46.
During mammalian evolution, fructose-induced lipogenesis was presumably beneficial for promoting carbon storage during times of plenty. Logically, lipogenesis should be induced only when fructose is genuinely abundant. Intestinal fructose clearance helps avoid inappropriate hypersensitivity of the liver to modest quantities of fructose. At the same time, when large quantities of fructose are ingested, the limited capacity of intestinal fructose clearance sends fructose both to the liver and microbiome, ensuring adequate lipogenic signalling and substrate availability.
In the context of a modern diet, where both fructose and calories are often in pathological excess, this physiological function of the small intestine appears to be protective against fructose-induced pathology. Further studies are needed to examine health effects over the longer term in mice, and eventually in humans, including different patient populations. Avoiding sweets may be particularly important in patients with impaired intestinal function. Patients with inflammatory bowel disease are at increased risk of non-alcoholic fatty liver disease (NAFLD)47–49. In light of our data, one potential mechanism is that chronic intestinal inflammation impairs the capacity of intestinal fructose clearance (and/or increases fructose leakage into the portal circulation via loosened epithelial tight junctions), thereby enhancing fructose hepatotoxicity.
The beneficial role of intestinal fructose clearance is also important to consider in designing treatments for NAFLD. Complete absence of fructose catabolism in KHK-A/C whole-body double knockout mice prevents fructose-induced hepatic steatosis10,50. Motivated by these findings, orally available KHK-C inhibitors have been developed51,52. The most advanced inhibitor showed benefits in NAFLD in a recent phase 2 clinical trial. While encouraging, it is possible that superior results can be obtained with inhibitors that preferentially localize to the liver and thereby leave intestinal fructose clearance capacity intact.
Methods
Generation of intestine-specific KHK-C-overexpressing transgenic and floxed mice.
Ethical approval for the animal studies was obtained from Princeton University or the University of Pennsylvania Institutional Animal Care and Use Committees. For the generation of KHK-C transgenic mice, full-length complementary DNA of mouse KHK-C (catalogue no. MR204149; Origene) was subcloned into pBS31’ tetO promoter/RBGpA (catalogue no. MES4487; Thermo Scientific Open Biosystems) and transfected to KH-2 cells harbouring reverse tetracycline-controlled transactivator (rtTA) in the ROSA26 locus. A targeted embryonic stem cell clone was used to generate chimeric mice. Chimeric mice were then bred with C57bL/6J mice to breed out M2rtTA from the Rosa26 locus. KHK-C transgene positive; M2rtTA negative progenies were then bred with the Villincre mice (stock no. 004586; The Jackson Laboratory) harbouring rtTA-internal ribosome entry site-green fluorescent protein, rtTAloxP in Rosa26 (stock no. 005670; The Jackson Laboratory). Transgene expression was induced by doxycycline in drinking water (2 mg ml−1 with 1% sucrose to remove the bitter taste of the drug). To generate intestine-specific KHK-C floxed mice, two single-guide RNAs were designed to target the genomic DNA around exon 2C, a KHK-C isoform-specific exon. Also, two template single-strand DNAs, each containing a loxP site and the flanking region of exon 2C, were generated by chemical synthesis. A mixture of guide RNAs, template DNAs and Cas9 mRNA were injected into C57bL/6J mouse zygotes at the Transgenic and Chimeric Mouse Facility, University of Pennsylvania. Then, pups that had successful recombination in the genome were screened by PCR.
Mouse gavage and sucrose feeding.
Mice were group-housed on a normal light-dark cycle (7:00–20:00) with free access to chow and water. For the daily fructose gavage experiments, 9–11-week-old male intestine-specific KHK transgenic mice and littermate controls received a 1:1 mixture of glucose and fructose (2 g kg−1 each) via oral gavage (10 μl g−1 body weight) with a plastic feeding tube (Instech Laboratories) at 10:00 and 18:00 for 5 consecutive days. For long-term ad libitum sucrose feeding experiments, 8–12-week-old male and female intestine-specific KHK transgenic or knockout mice and their respective littermate controls were fed sucrose in the drinking water (10% w/v) for 8 weeks or 5 months. Multiple cohorts were used and data were combined. To measure water and food intake after 8 weeks of ad libitum sucrose feeding, mice were singly housed and fed drinking water and chow ad libitum overnight (18:00–10:00); the weights of water bottles and chow were measured before and after. For the experiments involving sweetened hydrogel feeding, 8–10-week-old male C57BL/6NCrl mice (strain 027; Charles River Laboratories) were used. HydroGel (catalogue no. 70-01-5022; ClearH2O) containing 10% sucrose was freshly prepared daily by mixing 40% sucrose-containing drinking water with HydroGel (melted in a microwave) at a 1:3 (v/v) ratio. Then, the mixture was cooled to room temperature to solidify the sweetened HydroGel.
In vivo isotope tracing.
To quantify intestinal fructose metabolism, 9–12-week-old male intestine-specific KHK transgenic or knockout mice and their respective littermate controls received a 1:1 mixture of [U-13C]fructose (catalogue no. CLM-1396-PK; Cambridge Isotope Laboratories) and unlabelled glucose in saline (0.9% NaCl) via oral gavage at 9:00. After different durations, mice were anesthetized with 1–3% isoflurane via a nose cone for 1–2 min. Then, blood (approximately 10 μl) was collected by tail bleeding in blood collection tubes (Sarstedt, catalogue no. 16.443.100) and placed on ice. Immediately after tail blood collection, the abdominal cavity was opened and adipose tissue and intestines were quickly displaced to identify the portal vein. The portal vein was cut with sharp scissors and leaking blood (approximately 20 μl) was immediately collected by a pipette with a blunted 200-μl tip and transferred to blood collection tubes stored on ice. The blood samples were clotted for 20 min on ice and centrifuged at 16,000g for 10 min at 4 °C to obtain serum. Successful isolation of portal vein blood was verified by much higher (>20×) concentrations of secondary bile acids and short-chain fatty acids than blood from the tail vein or carotid artery. To measure lipogenesis with 13C-fructose gavage, intestine-specific KHK knockout mice and littermate controls were fed normal water or 10% sucrose water for 8 weeks. Then, mice received a 1:1 mixture of glucose and 13C-fructose (2 g kg−1 each) via oral gavage (10 μl g−1 body weight) at 9:00 and tail blood was collected at 15:00 on the same day. To measure lipogenesis with D2O tracing, intestine-specific KHK knockout mice and littermate controls were fed normal water or 10% sucrose water for 8 weeks. Then, mice were fed drinking water that contained 50% D2O with or without 10% sucrose ad libitum at 18:00 and tail blood was collected at 9:00 the next day. Alternatively, mice received D2O containing 0.9% NaCl by intraperitoneal injection (30 μl g−1) at 9:00 and tail blood was collected at 15:00 on the same day. For the bolus versus divided-dose fructose feeding experiments, 8-week-old male C57BL/6NCrl mice were used. One group of mice received a 1:1 mixture of 13C-fructose and unlabelled glucose (2 g kg−1) via oral gavage (10 μl g−1 body weight) at 9:30; tail blood and the liver were collected after different durations. Another group of mice received the same total quantity of fructose and glucose via oral gavage (2.5 μl g−1 body weight) every 15 min from 9:00 and tail blood and the liver were collected after different durations. Alternatively, mice received D2O containing 0.9% NaCl by intraperitoneal injection at 9:00. After 30 min, mice received saline or bolus (10 μl g−1 body weight) versus divided doses (2.5 μl g−1 body weight) of unlabelled glucose and fructose (1:1 mixture). After different durations, tail blood was collected.
Sample preparation and metabolite extraction.
Serum (5 μl) was mixed with 150 μl −20 °C 40:40:20 methanol:acetonitrile:water (extraction solvent), vortexed and immediately centrifuged at 16,000g for 10 min at 4 °C. The supernatant (100 μl) was collected for liquid chromatography–mass spectrometry (LC–MS) analysis. For tissue collection, mice were killed via cervical dislocation and tissues were immediately collected and snap-frozen in liquid nitrogen with a pre-cooled Wollenberger clamp. Frozen tissue samples were ground at liquid nitrogen temperature with a CryoMill (Retsch). To minimize data variation due to tissue heterogeneity, entire tissues were collected and ground. The resulting tissue powder (approximately 20 mg) was weighed and then extracted by adding −20 °C extraction solvent, vortexed and centrifuged at 16,000g for 10 min at 4 °C. The volume of the extraction solution (μl) was 40× the weight of tissue (mg) to make an extract of 25 mg of tissue per ml of solvent. The supernatant (50 μl) was collected, evaporated under a nitrogen gas stream, immediately redissolved with 50 μl water, vortexed and centrifuged at 16,000g for 10 min at 4 °C. The supernatant (40 μl) was collected for LC-MS analysis.
Quantitative analysis of intestinal fructose metabolism.
At time t, the flux Fi(t) that the small intestinal release of a metabolite i into the portal vein is proportional to the difference ΔCi(t) between the metabolite’s concentration in the portal vein and that in the systemic circulation, giving equation (1):
| (1) |
where Qp is the regional plasma flow in the portal vein.
The total amount (Ai) of the metabolite released by the small intestine during absorption is thus given by equation (2):
| (2) |
Since the integral in equation (2) is simply the area under curve (AUC) in the plot of ΔCi(t) versus t, that is, , we can write equation (3) as:
| (3) |
Since we did not measure Qp, we have shown the ΔAUCi in Figs. 1b and 3b, and in Extended Data Fig.10a.
Measurements of metabolites, glycogen and insulin.
To measure metabolites in serum samples, a quadrupole orbitrap mass spectrometer (Q Exactive; Thermo Fisher Scientific) operating in negative ion mode was coupled to a Vanquish UHPLC system (Thermo Fisher Scientific) with electrospray ionization and used to scan from m/z 70 to 1,000 at 1 Hz, with a 75,000 resolution. LC separation was achieved on an XBridge BEH Amide column (2.1 × 150 mm2, 2.5 μm particle size, 130 Å pore size; Waters Corporation) using a gradient of solvent A (95:5 water: acetonitrile with 20 mM of ammonium acetate and 20 mM of ammonium hydroxide, pH 9.45) and solvent B (acetonitrile). Flow rate was 150 μl min−1. The LC gradient was: 0 min, 85% B; 2 min, 85% B; 3 min, 80% B; 5 min, 80% B; 6 min, 75% B; 7 min, 75% B; 8 min, 70% B; 9 min, 70% B; 10 min, 50% B; 12 min, 50% B; 13 min, 25% B; 16 min, 25% B; 18 min, 0% B; 23 min, 0% B; 24 min, 85% B; and 30 min, 85% B. The autosampler temperature was 5 °C and the injection volume was 3 μl. For the tissue samples, an Exactive Orbitrap Mass Spectrometer (Thermo Fisher Scientific) operating in negative ion mode was used to scan from m/z 75 to 1,000 with a 100,000 resolution at m/z 200. LC separation was achieved on an Atlantis T3 column (150 × 2.1 mm2, 3 μm particle size, 100 Å pore size; catalogue no. 186003719; Waters) using a gradient of solvent A (97:3 water: methanol with 10 mM of tributylamine and 15 mM of acetic acid) and solvent B (methanol). The LC gradient was 0 min, 0% B, 200 μl min−1; 2 min, 0% B, 200 μl min−1; 4 min, 20% B, 200 μl min−1; 13 min, 80% B, 200 μl min−1; 17 min, 100% B, 200 μl min−1; 17.5 min, 100% B, 300 μl min−1; 20 min, 100% B, 300 μl min−1; 20.5 min, 0% B, 300 μl min−1; 24 min, 0% B, 300 μl min−1; 25 min, 0% B, 200 μl min−1. Column temperature was 25°C, autosampler temperature was 5 °C and injection volume was 10 μl. Data were analysed using the MAVEN software (build 682). For the tracer experiments, isotope labelling was corrected for natural 13C abundance53. For tissue glycogen quantification, a colorimetric Glycogen Assay Kit (catalogue no. 65620; Abcam) was used. For insulin quantification, an Ultra Sensitive Mouse Insulin ELISA Kit (catalogue no. 90080; Crystal Chem) was used. Urine fructose and fasting serum glucose were measured by LC–MS after spiking known concentrations of 13C-labelled standards.
Measurements of circulating water fractional deuterium.
Circulating water fractional deuterium enrichment p was determined based on labelling of soluble metabolite pairs (malate-fumarate; glutamate-α-ketoglutarate; see Supplementary Fig. 1). In equation (4), the matrix on the left-hand side contains the experimentally measured mass isotope distribution for fumarate or α-ketoglutarate; M is the parent ion mass, and matrix entries indicate the fractional abundance of the isotopic form having the indicated mass. The matrix on the right-hand side contains the experimentally measured mass isotope distribution for malate or glutamate. The value of p is determined by solving the resulting linear equations:
| (4) |
Lipid measurement.
Serum (5 μl) or liver powder (20 mg) was dissolved in 150 μl or 1 ml of isopropanol, centrifuged at 16,000g for 10 min at 4 °C. The supernatant (100 μl) was transferred to a glass vial for LC–MS analysis. Lipid species were detected with a quadrupole orbitrap mass spectrometer (Q Exactive) operating in positive ion mode. LC separation was achieved on an Agilent Poroshell 120 EC-C18 column (150 × 2.1 m2, 2.7 μm particle size) using a gradient of solvent A (90:10 water: methanol with 1 mM of ammonium acetate and 0.2% acetic acid) and solvent B (2:98 methanol: isopropanol with 1 mM of ammonium acetate and 0.2% acetic acid). Flow rate was 150 μl min−1. The LC gradient was 0 min, 25% B; 2 min, 25% B; 4 min, 65% B; 16 min, 100% B; 20 min, 100% B; 21 min, 25% B; 27 min, 25% B. For serum and liver triglyceride quantification, a colorimetric Triglyceride Assay Kit (catalogue no. 65336; Abcam) was used.
Saponified fatty acid measurement.
Serum (5 μl) or liver powder (20 mg) was incubated with 0.5 ml of 0.3 M KOH in 90% methanol at 80 °C for 1 h in a 2-ml glass vial. Then, formic acid (50 μl) was added for neutralization. The saponified fatty acids were extracted by addition of 0.25 ml of hexane, vortexing and transferring the top hexane layer to a new glass vial. Samples were then dried under a nitrogen gas stream and redissolved in 100 μl (for serum) or 500 μl (for liver) of 1:1 isopropanol:methanol for LC–MS analysis. Fatty acids were detected with a quadrupole orbitrap mass spectrometer (Q Exactive) operating in negative ion mode. LC separation was achieved on a C8 column using a gradient of solvent A (90:10 water: methanol with 1 mM of ammonium acetate and 0.2% acetic acid) and solvent B (90:10 methanol:isopropanol with 1 mM of ammonium acetate and 0.2% acetic acid). The LC gradient was 0 min, 25% B; 2 min, 25% B; 4 min, 65% B; 16 min, 100% B; 20 min, 100% B; 21 min, 25% B; 22 min, 25% B; and 25 min, 25% B. Flow rate was 150 μl min−1. The injection volume was 5 μl and column temperature was 25 °C. The MS scan range was m/z 200–600 with a resolution of 140,000 at m/z 200. The automatic gain control target was 5 × 10⁵.
Quantitation of lipogenesis by D2O intraperitoneal injection.
To quantify lipogenesis, we fitted the experimentally measured palmitate deuterium mass isotope distribution to a binomial distribution model and determined an average hydrogen substrate labelling fraction (p, reflecting the average labelling across deuterium water and the active hydride of NADPH)54. Synthesis of 1 palmitate molecule (C16:0) requires incorporation of 14 hydrogen. Thus, the expected (E) number of deuterium in 1 palmitate molecule is given by equation (5):
| (5) |
We then measured the total amount of deuterium (D) incorporated into palmitate. The total newly synthesized fatty acids (F) over 6 h between D2O injection and measurements is then given by equation (6):
| (6) |
Lipogenesis (flux per hour) is calculated accordingly by equation (7):
| (7) |
Quantification of hexose carbon incorporation into palmitate.
Hexose carbons are incorporated into the lipogenic pathway via two-carbon acetyl groups. We fitted the experimentally measured palmitate 13C-mass isotope distribution to a binomial distribution model to determine the lipogenic acetyl CoA labelling fraction, based on eight acetyl units per palmitate.
Quantitative PCR with reverse transcription (qRT–PCR).
mRNA was isolated using an RNeasy Mini kit (catalogue no. 74106; QIAGEN) and reverse-transcribed with a High-Capacity cDNA Reverse Transcription Kit (catalogue no. 4368814; Applied Biosystems) according to the manufacturers’ protocols. Primers are shown in Supplementary Table 1.
Western blots.
Tissues were lysed by radioimmunoprecipitation assay buffer containing phosphatase and protease inhibitors (PhosSTOP and cOmplete Mini Protease Inhibitor Cocktail; Roche). Protein concentration was quantified using a BCA Protein Assay (Thermo Fisher Scientific); the same amount of protein (10–20 μg) was loaded onto a 4–20% gradient Tris-Glycine polyacrylamide gel (Bio-Rad Laboratories) and electrophoresed (SDS–polyacrylamide gel electrophoresis (PAGE)). After SDS–PAGE, protein samples were transferred to a polyvinylidene difluoride membrane (Millipore). Membranes were blocked with 5% skimmed milk for 1 h and then incubated with the respective primary antibodies: total KHK (catalogue no. 15681-1-AP; Proteintech); KHK Isoform A (catalogue no. 21708; Signalway Antibody); KHK Isoform C (catalogue no. 21709; Signalway Antibody); and β-Actin (13E5) (catalogue no. 4970; Cell Signaling Technology) overnight at 4 °C. Primary antibodies were diluted 1:1,000 by Protein-Free Blocking Buffer (Thermo Fisher Scientific). Appropriate horseradish peroxidase-conjugated secondary antibodies were selected according to the host species of the primary antibodies. Images were taken using a digital imager (ImageQuant LAS 4000; GE Healthcare Life Sciences).
Haematoxylin and eosin (H&E) and Oil Red O (ORO) staining.
For H&E staining, tissues were fixed overnight with 4% paraformaldehyde in PBS. The fixed tissues were then dehydrated by replacing buffer with ethanol and embedded in paraffin for sectioning. H&E staining was performed by the histology core at the University of Pennsylvania. For ORO staining, fresh tissues were embedded into optimal cutting temperature compound and frozen by submerging in liquid nitrogen-cold isopentane. Cryosectioning and ORO staining were performed by the histology core at Children’s Hospital of Philadelphia.
Statistical analysis.
A two-tailed, unpaired Student’s t-test was used to calculate P values, with P < 0.05 used to determine statistical significance.
Reporting Summary.
Further information on research design is available in the Nature Research Reporting Summary linked to this article.
Extended Data
Extended Data Fig. 1 |. Intestine-specific Khk-C ablation increases fructose spillover to the colonic microbiota.
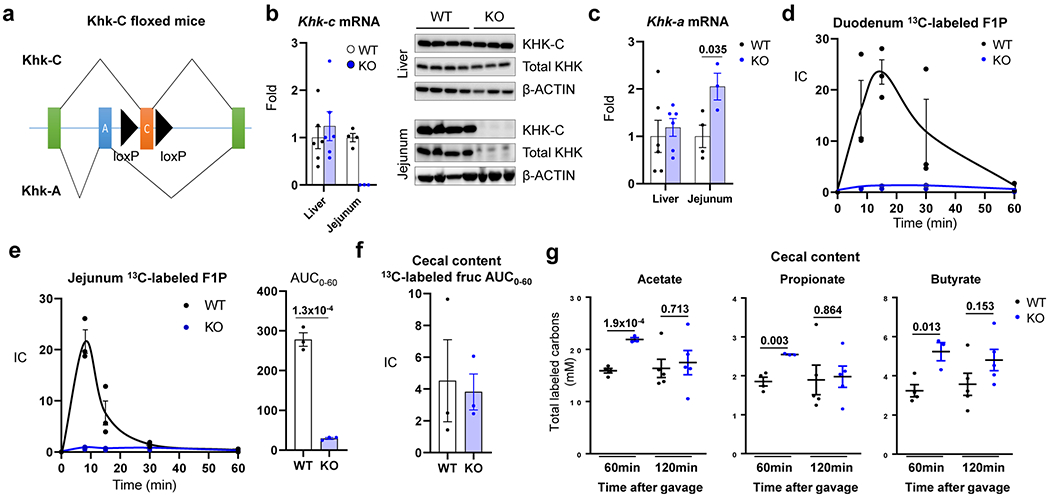
a, Khk-C floxed mice were generated by inserting two loxP sequences (black arrowheads) on both sides of a Khk-C specific exon (orange). The mice were then crossed with the Villin-Cre mice to generate intestine-specific Khk-C KO mice. b, qPCR (left) and western blots (right) show ablation of Khk-C in the jejunum but not in the liver (N = 6 mice for WT, 4 mice for KO). c, Khk-A mRNA is induced in the jejunum of KO mice (N = 6 mice for WT, 4 mice for KO). d, e, Mice received 1:1 mixture of 13C-fructose and unlabeled glucose (1 g/kg each) via oral gavage and the labeled F1P in duodenum and jejunum were measured in d and e, respectively (N = 3 mice for each time point). The AUC is shown on the right for the jejunum in e. f, AUC of labeled fructose in the cecal content over 1 h after gavage (N = 3 mice per group). g, Concentrations of total labeled carbons in acetate, propionate and butyrate in the cecal content 1 h or 2 h after gavage (N = 4, 3, 5, 5 mice). Data are mean ± standard error. Numbers in graphs indicate P-values by two-sided Student’s t-test.
Extended Data Fig. 2 |. Metabolic characterization of intestine-specific Khk-C KO mice.
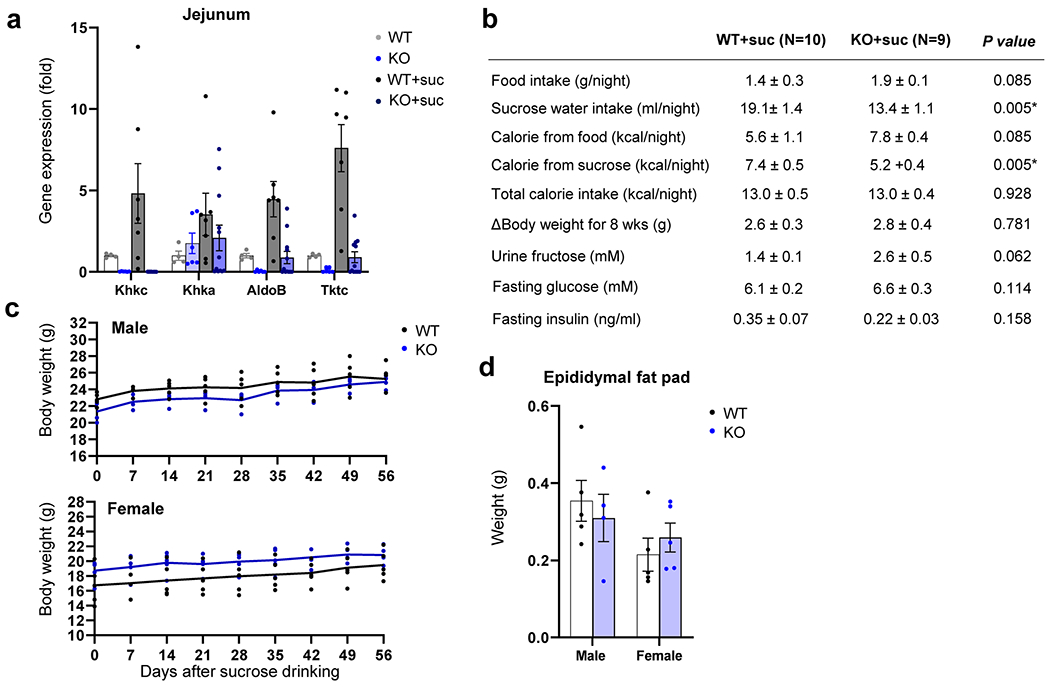
Mice received normal water or 10% sucrose water for 8 weeks. a, Fructolytic gene expression in the jejunum (N = 4, 6, 7, 12 mice). b, Metabolic parameters. P-values were calculated by two-sided Student’s t-test without adjustment for multiple comparisons. c, Body weights (N = 5 mice per group, except N = 4 mice for male KO). d, Epididymal fat pad weights (N = 5 mice per group, except N = 4 mice for male KO). Data are mean ± standard error.
Extended Data Fig. 3 |. Intestine-specific Khk-C ablation increases hepatic lipogenesis.
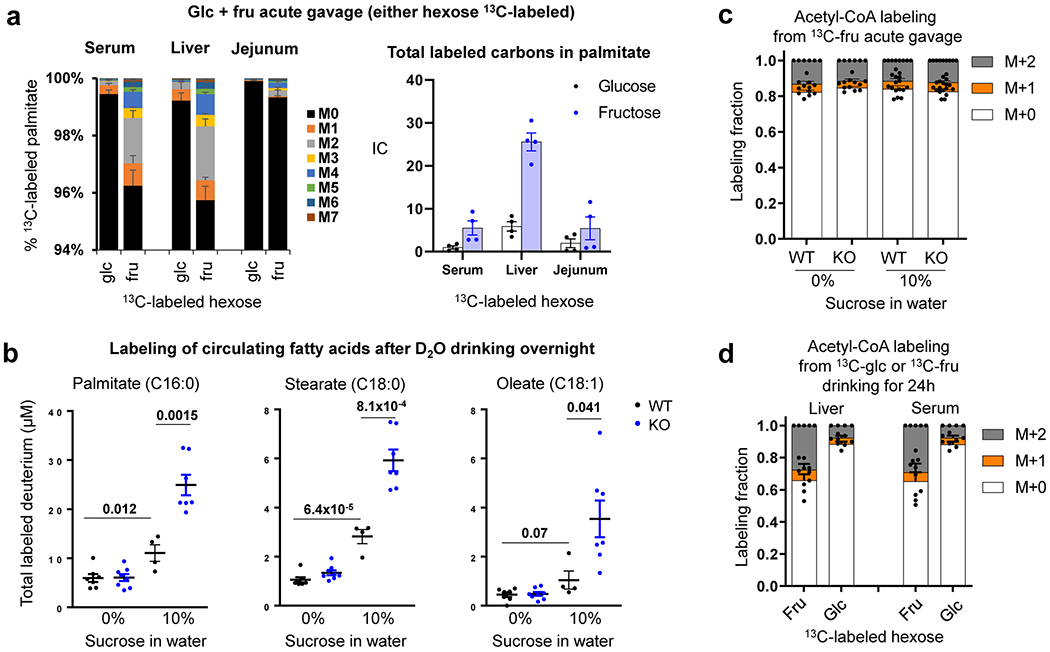
a, Mice received 1:1 mixture of fructose and glucose (either hexose 13C-labeled, 2 g/kg each) via oral gavage. After 6 h, the labeling of saponified palmitate in serum, liver and jejunum was compared (N = 6 mice per group) IC, Ion count. b, Mice received normal water or 10% sucrose water for 8 weeks. Mice received 50% D2O in the drinking water overnight. The next morning, circulating fatty acid labeling was measured. Data are reported as the total number of deuterium atoms assimilated into the indicated saponified fatty acid (product of fatty acid concentration x average number of deuteriums per fatty acid molecule) (N = 7, 8, 4, 7 mice). c, d, Fractional contribution of fructose carbons into lipogenic acetyl-CoA pools. The acetyl group labeling is inferred based on the labeled palmitate mass isotopic distribution measured 6 h after 13C-fructose gavage (with unlabeled glucose, 2 g/kg each) in c (N = 6, 6, 8, 9 mice), or 24 h after ad lib drinking fructose and glucose mixture (15% each, either hexose 13C-labeled) in d (N = 4, 5, 4, 5 mice). Data are mean ± standard error. Numbers in graphs indicate P-values by two-sided Student’s t-test.
Extended Data Fig. 4 |. Intestine-specific Khk-C ablation worsens hyperlipidemia after chronic sucrose drinking.
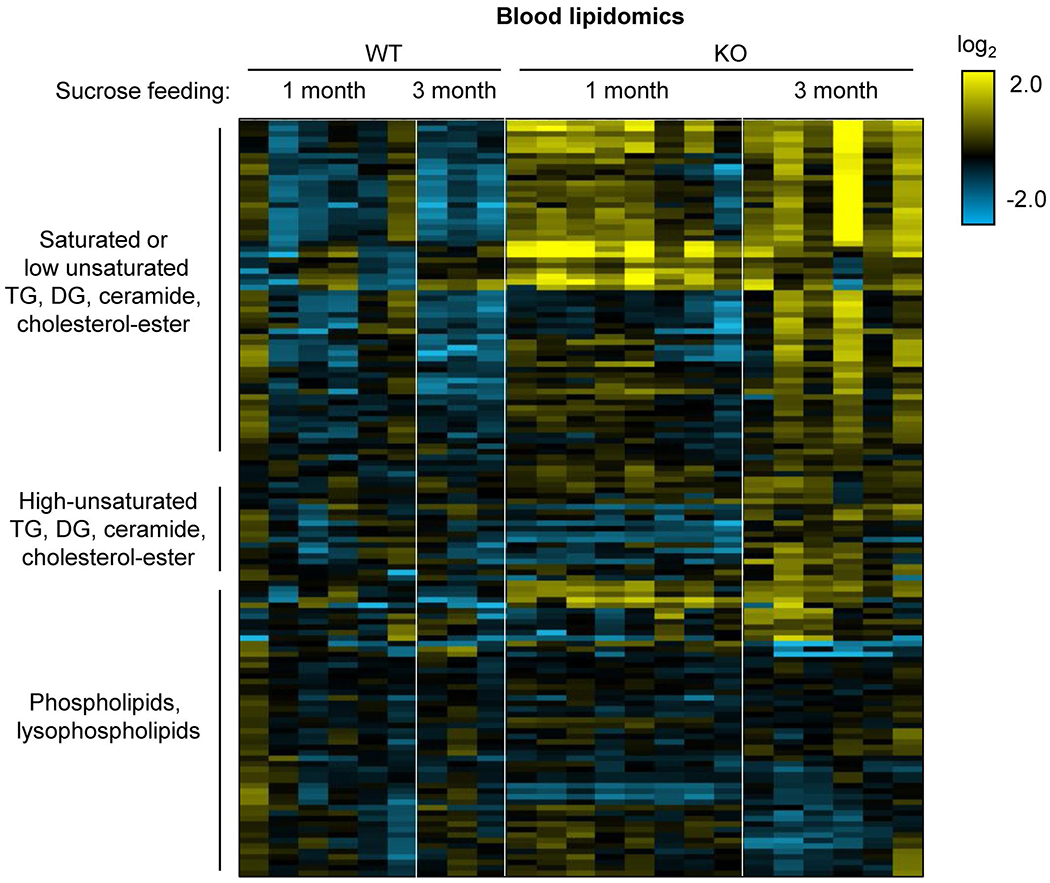
Mice received 10% sucrose water for 1 month or 3 months. Heatmap shows circulating lipid profiles measured by LC-MS. Each lipid species was normalized by the average of all mice (N = 6, 3, 8, 6 mice). TG, triglyceride; DG, diglyceride.
Extended Data Fig. 5 |. Intestine-specific Khk-C ablation worsens hepatic steatosis after chronic sucrose drinking.
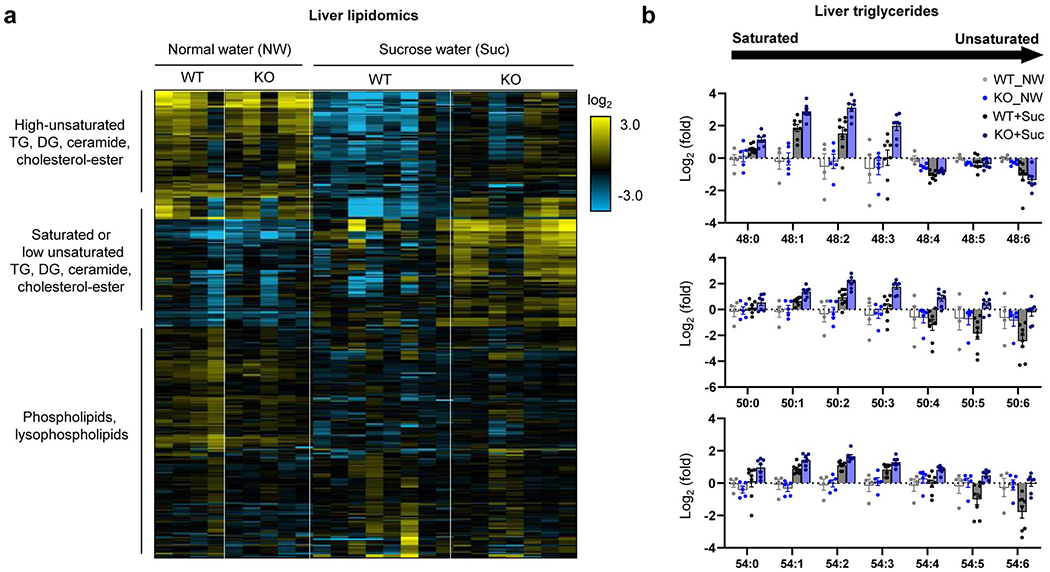
Mice received normal water (NW) or 10% sucrose water (Suc) for 5 months. a, Heatmap shows hepatic lipid profiles measured by LC-MS. Each lipid species was normalized by the average of all mice (N = 4, 5, 8, 7 mice). b, Sucrose drinking increases saturated triglycerides, consistent with increased lipogenesis. Note that the trend is stronger in the intestine-specific Khk-C KO mice. Y-axis is a log scale. Numbers on the x-axis (for example, 48:1) mean the total number of carbons (for example, 48) and the number of double bonds (for example, 1) in triglyceride, with more unsaturated triglycerides having more double bonds (N = 4, 5, 8, 7 mice). Data are mean ± standard error.
Extended Data Fig. 6 |. Hepatic gene expression profiles of intestine-specific Khk-C KO mice after chronic sucrose drinking.

a–c, Mice received normal water or 10% sucrose water for 5 months. Then, the livers were isolated at 9 AM and the mRNA levels of the indicated genes were measured (N = 6, 6, 11, 15 mice). Data are mean ± standard error. Numbers in graphs indicate P-values by two-sided Student’s t-test.
Extended Data Fig. 7 |. Intestine-specific Khk-C overexpression increases intestinal fructose catabolism.
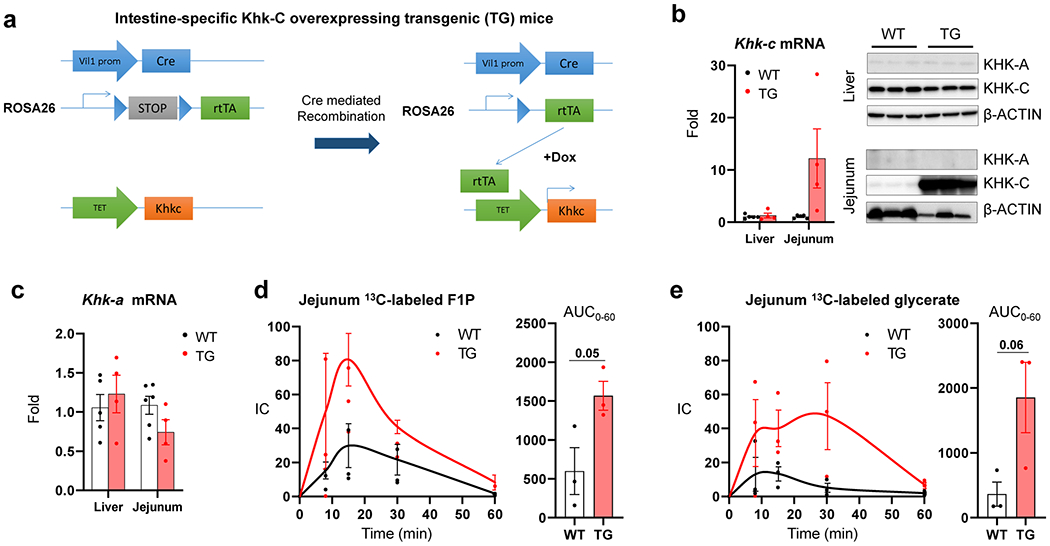
a, Khk-C inducible overexpressing transgenic (TG) mice were generated by cloning a Khk-C coding sequence (orange) under the TET-on promoter (green). Then, the mice were crossed with mice that harbored Villin-Cre driver (blue) and rtTA with a stop-codon (gray) in the ROSA26 genomic region. Mice were fed with doxycycline in the drinking water to induce deletion of the stop-codon and subsequent Khk-C overexpression in the Villin-expressing intestinal epithelial cells. b, qPCR (left) and western blots (right) show Khk-C induction in the jejunum but not in the liver (N = 4 mice per group). The exposure time for Khk-C blot in the jejunum was decreased to prevent signal saturation. c, Khk-A mRNA levels were measured in the liver or jejunum (N = 4 mice per group). d, e, Mice received 1:1 mixture of 13C-fructose and unlabeled glucose (1 g/kg each) via oral gavage and the levels of labeled F1P and glycerate in the jejunum were measured in d, e, respectively (N = 3 mice for each time point). AUC is shown on the right. Data are mean ± standard error. Numbers in graphs indicate P-values by two-sided Student’s t-test.
Extended Data Fig. 8 |. Intestine-specific Khk-C overexpression induces fructose aversion.
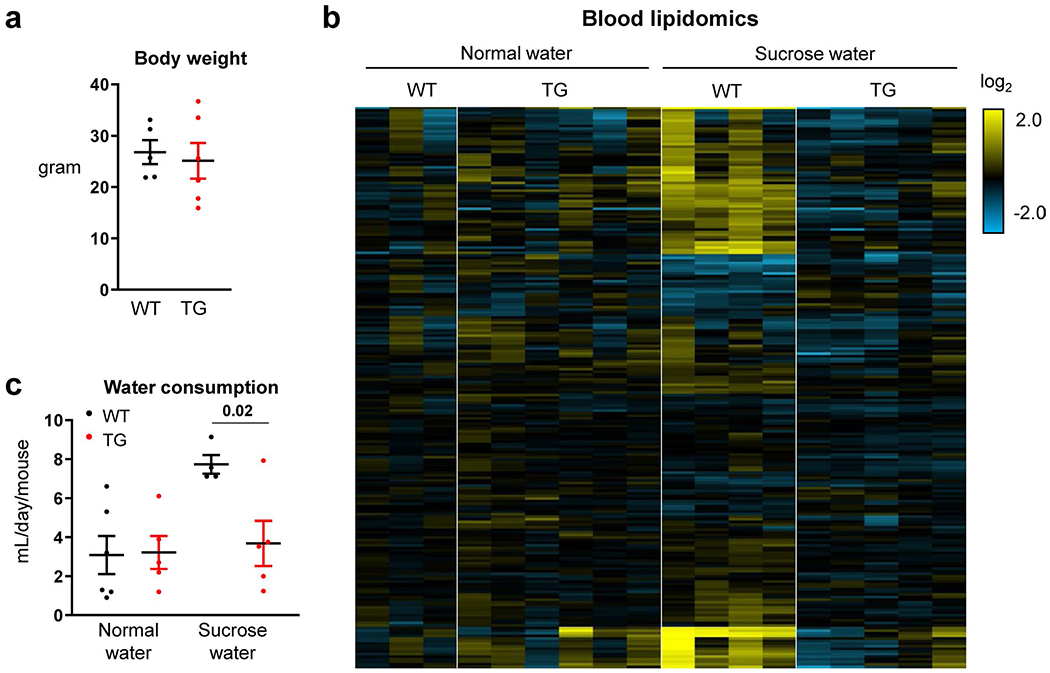
Mice received normal water or sucrose water for 3 months. a, Body weights (N = 5, 6 mice). b, Heatmap shows circulating lipid profiles measured by LC-MS. Each lipid species was normalized by the average of all mice (N = 3, 6, 4, 5 mice). c, Daily water consumption (N = 6, 5, 4, 5 mice). Data are mean ± standard error. Number in the graph indicates a P-value by two-sided Student’s t-test.
Extended Data Fig. 9 |. Intestine-specific Khk-C TG overexpression induces cecal fructose catabolism and reduces lipogenesis.
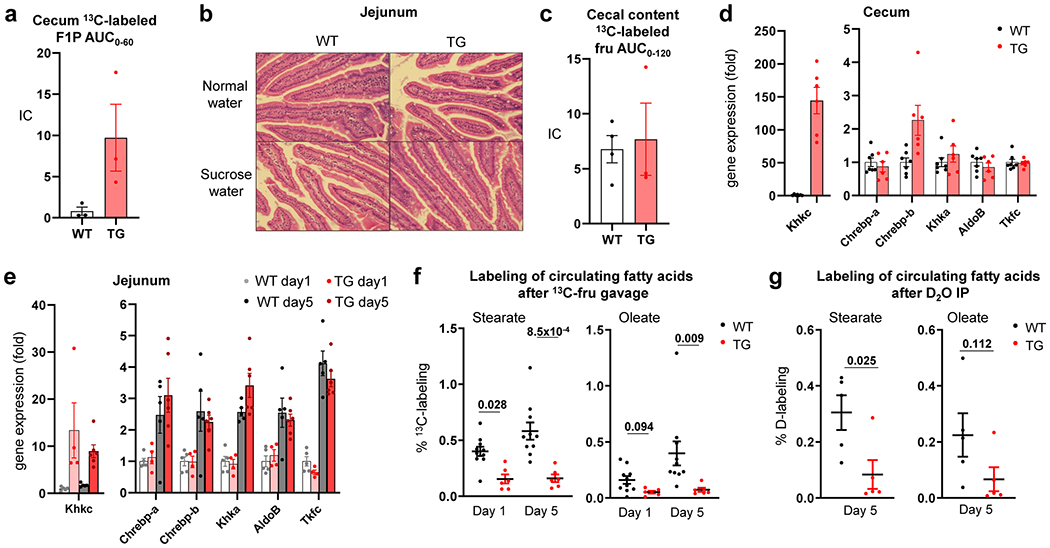
a–d, Mice received normal water or sucrose water for 3 months. Mice received 1:1 mixture of 13C-fructose and unlabeled glucose (1 g/kg) via oral gavage and the AUC of cecal labeled F1P was measured in a (N = 3 mice per group). Representative hematoxylin & eosin stained jejunum sections from two independent experiments are shown in b. Mice received 1:1 mixture of 13C-fructose and unlabeled glucose (1 g/kg) via oral gavage and the AUC of labeled fructose in the cecal content was measured in c (N = 4, 3 mice). The mRNA levels of fructolytic genes in the cecum was measured in d (N = 7, 6 mice). e-g, Mice received 1:1 mixture of fructose and glucose (2 g/kg each) via oral gavage twice a day for five days. The mRNA levels of fructolytic genes in the jejunum was measured in e (N = 5, 4, 5, 6 mice). On the first day (day 1) or the last day (day 5), the mice received 1:1 mixture of 13C-fructose and unlabeled glucose (2 g/kg each) via oral gavage and the 13C-labeling of the indicated circulating saponified fatty acids was measured after 6 h in f (N = 10 mice for WT, 6 mice for TG). Alternatively, on day 5, mice received 100% D2O via intra-peritoneal injection and the deuterium labeling of the indicated circulating saponified fatty acids was measured after 6 h in g (N = 5 mice per group). Data are mean ± standard error. Numbers in graphs indicate P-values by two-sided Student’s t-test.
Extended Data Fig. 10 |. Solid form of fructose consumption suppresses fructose-induced lipogenesis.
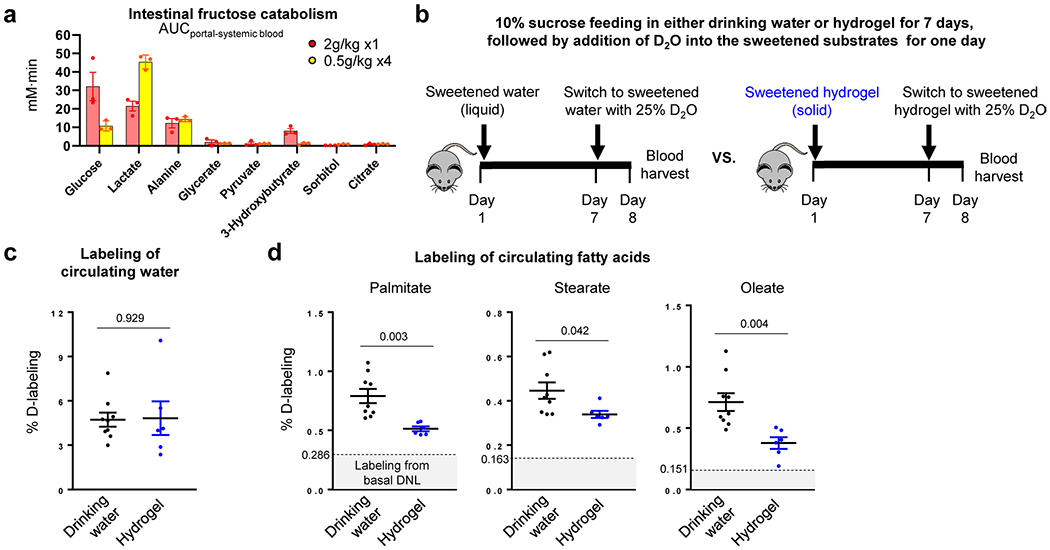
a, Mice received 1:1 mixture of 13C-fructose and unlabeled glucose (2 g/kg) via oral gavage. The same total quantity of fructose was administered as a single high-dose or divided doses over 45 min. Then, for each group, intestinal fructose catabolism was quantitated, using the labeled metabolite concentration differences between the portal and systemic blood (N = 3 mice per group). b, Experimental design for fructose drinking (10% sucrose drinking water) or eating (10% sucrose hydrogel). Mice were provided the liquid or solid containing sucrose for 7 days. On day 7, the water (in either the sucrose drinking water or the sucrose hydrogel) was 25% D2O. This served two purposes: (i) enabling precise tracking of total consumption based on circulating D2O enrichment and (ii) lipogenesis measurement. On day 8, blood was harvested. c, d, The mice that received the sweetened hydrogel showed less lipogenesis than the mice that received the sweetened drinking water. Deuterium labeling of circulating water was indistinguishable in c (N = 9, 6 mice), indicating identical total fructose consumption. Deuterium labeling of circulating saponified fatty acids was greater in the liquid group in d (N = 9, 6 mice). Data are mean ± standard error. Numbers in graphs indicate P-values by two-sided Student’s t-test.
Supplementary Material
Acknowledgements
This work was supported by a grant from the DRC Regional Metabolomics Core (no. P30 DK19525 to J.D.R.), National Institutes of Health Pioneer grant (no. 1DP1DK113643 to J.D.R.) and grant no. DK107667 to Z.A. C.J. was a postdoctoral fellow of the American Diabetes Association (no. 1–17-PDF-076). We thank members of the Arany and Rabinowitz laboratories for scientific discussions.
Competing interests
J.D.R. is a consultant and receives research funding from Pfizer and is an advisor of Colorado Research Partners and cofounder of VL54. All other authors declare no conflicts of interest.
Footnotes
Data availability
The data that support the findings of this study are available from the corresponding author (J.D.R.) upon request. Source data are provided with this paper.
Extended data is available for this paper at https://doi.org/10.1038/s42255-020-0222-9.
Supplementary information is available for this paper at https://doi.org/10.1038/s42255-020-0222-9.
References
- 1.Johnson RJ et al. Potential role of sugar (fructose) in the epidemic of hypertension, obesity and the metabolic syndrome, diabetes, kidney disease, and cardiovascular disease. Am. J. Clin. Nutr. 86, 899–906 (2007). [DOI] [PubMed] [Google Scholar]
- 2.Te Morenga L, Mallard S & Mann J Dietary sugars and body weight: systematic review and meta-analyses of randomised controlled trials and cohort studies. BMJ 346, e7492 (2012). [DOI] [PubMed] [Google Scholar]
- 3.Tsilas CS et al. Relation of total sugars, fructose and sucrose with incident type 2 diabetes: a systematic review and meta-analysis of prospective cohort studies. CMAJ 189, E711–E720 (2017). [DOI] [PMC free article] [PubMed] [Google Scholar]
- 4.Chung M et al. Fructose, high-fructose corn syrup, sucrose, and nonalcoholic fatty liver disease or indexes of liver health: a systematic review and meta-analysis. Am. J. Clin. Nutr. 100, 833–849 (2014). [DOI] [PMC free article] [PubMed] [Google Scholar]
- 5.Chiu S et al. Effect of fructose on markers of non-alcoholic fatty liver disease (NAFLD): a systematic review and meta-analysis of controlled feeding trials. Eur. J. Clin. Nutr. 68, 416–423 (2014). [DOI] [PMC free article] [PubMed] [Google Scholar]
- 6.Zhang YH et al. Very high fructose intake increases serum LDL-cholesterol and total cholesterol: a meta-analysis of controlled feeding trials. J. Nutr. 143, 1391–1398 (2013). [DOI] [PubMed] [Google Scholar]
- 7.Sievenpiper JL et al. Effect of fructose on body weight in controlled feeding trials: a systematic review and meta-analysis. Ann. Intern. Med. 156, 291–304 (2012). [DOI] [PubMed] [Google Scholar]
- 8.Heinz F, Lamprecht W & Kirsch J Enzymes of fructose metabolism in human liver. J. Clin. Invest. 47, 1826–1832 (1968). [DOI] [PMC free article] [PubMed] [Google Scholar]
- 9.Patel C et al. Effect of dietary fructose on portal and systemic serum fructose levels in rats and in KHK−/− and GLUT5−/− mice. Am. J. Physiol. Gastrointest. Liver Physiol. 309, G779–G790 (2015). [DOI] [PMC free article] [PubMed] [Google Scholar]
- 10.Ishimoto T et al. Opposing effects of fructokinase C and A isoforms on fructose-induced metabolic syndrome in mice. Proc. Natl Acad. Sci. USA 109, 4320–4325 (2012). [DOI] [PMC free article] [PubMed] [Google Scholar]
- 11.Patel C et al. Fructose-induced increases in expression of intestinal fructolytic and gluconeogenic genes are regulated by GLUT5 and KHK. Am. J. Physiol. Regul. Integr. Comp. Physiol. 309, R499–R509 (2015). [DOI] [PMC free article] [PubMed] [Google Scholar]
- 12.Villegas LR et al. Effects of fructose-containing sweeteners on fructose intestinal, hepatic, and oral bioavailability in dual-catheterized rats. PLoS ONE 13, e0207024 (2018). [DOI] [PMC free article] [PubMed] [Google Scholar]
- 13.Jang C et al. The small intestine converts dietary fructose into glucose and organic acids. Cell Metab. 27, 351-361.e3 (2018). [DOI] [PMC free article] [PubMed] [Google Scholar]
- 14.Diggle CP et al. Both isoforms of ketohexokinase are dispensable for normal growth and development. Physiol. Genomics 42A, 235–243 (2010). [DOI] [PubMed] [Google Scholar]
- 15.Lowry OH, Carter J, Ward JB & Glaser L The effect of carbon and nitrogen sources on the level of metabolic intermediates in Escherichia coli. J. Biol. Chem. 246, 6511–6521 (1971). [PubMed] [Google Scholar]
- 16.Zhao S et al. Dietary fructose feeds hepatic lipogenesis via microbiota-derived acetate. Nature 579, 586–591 (2020). [DOI] [PMC free article] [PubMed] [Google Scholar]
- 17.Smith GI et al. Insulin resistance drives hepatic de novo lipogenesis in nonalcoholic fatty liver disease. J. Clin. Invest. 130, 1453–1460 (2020). [DOI] [PMC free article] [PubMed] [Google Scholar]
- 18.Kolderup A & Svihus B Fructose metabolism and relation to atherosclerosis, type 2 diabetes, and obesity. J. Nutr. Metab. 2015, 823081 (2015). [DOI] [PMC free article] [PubMed] [Google Scholar]
- 19.Sun SZ & Empie MW Fructose metabolism in humans: what isotopic tracer studies tell us. Nutr. Metab. (Lond.) 9, 89 (2012). [DOI] [PMC free article] [PubMed] [Google Scholar]
- 20.Hannou SA, Haslam DE, McKeown NM, & Herman MA Fructose metabolism and metabolic disease. J. Clin. Invest. 128, 545–555 (2018). [DOI] [PMC free article] [PubMed] [Google Scholar]
- 21.Softic S, Cohen DE & Kahn CR Role of dietary fructose and hepatic de novo lipogenesis in fatty liver disease. Dig. Dis. Sci. 61, 1282–1293 (2016). [DOI] [PMC free article] [PubMed] [Google Scholar]
- 22.Mirtschink P, Jang C, Arany Z & Krek W Fructose metabolism, cardiometabolic risk, and the epidemic of coronary artery disease. Eur. Heart J. 39, 2497–2505 (2018). [DOI] [PMC free article] [PubMed] [Google Scholar]
- 23.Lyssiotis CA & Cantley LC Metabolic syndrome: F stands for fructose and fat. Nature 502, 181–182 (2013). [DOI] [PubMed] [Google Scholar]
- 24.Jegatheesan P & De Bandt J-P Fructose and NAFLD: the multifaceted aspects of fructose metabolism. Nutrients 9, 230 (2017). [Google Scholar]
- 25.Caliceti C, Calabria D, Roda A & Cicero AFG Fructose intake, serum uric acid, and cardiometabolic disorders: a critical review. Nutrients 9, 395 (2017). [DOI] [PMC free article] [PubMed] [Google Scholar]
- 26.Bray GA, Nielsen SJ & Popkin BM Consumption of high-fructose corn syrup in beverages may play a role in the epidemic of obesity. Am. J. Clin. Nutr. 79, 537–543 (2004). [DOI] [PubMed] [Google Scholar]
- 27.Spector AA & Kim H-Y Discovery of essential fatty acids. J. Lipid Res. 56, 11–21 (2015). [DOI] [PMC free article] [PubMed] [Google Scholar]
- 28.Ameer F, Scandiuzzi L, Hasnain S, Kalbacher H & Zaidi N De novo lipogenesis in health and disease. Metabolism 63, 895–902 (2014). [DOI] [PubMed] [Google Scholar]
- 29.Duran M, Beemer FA, Bruinvis L, Ketting D & Wadman SK D-glyceric acidemia: an inborn error associated with fructose metabolism. Pediatr. Res. 21, 502–506 (1987). [DOI] [PubMed] [Google Scholar]
- 30.Cross NC et al. Molecular analysis of aldolase B genes in hereditary fructose intolerance. Lancet 335, 306–309 (1990). [DOI] [PubMed] [Google Scholar]
- 31.Lanaspa MA et al. Ketohexokinase C blockade ameliorates fructose-induced metabolic dysfunction in fructose-sensitive mice. J. Clin. Invest. 128, 2226–2238 (2018). [DOI] [PMC free article] [PubMed] [Google Scholar]
- 32.Kim M et al. Intestinal, but not hepatic, ChREBP is required for fructose tolerance. JCI Insight 2, e96703 (2017). [DOI] [PMC free article] [PubMed] [Google Scholar]
- 33.Kim M-S et al. ChREBP regulates fructose-induced glucose production independently of insulin signaling. J. Clin. Invest. 126, 4372–4386 (2016). [DOI] [PMC free article] [PubMed] [Google Scholar]
- 34.Sundborn G et al. Are liquid sugars different from solid sugar in their ability to cause metabolic syndrome? Obesity (Silver Spring) 27, 879–887 (2019). [DOI] [PubMed] [Google Scholar]
- 35.Wang J et al. Associations between added sugar (solid vs. liquid) intakes, diet quality, and adiposity indicators in Canadian children. Appl. Physiol. Nutr. Metab. 40, 835–841 (2015). [DOI] [PubMed] [Google Scholar]
- 36.Goncalves MD et al. High-fructose corn syrup enhances intestinal tumor growth in mice. Science 363, 1345–1349 (2019). [DOI] [PMC free article] [PubMed] [Google Scholar]
- 37.DiMeglio DP & Mattes RD Liquid versus solid carbohydrate: effects on food intake and body weight. Int. J. Obes. Relat. Metab. Disord. 24, 794–800 (2000). [DOI] [PubMed] [Google Scholar]
- 38.Togo J, Hu S, Li M, Niu C & Speakman JR Impact of dietary sucrose on adiposity and glucose homeostasis in C57BL/6J mice depends on mode of ingestion: liquid or solid. Mol. Metab. 27, 22–32 (2019). [DOI] [PMC free article] [PubMed] [Google Scholar]
- 39.Dreher ML Whole fruits and fruit fiber emerging health effects. Nutrients 10, 1833 (2018). [DOI] [PMC free article] [PubMed] [Google Scholar]
- 40.Hebden L et al. Fruit consumption and adiposity status in adults: a systematic review of current evidence. Crit. Rev. Food Sci. Nutr. 57, 2526–2540 (2017). [DOI] [PubMed] [Google Scholar]
- 41.Guyenet SJ Impact of whole, fresh fruit consumption on energy intake and adiposity: a systematic review. Front. Nutr. 6, 66 (2019). [DOI] [PMC free article] [PubMed] [Google Scholar]
- 42.Keast DR, O’Neil CE & Jones JM Dried fruit consumption is associated with improved diet quality and reduced obesity in US adults: National Health and Nutrition Examination Survey, 1999–2004. Nutr. Res. 31, 460–467 (2011). [DOI] [PubMed] [Google Scholar]
- 43.Sharma SP, Chung HJ, Kim HJ & Hong ST Paradoxical effects of fruit on obesity. Nutrients 8, 633 (2016). [DOI] [PMC free article] [PubMed] [Google Scholar]
- 44.Zheng M et al. Liquid versus solid energy intake in relation to body composition among Australian children. J. Hum. Nutr. Diet. 28, 70–79 (2015). [DOI] [PubMed] [Google Scholar]
- 45.Wang J et al. Consumption of added sugars from liquid but not solid sources predicts impaired glucose homeostasis and insulin resistance among youth at risk of obesity. J. Nutr. 144, 81–86 (2014). [DOI] [PubMed] [Google Scholar]
- 46.Malik VS & Hu FB Fructose and cardiometabolic health: what the evidence from sugar-sweetened beverages tells us. J. Am. Coll. Cardiol. 66, 1615–1624 (2015). [DOI] [PMC free article] [PubMed] [Google Scholar]
- 47.Zou Z-Y, Shen B & Fan J-G Systematic review with meta-analysis: epidemiology of nonalcoholic fatty liver disease in patients with inflammatory bowel disease. Inflamm. Bowel Dis. 25, 1764–1772 (2019). [DOI] [PubMed] [Google Scholar]
- 48.Chao C-Y et al. Co-existence of non-alcoholic fatty liver disease and inflammatory bowel disease: a review article. World J. Gastroenterol. 22, 7727–7734 (2016). [DOI] [PMC free article] [PubMed] [Google Scholar]
- 49.Sourianarayanane A et al. Risk factors of non-alcoholic fatty liver disease in patients with inflammatory bowel disease. J. Crohns Colitis 7, e279–e285 (2013). [DOI] [PubMed] [Google Scholar]
- 50.Miller CO et al. Ketohexokinase knockout mice, a model for essential fructosuria, exhibit altered fructose metabolism and are protected from diet-induced metabolic defects. Am. J. Physiol. Endocrinol. Metab. 315, E386–E393 (2018). [DOI] [PubMed] [Google Scholar]
- 51.Calle R, Bergman A, Somayaji V, Chidsey K & Kazierad D PS-110-Ketohexokinase inhibitor PF-06835919 administered for 6 weeks reduces whole liver fat as measured by magnetic resonance imaging-proton density fat fraction in subjects with non-alcoholic fatty liver disease. J. Hepatol. 70, E69–E70 (2019). [Google Scholar]
- 52.Huard K et al. Discovery of fragment-derived small molecules for in vivo inhibition of ketohexokinase (KHK). J. Med. Chem. 60, 7835–7849 (2017). [DOI] [PubMed] [Google Scholar]
- 53.Su X, Lu W & RabinowitzJ. D. Metabolite spectral accuracy on orbitraps. Anal. Chem. 89, 5940–5948 (2017). [DOI] [PMC free article] [PubMed] [Google Scholar]
- 54.Zhang Z, Chen L, Liu L, Su X & Rabinowitz JD Chemical basis for deuterium labeling of fat and NADPH. J. Am. Chem. Soc. 139, 14368–14371 (2017). [DOI] [PMC free article] [PubMed] [Google Scholar]
Associated Data
This section collects any data citations, data availability statements, or supplementary materials included in this article.


