Significance
Foxp3+CD4+ regulatory T cells (Tregs) control both immune responses and tissue homeostasis. Dedicated Treg compartments occur in several nonlymphoid tissues—When, where, and how do they acquire specialized characteristics? A splenic Treg population expressing low levels of the transcription factor PPARγ contains precursors of Tregs in visceral adipose tissue. Since PPARγ, the “master regulator” of adipocyte differentiation, is required for the accumulation and function of Tregs in this tissue but not others, its expression in splenic precursors of adipose-tissue Tregs is not surprising. We show that the splenic PPARγlo Treg population is transcriptionally heterogeneous and engenders Tregs in multiple additional nonlymphoid tissues. A general pool of splenic precursors of nonlymphoid-tissue Tregs opens possibilities for manipulating them experimentally or therapeutically.
Keywords: immunoregulation, single-cell RNA-seq, tissue Treg cell, precursor
Abstract
Foxp3+CD4+ regulatory T cells (Tregs) regulate most types of immune response as well as several processes important for tissue homeostasis, for example, metabolism and repair. Dedicated Treg compartments—with distinct transcriptomes, T cell receptor repertoires, and growth/survival factor dependencies—have been identified in several nonlymphoid tissues. These Tregs are specifically adapted to function and operate in their home tissue—When, where, and how do they take on their specialized characteristics? We recently reported that a splenic Treg population expressing low levels of the transcription factor PPARγ (peroxisome proliferator-activated receptor gamma) contains precursors of Tregs residing in visceral adipose tissue. This finding made sense given that PPARγ, the “master regulator” of adipocyte differentiation, is required for the accumulation and function of Tregs in visceral adipose tissue but not in lymphoid tissues. Here we use single-cell RNA sequencing, single-cell Tcra and Tcrb sequencing, and adoptive-transfer experiments to show that, unexpectedly, the splenic PPARγlo Treg population is transcriptionally heterogeneous and engenders Tregs in multiple nonlymphoid tissues beyond visceral adipose tissue, such as skin and liver. The existence of a general pool of splenic precursors for nonlymphoid-tissue Tregs opens possibilities for regulating their emergence experimentally or therapeutically.
Most types of immune response are kept in check by Foxp3+CD4+ regulatory T cells (Tregs) (1). Until relatively recently, our view of Treg differentiation, dynamics, and activities was heavily colored by the behavior of Foxp3+CD4+ T cells circulating through lymphoid organs; however, it is now clear that distinct Treg compartments are also present in a number of nonlymphoid tissues, where they control not only local immune responses but also tissue homeostasis (2). Tregs in any particular nonlymphoid tissue are distinguishable from lymphoid-organ Tregs and from Tregs in other nonlymphoid tissues by their distinct transcriptome, T cell receptor (TCR) repertoire, and set of growth/survival factor dependencies, optimized for thriving and operating in the home tissue’s unique microenvironment.
Tracing the provenance of nonlymphoid-tissue Tregs (for convenience, hereafter referred to as “tissue-Tregs”) has proven difficult because of their typical rarity and fragility upon isolation. Do these cells emerge from the thymus preformed or precommitted, or do they take on their specialized mantles only after residence within their home tissue, in response to local cues? Recently, we uncovered a stepwise, multisite scenario for acquisition of the definitive visceral adipose tissue (VAT)-Treg phenotype (3). VAT Tregs emerge from the thymus lacking their characteristic features; undergo a “priming” step in the spleen that permits them to exit the lymphoid organs and surveil nonlymphoid tissues; and undergo final specialization only after installation within VAT. Furthermore, we identified a splenic VAT-Treg precursor population that expresses CD4, Foxp3, low levels of PPARγ [peroxisome proliferator-activated receptor gamma; a transcription factor (TF) known to be critical for the generation and function of VAT Tregs (4)], and elevated levels of the activation component (i.e., ∼1/2) of the diagnostic VAT-Treg signature.
An obvious question was as follows: Does this splenic precursor population engender only VAT Tregs, or does it give rise to tissue-Tregs more generally? We have addressed this question using single-cell (sc) RNA sequencing (seq), scTcr-seq, and adoptive-transfer approaches. We found the splenic PPARγloFoxp3+CD4+ T cell population to be heterogeneous and to give rise to multiple tissue-Treg compartments beyond that in VAT.
Results
Heterogeneity and Precursor Potential of the Splenic PPARγlo Treg Population.
The PPARγloFoxp3+CD4+ Treg population in the spleen includes precursors of VAT Tregs (3). But is this a heterogeneous population? And does it have the potential to engender tissue-Tregs at locations other than VAT? To address these questions, we performed scRNA-seq on double-sorted splenic PPARγ− and PPARγlo Tregs from 6- to 8-wk-old Pparg-Tdt.Foxp3-Gfp mice. Single cells from each sorted population were captured using the droplet-based Chromium Single Cell Gene Expression System from 10x Genomics. After quality control, we obtained 2,626 PPARγ− and 1,608 PPARγlo individual Tregs.
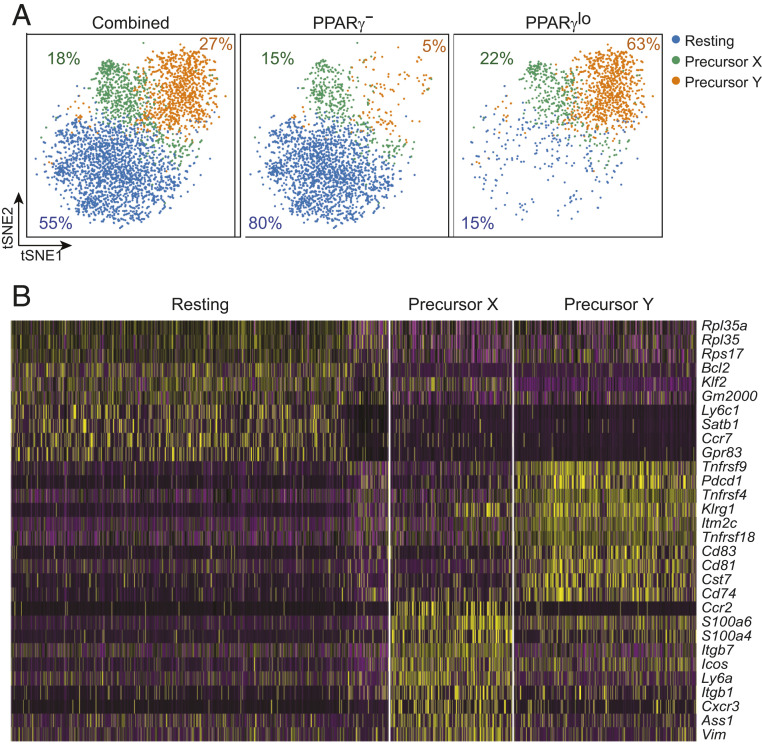
Dimensionality reduction via t-distributed stochastic neighbor embedding (tSNE) revealed the combined PPARγ− and PPARγlo Treg populations fall into three main cell clusters (Fig. 1 A, Left): a major group of resting Tregs, which made elevated levels of Bcl2, Klf2, Satb1, and Ccr7 transcripts; and two smaller groups (termed precursor Y and precursor X) that preferentially made divergent sets of tissue-Treg–associated transcripts (Fig. 1B). Precursor Y cells synthesized higher levels of activation- and differentiation-related transcripts, including Klrg1, Pdcd1, and messenger RNAs encoding several tumor necrosis factor receptor superfamily members (Tnfrsf4, Tnfrsf9, Tnfrsf18), while precursor X cells expressed elevated levels of transcripts encoding the costimulatory molecule ICOS and molecules associated with cell adhesion and migration (Itgb1, Itgb7, Ccr2, Cxcr3). The PPARγ− and PPARγlo populations segregated largely independently, with the former mostly composed of resting Tregs (Fig. 1 A, Middle) and the latter mainly constituted of two putative tissue-Treg precursor subpopulations (Fig. 1 A, Right).
Fig. 1.
Heterogeneity of the splenic PPARγlo Treg population. scRNA-seq analysis of double-sorted PPARγ− and PPARγlo Tregs from the spleen of 6- to 8-wk-old Pparg-Tdt.Foxp3-Gfp mice. (A) tSNE plot of the combined (Left), PPARγ− Treg (Middle), and PPARγlo Treg (Right) single-cell datasets. Numbers indicate the frequency of each population. (B) Heatmap of the 10 most differentially expressed transcripts among the three clusters.
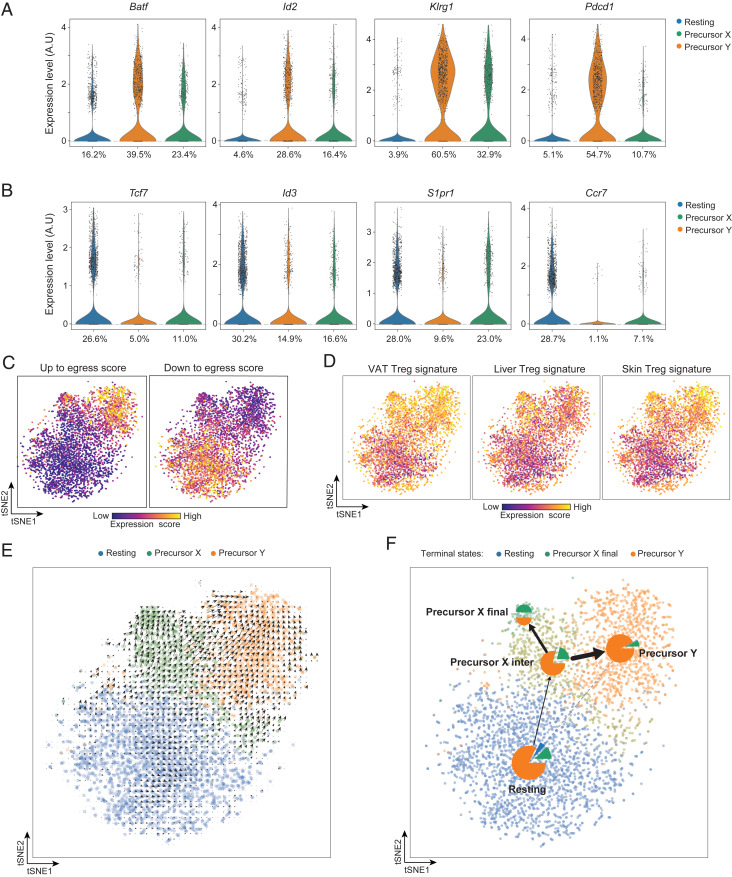
Next, we plotted levels of several key transcripts reported to be positively or negatively correlated with the acquisition of tissue-Treg characteristics and/or with the egress of Tregs from lymphoid tissues. The positively associated transcripts were expressed by the two PPARγlo subpopulations at levels higher than by the PPARγ− population (Fig. 2A and SI Appendix, Fig. S1A). In contrast, the negatively associated transcripts were made at lower levels by the two PPARγlo cell clusters (Fig. 2B and SI Appendix, Fig. S1B). In addition, we generated “up to egress” and “down to egress” scores based on the levels of the two transcript sets mentioned above and overlaid them on the tSNE space, which confirmed that the two putative precursor subpopulations were capable of egressing to nonlymphoid tissues (Fig. 2C). According to all of these plots, precursor Y seems to have a more evolved phenotype than precursor X, suggesting that it might be more mature.
Fig. 2.
Transcriptionally assessed precursor potential of the splenic PPARγlo Treg subpopulations. (A) Violin plots of transcripts characteristically up-regulated as tissue-Treg precursors exit the spleen. Numbers refer to the percentage of cells in the designated cluster that express a given transcript. A.U., arbitrary units. (B) Violin plots of transcripts encoding proteins that need to be down-regulated for tissue-Treg precursors to exit the spleen. Numbers refer to the percentage of cells in the designated cluster expressing a given transcript. (C) Heatmaps depicting up to egress (Left) and down to egress (Right) scores, determined per SI Appendix, Materials and Methods. Intensity scales (Bottom). (D) Heatmap depicting expression of VAT (Left), liver (Middle), and skin (Right) Treg-specific transcripts, as per Dataset S1. Intensity scales (Bottom). (E) RNA-velocity analysis of the splenic PPARγlo and PPARγ− scRNA-seq datasets. (F) Trajectory inference analysis of the splenic PPARγlo and PPARγ− scRNA-seq datasets represented as a partition-based graph abstraction plot. Pie charts indicate the terminal cell fates averaged in each cluster. The edges show the direction of the inferred trajectory, and the thickness represents the transcriptional similarity between clusters.
We then derived VAT-, liver-, and skin-Treg signatures by identifying transcripts uniquely up-regulated in each tissue-Treg compartment vis à vis its control lymph-node population, using previously published datasets (Dataset S1) (5). Overlaying these signatures onto the tSNE plot revealed that, compared with resting Tregs, the two putative tissue-Treg precursors expressed significantly higher levels of VAT-, liver-, or skin-specific transcripts (Fig. 2D and SI Appendix, Table S1). Of note, the two precursor subpopulations also showed increased expression of a pan-tissue Treg signature (transcripts up-regulated in all three tissue-Treg vs. lymph-node Treg populations) (SI Appendix, Fig. S2 and Dataset S1).
Lastly, for insight into the relationship between the three splenic Treg clusters, we performed RNA-velocity analysis on the scRNA-seq data. RNA velocity tracks the ratio of spliced to unspliced transcripts genome-wide in order to predict which transcripts are being actively up- or down-regulated. This analysis helps identify the likely future state of a given cell and can suggest precursor relationships (6, 7). RNA velocity predicted that both PPARγlo putative precursor types emanated from the PPARγ− resting Treg population (Fig. 2E). We then used a novel computational fate prediction tool that combines trajectory inference with RNA velocity to predict the fate of individual cells (8). This unsupervised analysis predicted a trajectory that begins in the PPARγ− resting Treg population, followed by an intermediate population within the precursor X cells that splits into the two terminal precursor X and precursor Y PPARγlo Treg populations (Fig. 2F). This analysis further supported the notion that both precursor types exist as stable terminal states that originate from the resting PPARγ− Treg population and suggested at least some conversion from precursor X to precursor Y cells.
PPARγ Is Not Required for the Generation or Maintenance of Splenic PPARγlo Tregs.
PPARγ, a well-characterized TF of the nuclear receptor family, is involved in adipogenesis, lipid and glucose metabolism, and insulin sensitivity (9). It is thought to be the “master regulator” of adipocyte differentiation. In addition, low levels of PPARγ are detectable and functional in immunocytes such as macrophages, neutrophils, and T cells. Our previous studies showed that PPARγ is important for VAT-Treg accumulation and function through cooperation with Foxp3 to drive expression of the bulk of VAT-Treg signature genes (4). Careful analysis of PPARγ-Tdt reporter mice allowed us to identify a splenic PPARγlo population as the precursor of VAT Tregs (3). Accumulation of these cells was shown to depend on signaling through the TCR and the IL33 receptor.
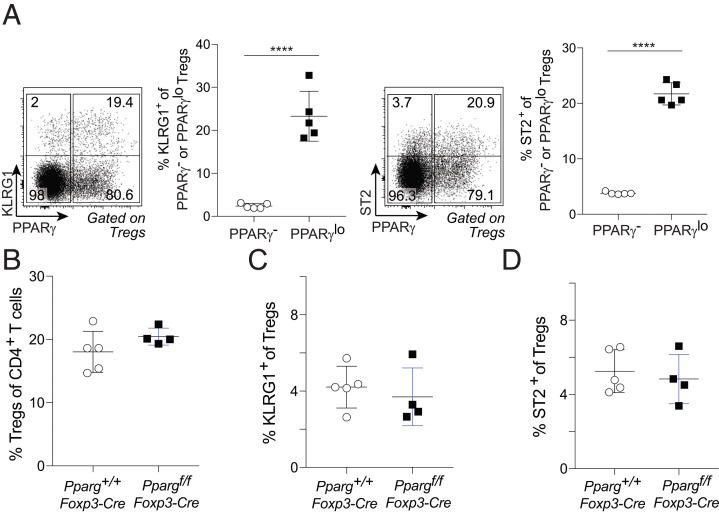
As PPARγ is a major driver of the accumulation and function of VAT Tregs (4), it was not surprising that this TF marked a population of VAT-Treg precursors in the spleen; however, its expression by a splenic precursor population capable of engendering tissue-Tregs more broadly has no obvious rationale. Therefore, we asked whether PPARγ was required for accumulation of the splenic PPARγlo Treg population. In 6- to 8-wk-old Pparg-Tdt.Foxp3-Gfp mice, a much larger fraction of PPARγlo than PPARγ− splenic Tregs expressed cell-surface KLRG1 or ST2 (Fig. 3A); hence, we took these two molecules as surrogate markers for tissue-Treg precursors. In mice lacking PPARγ specifically in Tregs (4), the frequencies of total splenic Tregs as well as the fractions of KLRG1+ or ST2+ cells among splenic Tregs were comparable with those of wild-type littermates (Fig. 3 B–D). Thus, PPARγ appears to be a marker, not a driver, of the putative tissue-Treg precursor population in the spleen.
Fig. 3.
No PPARγ requirement for accumulation of the putative tissue-Treg precursor population. (A) Frequencies of KLRG1+ and ST2+ cells among PPARγ− and PPARγlo splenic Tregs of 6- to 8-wk-old Pparg-Tdt.Foxp3-Gfp mice. (A, Left) Representative dot plots. (A, Right) Summary plots. Mean ± SD; unpaired two-tailed t test; ****P < 0.0001. (B–D) Frequencies of Tregs among CD4+ T cells (B), KLRG1+ cells among Tregs (C), and ST2+ cells among Tregs (D) from spleens of 6- to 8-wk-old Pparg+/+.Foxp3-Cre or Ppargf/f.Foxp3-Cre mice.
scTcr-Seq Data Argue that the Splenic PPARγlo Treg Population Can Seed Multiple Nonlymphoid Tissues in Addition to VAT.
Different tissue-Treg compartments have different TCR repertoires, each population containing a distinct set of expanded clones with identical TCRs (10–15). Such clones might prove useful for exploring the seeding potential of putative splenic precursors of tissue-Tregs. Specifically, we asked whether the two splenic PPARγlo Treg subpopulations showed evidence of clonal expansion and, if so, with what tissue-Treg compartments they share TCR sequences. Thus, we sorted splenic PPARγ− and PPARγlo Tregs as well as tissue-Tregs from VAT, liver, and skin from a 20-wk-old Pparg-Tdt.Foxp3-Gfp mouse and performed scRNA-seq paired with scTcr-seq of both the Tcra and Tcrb transcripts. [Note: The optimum time to assay splenic precursors of tissue-Tregs is 6 to 8 wk of age, which was when almost all of our experiments were performed. However, this TCR-tracing experiment could not be done at this age because the VAT-Treg compartment begins to expand and the bulk of cells take on their definitive specification (and sufficient cells can be obtained) beginning only at 15 wk (10).]
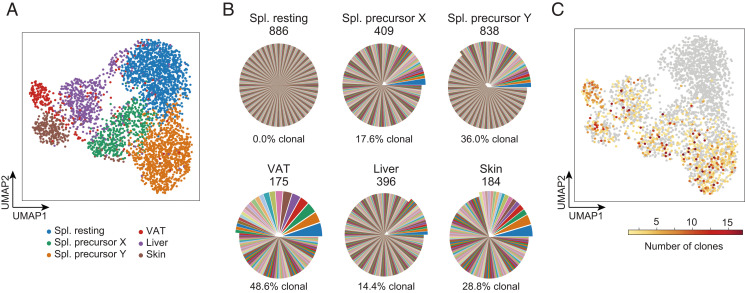
After quality control (Materials and Methods), we recovered 3,655 individual cells for analysis. Dimensionality reduction via uniform manifold approximation and projection (UMAP) revealed the splenic, VAT, liver, and skin Tregs to segregate into distinct clusters; splenic Tregs further separated into the resting (PPARγ−) and two putative precursor (PPARγlo) clusters discussed above (Fig. 4A). The PPARγ− population had a highly polyclonal TCR repertoire, with every cell exhibiting a different sequence (Fig. 4B). On the other hand, the two PPARγlo subpopulations had much more restricted TCR repertoires, with 36.0 and 17.6% of cells showing clonality (≥2 cells sharing Tcra and Tcrb sequences) in precursors Y and X, respectively. These fractions of clonal cells were comparable with those of the tissue-Treg populations. To further visualize these expanded clones, we colored the UMAP space from Fig. 4A according to the number of shared Tcra/b sequences for each cell (Fig. 4C). Highly clonal cells were all located within the two splenic putative precursor clusters and the three tissue-Treg clusters, while the resting cluster contained no expanded clones.
Fig. 4.
scTcr-seq analysis of splenic Treg splits and tissue-Treg populations. (A) UMAP of scRNA-seq data from the PPARγ− and PPARγlo splenic Treg populations and from the indicated tissue-Treg populations from a 20-wk-old Pparg-Tdt.Foxp3-Gfp male. (B) Pie charts were generated from corresponding scTcr-seq data. For each cell cluster, clones of cells sharing the exact same nucleotide sequence in the CDR3-encoding regions of the Tcra and Tcrb genes are shown as differently colored pie slices, the width of the slice reflecting the number of cells in that clone. Shared colors across cell clusters do not indicate shared clones in this representation. Values above show the total number of cells within that cluster with identified TCR-α and -β chains. Percentages and offset portions of the pies show the frequencies of clonally expanded cells, that is, cells that had a TCR sequence shared by two or more cells. (C) Linking scRNA-seq and scTcr-seq. UMAP space as in A. Cells are colored according to their clone size; color key (Bottom). Spl., spleen.
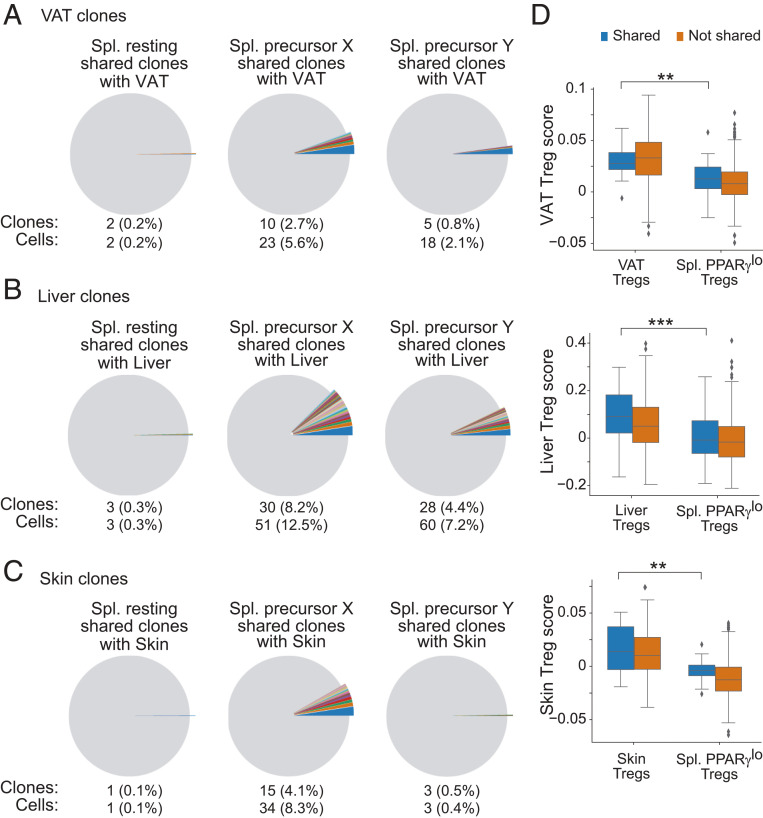
We then determined whether the splenic PPARγlo subpopulations could give rise to tissue-Treg compartments beyond those in VAT by identifying cells in the three splenic clusters that had the same Tcra and Tcrb sequences as cells in the VAT, liver, or skin clusters. Shared Tcr sequences would indicate that these cells were clonally related, sharing a common ancestor. Plotting the clonal overlap between splenic Tregs and tissue-Tregs revealed that the two splenic PPARγlo subpopulations were enriched for cells sharing Tcra/b sequences with VAT, liver, or skin Tregs, while the splenic PPARγ− population showed almost no clonal overlap with cells in any of the tissues (Fig. 5 A–C). Of note, precursor X cells exhibited higher clonal overlap with VAT and skin Tregs than did precursor Y cells, suggesting a possible tissue preference for the two progenitor subpopulations. In contrast, TCR sequences from precursors Y and X showed a similar overlap with liver Treg Tcr sequences.
Fig. 5.
Sharing of TCR sequences between tissue-Tregs and PPARγlo putative precursors in the spleen. (A–C) Pie charts depicting cell clones shared between the various tissue-Treg populations and the splenic clusters. Offset pie slices and text below the pies indicate the number and frequency of splenic Tregs in the resting (Left), precursor X (Middle), and precursor Y (Right) clusters that share CDR3-encoding Tcra and Tcrb sequences with the VAT (A), liver (B), and skin (C) Treg populations. Shared clones are shown in individual colors; nonshared clones are colored in gray. Colors shared across the splenic subpopulations do not connote shared sequences. (D) Tissue-Treg signature scores for splenic PPARγlo Tregs and VAT (Top), liver (Middle), and skin (Bottom) Tregs. Plotted for cells with sharing (blue) or nonsharing (orange) CDR3-encoding Tcra and Tcrb nucleotide sequences between splenic PPARγlo Tregs and the indicated tissue-Tregs. Box plots indicate the interquartile range (IQR), and the line indicates the median. Whiskers indicate the range, and outliers outside this range (>1.5*IQR) are plotted. Wilcoxon rank-sum test; **P ≤ 0.01, ***P ≤ 0.001.
Interestingly, clonal overlap between the two precursor populations was also observed, indicative of a common ancestor somewhere along the line (SI Appendix, Fig. S3). Precursor Y did not share a greater fraction of clones with precursor X than X did with Y, arguing against the notion that all (or most) precursor X cells give rise to precursor Y cells.
Another possible explanation for the clonal overlap of Tcra/b sequences in Tregs from the spleen and nonlymphoid tissues is the presence of Tregs circulating through tissues, which may or may not eventually take on the mantle of bona fide tissue-Tregs. To assess this possibility, we compared expression of the above-defined tissue-specific Treg signatures by tissue-Tregs that did or did not share a TCR with PPARγlo splenic Tregs. If clonal overlap between the spleen and each tissue was due to circulating Tregs, we would expect the shared clones to have a lower tissue-Treg score. However, our analysis showed that the VAT, liver, and skin Tregs that shared a TCR with PPARγlo splenic Tregs had scores as high as Tregs in the same tissue that did not share a TCR (Fig. 5D). Additionally, PPARγlo splenic Tregs that shared a TCR with one of the tissue-Treg populations had a much lower signature score than the corresponding tissue-Treg population had. Taken together, these data indicate that the two putative precursor populations were clonally related to bona fide tissue-Tregs and that they both could give rise to Tregs residing in multiple tissues.
Data from Adoptive-Transfer Experiments Also Argue that PPARγlo Splenic Tregs Are Multitissue-Treg Progenitors.
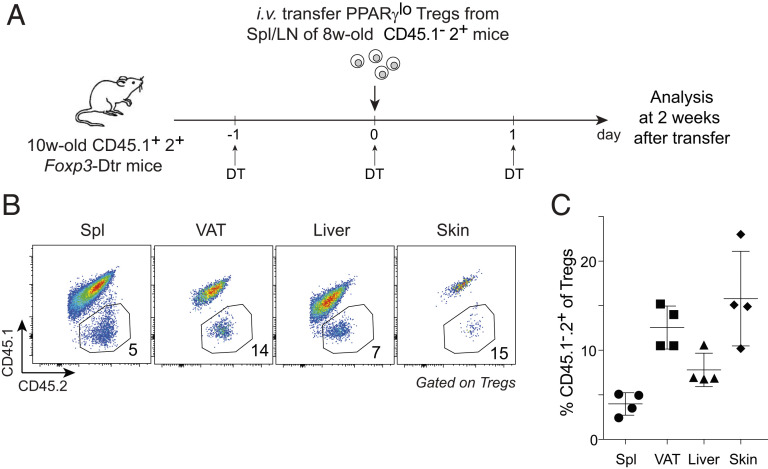
Lastly, we took an orthogonal approach to assess the precursor potential of PPARγlo Tregs, namely adoptive transfer. We transferred sorted splenic PPARγlo Tregs from 6- to 8-wk-old CD45.1−2+ Pparg-Tdt.Foxp3-Gfp donors into 10-wk-old CD45.1+2+ Foxp3-Dtr recipients (schematized in Fig. 6A). [Note: It was not informative to transfer splenic PPARγ− Tregs because they engender splenic PPARγlo Tregs with currently unknown kinetics (3) and because they are routinely contaminated with PPARγlo cells even after double sorting (e.g., Fig. 1A), both of which would complicate interpretation of the results.] Diphtheria toxin (DT) was injected on 3 consecutive days—before, on, and after the day splenic PPARγlo Tregs were transferred (to temporarily create space for engraftment). Two weeks after transfer, endogenous CD45.1+2+ Tregs had largely been replenished in the spleen as well as VAT, liver, and skin. In addition, we could detect a clear population of donor-derived CD45.1−2+ Tregs in each of the three nonlymphoid tissues (Fig. 6 B and C). An independent experiment of similar design yielded the same conclusion (SI Appendix, Fig. S4). While it is theoretically possible that some or all of the Tregs isolated from the nonlymphoid tissues might reflect the general circulation, we note, on the one hand, that the epigenetic landscape of the splenic PPARγlo cell pool is like that of the splenic PPARγ− population and unlike that of tissue-Tregs (3) and, on the other hand, that the VAT and skin Tregs of healthy adults rarely migrate (11, 16).
Fig. 6.
Adoptive-transfer studies. PPARγlo Tregs from spleen and lymph nodes of 6- to 8-wk-old CD45.1−2+ Pparg-Tdt.Foxp3-Gfp mice were sorted and transferred into 10-wk-old CD45.1+2+ Foxp3-Dtr recipients treated with DT before, on, and after the day of transfer. i.v., intravenously; LN, lymph nodes; w, week. (A) Experimental schema. (B) Representative dot plot showing frequencies of donor-derived cells among Tregs in the indicated organs. Values refer to the fraction of Tregs in the adjacent gate. (C) Summary plot. Mean ± SD. Representative of two independent experiments.
Discussion
There is growing appreciation for the versatility and importance of tissue-Tregs. A fundamental question is how they acquire their distinct phenotypes and functions. We recently identified a PPARγlo Treg population in the spleen that contains precursors of VAT Tregs (3). Using scRNA-seq, scTcr-seq, and adoptive-transfer approaches, we have now shown that this precursor pool consists of two transcriptionally divergent subpopulations, has clonally expanded elements, and engenders not just VAT Tregs but also the Treg compartments of other nonlymphoid tissues, such as liver and skin. These results point to a general stepwise, multisite scenario for the derivation of tissue-Tregs.
Recent reports are in accord with such a model. One showed that down-regulation of the transcriptional regulator Id3 and reciprocal up-regulation of Id2 by the splenic CD44hiCD62Llo Treg effector population are associated with the maturation of a tissue-Treg phenotype (17). In addition, scRNA-seq analyses revealed Treg populations in secondary lymphoid organs with tissue-Treg characteristics, including up-regulation of transcripts encoding activation- and differentiation-related molecules (e.g., Pdcd1, Klrg1, Rora) and homing receptors for the skin and colon (e.g., Itgb1, Cxcr3, Ccr9, Itga4) (18). Lastly, employing scRNA-seq, an assay for transposase-accessible chromatin using sequencing, and a mouse reporter line for the TF Nfil3, a recent study identified two types of tissue-Treg precursors in the secondary lymphoid organs, suggested to represent sequential stages of maturation (15). Compared with these reports, our observations contribute several perspectives.
First, we determined that the splenic PPARγlo Treg population was composed of two subpopulations that gave rise to the Treg compartments not just in VAT but also in other nonlymphoid tissues, such as skin and the liver. However, our results seemed not to support a simple linear relationship between the two splenic precursors. There was a general up-regulation of the pan and specific tissue-Treg gene signatures in both precursor X and Y cells, but the two subpopulations preferentially made divergent sets of certain other tissue-Treg–associated transcripts. Precursor Y cells expressed higher levels of genes related to cell activation and differentiation, while precursor X cells made more transcripts encoding adhesion- and migration-related molecules. In addition, RNA-velocity analysis indicated that both precursor subtypes derived from the resting PPARγ− population, with some precursor X cells converting into precursor Y cells. Nonetheless, RNA-velocity and trajectory inference analyses also identified both precursor states as containing stable terminal states. Moreover, precursor X cells showed a much higher overlap of TCR clones with Tregs from VAT and skin than precursor Y cells did, while the two precursor populations showed similar overlaps with Tregs from the liver. Analysis of egress-related transcripts did suggest that precursor X cells might be less mature than precursor Y cells; but, if X did give rise to Y, it is likely that the precursor X subpopulation would share substantially fewer clones, fractionally, with the precursor Y subpopulation than vice versa, which was not the case. Therefore, although additional lineage-tracing experiments are needed to dissect the exact relationship between the two splenic tissue-Treg precursor subpopulations, as well as their relationships with Tregs residing in various tissues, our results suggest that the two precursor types are derived separately and may preferentially engender Tregs in different nonlymphoid tissues. Unfortunately, inadequate cell purities and numbers have so far precluded adoptive-transfer experiments aimed at definitively establishing the relationship between the two splenic precursor subtypes.
Second, we established that sharing of TCRs by the splenic PPARγlo Treg population and various tissue-Treg compartments did not simply reflect lymphoid-organ Tregs circulating through tissues, an issue that previous studies have not adequately addressed, if at all. We found that nonlymphoid-tissue Tregs that shared versus did not share TCRs with splenic PPARγlo Tregs expressed the corresponding tissue-Treg signature to a similar degree and, in both cases, at levels much higher than those of splenic Tregs, indicating that they were bona fide tissue-Tregs rather than cells just passing through. In addition, we previously showed that the epigenetic landscape of splenic PPARγlo Tregs was very similar to that of splenic PPARγ− Tregs but quite distinct from that of VAT Tregs, arguing that the splenic PPARγlo cells were not simply recirculating tissue-Tregs. Collectively, these results strongly support the notion that the splenic PPARγlo Treg population contains precursors of multiple tissue-Treg compartments.
While this and our previous (3) study clearly identified a population of tissue-Treg precursors in the secondary lymphoid organs, we cannot completely exclude the possibility that some tissue-Tregs might derive from cells that migrate directly from the thymus. However, since loss of thymic output after 3 wk of age has no impact on the VAT Treg compartment (11), we suspect that direct contribution from the thymus is minor at best, at least in adult mice. The presence of a dedicated pool of tissue-Treg precursors in the secondary lymphoid organs could be advantageous for optimizing the relative participation of Tregs in general immune-surveillance versus specific tissue-homeostasis functions. Partial preprogramming of tissue-Treg characteristics might serve to better prepare the precursors for rapid adaptation within their eventual home tissue to assure effective survival and function. The identification of a general stepwise, multisite scenario for the differentiation of tissue-Tregs could prove useful in designing novel approaches to target them for the treatment of various inflammatory and metabolic diseases.
Materials and Methods
Mice.
C57BL/6J mice were purchased from The Jackson Laboratory (stock 000664). The Foxp3-Gfp (19) and Foxp3-Cre (20) lines were obtained from V. Kuchroo, Brigham and Women's Hospital, Boston, MA, and A. Rudensky, Memorial Sloan Kettering Cancer Center, New York, NY, respectively. The Ppargf and Pparg-Tdt lines have been described (3, 21). All experiments were performed using male littermate controls, 6 to 8 wk of age except for the TCR-tracing experiment (20 wk). All animal experiments were performed following protocols approved by the HMS Institutional Animal Care and Use Committee.
Cell Isolation and Flow Cytometry.
Epididymal VAT, liver, and trunk skin were excised, minced, and digested in a 37 °C water bath with shaking. Cells were stained and acquired with an LSRII flow cytometer (BD Biosciences). Further details concerning cell manipulation and analysis are in SI Appendix, Materials and Methods.
Treg Transfers.
PPARγlo Tregs (50,000) sorted from spleen and lymph nodes of 6- to 8-wk-old CD45.1−2+ Pparg-Tdt.Foxp3-Gfp donors were intravenously transferred into 10-wk-old CD45.1+2+ Foxp3-Dtr recipients. DT (Sigma) was injected intraperitoneally before, on, and after the day Tregs were transferred. Two weeks after transfer, donor-derived cells were analyzed by flow cytometry.
Single-Cell Studies.
For standard genome-wide scRNA-seq analyses, Tregs from spleens of two or three 8-wk-old Pparg-Tdt.Foxp3-Gfp mice were pooled, sorted, and encapsulated using the Chromium Single Cell 3′ v2 platform. For coupled scRNA-seq and scTcr-seq, Tregs from VAT, liver, skin, and spleen of a 20-wk-old Pparg-Tdt.Foxp3-Gfp mouse were sorted and encapsulated using the Chromium Single Cell 5′ v2 and V(D)J platform (10x Genomics).
scRNA-Seq Analysis.
Data were processed using the standard cellranger pipeline (10x Genomics). Downstream analysis was performed using the Seurat and SCANPY packages with a standard pipeline previously described (22, 23). Clonotype analysis was performed using custom scripts in Python.
RNA velocity was calculated using the velocity and scvelo packages as previously described (6, 7).
Further details related to data analysis, including quality-control information, can be found in SI Appendix, Materials and Methods.
Supplementary Material
Acknowledgments
We thank A. Ortiz-Lopez, K. Hattori, C. Araneo, D. Ischiu Gutierrez, K. Seddu, F. Chen, A. Baysoy, B. Vijaykumar, B. Hanna, G. Spallanzani, and L. Yang for experimental help, and Drs. V. Kuchroo and A. Rudensky for mouse lines. Cell sorting was done at the Harvard Stem Cell Institute/Diabetes Research Center Flow Core (NIH P30DK036836 and S10OR021740) and at the Harvard Medical School Immunology Flow Cytometry Facility. This work was supported by grants from the NIH (2R01 DK092541), JPB Foundation, and Evergrande Center for Immunologic Diseases. C.L. was a Cancer Research Institute Irvington Fellow and is currently supported by start-up funds from the Emory University School of Medicine.
Footnotes
The authors declare no competing interest.
This article contains supporting information online at https://www.pnas.org/lookup/suppl/doi:10.1073/pnas.2025197118/-/DCSupplemental.
Data Availability
Raw and processed scRNA-seq data reported in this article have been deposited in the National Center for Biotechnology Information Gene Expression Omnibus (GEO accession no. GSE168608). All other data and custom code are available in the article and its supporting information files, or from the corresponding author upon reasonable request.
All study data are included in the article and/or supporting information.
References
- 1.Josefowicz S. Z., et al., Extrathymically generated regulatory T cells control mucosal TH2 inflammation. Nature 482, 395–399 (2012). [DOI] [PMC free article] [PubMed] [Google Scholar]
- 2.Panduro M., Benoist C., Mathis D., Tissue Tregs. Annu. Rev. Immunol. 34, 609–633 (2016). [DOI] [PMC free article] [PubMed] [Google Scholar]
- 3.Li C., et al., TCR transgenic mice reveal stepwise, multi-site acquisition of the distinctive fat-Treg phenotype. Cell 174, 285–299.e12 (2018). [DOI] [PMC free article] [PubMed] [Google Scholar]
- 4.Cipolletta D., et al., PPAR-γ is a major driver of the accumulation and phenotype of adipose tissue Treg cells. Nature 486, 549–553 (2012). [DOI] [PMC free article] [PubMed] [Google Scholar]
- 5.Delacher M., et al., Genome-wide DNA-methylation landscape defines specialization of regulatory T cells in tissues. Nat. Immunol. 18, 1160–1172 (2017). [DOI] [PMC free article] [PubMed] [Google Scholar]
- 6.La Manno G., et al., RNA velocity of single cells. Nature 560, 494–498 (2018). [DOI] [PMC free article] [PubMed] [Google Scholar]
- 7.Bergen V., Lange M., Peidli S., Wolf F. A., Theis F. J., Generalizing RNA velocity to transient cell states through dynamical modeling. Nat. Biotechnol. 38, 1408–1414 (2020). [DOI] [PubMed] [Google Scholar]
- 8.Lange M., et al., CellRank for directed single-cell fate mapping. bioRxiv [Preprint] (2020). 10.1101/2020.10.19.345983 (Accessed 5 January 2021). [DOI]
- 9.Tontonoz P., Spiegelman B. M., Fat and beyond: The diverse biology of PPARgamma. Annu. Rev. Biochem. 77, 289–312 (2008). [DOI] [PubMed] [Google Scholar]
- 10.Feuerer M., et al., Lean, but not obese, fat is enriched for a unique population of regulatory T cells that affect metabolic parameters. Nat. Med. 15, 930–939 (2009). [DOI] [PMC free article] [PubMed] [Google Scholar]
- 11.Kolodin D., et al., Antigen- and cytokine-driven accumulation of regulatory T cells in visceral adipose tissue of lean mice. Cell Metab. 21, 543–557 (2015). [DOI] [PMC free article] [PubMed] [Google Scholar]
- 12.Burzyn D., et al., A special population of regulatory T cells potentiates muscle repair. Cell 155, 1282–1295 (2013). [DOI] [PMC free article] [PubMed] [Google Scholar]
- 13.Pratama A., Schnell A., Mathis D., Benoist C., Developmental and cellular age direct conversion of CD4+ T cells into RORγ+ or Helios+ colon Treg cells. J. Exp. Med. 217, e20190428 (2020). [DOI] [PMC free article] [PubMed] [Google Scholar]
- 14.Shime H., et al., Proenkephalin+ regulatory T cells expanded by ultraviolet B exposure maintain skin homeostasis with a healing function. Proc. Natl. Acad. Sci. U.S.A. 117, 20696–20705 (2020). [DOI] [PMC free article] [PubMed] [Google Scholar]
- 15.Delacher M., et al., Precursors for nonlymphoid-tissue Treg cells reside in secondary lymphoid organs and are programmed by the transcription factor BATF. Immunity 52, 295–312.e11 (2020). [DOI] [PMC free article] [PubMed] [Google Scholar]
- 16.Sanchez Rodriguez R., et al., Memory regulatory T cells reside in human skin. J. Clin. Invest. 124, 1027–1036 (2014). [DOI] [PMC free article] [PubMed] [Google Scholar]
- 17.Sullivan J. M., Höllbacher B., Campbell D. J., Dynamic expression of Id3 defines the stepwise differentiation of tissue-resident regulatory T cells. J. Immunol. 202, 31–36 (2019). [DOI] [PMC free article] [PubMed] [Google Scholar]
- 18.Miragaia R. J., et al., Single-cell transcriptomics of regulatory T cells reveals trajectories of tissue adaptation. Immunity 50, 493–504.e7 (2019). [DOI] [PMC free article] [PubMed] [Google Scholar]
- 19.Bettelli E., et al., Reciprocal developmental pathways for the generation of pathogenic effector TH17 and regulatory T cells. Nature 441, 235–238 (2006). [DOI] [PubMed] [Google Scholar]
- 20.Rubtsov Y. P., et al., Regulatory T cell-derived interleukin-10 limits inflammation at environmental interfaces. Immunity 28, 546–558 (2008). [DOI] [PubMed] [Google Scholar]
- 21.Akiyama T. E., et al., Conditional disruption of the peroxisome proliferator-activated receptor gamma gene in mice results in lowered expression of ABCA1, ABCG1, and apoE in macrophages and reduced cholesterol efflux. Mol. Cell. Biol. 22, 2607–2619 (2002). [DOI] [PMC free article] [PubMed] [Google Scholar]
- 22.Wolf F. A., Angerer P., Theis F. J., SCANPY: Large-scale single-cell gene expression data analysis. Genome Biol. 19, 15 (2018). [DOI] [PMC free article] [PubMed] [Google Scholar]
- 23.Luecken M. D., Theis F. J., Current best practices in single-cell RNA-seq analysis: A tutorial. Mol. Syst. Biol. 15, e8746 (2019). [DOI] [PMC free article] [PubMed] [Google Scholar]
Associated Data
This section collects any data citations, data availability statements, or supplementary materials included in this article.
Supplementary Materials
Data Availability Statement
Raw and processed scRNA-seq data reported in this article have been deposited in the National Center for Biotechnology Information Gene Expression Omnibus (GEO accession no. GSE168608). All other data and custom code are available in the article and its supporting information files, or from the corresponding author upon reasonable request.
All study data are included in the article and/or supporting information.


