Abstract
Metabotropic γ-aminobutyric acid receptors (GABAB) are involved in the modulation of synaptic responses in the central nervous system and are implicated in various neuropsychological conditions, ranging from addiction to psychosis1. GABAB belongs to G protein-coupled receptor class C, and its functional entity consists of an obligate heterodimer composed of GB1 and GB22. Each subunit possesses an extracellular Venus flytrap domain, connected to a canonical seven-transmembrane domain. Here, we present four cryo-EM structures of the human full-length GB1-GB2 heterodimer in its inactive apo, two intermediate agonist-bound, and active agonist/positive allosteric modulator bound forms. The structures reveal startling differences, shedding light onto the complex motions underlying the unique activation mechanism of GABAB. Our results show that agonist binding in the GB1 Venus flytrap domain triggers a series of transitions, first rearranging and bringing the two transmembrane domains into close contact along transmembrane helix 6 and ultimately inducing conformational rearrangements in the GB2 transmembrane domain via a lever-like mechanism, potentiated by a positive allosteric modulator binding at the dimerization interface, to initiate downstream signaling.
GABA (γ-amino butyric acid) is the principal inhibitory neurotransmitter in the central nervous system (CNS), counteracting the main excitatory neurotransmitter glutamate and exerting its function via two receptor types: the ionotropic GABAA receptor, mediating fast responses3, and the metabotropic G protein-coupled GABAB receptor, eliciting slow, prolonged activity, primarily through Gi/o proteins1,4. GABAB functions both pre-synaptically, inhibiting the release of neurotransmitters, and post-synaptically, leading to hyperpolarization of the neuron5,6. Given its central role in neurobiology, GABAB is linked to a variety of neurological diseases, pain regulation, and addiction7, representing a major pharmacological target8. Therapeutic drugs targeting GABAB, such as Lioresal® (baclofen) and Phenibut (β-phenyl-γ-aminobutyric acid), have been used to treat spasticity9, alcohol addiction10,11, anxiety, and insomnia12. Auto-antibodies targeting GABAB have been identified at the origin of epilepsies and encephalitis13 and mutations in GB2 have been associated with Rett syndrome and epileptic encephalopathies14–16.
GABAB belongs to the class C of G protein-coupled receptors (GPCRs) along with calcium sensing (CaS), metabotropic glutamate (mGlu), and taste 1 (TAS1) receptors17. As opposed to mGlu and CaS receptors, which function in homodimeric forms, the association of two distinct subunits, GB1 and GB2, is required for GABAB function, although the formation of higher order GABAB oligomers have been proposed as well2,18. The heterodimeric assembly is stabilized by the interaction of the two subunits through an intracellular coiled-coil domain (CC), which masks a di-leucine internalization (886EKSRLL891) and an endoplasmic reticulum retention (923RSRR926) signals of GB1, allowing trafficking of the heterodimer to the cell surface19,20. GABAB heterodimers utilize a unique allosteric mechanism for signal transduction, where binding of an agonist in the extracellular Venus flytrap (VFT) domain of GB1 leads to G protein activation through a rearrangement of the intracellular interface of the transmembrane domain (TMD) of GB221,22. The structural basis of this allosteric mechanism has previously been studied by X-ray crystallography of soluble VFT heterodimers, revealing molecular rearrangements within the VFTs upon ligand binding23. While such information is instrumental for our understanding of GABAB signal transduction24, it lacks key insights into the mechanism of TMD transitions associated with receptor activation.
Here we used single particle cryo-EM to obtain full-length GABAB structures in four distinct conformations (Fig. 1) along the receptor activation path from an inactive apo state to the active state, stabilized by both an agonist and a positive allosteric modulator (PAM). These structures reveal how the agonist-induced transformations at the level of the VFT heterodimer lead to conformational changes of the TMDs to trigger intracellular signaling.
Fig. 1. Cryo-EM maps and models of the GABAB heterodimer.
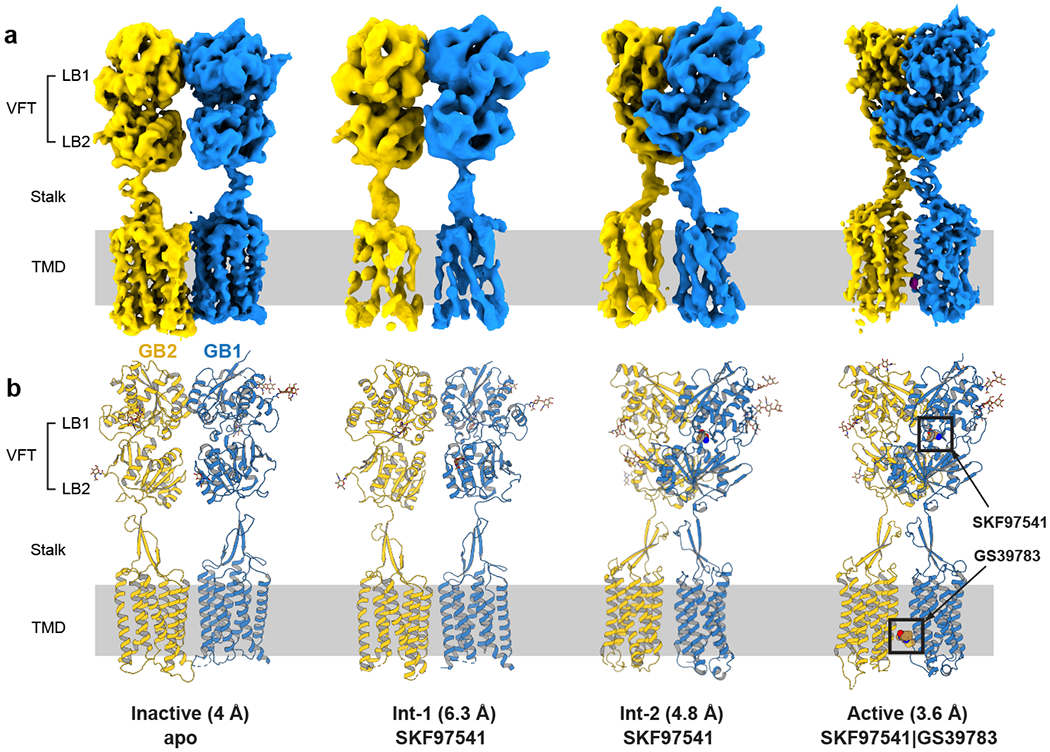
a, Maps and b, models are shown for four different conformations of GABAB, including active and inactive states and two intermediate conformations. The numbers in parentheses indicate the estimated resolution of the cryo-EM maps. GB1 and GB2 are colored in blue and yellow, respectively. The agonist/PAM-bound state is labeled as active with a caveat that the fully active state can only be observed in complex with a G protein or other transducer.
Cryo-EM structure determination
After establishing expression and purification protocols using the co-expression of both subunits in insect cells (Extended Data Fig. 1), we collected an initial dataset of the GB1-GB2 heterodimer in digitonin micelles in the presence of 3-aminopropyl(methyl)phosphinic acid (SKF97541), a GABAB agonist, 10-times more potent than baclofen. SKF97541 was shown to penetrate the CNS25 and demonstrated antidepressant activity in vivo26. We verified that both ligand binding and signaling response of the GABAB construct used for cryo-EM structure determination are identical to those of the WT receptor (Fig. 2e, 2f). Our cryo-EM data revealed two substantially different conformations of GABAB at a resolution of 6.3 and 4.8 Å, respectively (Fig. 1, Extended Data Figs. 2, 3, Extended Data Table 1). The first reconstruction showed poorly resolved TMDs, with the VFTs adopting an intermediate conformation between the previously described apo and agonist-bound crystal structures23. The second reconstruction showed an active-like form, with the two TMDs being in close proximity of each other, and the VFTs matching the agonist-bound crystal structure (PDB: 4MS3) within a root mean square deviation (r.m.s.d.) of 2.1 Å. We attributed the limited resolution of these structures to the fact that the agonist-bound receptor was in a dynamic equilibrium between the two states, which we dubbed intermediate states 1 and 2 (int-1 and int-2), and could not be locked in a fully active conformation without a G protein or another allosteric partner.
Fig. 2. Structural details of GABAB in the inactive apo state.
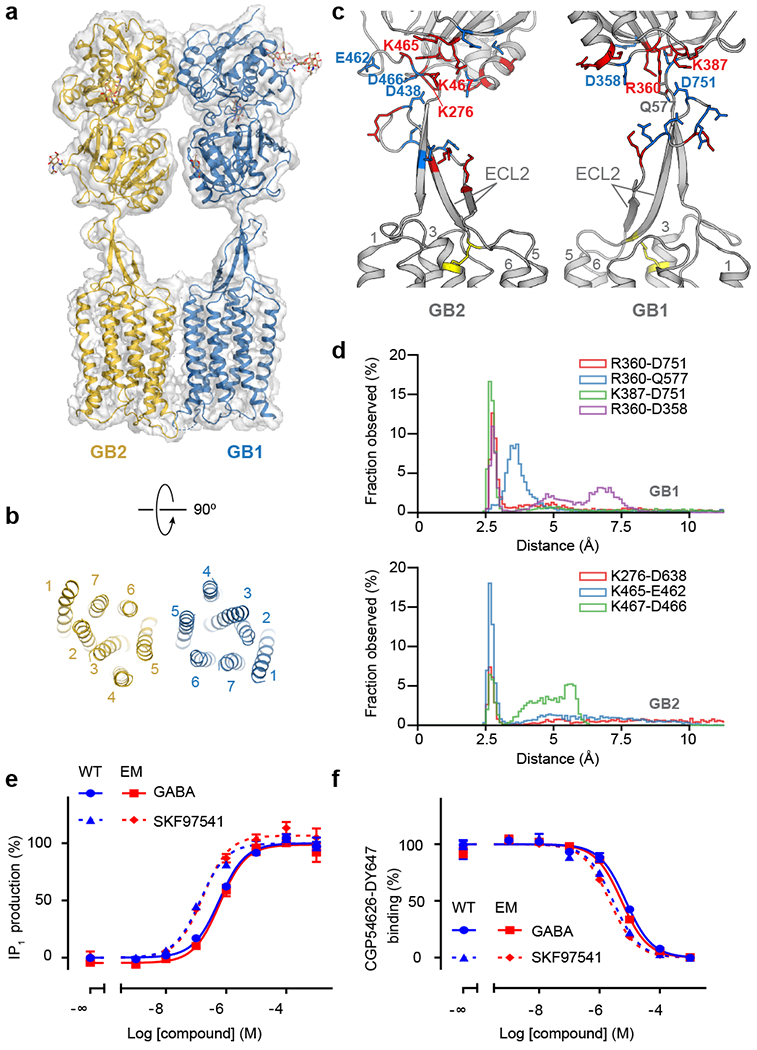
a, Overall view of the apo GABAB model and map. b, Extracellular view of the GABAB TMD in the inactive apo state. c, Structure of the stalk domains. The junctions between the stalks and the VFTs are stabilized by a network of electrostatic interactions between positively (red) and negatively (blue) charged residues. The disulfide bond between ECL2 and TM3 is shown as yellow sticks. d, Distribution of distances for ionic interactions between the stalk and VFT in GB1 and GB2 obtained from MD simulations of apo GABAB. e, IP1 production mediated by the WT receptor (blue) or the construct used for cryo-EM (red) upon stimulation with GABA (solid line) or SKF97541 (dotted line). f, Displacement of non-permeant antagonist CGP54626-DY647 by GABA (solid line) or SKF97541 (dotted line) from the WT receptor (blue) or the construct used for cryo-EM (red). Data shown in (e) and (f) are normalized by the WT response and presented as means ± SEM of 4 biologically independent experiments.
In an attempt to stabilize the receptor in its active state, we collected a second dataset of GABAB in the presence of both the agonist SKF97541 and the PAM GS39783, which has demonstrated anxiolytic activity without side-effects associated with baclofen27. Indeed, we observed a single receptor conformation achieving an overall resolution of 3.6 Å (Figs. 1, 3a, Extended Data Figs. 3, 4, Extended Data Table 1), allowing confident modelling of most amino-acid side chains.
Fig. 3. Structure of the active state GABAB and the details of agonist and PAM binding.
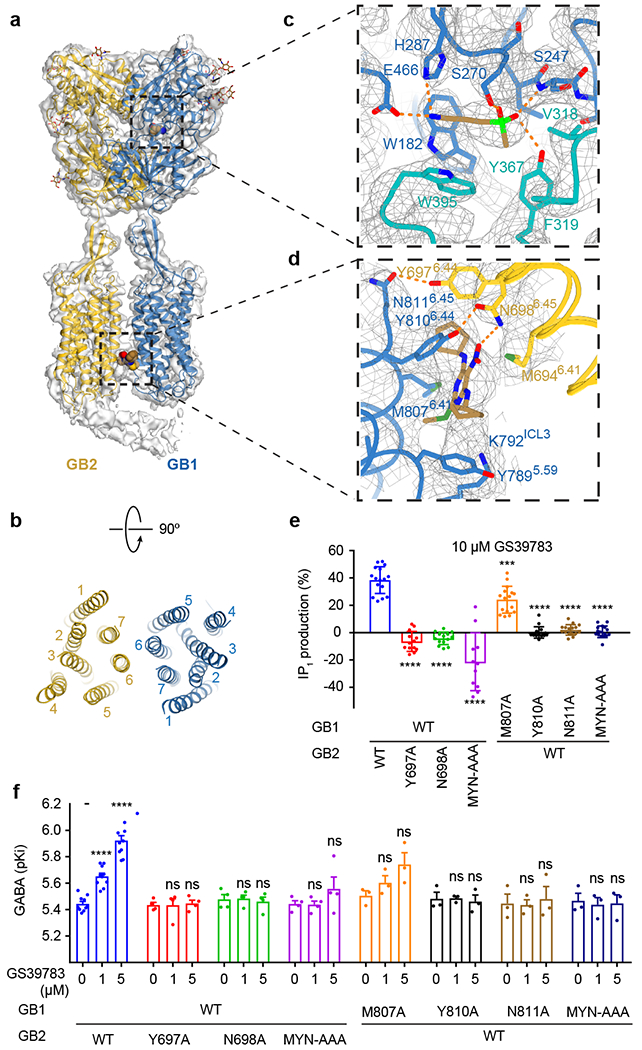
a, Overall view of GABAB model and map in the active agonist/PAM-bound conformation. Elongated density interacting with the intracellular part of GB2 resembles the coiled-coil domain. b, Extracellular view of GABAB TMD in the active conformation. c, Zoom-in on the agonist binding pocket in GB1-VFT. SKF97541 activates GABAB by interacting with LB1 (blue) and LB2 (teal) of GB1. d, Binding of the PAM (GS39783) further stabilizes GABAB active state by interacting with TMD residues from both GB1 and GB2. SKF97541 and GS39783 are shown as sticks with carbon atoms colored in sand, oxygen in red, nitrogen in blue, phosphorus in light green, and sulfur in dark green. e, IP1 production induced by 10 μM GS39783 in intact HEK293 cells expressing the indicated subunit combinations. Values are means ± SD from 7 biologically independent experiments. Data are normalized by GABA response and analyzed using one-way ANOVA with Dunnett’s multiple comparison test to determine significance (compared with WT), with ****P<0.0001 for all, except for GB2-M870A (***P=0.013). f, pKi values for GABA, determined from displacement of CGP54626-DY647 binding in intact cells expressing the indicated subunit combinations in the absence or presence of 1 or 5 μM GS39783 (the number of biologically independent experiments is given in Extended Data Table 2). Data were analyzed using one-way ANOVA with Dunnett’s multiple comparison test to determine significance (compared with no GS39783 for the same combined subunits), with ****P ≤ 0.0001 and ns P > 0.05. For 1 μM (5 μM) GS39783, P = 0.9994 (0.8166) for GB2-Y697A, 0.9672 (0.8849) for GB2-N698A, 0.9934 (0.4946) for GB2-MYN-AAA, 0.5504 (0.2972) for GB1-M807A, 0.9981 (0.5843) for GB1-Y810A, 0.9605 (0.7139) for GB1-N811A, and 0.8819 (0.9318) for GB1-MYN-AAA.
Finally, we collected a third dataset of the ligand-free (apo) form of the receptor at 4 Å resolution. This structure differs drastically from all ligand-bound states described above and represents the starting point of the activation pathway (Figs. 1, 2a, Extended Data Figs. 3, 5, Extended Data Table 1).
Overall structure of GABAB heterodimer
The overall GABAB structure reveals a heterodimeric arrangement of two subunits (Figs. 1, 2a), where each subunit contains an extracellular VFT attached to the canonical TMD via a stalk domain. Both VFTs consist of two lobes (LB1, LB2) connected by a hinge that allows sampling of a range of conformations from fully open to fully closed. The heterodimeric association of the VFTs is mediated by the LB1 lobes interacting with each other in a side-by-side orientation, facing opposite directions. The structure of the stalk is distinct from the cysteine-rich domain (CRD) connecting the VFT and TMD domains in other class C receptors28. The stalk consists of a twisted three-stranded β-sheet, bundling the linker between the VFT and TMD domains with a long extracellular loop 2 (ECL2) of the TMD (Fig. 2c). This secondary structure element ensures a strong pairing between the two main domains, directly connecting the VFT with transmembrane helices TM1, TM4, and TM5, as well as with TM3 through a conserved disulfide bond (CECL2-C3.29, superscript refers to the generic residue numbering in class C GPCR29). The junction sites between the stalks and the VFTs in both subunits are strengthened by ionic interactions between positively and negatively charged residues, which sustained throughout our molecular dynamics (MD) simulations, despite fluctuations of the VFTs (Fig. 2c, d). Bending and twisting modes of the VFTs were observed in the inactive and active states, respectively, with stronger ionic contacts and smaller amplitudes of motion in the active state (Extended Data Fig. 6a, b, d, e).
Agonist binding closes GB1-VFT and reorients TMDs
Our apo structure at 4 Å resolution allowed us to model the majority of side-chains and detailed arrangements within its main structural domains (Fig. 2a). We observed that in the apo state the two GABAB subunits interact through their LB1 lobes and the intracellular tips of TM5 and TM3 (Extended Data Figs. 5a, 6c). In agreement with the crystal structure of the soluble heterodimeric apo VFT (PDB: 4MQE, r.m.s.d. = 1.3 Å, Extended Fig. 7a), both VFTs are in a fully open conformation with a maximal separation of 47.6 Å between the C-terminal ends of the LB2 lobes.
Agonist binding results in two intermediate states that exist in a dynamic equilibrium (Fig. 1, Supplementary Video 1). In the int-1 state, the GB1-VFT is partially closed at ~20% of the total amplitude as compared to the fully closed and fully open crystal structures. This closure is accompanied by a rotation of both VFTs with respect to the TMDs (Fig. 4a). At the same time, the two LB2 lobes remain separated and the TMDs face each other via TM5. In addition, the aforementioned interaction between the TMDs is likely released in the int-1 structure, resulting in a more dynamic conformation, underlined by the substantially lower resolution of this state.
Fig. 4. Activation-related transitions in GABAB.
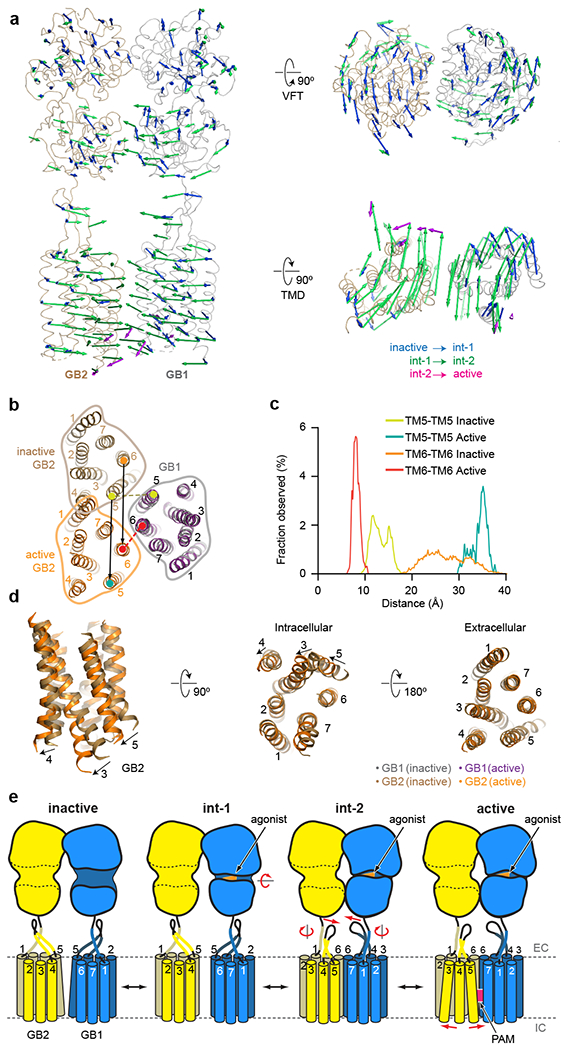
a, Overall view of apo GABAB indicating the conformational changes from inactive apo through two intermediate agonist-bound to active agonist/PAM-bound states. Activation, initiated by the agonist binding and a closure of the GB1-VFT (blue arrows), propagates to large-scale translations of the TMDs in the int-2 state (green arrows). PAM binding induces an additional conformational change within the GB2-TMD (magenta arrows). b, Extracellular view on the GABAB TMDs in the inactive and active states aligned by the GB1-TMD demonstrates an ~30 Å (black arrows) relative movement of the GB2-TMD domain. During this transition, the interface between TMDs changes from TM5 (inactive state) to TM6 (active state), with the TM6-TM6 distance (red dash) decreasing from 30.3 Å to 8.4 Å and the TM6-TM6 distance (olive dash) increasing from 13.1 Å to 37 Å in agreement with previously published cross-linking data30. c, Distribution of the TM5-TM5 and TM6-TM6 distances in the inactive apo and active agonist/PAM-bound states as observed in MD simulations. d, Shifts of TM3 and TM5 by ~6 Å on the intracellular side of GB2 upon agonist/PAM binding open a cleft for the engagement of a G protein. e, Cartoon illustrates activation-related transitions from the inactive apo state, through the agonist-bound intermediate states, to the agonist/PAM-bound active state. In the inactive state, both VFTs adopt fully open conformations, with their LB2 lobes being well separated. Agonist binding closes the GB1-VFT, bringing LB2 lobes in contact. These transformations at the level of VFTs propagate through the stalks towards TMD domains, resulting in their mutual reorientation and formation of a contact interface along TM6. PAM binding further stabilizes the active state leading to substantial shifts of the intracellular ends of TM3 and TM5 opening up a cleft for the engagement of G proteins or other transducers.
The second intermediate state (int-2) shows a complete closure of the GB1-VFT, in agreement with the previous crystal structures of the agonist-bound VFTs23. This closure brings the two LB2 lobes in contact, decreasing the distance between their C-terminal ends from 42 to 32 Å (Fig. 4a). This conformational rearrangement of the VFTs propagates through the stalks, leading to a relative motion of the TMDs that can be presented as a 30 Å translation of GB2-TMD with respect to stationary GB1-TMD (Fig. 4a, b). As a result of these transformations, the two TMDs come in direct contact through an interface along TM6 (Extended Data Fig. 4g), in perfect agreement with previous cross-linking studies30. A similar interaction along TM6 was also observed in the agonist-bound mGlu5 homodimer structure28. The conformational rearrangement of the TMDs completely changes not only the heterodimer interface (Fig. 4b), but also the overall dynamics of the receptor domains, as observed in our MD simulations and normal mode analyses (Figs. 2d, 4c, Extended Data Fig. 6d, e).
PAM further stabilizes the active state conformation of GABAB
The addition of a PAM along with the orthosteric agonist stabilized the receptor conformation similar to int-2 (r.m.s.d.=1.0 Å), resulting in a 3.6 Å resolution reconstruction (Fig. 3a), allowing us to observe activation-related transitions within the GB2-TMD.
The high-resolution structure also revealed the binding details of the orthosteric agonist SKF97541, a close analog of GABA with the carboxylic acid moiety replaced by the methyl-phosphinic acid. Similar to interactions of GABA in its complex with the GB1-VFT (PDB: 4MS3), binding of SKF97541 is largely defined by its acidic and basic groups. The basic amino moiety of SKF97541 forms polar and ionic interactions with H287 and E466, while the phosphinic acid of SKF97541 makes key hydrogen bonds to Y367, S247, and S270 (Fig. 3c, Supplementary Video 2). The ligand is also sandwiched between bulky aromatic side chains of W182 and W395. Our MD simulations confirmed the stability of these interactions (Extended Data Fig. 6f, j). Most residues interacting with SKF97541 and GABA belong to LB1 of the GB1-VFT, while two of them, Y367 and W395, reside on LB2 and shift by about 2 Å between the int-1 and int-2 states.
The most substantial differences between the agonist- (int-2) and agonist/PAM-bound structures occur within the GB2-TMD, where upon PAM binding TM3 and TM5 straighten and shift on the intracellular side by ~6 Å, while TM6, considered a hallmark of activation in class A and B GPCRs, does not move substantially (Fig. 4a, d). On the other hand, the conformation of the GB1-TMD remains mostly unchanged (Extended Data Fig. 7c–f). Strikingly, the first three structures (apo, int-1, and int-2) show the same conformation of TM3 and TM5 in GB2-TMD. The ionic lock between K3.50 and D6.35, which is highly conserved among class C receptors and observed in all inactive mGlu crystal structures24, is intact in GB1, but broken in GB2 in the PAM-bound state. These conformational changes in the GB2-TMD are most likely required to accommodate binding of the Gi/o protein for the initiation of intracellular signaling. This mechanism is further supported by the local resolution and B-factor comparison of GB2 (Extended Data Fig. 4e, f) demonstrating that the intracellular ends of TM3-5 are the most dynamic parts of the structure, while ICL2 and ICL3 of GB2 have been identified to be crucial for downstream signalling22,31.
PAM binding site at the heterodimer interface
Compound GS39783 has been characterized as a PAM of GABAB, however, little is known about its binding site and its mechanism of action32. We confirmed a positive allosteric effect of GS39783 on both ligand binding and signaling response of GABA. Additionally, using highly amplified IP1 assays, we observed that GS39783 alone behaves as an agonist (Extended Data Fig. 1c, d, Extended Data Table 2). After building and refining the agonist/PAM-bound GABAB model, we identified two putative binding sites for GS39783 with unexplained residual density. Site 1 is located inside the GB2-TMD, while site 2 is observed at the interface between the TMDs of GB1 and GB2 (Fig. 3d, Supplementary Video 3). Mutations of residues in site 1 inside the GB2-TMD did not affect either the allosteric or the agonist action of GS39783, suggesting that this is not the main binding site for GS39783 (Extended Data Figs. 8, 9).
On the other hand, mutation of residues in site 2, located at the TM6 heterodimer interface, unambiguously confirmed it as the site of action for GS39783 (Fig. 3e, f, Extended Data Figs. 8, 9). TM6 plays a major role in the activation of GABAB as the sole interface between TMDs, and binding of GS39783 in between the TM6s can stabilize this interaction. In this site, GS39783 fits well in the experimental density and is anchored by a hydrogen bond with N6986.45 of GB2 and a stacking interaction with Y8106.44 of GB1 (Fig. 3d). Other residues shaping the pocket and interacting with GS39783 include Y7895.59, K7925.62, and M8076.41 of GB1, as well as M6946.41 and Y6976.44 of GB2. These interactions are largely preserved in the MD simulations of the complex (Extended Data Fig. 6f, i).
We, therefore, propose that GS39783 plays a dual role in GABAB activation by (i) stabilizing the TM6-mediated dimerization interface33, and (ii) facilitating conformational transitions within the GB2-TMD.
Discussion
In this work, we determined the 3D structure of the pharmacologically important GABAB receptor in four distinct conformations along its activation trajectory from an inactive apo to an agonist/PAM-stabilized active state (Supplementary Video 1), allowing us to propose a model of signal transduction by GABAB and its modulation by a PAM (Fig. 4e). Upon binding of an agonist, a compaction of the VFTs brings the two TMDs closer together and reorients them to allow direct contact along TM6, in agreement with the proposed model based on TM cross-linking experiments30 (Fig. 4b). Overall, the observed domain rearrangements associated with the activation of GABAB resemble the previously published structures of mGlu528, suggesting that this activation mechanism is likely conserved among class C GPCRs. There are, however, three major differences between mGlu receptors and GABAB: i) GABAB is a mandatory heterodimer of two non-covalently associated subunits, while mGluRs function as homodimers with two identical subunits linked via a disulfide bond, ii) while GABA binding in a single subunit (GB1) is sufficient to fully activate the receptor, glutamate binding in both mGlu subunits is required for full activation34, and iii) GABAB lacks a CRD, present in mGlu subunits, connecting the VFTs with the TMDs and increasing the overall size of the receptor. Notably, our GABAB structures revealed the presence of a relatively rigid stalk composed of the ECL2 hairpin and the linker connecting the VFT with TMD. Similar to the CRD in mGlu receptors, this stalk likely transduces the signal from the VFTs to the TMDs, acting as a lever.
In contrast to the mGlu5 study28, where no conformational changes within the TMDs were reported, we succeeded in reaching an additional activation-related step and captured a PAM-stabilized state of GABAB with marked changes within the GB2-TMD. Unlike class A and B GPCRs, in which receptor activation is associated with a pronounced outward movement of TM6, the amplitude of TM6 motion in GABAB is constrained by the heterodimeric interface between two subunits. Instead, we observed striking movements of TM3 and TM5, opening a cleft on the intracellular side of GB2, potentially to engage a G protein or other transducers. This conformational change may be favored by the interaction between TM6 from each subunit resulting from the reorientation of the TMDs upon receptor activation, possibly explaining the role proposed for the GB1-TMD in the activation process30,33. Importantly, we identified the location of a binding site for GS39783 at the interface between the TMDs of the two subunits. GABAB PAMs can be attractive alternatives to orthosteric agonists due to their therapeutic potential; however, the lack of knowledge about their binding and mechanism of action hindered progress in their development.
Our results, therefore, provide detailed insights into the structural transformations associated with the activation of GABAB, shedding light on the intrinsically asymmetric allosteric mechanism, where binding of a ligand in the GB1-VFT translates via the stalk into drastic rearrangements of the GB2-TMD. Such mechanism has not been described in any GPCR structure, and underlines the unique activation process of this receptor. Finally, the structural differences between each of the states give important insights into pharmacological intervention of this receptor and could potentially result in the design of novel allosteric modulators.
Methods
Expression of GABAB
This study utilized two separate constructs with cleavable N- and C-terminal tags for GB1 and GB2. Human GB1 isoform 1A (UniProt: Q9UBS5, residues 165-920) was modified to include an N-terminal influenza hemagglutinin signal sequence and a C-terminal eGFP tag. Additionally, human GB2 (UniProt: O75899, residues 42-821) was modified to include an N-terminal influenza hemagglutinin signal sequence following a 3×FLAG epitope. The N- and C-terminal tags are removable by tobacco etch virus protease (TEV) and human rhinovirus 3C protease (PreX), respectively. The overall strategy of designing the constructs was to keep the topology of VFT and CC intact and also to provide the ability of pulling down the heterodimeric species.
Each construct was cloned into a pFastBac1 vector (Invitrogen) and expressed in Spodoptera frugiperda Sf9 insect cells using the Bac-to-Bac system (Invitrogen). Cells were co-infected with baculovirus at a density of 2.5-3×10⁶ cells ml−1 in ESF921 media containing 2% (v/v) production boost additive (PBA, Expression Systems) at an MOI (multiplicity of infection) of 8 for both GB1 and GB2 constructs. After 48 h cells were harvested, washed in PBS, and stored at −80 °C until further use.
Purification of GABAB
Cells were thawed in low salt wash buffer containing 20 mM HEPES-NaOH pH 7.5, 10 mM MgCl2, 20 mM KCl and protease inhibitor cocktail (made in-house). One round of dounce homogenization followed by centrifugation at 200,000 × g was carried out to disrupt intact cells and to remove unwanted soluble proteins. Further homogenization and centrifugation were done in the presence of 1 M NaCl for two rounds to remove cell nuclei and membrane associated proteins. The washed membranes were re-suspended and solubilized in buffer containing 100 mM HEPES-NaOH pH 7.5, 800 mM NaCl, 10% (v/v) glycerol, 1% (w/v) n-dodecyl-β-d-maltopyranoside (DDM, Anatrace), 0.2% (w/v) cholesteryl hemisuccinate (CHS, Sigma-Aldrich) for 2.5 h at 4 °C. Purification was carried out in the presence of 50 μM SKF97541 (Tocris Bioscience) for preparation of the agonist-bound sample, and without adding ligands for the agonist/PAM-bound and apo sample. Solubilized membranes were spun down at 200,000 × g for 50 min, and the resulting supernatant was incubated with anti-FLAG M2 affinity gel (MilliporeSigma) overnight at 4 °C. The resin was washed with 15 column volumes (CV) of wash buffer I containing 25 mM HEPES-NaOH pH 7.5, 300 mM NaCl, 0.1% (w/v) DDM, 0.02% (w/v) CHS and incubated overnight in the same buffer with the addition of 100 μg ml−1 FLAG peptide and TEV protease (GenScript) at 4 °C. The eluted protein was then incubated with anti-GFP nanobody resin (made in-house) and washed with 5 CV wash buffer I and 10 CV wash buffer II containing 25 mM HEPES-NaOH pH 7.5, 300 mM NaCl, 0.02% (w/v) DDM, 0.004% (w/v) CHS and exchanged to digitonin (MilliporeSigma) by incubating the resin with the same buffer containing 1% digitonin for 1 h. Elution was performed overnight by incubating the resin with PreX protease (GenScript) at 4 °C. The protein was finally purified by size-exclusion chromatography (SEC) on a Superose 6 Increase 10/300 GL column (GE Healthcare) in SEC buffer containing 25 mM HEPES-NaOH pH 7.5, 300 mM NaCl, 0.1% (w/v) digitonin. Dimeric fractions were pooled, supplemented with 100 μM SKF97541 (for the agonist sample) or with 100 μM SKF97541 and 100 μM GS39783 (for the agonist/PAM sample, Tocris Bioscience), stored at 4 °C overnight and concentrated to 10 mg ml−1 using a 100 kDa cut-off concentrator (Amicon) immediately before applying the sample to cryo-EM grids.
Cryo-EM data acquisition and processing
For the preparation of cryo-EM grids, Quantifoil grids (Au 1.2/1.3, 200 mesh, Quantifoil) were glow-discharged for 40 s at 30 mA (EasiGlo, Ted Pella). A total of 2.5 μl of concentrated GABAB sample was applied to each grid in a plunge-freezer (Leica GP3), blotted for 5 s at 95% relative humidity at 20 °C and plunge-frozen into liquid ethane. Frozen grids were transferred to liquid nitrogen and stored for data acquisition.
The first two datasets (agonist- and agonist/PAM-bound receptor) described in this study were collected on a Titan Krios (Thermo Fisher), equipped with a K3 direct-electron detector (Gatan), without energy-filter, operated at 300 kV. Each movie had a total exposure time of 3.5 s with 70 ms per frame readout, at a dose-rate of ~ 15 e Å−2 s−1, corresponding to a total dose of ~ 50 e Å−2. High magnification images were collected in super-resolution mode, with a corresponding pixel size of 0.426 Å px−1. Automated data collection was performed using SerialEM35, with a strategy of applying image shifts to collect data from 9 holes (with 3 images per hole) after each stage movement, to increase throughput. The third ‘apo’ dataset was collected on a Titan Krios (Thermo Fisher) equipped with an energy filter and K2 direct-electron detector (Gatan), operated at 300 kV. The data collection procedure was similar to the previous two datasets, with the difference of a nominal pixel size of 1.08 Å px−1, a dose rate of ~ 8 e Å−2 s−1 , 200 ms exposure time per frame, a total of 8 s exposures with the energy filter set to 20 eV slit size and only one acquisition per hole.
The first dataset (GABAB/SKF97541) had a total of 14,271 micrographs (3.5 d of data collection), the second dataset (GABAB/SKF97541/GS39783) of 10,917 micrographs (2.5 d of data collection) and the third dataset (GABAB/apo) 5,947 micrographs (2 d of data collection). Beam-induced motion correction was performed using MotionCor236 and included binning of the super-resolution images by a factor of 2 for the first two K3 datasets. CTF estimation was done using CTFFIND437. Corrected images for the first dataset were imported into the RELION 3.0 software package38, following established processing pipelines. After initial template-based autopicking, 2D classification resulted in classes from two distinctly different conformations of GABAB (Extended Data Fig. 2). 3D classification in RELION was used to separate particles into two classes. The particles from each class were then transferred to the cryoSPARC software package39 for detergent belt subtraction, followed by several rounds of ‘ab-initio reconstructions’, ‘heterogeneous refinement’, ‘non-uniform refinement’ and ‘local refinement’, resulting in two reconstructions at 6.3 and 4.8 Å (Extended Data Fig. 2). The second dataset (GABAB/SKF97541/GS39783) was directly imported into cryoSPARC, 2D classification resulted in 124,575 particles. A final of 89,001 particles resulted in a reconstruction of 3.6 Å resolution, based on the FSC=0.143 criterion (Extended Data Fig. 2g, Extended Data Fig. 4). The third dataset (GABAB/apo) was also only processed with cryoSPARC, with a final of 113,093 particles resulting in a reconstruction at 4.0 Å resolution (Extended Data Fig. 5).
GABAB structure determination and refinement
The initial model for the agonist/PAM-bound GABAB was composed of a TMD model generated by homology from the crystal structure of mGlu1 (PDB: 4OR2) using SWISS-MODEL40 and a VFT model derived from the previously published crystal structure of GABAB VFT in complex with GABA (PDB: 4MS3). Both models were first manually docked into the cryo-EM density map using UCSF ChimeraX41 and further improved by using ‘phenix.dock_in_map’ in PHENIX v. 1.17.142. The pseudosymmetry of the GABAB heterodimer was addressed by both docking known VFT crystal structures and pinpointing asymmetries in the glycosylation sites, most prominently seen on N440 of GB1. The model was then subjected to iterative manual building in Coot43 and real space refinement in PHENIX against sharpened 3.6 Å resolution map using global minimization, local rotamer fitting, and restrained group ADP refinement with secondary structure restraints and a nonbonded weight of 500. Interestingly, in this structure we observed an extensive elongated density next to ICL2 of the GB2-TMD, stretching out in the intracellular space at an angle of ~20° to the plane of the membrane (Fig. 3a). Due to the poor local resolution, it was not possible to unambiguously model this domain. However, based on its topology, we tentatively assigned it to the intracellular CC domain.
The fully refined agonist/PAM-bound GABAB TMDs along with a VFT model derived from the crystal structure of GABAB VFT in the apo state (PDB: 4MQE) were used as an initial template for the apo state model by fitting into the cryo-EM density map and further improved by iterative manual building in Coot and real space refinement in PHENIX against the sharpened 4.0 Å resolution map using global minimization, local rotamer fitting, and restrained ADP refinement with secondary structure restraints and a non-bonded weight of 500.
The initial model for the int-1 state was generated by fitting two TMDs from the fully refined apo GABAB structure, as well as two separate lobes, LB1 and LB2, of GB1-VFT and a whole GB2-VFT from the crystal structure (PDB: 4MS3) in the map in ChimeraX followed by rigid body refinement in PHENIX. After manual adjustments in Coot, which included connecting separate domains and trimming most sidechains and intracellular loops in TMDs, the model was subjected to real space refinement in PHENIX against the sharpened int-1 6.3 Å resolution map using global minimization, local rotamer fitting, and restrained group ADP refinement with secondary structure and reference model (apo structure) restraints and a non-bonded weight of 500. Although the agonist is likely bound to the receptor in the int-1 state, it was not included in the model because of the insufficient resolution.
The initial model for the int-2 state was generated by fitting two TMDs from the fully refined apo GABAB, as well as two VFTs from the GABA-bound crystal structure (PDB: 4MS3) in the map in ChimeraX followed by rigid body refinement in PHENIX. After manual adjustments in Coot, which included connecting separate domains and trimming some sidechains and intracellular loops in the TMDs, the model was subjected to real space refinement in PHENIX against the sharpened int-2 4.8 Å resolution map using global minimization, local rotamer fitting, and restrained group ADP refinement with secondary structure and reference model (agonist/PAM-bound structure) restraints and a non-bonded weight of 500. Cryo-EM data collection and refinement statistics are shown in Extended Data Table 1.
Molecular dynamics simulations
All molecular dynamics (MD) simulations were conducted with Gromacs44 v.2018 simulation engine under Charmm36 force field parameters and topologies45. Missing loops and side-chains were modelled using loop modelling and optimization tools in ICM-Pro46 v.3.8.7b. The resultant structures were then uploaded to the Charmm-GUI webserver47 to generate input files for the simulation. All structures were embedded into a bilayer of POPC lipids; initial membrane coordinates were assigned by the PPM server48 via the Charmm-GUI interface. The Ligand Reader & Modeller of Charmm-GUI49 was invoked to generate Charmm36 force field parameters and topologies for GS39783 and SKF97541. The apo system contained 375 POPC lipids, 61,663 water molecules, 167 sodium, and 186 chloride ions, whilst the ligand-bound system contained 385 POPC lipids, 66,825 water molecules, 181 sodium, and 200 chloride ions. After initial energy minimizations, both systems were equilibrated for 20 ns, followed by production runs of up to 800 ns for the apo system and 500 ns for the SKF97541/GS39783-bound system. The simulations were performed either on NVIDIA P100 GPU enabled nodes made available by the Google Cloud Platform or with GPU clusters at the High-Performance Computing Center of the University of Southern California. MD trajectories were analyzed using MDAnalysis package50.
Normal mode analysis
Normal modes of the apo and SKF97541/GS39783-bound structures were assessed using the ProDy package51. Two independent anisotropic network models (ANM), with respect to apo and SKF97541/GS39783-bound structures, were defined in the presence of explicit POPC lipid bilayer. Coordinates of the lipids were taken from Charmm-GUI output. Network nodes include Cα atoms from the proteins and heavy atoms from the lipids. Slowest modes of each ANM model were compared to the principal components of corresponding MD trajectories by evaluating correlations between eigenvectors on corresponding Cα atoms52.
Molecular pharmacology methods
The pRK5 plasmids encoding the wild-type human GB1a with the signal peptide of mGlu5, followed by a HA-tag and a Halo-tag at the N-terminus, upstream of residue G18, or the wild-type human GB2 with the signal peptide of mGlu5, a Flag-tag followed by SNAP-tag at the N-terminus, upstream of W42, were obtained from Prof. Jianfeng Liu’s laboratory (Huazhong University of Science and Technology, Wuhan, China). Human GB1 and GB2 constructs used for cryo-EM analysis were subcloned into these pRK5 plasmids to obtain a HA- and Halo-tagged GB1 construct (between the Mlu-I and Hind-III unique sites), and the Flag- and SNAP-tagged GB2 construct (between the Not-I and Hind-III unique sites). The mutations of GB1 and GB2 in the pRK5 plasmids were generated by site-directed mutagenesis using the QuikChange mutagenesis protocol (Agilent Technologies).
HEK293 cells were cultured in Dulbecco’s modified Eagle’s medium (DMEM) supplemented with 10 % FBS and transfected by electroporation. Ten million cells were transfected with 260 V voltage and 800 μF capacitance using the Gene Pulser Xcell MicroPulser Electroporator (Bio-Rad, France), and then distributed into a 96 well plate (Greiner Bio-one). Eventually, Lipofectamine™ 2000 (Thermo Fisher Scientific) was used according to the manufacturer protocol for transfection. One hundred thousand cells were transfected with 20 ng GB1 plasmid and 40 ng GB2 plasmid either alone or simultaneously for 1 well in a 96 well-plate. For the IP1 detection, cells were also co-transfected with 10 ng chimeric G protein Gαqi9 to allow efficient coupling of the receptor to the phospholipase C pathway21. IP1 accumulation in HEK293 cells was measured using the IP-One HTRF kit (Cisbio, France) according to the manufacturer’s recommendations.
Ligand binding assay
HEK293 cells were co-transfected with pRK5 plasmids encoding wildtype or mutant GB1 and GB2 in 96 well plates. Intact cells were washed once with Tag-lite buffer (Cisbio, France) 48 h later and incubated with both 5 nM CGP54626-DY647 (Cisbio, France) and increasing concentrations of GABA for 3 h at 4 °C in Tag-lite buffer. After three washes with Tag-lite buffer, fluorescence was measured as the specific DY647 emission spectrum (665 nm) with an Infinite F500 reader (Tecan, Switzerland).
Cell-surface quantification of receptor with SNAP-tag or Halo-tag
For SNAP-tag and Halo-tag detection, HEK293 cells from 96 well plates were incubated at 37 °C with 100 nM of SNAP–Lumi4-Tb or 100 nM of Halo-Lumi4-Tb for 1h, 48 h after transfection. After labeling, cells were washed three times with Tag-lite buffer (Cisbio, France), and fluorescence of Lumi4-Tb (excitation at 337 nm, emission at 620 nm, 60 ms delay, and 400 ms integration time) was read using Infinite F500 reader (Tecan, Switzerland).
Figures and graphical illustration
Pymol v. 2.3.3 (Schroedinger), UCSF ChimeraX v. 0.9, and ICM-Pro v. 3.8.7b (Molsoft) were used to make figures and videos. All cryo-EM maps shown in the manuscript were masked to hide densities arising from the detergent belt. All reported r.m.s.d. values were calculated using the ‘align’ command in Pymol. The distances between the C-terminal ends of the GB1 and GB2 VFTs in Extended Data Fig. 7a, b were measured between Cα atoms of residues D576 (cryo-EM models) or D459 (X-ray models) in GB1 and D466 (cryo-EM and X-ray models) in GB2. The TM5-TM5 and TM6-TM6 distances in Fig. 4b, c were measured between Cα atoms of residues G7715.41 and V8226.56 in GB1 and residues G6585.41 and V7096.56 in GB2 to compare with cross-linking data30. The shifts of TM3 and TM5 of GB2 in Fig. 4d were measured for Cα atoms of residues I5813.57 and T6785.61. The GABAB heterodimer interface areas in Extended Data Figs. 4g, i were calculated using the program PISA53.
Data availability
The cryo-EM density maps and corresponding coordinates have been deposited in the Electron Microscopy Data Bank (EMDB) and the Protein Data Bank (PDB), respectively, under the following accession codes: EMD-20822 and 6UO8 (GABAB bound to SKF97541 and GS39783), EMD-20823 and 6UO9 (GABAB bound to SKF97541, int-2 state), EMD-20824 and 6UOA (GABAB bound to SKF97541, int-1 state), and EMD-21219 and 6VJM (GABAB in the apo state).
Figs. 2e, f, 3e, f and Extended Data Figs. 1a–d, Extended Data Fig. 8, 9 have associated raw data. Supplementary information file contains the uncropped gel shown in Extended Data Fig. 1f. All other data are available from the authors on reasonable request.
Extended Data
Extended Data Fig. 1 |. Expression, characterization and purification of GABAB.
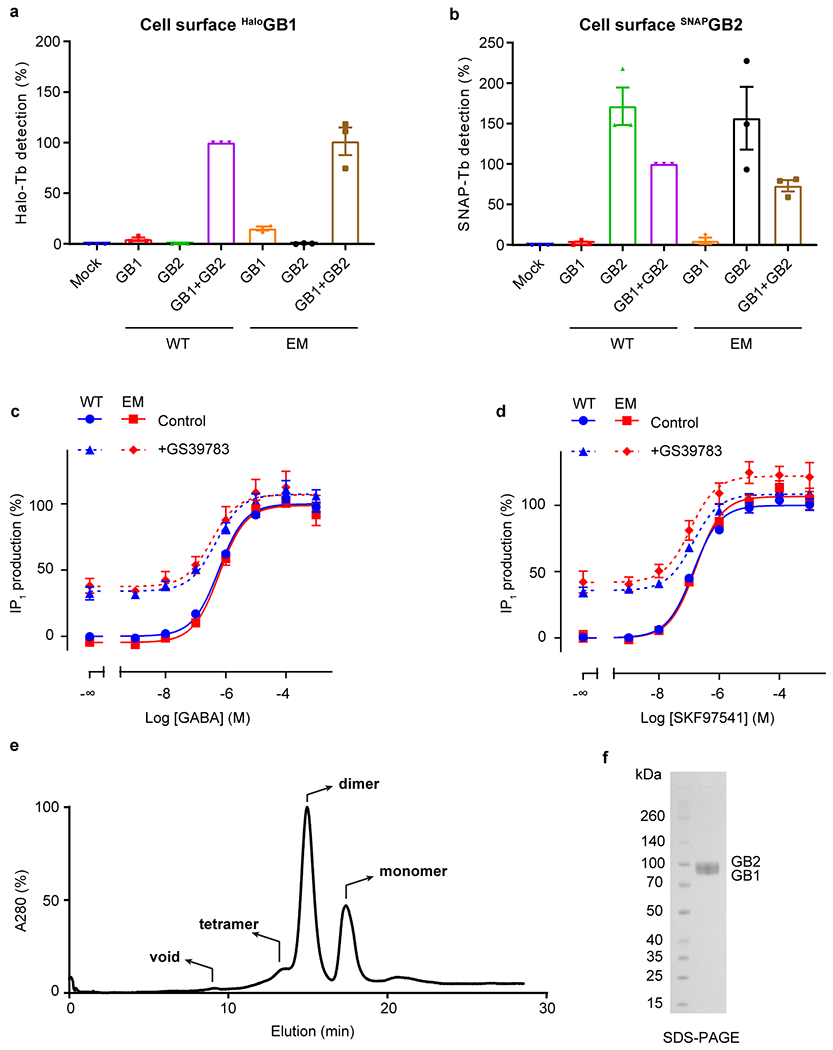
a, b, Cell surface expression of Halo-GB1 (a) and SNAP-GB2 (b) transfected alone or co-transfected with the second subunit, measured by the fluorescence emission of the Lumi4-Tb bound to the Halo- (a) or SNAP-tag (b). Values are normalized by the WT GB1 co-transfected with WT GB2 (purple bar) and shown as means ± SD of 3 biologically independent experiments. GABAB constructs for cryo-EM are expressed and function like the wild-type receptor. c, d, Positive allosteric effect of GS39783 (5 μM) on IP1 accumulation in cells expressing WT or cryo-EM constructs of GABAB receptor heterodimers and activated either by (c) GABA or (d) SKF97541. Data are normalized by the WT response in absence of GS39783 (Control) and shown as means ± SEM of 3 biologically independent experiments (4 for WT). e, Representative size exclusion chromatography (SEC) profile of apo GABAB in digitonin micelles. Dimeric fractions were pooled, supplemented with ligand, and concentrated for cryo-EM imaging. f, Coomassie stained SDS-PAGE profile shows two distinct bands for GB1 (86 kDa) and GB2 (88 kDa). For gel source data, see Supplementary Figure 1.
Extended Data Fig. 2 |. Cryo-EM data processing for GABAB/SKF97541.
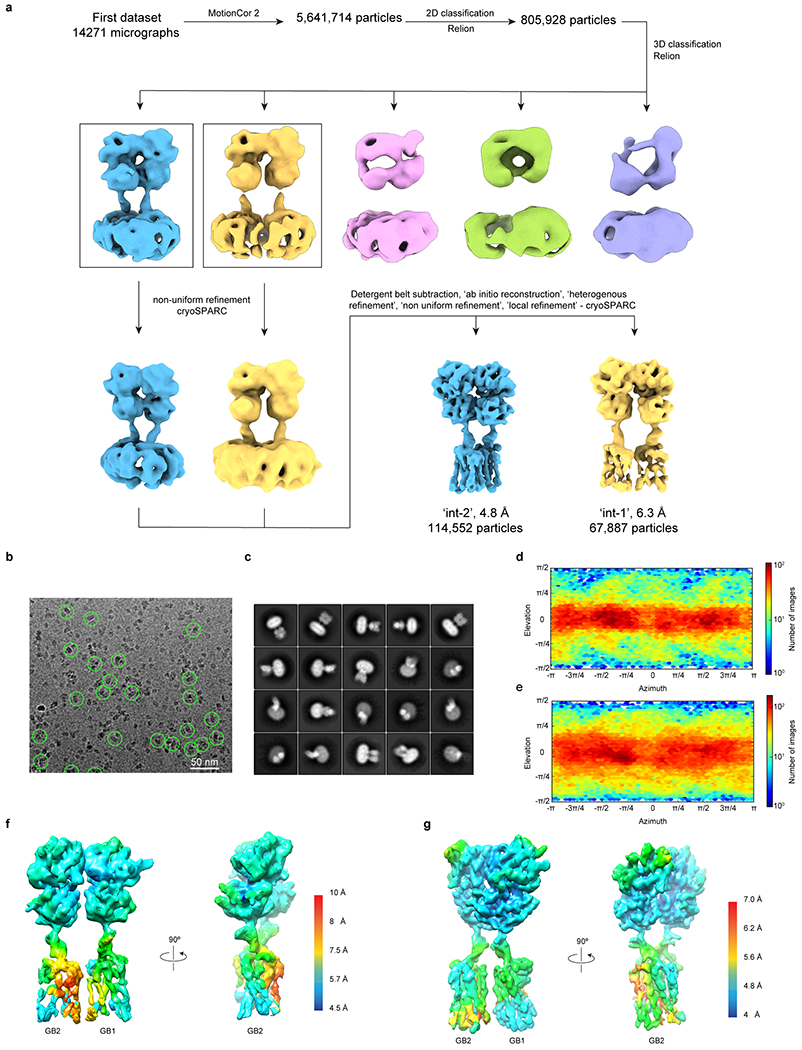
a, Single particle cryo-EM data processing scheme using RELION and cryoSPARC. b, Representative micrograph showing picked particles. c, Representative 2D class averages. d, Angular distribution of particles included in the final cryo-EM reconstruction for the int-1 state. e, The same as (d) but for the int-2 state. f, g, Density maps for int-1 (f) and int-2 (g) states colored by local resolution showing higher resolution at the VFT interface.
Extended Data Fig. 3 |. Cryo-EM map quality.
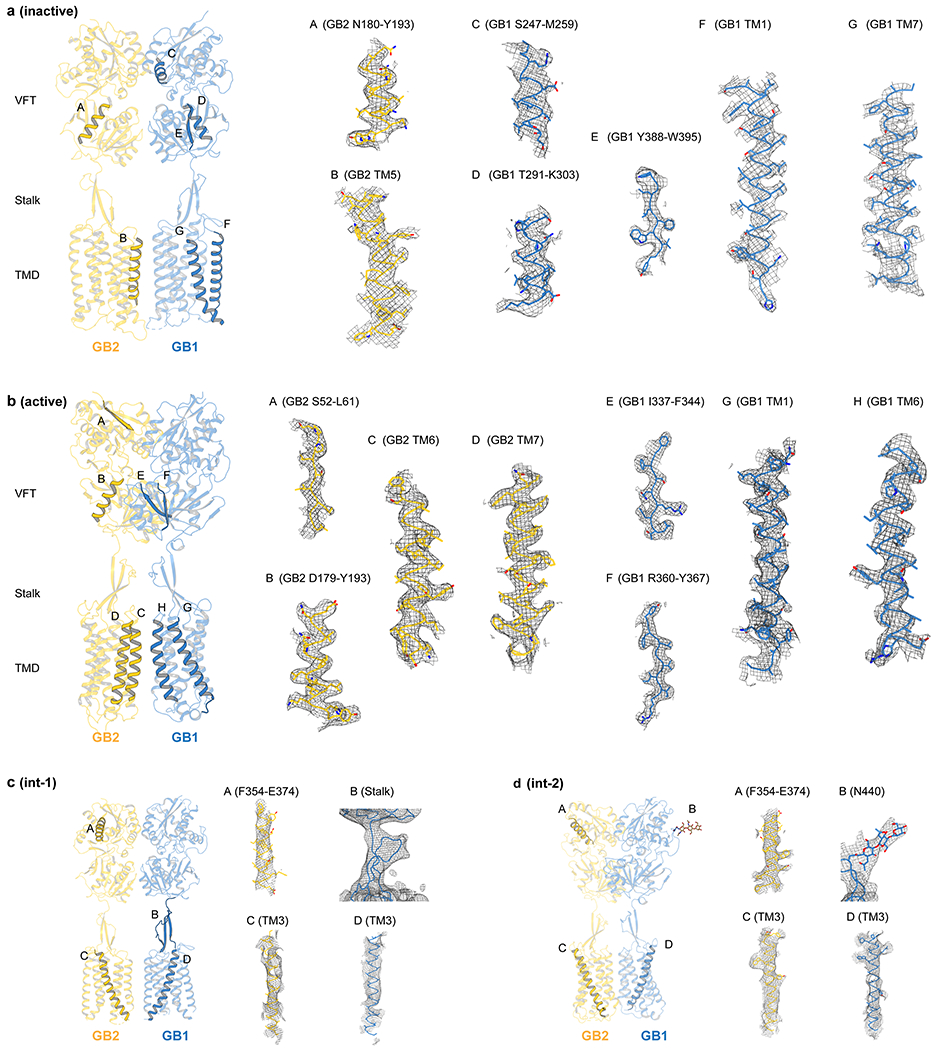
a-d, Representative densities and fitted atomic models are shown for GABAB in the inactive apo state (a), active agonist/PAM-bound state (b), and two intermediate int-1 (c) and int-2 states (d).
Extended Data Fig. 4 |. Cryo-EM data processing for GABAB/SKF97541/GS39783.
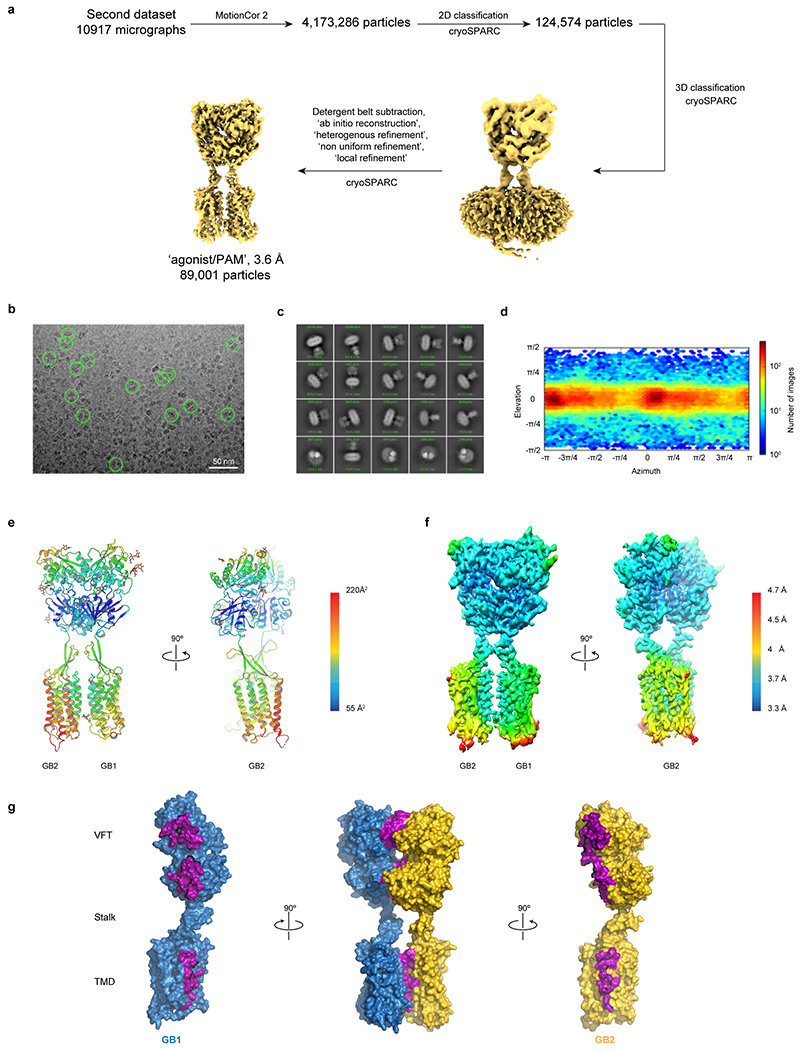
a, Single particle cryo-EM data processing scheme using cryoSPARC. b, Micrograph showing picked particles. c, Representative 2D class averages show distinct secondary structure features. d, Particle angular distribution of the final cryo-EM reconstruction. e, Structural model shown in cartoon representation and colored by the B-factors. f, Density map colored by local resolution showing higher resolution at the interface between GB1 and GB2. g, The heterodimer interface includes both LB1 and LB2 lobes, as well as TM6 with a total interface area of 1930 Å2. Residues involved in dimerization contacts are colored in purple.
Extended Data Fig. 5 |. Cryo-EM data processing for apo GABAB.
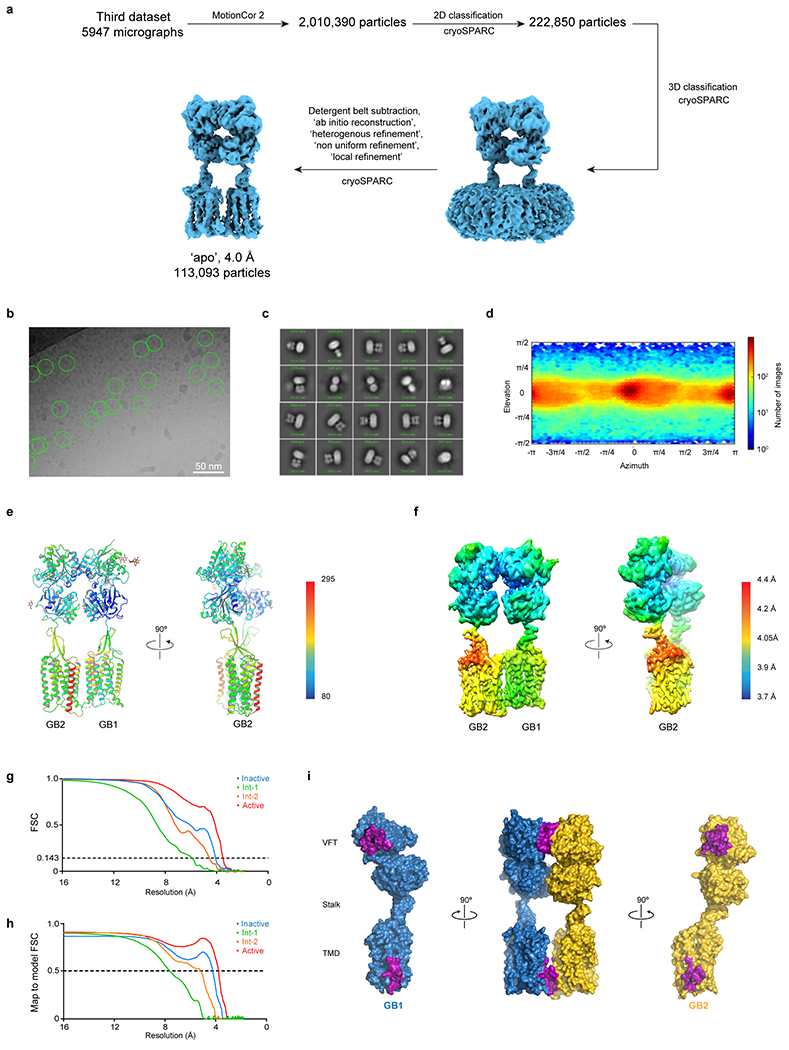
a, Single particle cryo-EM data processing scheme using cryoSPARC. b, Micrograph showing picked particles. c, Representative 2D class averages show distinct secondary structure features. d, Particle angular distribution of the final cryo-EM reconstruction. e, Structural model shown in cartoon representation and colored by the B-factors. f, Density map colored by local resolution showing higher resolution at the interface of GB1 and GB2. g, ‘Gold standard’ FSC curves from cryoSPARC. h, Map-to-model FSC curve between each refined model and the corresponding sharpened electron potential maps. i, GB1 and GB2 interact through LB1 lobes and intracellular tips of TM3 and TM5, with a total interface area of 963 Å2. Residues involved in dimerization contacts are colored in purple.
Extended Data Fig. 6 |. Molecular Dynamics (MD) simulations of inactive (apo) and active (agonist/PAM-bound) states.
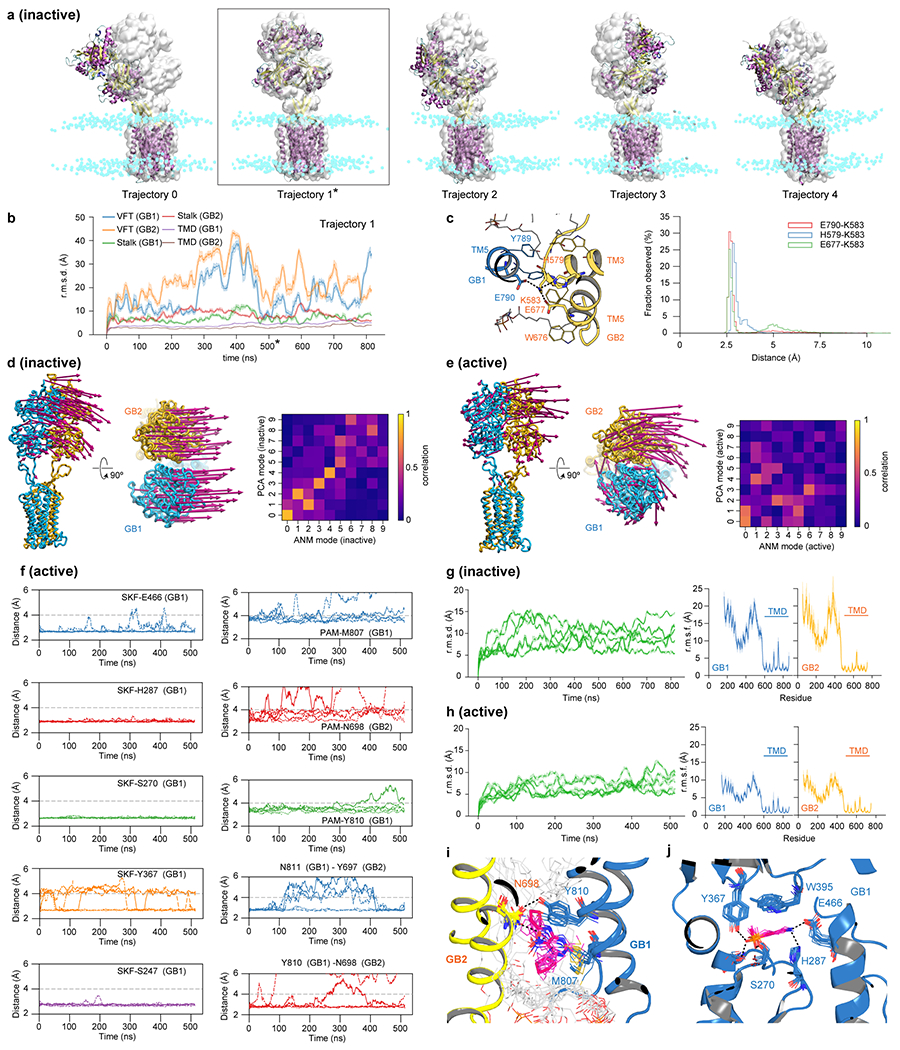
a, VFT fluctuations in the inactive state are illustrated by comparing MD snapshots at 500 ns for all five trajectories (cartoon, purple for α-helices, yellow for β-strands) against the cryo-EM structure (grey surface). Cyan spheres indicate nitrogens of hydrophilic heads of the POPC lipid bilayer. Asterisk corresponds to trajectory 1. b, Traces of Cα r.m.s.d. for different domains in trajectory 1. The structures in the trajectory were aligned by TMDs against the cryo-EM structure. c, Distribution of distances for ionic interactions between TM3/TM5 at the intracellular side of the apo GABAB as observed in MD simulations. d, e, Membrane-coupled anisotropic network model (ANM) analysis of the inactive (d) and active (e) state cryo-EM structures. Eigenvectors of the slowest mode are drawn on every eights Cα as magenta arrows. In the inset heat map, overall dynamics of the protein as observed in MD simulations are compared against that predicted from ANM analysis on EM structures; correlations between eigenvectors of the ten slowest ANM modes and the principle components of Cα motions in MD simulations are calculated showing concurrence between the two. f, Distance plots as observed in agonist/PAM-bound trajectories for interactions between SKF97541 (SKF) and various contact residues in the GB1 pocket (left column), interactions between GS39783 (PAM) and its contact residues at the TMD interface (right column, rows 1–3) and interactions between GB1 and GB2 residues (right column, rows 4-5). g, h, Traces of Cα r.m.s.d. on the overall structure for individual MD trajectories (green) and plots of root mean square fluctuations (r.m.s.f.) per residue in GB1 (blue) and GB2 (yellow) subunits as observed in MD simulations for inactive (g) and active (h) states. i, j, Stacked snapshots of GS39783 (i) and SKF97541 (j) binding site for one of the trajectories, taken every 50 ns spanning 500 ns. In traces of Cα r.m.s.d. (b, g, h), data (solid line) are presented as an average within a sliding window of 500 ps; shading refers to 95% confidence interval (n=500). In plots of r.m.s.f. (g, h), data (solid line) are shown as an average of 5 independent trajectories at each residue position; shading refers to 95% confidence interval (n=5).
Extended Data Fig. 7 |. Comparisons with previous crystal structures and additional details of activation-related transitions in GABAB.
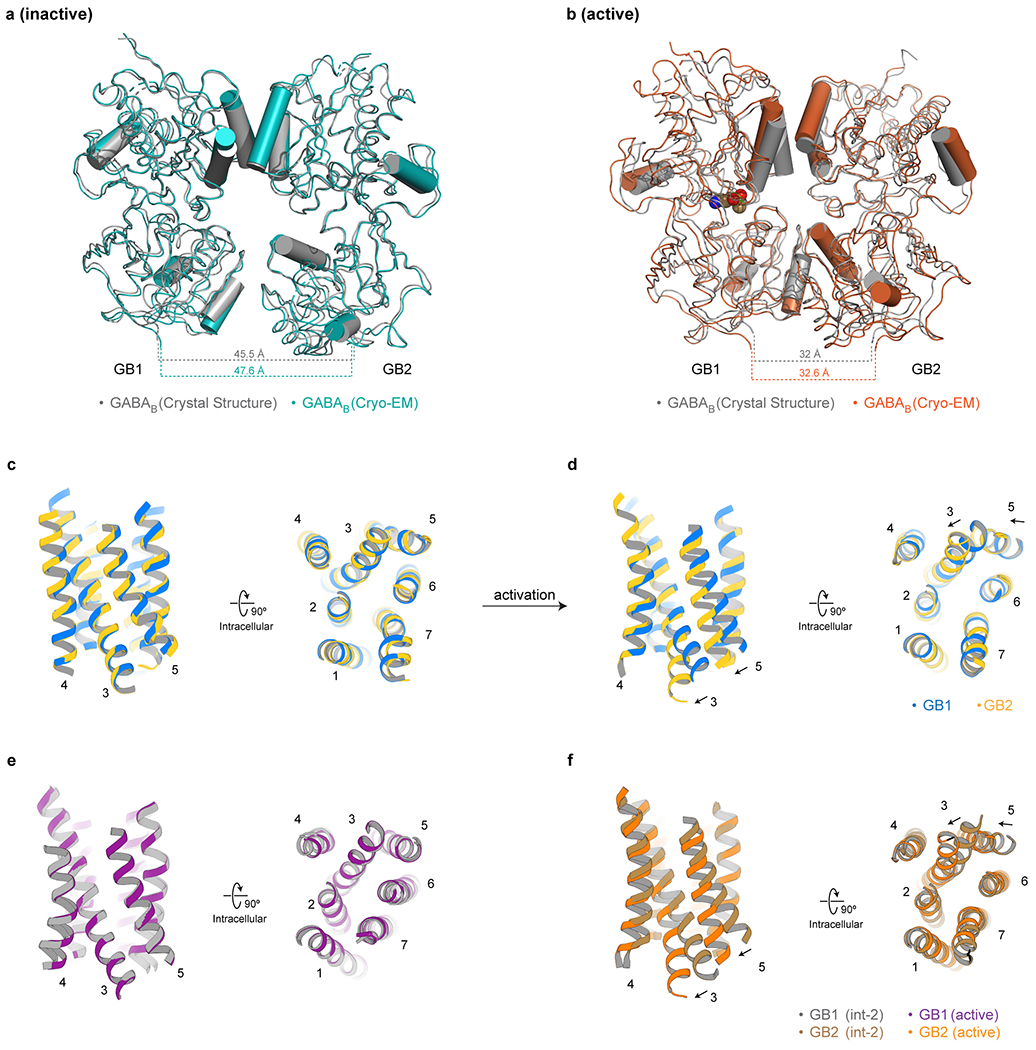
a, Comparison of the VFT domains between the apo cryo-EM structure (teal) and the apo crystal structure (PDB: 4MQE, grey). b, Comparison of the VFT domains between the active agonist/PAM-bound cryo-EM structure (orange) and the GABA-bound crystal structure (PDB: 4MS3, grey). c, Comparison between GB1 and GB2 TMDs in the inactive apo state demonstrates no substantial difference between the subunits. d, Comparison between GB1 and GB2 TMDs in the active agonist/PAM-bound state illustrates the differences between the subunits upon activation. e, GB1-TMD remains unchanged between the int-2 and the active agonist/PAM-bound states. f, Shifts of TM3 and TM5 at the intracellular side of the GB2-TMD between the int-2 and active states open up a cleft for the engagement of a G protein.
Extended Data Fig. 8 |. PAM effects on the orthosteric ligand binding in the site 1 and 2 mutants of GABAB.
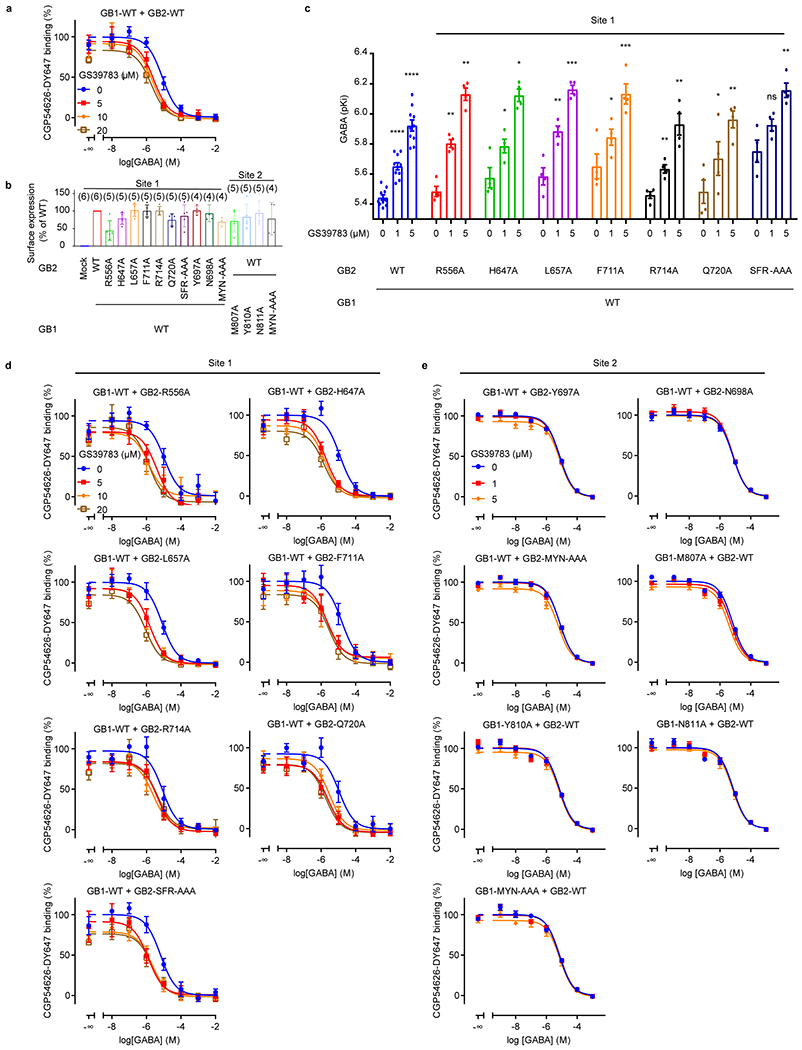
a, Displacement of the CGP54626-DY647 by GABA in intact cells expressing the WT GABAB receptor in the absence (blue) or presence of 5 μM (red), 10 μM (orange) or 20 μM (sand) GS39783. b, Cell surface expression of site 1 and 2 mutants, measured by co-transfecting Halo-GB1 with GB2 and recording fluorescence emission of HaloTag-Lumi4-Tb. Data are normalized by the WT expression and shown as means ± SD. The numbers of biologically independent experiments are shown in parentheses. c, pKi values for GABA were determined from displacement of CGP54626-DY647 binding in intact cells expressing the indicated subunit combinations in the absence or presence of 1 μM or 5 μM GS39783. Values are means ± SEM of 4 (10 for WT) biologically independent experiments. Data are analyzed using one-way ANOVA with Dunnett’s multiple comparison test to determine significance (compared with no GS39783 for the same combined subunits), with ****P ≤ 0.0001, ***P ≤ 0.001, *P ≤ 0.01, and ns P > 0.05. For 1 μM (5 μM) GS39783, P = 0.0030 (0.0045) for GB2-R556A, 0.0205 (0.0157) for GB2-H647A, 0.0084 (0.0009) for GB2-L657A, 0.0436 (0.0003) for GB2-F711A, 0.0013 (0.0053) for GB2-R714A, 0.0373 (0.0056) for GB2-Q720A, and 0.0735 (0.0019) for GB2-SFR-AAA. d, e, Displacement of the CGP54626-DY647 by GABA in intact cells expressing the indicated mutants in site 1 (d) and site 2 (e), in the absence or presence of the indicated concentrations of GS39783 as in panel (a). Data are normalized by the signal in absence of GS39783 and shown as means ± SEM of 3 biologically independent experiments.
Extended Data Fig. 9 |. PAM effects on signaling of the site 1 and 2 mutants of GABAB.
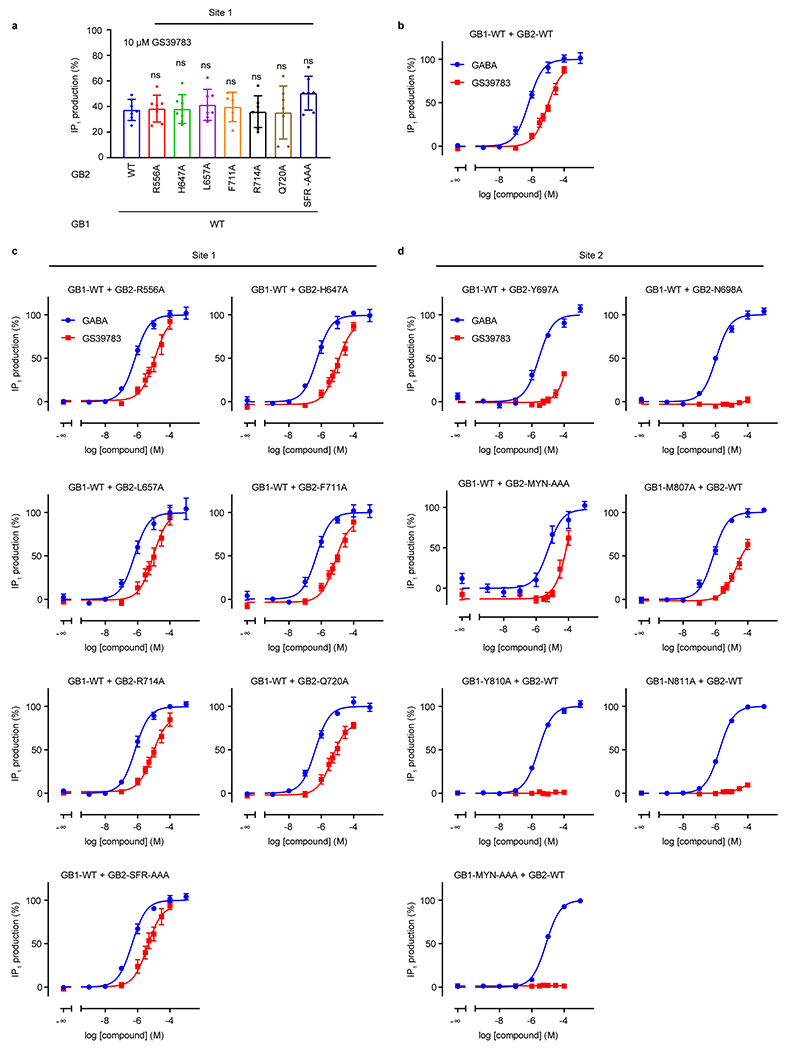
a, IP1 production induced by 10 μM GS39783 in intact cells expressing the indicated site 1 GB2 mutants co-expressed with the wild-type GB1. Data are normalized by the GABA response and shown as means ± SD of 7 (10 for WT) biologically independent experiments. Data are analyzed using one-way ANOVA with Dunnett’s multiple comparison test to determine significance (compared with WT), with P = 0.9998 for GB2-R556A, 0.9999 for GB2-H647A, 0.9907 for GB2-L657A, 0.9995 for GB1-F711A, 0.9997 for GB2-R714A, 0.9996 for GB2-Q720A, and 0.2807 for GB2-SFR-AAA. b-d, IP1 production induced by GABA (blue) or GS39783 (red) in intact cells expressing the wild-type receptor (b) or the indicated mutant of the site 1 (c) or site 2 (d). Data are normalized by the GABA response and shown as means ± SEM of 4 biologically independent experiments.
Extended Data Table 1.
Cryo-EM data collection, refinement and validation statistics
| GABAB apo | GABAB/SKF97541 Int-1 | GABAb/SKF97541 Int-2 | GABAB/SKF97541/GS39783 | |
|---|---|---|---|---|
| (EMDB-21219) | (EMDB-20824) | (EMDB-20823) | (EMDB-20822) | |
| (PDB 6VJM) | (PDB 6UOA) | (PDB 6U09) | (PDB 6UO8) | |
| Data collection and processing | ||||
| Magnification | 135,000 | 29,000 | 29,000 | 29,000 |
| Voltage (kV) | 300 | 300 | 300 | 300 |
| Electron exposure (e−/Å2) | 8 | 15 | 15 | 15 |
| Defocus range (μm) | −1.5 - −2.5 | −1.5 - −3.0 | −1.5 - −3.0 | −1.5 - −3.0 |
| Pixel size (Å) | 1.08 | 0.8521 | 0.8521 | 0.8521 |
| Symmetry imposed | C1 | C1 | C1 | C1 |
| Initial particle images (no.) | 2,010,390 | 5,641,714 | 5,641,714 | 4,173,286 |
| Final particle images (no.) | 113,093 | 48,600 | 114,552 | 89,001 |
| Map resolution (Å) | 4.0 | 6.3 | 4.8 | 3.6 |
| FSC threshold | 0.143 | 0.143 | 0.143 | 0.143 |
| Map resolution range (A) | 3.7 - 4.6 | 5.7 - 12.2 | 4.5 - 7.3 | 3.4 - 7.0 |
| Refinement | ||||
| Initial model used (PDB code) | 4MQE, 6UO8 | 4MQE, 6VJM | 4MS3, 6UO8 | 4MS3, 40R2 |
| Model resolution (A) | 4.2 | 7.6 | 5.2 | 3.8 |
| FSC threshold | 0.5 | 0.5 | 0.5 | 0.5 |
| Model resolution range (Å) | 29.1 - 3.4 | 29.3 - 1.8 | 34.3 - 3.5 | 33.7 - 3.0 |
| Map sharpening B factor (Å2) | −143.0 | −378.1 | −230.7 | −125.8 |
| Model composition | ||||
| Non-hydrogen atoms | 10,629 | 9,153 | 9,915 | 10,958 |
| Protein residues | 1,369 | 1,323 | 1,365 | 1,385 |
| Ligands | 0 | 0 | 1 | 2 |
| N-glycans | 11 | 11 | 13 | 13 |
| B factors (Å2) | ||||
| Protein | 147.4 | 361.4 | 209.8 | 116.0 |
| Ligands | N/A | N/A | 141.0 | 120.8 |
| N-glycans | 191.8 | 421.3 | 260.1 | 145.3 |
| R.m.s. deviations | ||||
| Bond lengths (Å) | 0.005 | 0.006 | 0.006 | 0.004 |
| Bond angles (°) | 0.912 | 1.300 | 1.360 | 0.713 |
| Validation | ||||
| MolProbity score | 1.86 | 1.87 | 1.86 | 1.68 |
| Clashscore | 6.77 | 6.80 | 6.36 | 4.16 |
| Poor rotamers (%) | 0.19 | 1.14 | 1.07 | 0.00 |
| Ramachandran plot | ||||
| Favored (%) | 91.75 | 92.94 | 92.03 | 92.23 |
| Allowed (%) | 8.25 | 7.06 | 7.97 | 7.77 |
| Disallowed (%) | 0.0 | 0.0 | 0.0 | 0.0 |
Extended Data Table 2 |. Mutation study of GABAB.
Apparent affinities for GABA (pKi) in the presence of indicated concentrations of GS39783 (0, 1, 5, 10 or 20 μM) and functional data for the GABA or GS39783 alone. N.E., no effect (absence of response); N.D., not determined (value cannot be calculated). The number of biologically independent experiments (n) is shown in parentheses.
| GB1 + GB2 | GABA pKi ± S.D. [GS] (n) | GABA pEC50 ± S.D. (n) | GS39783 pEC50 ± S.D. (n) | GS39783 Emax (% Emax GABA) ± S.D. (n) | |
|---|---|---|---|---|---|
| WT + WT | 5.44 ± 0.06 [0] (10) | 6.19 ± 0.08 (4) | 5.03 ± 0.08 (4) | 91.9 ± 4.8 (4) | |
| 5.65 ± 0.08 [1] (10) | |||||
| 5.92 ± 0.12 [5] (10) | |||||
| 5.95 ± 0.16 [10] (7) | |||||
| 6.02 ± 0.15 [20] (7) | |||||
| WT + R556A | 5.48 ± 0.07 [0] (4) | 6.16 ± 0.07 (4) | 4.93 ± 0.14 (4) | 98.5 ± 8.7 (4) | |
| 5.80 ± 0.05 [1] (4) | |||||
| 6.13 ± 0.08 [5] (4) | |||||
| 6.16 ± 0.25 [10] (4) | |||||
| 6.18 ± 0.24 [20] (4) | |||||
| WT + H647A | 5.58 ± 0.13 [0] (4) | 6.26 ± 0.09 (4) | 5.00 ± 0.11 (4) | 90.8 ± 6.6 (4) | |
| 5.79 ± 0.09 [1] (4) | |||||
| 6.12 ± 0.08 [5] (4) | |||||
| 6.06 ± 0.14 [10] (4) | |||||
| 6.15 ± 0.17 [20] (4) | |||||
| WT + L657A | 5.59 ± 0.11 [0] (4) | 6.2 ± 0.13 (4) | 5.04 ± 0.14 (4) | 99.5 ± 8.6 (4) | |
| 5.88 ± 0.07 [1] (4) | |||||
| 6.16 ± 0.06 [5] (4) | |||||
| 6.10 ± 0.16 [10] (4) | |||||
| 6.35 ± 0.14 [20] (4) | |||||
| WT+ F711A | 5.65 ± 0.16 [0] (4) | 6.3 ± 0.1 (4) | 5.14 ± 0.11 (4) | 90.7 ± 6.4 (4) | |
| 5.84 ± 0.11 [1] (4) | |||||
| Site 1 | 6.13 ± 0.14 [5] (4) | ||||
| 5.88 ± 0.26 [10] (4) | |||||
| 5.86 ± 0.23 [20] (4) | |||||
| WT + R714A | 5.46 ± 0.05 [0] (4) | 6.15 ± 0.06 (4) | 5.08 ± 0.1 (4) | 88.2 ± 5.5 (4) | |
| 5.63 ± 0.06 [1] (4) | |||||
| 5.93 ± 0.14 [5] (4) | |||||
| 5.92 ± 0.16 [10] (3) | |||||
| 5.65 ± 0.20 [20] (3) | |||||
| WT + Q720A | 5.48 ± 0.16 [0] (4) | 6.37 ± 0.07 (4) | 5.35 ± 0.11 (4) | 80.1 ± 4.7 (4) | |
| 5.70 ± 0.22 [1] (4) | |||||
| 5.96 ± 0.11 [5] (4) | |||||
| 5.82 ± 0.16 [10] (3) | |||||
| 6.03 ± 0.18 [20] (3) | |||||
| WT + SFR-AAA | 5.75 ± 0.15 [0] (4) | 6.34 ± 0.06 (4) | 5.39 ± 0.12 (4) | 93.7 ± 5.9 (4) | |
| 5.93 ± 0.08 [1] (4) | |||||
| 6.16 ± 0.10 [5] (4) | |||||
| 5.98 ± 0.18 [10] (3) | |||||
| 5.98 ± 0.19 [20] (3) | |||||
| WT + Y697A | 5.43 ± 0.04 [0] (4) | 5.56 ± 0.09 (3) | N.D. | N.D. | |
| 5.43 ± 0.10 [1] (4) | |||||
| 5.45 ± 0.05 [5] (4) | |||||
| WT+ N698A | 5.48 ± 0.07 [0] (4) | 5.96 ± 0.06 (3) | N.E. | N.E. | |
| 5.48 ± 0.05 [1] (4) | |||||
| 5.46 ± 0.07 [5] (4) | |||||
| 5.30 ± 0.16 [10] (3) | |||||
| 5.18 ± 0.16 [20] (3) | |||||
| WT + MYN-AAA* | 5.44 ± 0.05 [0] (4) | 5.25 ± 0.16 (3) | N.E. | N.E. | |
| 5.44 ± 0.05 [1] (4) | |||||
| 5.56 ± 0.18 [5] (4) | |||||
| Site 2 | M807A + WT | 5.51 ± 0.06 [0] (3) | 6.14 ± 0.06 (3) | 4.72 ± 0.12 (3) | 73.5 ± 6.6 (3) |
| 5.60 ± 0.09 [1] (3) | |||||
| 5.74 ± 0.15 [5] (3) | |||||
| Y810A + WT | 5.48 ± 0.09 [0] (3) | 5.59 ± 0.04 (3) | N.E. | N.E. | |
| 5.49 ± 0.03 [1] (3) | |||||
| 5.46 ± 0.09 [5] (3) | |||||
| N811A + WT | 5.45 ± 0.12 [0] (3) | 5.74 ± 0.03 (3) | N.E. | N.E. | |
| 5.43 ± 0.07 [1] (3) | |||||
| 5.48 ± 0.16 [5] (3) | |||||
| MYN-AAA + WT | 5.47 ± 0.10 [0] (3) | 5.12 ± 0.03 (3) | N.E. | N.E. | |
| 5.44 ± 0.09 [1] (3) | |||||
| 5.45 ± 0.11 [5] (3) |
Mutation MYN-AAA in GB2 refers to a triple mutant: M694A, Y697A, N698A
Supplementary Material
Acknowledgements
We thank K. Villers, C. Hanson, F. Nasertorabi, J. Velasques, and M. Barekatain for technical support, S. Roux for the help with collecting functional data, E. Montabana for microscope support, Y.-T. Li and N. Patel for support with computing resources, and Y. Kadyshevskaya for help with illustrations. This research was supported by the National Institutes of Health (NIH) grant R35 GM127086 (V.C.), by the Department of Energy, Laboratory Directed Research and Development program at SLAC National Accelerator Laboratory, under contract DE-AC02-76SF00515, and by the Fondation pour la Recherche Médicale (DEQ20170336747, to J.P.P.). We would like to acknowledge the SLAC-Stanford Cryo-EM center (SLAC National Accelerator Laboratory) for microscope time. Functional experiments were performed at the ARPEGE (Pharmacology Screening-Interactome) facility, Institut de Génomique Fonctionnelle (Montpellier, France). We acknowledge Google Cloud Platform credits and USC High Performance Computing Center for computer resources used in MD simulations.
References
- 1.Bowery NG et al. International Union of Pharmacology. XXXIII. Mammalian gamma-aminobutyric acid(B) receptors: structure and function. Pharmacol. Rev. 54, 247–64 (2002). [DOI] [PubMed] [Google Scholar]
- 2.Comps-Agrar L et al. The oligomeric state sets GABAB receptor signalling efficacy. EMBO J. 30, 2336–49 (2011). [DOI] [PMC free article] [PubMed] [Google Scholar]
- 3.Sieghart W Structure, pharmacology, and function of GABAA receptor subtypes. Adv. Pharmacol. 54, 231–63 (2006). [DOI] [PubMed] [Google Scholar]
- 4.Gassmann M & Bettler B Regulation of neuronal GABAB receptor functions by subunit composition. Nat. Rev. Neurosci. 13, 380–94 (2012). [DOI] [PubMed] [Google Scholar]
- 5.Lüscher C, Jan LY, Stoffel M, Malenka RC & Nicoll RA G protein-coupled inwardly rectifying K+ channels (GIRKs) mediate postsynaptic but not presynaptic transmitter actions in hippocampal neurons. Neuron 19, 687–695 (1997). [DOI] [PubMed] [Google Scholar]
- 6.Schuler V et al. Epilepsy, hyperalgesia, impaired memory, and loss of pre- and postsynaptic GABAB responses in mice lacking GABAB(1). Neuron 31, 47–58 (2001). [DOI] [PubMed] [Google Scholar]
- 7.Cousins MS, Roberts DCS & Wit H. de. GABAB receptor agonists for the treatment of drug addiction: A review of recent findings. Drug Alcohol Depend. 65, 209–220 (2002). [DOI] [PubMed] [Google Scholar]
- 8.Vacher CM & Bettler B GABA(B) receptors as potential therapeutic targets. Current drug targets. CNS and neurological disorders 2, 248–259 (2003). [DOI] [PubMed] [Google Scholar]
- 9.Chang E et al. A review of spasticity treatments: Pharmacological and interventional approaches. Crit. Rev. Phys. Rehabil. Med. 25, 11–22 (2013). [DOI] [PMC free article] [PubMed] [Google Scholar]
- 10.de Beaurepaire R Suppression of alcohol dependence using baclofen: a 2-year observational study of 100 patients. Front. psychiatry 3, 103 (2012). [DOI] [PMC free article] [PubMed] [Google Scholar]
- 11.Addolorato G et al. Baclofen efficacy in reducing alcohol craving and intake: a preliminary double-blind randomized controlled study. Alcohol Alcohol 37, 504–8 (2002). [DOI] [PubMed] [Google Scholar]
- 12.Lapin I Phenibut (β-phenyl-GABA): A tranquilizer and nootropic drug. CNS Drug Reviews 7, 471–481 (2001). [DOI] [PMC free article] [PubMed] [Google Scholar]
- 13.Dalmau J & Graus F Antibody-Mediated Encephalitis. N. Engl. J. Med. 378, 840–851 (2018). [DOI] [PubMed] [Google Scholar]
- 14.Hamdan FF et al. High Rate of Recurrent De Novo Mutations in Developmental and Epileptic Encephalopathies. Am. J. Hum. Genet. 101, 664–685 (2017). [DOI] [PMC free article] [PubMed] [Google Scholar]
- 15.Vuillaume M-L et al. A novel mutation in the transmembrane 6 domain of GABBR2 leads to a Rett-like phenotype. Ann. Neurol. 83, 437–439 (2018). [DOI] [PubMed] [Google Scholar]
- 16.Yoo Y et al. GABBR2 mutations determine phenotype in rett syndrome and epileptic encephalopathy. Ann. Neurol. 82, 466–478 (2017). [DOI] [PubMed] [Google Scholar]
- 17.Kniazeff J, Prézeau L, Rondard P, Pin J-P & Goudet C Dimers and beyond: The functional puzzles of class C GPCRs. Pharmacol. Ther. 130, 9–25 (2011). [DOI] [PubMed] [Google Scholar]
- 18.Stewart GD, Comps-Agrar L, Nørskov-Lauritsen LB, Pin JP & Kniazeff J Allosteric interactions between GABAB1 subunits control orthosteric binding sites occupancy within GABAB oligomers. Neuropharmacology 136, 92–101 (2018). [DOI] [PubMed] [Google Scholar]
- 19.White JH et al. Heterodimerization is required for the formation of a functional GABAB receptor. Nature 396, 679–82 (1998). [DOI] [PubMed] [Google Scholar]
- 20.Margeta-Mitrovic M, Jan YN, Jan LY A trafficking checkpoint controls GABAB receptor heterodimerization. Neuron 27, 97–106 (2000). [DOI] [PubMed] [Google Scholar]
- 21.Galvez T et al. Allosteric interactions between GB1 and GB2 subunits are required for optimal GABAB receptor function. EMBO J. 20, 2152–2159 (2001). [DOI] [PMC free article] [PubMed] [Google Scholar]
- 22.Robbins MJ et al. GABAB2 is essential for G-protein coupling of the GABAB receptor heterodimer. J. Neurosci. 21, 8043–8052 (2001). [DOI] [PMC free article] [PubMed] [Google Scholar]
- 23.Geng Y, Bush M, Mosyak L, Wang F & Fan QR Structural mechanism of ligand activation in human GABAB receptor. Nature 504, 254–259 (2013). [DOI] [PMC free article] [PubMed] [Google Scholar]
- 24.Pin J-P & Bettler B Organization and functions of mGlu and GABAB receptor complexes. Nature 540, 60–68 (2016). [DOI] [PubMed] [Google Scholar]
- 25.Howson W, Mistry J, Broekman M & Hills JM Biological activity of 3-aminopropyl (methyl) phosphinic acid, a potent and selective GABAB agonist with CNS activity. Bioorg. Med. Chem. Lett. 3, 515–518 (1993). [Google Scholar]
- 26.Frankowska M, Filip M & Przegaliński E Effects of GABAB receptor ligands in animal tests of depression and anxiety. Pharmacol. Rep. 59, 645–55 (2007). [PubMed] [Google Scholar]
- 27.Cryan JF et al. Behavioral characterization of the novel GABAB receptor-positive modulator GS39783 (N,N’-dicyclopentyl-2-methylsulfanyl-5-nitro-pyrimidine-4,6-diamine): anxiolytic-like activity without side effects associated with baclofen or benzodiazepines. J. Pharmacol. Exp. Ther. 310, 952–63 (2004). [DOI] [PubMed] [Google Scholar]
- 28.Koehl A et al. Structural insights into the activation of metabotropic glutamate receptors. Nature 566, 79–84 (2019). [DOI] [PMC free article] [PubMed] [Google Scholar]
- 29.Isberg V et al. Generic GPCR residue numbers - aligning topology maps while minding the gaps. Trends Pharmacol. Sci. 36, 22–31 (2015). [DOI] [PMC free article] [PubMed] [Google Scholar]
- 30.Xue L et al. Rearrangement of the transmembrane domain interfaces associated with the activation of a GPCR hetero-oligomer. Nat. Commun. 10, 2765 (2019). [DOI] [PMC free article] [PubMed] [Google Scholar]
- 31.Duthey B et al. A single subunit (GB2) is required for G-protein activation by the heterodimeric GABAB receptor. J. Biol. Chem. 277, 3236–3241 (2002). [DOI] [PMC free article] [PubMed] [Google Scholar]
- 32.Urwyler S et al. N,N’-Dicyclopentyl-2-methylsulfanyl-5-nitro-pyrimidine-4,6-diamine (GS39783) and structurally related compounds: novel allosteric enhancers of gamma-aminobutyric acidB receptor function. J. Pharmacol. Exp. Ther. 307, 322–30 (2003). [DOI] [PubMed] [Google Scholar]
- 33.Monnier C et al. Trans-activation between 7TM domains: implication in heterodimeric GABAB receptor activation. EMBO J. 30, 32–42 (2011). [DOI] [PMC free article] [PubMed] [Google Scholar]
- 34.Kniazeff J et al. Closed state of both binding domains of homodimeric mGlu receptors is required for full activity. Nat. Struct. Mol. Biol. 11, 706–13 (2004). [DOI] [PubMed] [Google Scholar]
- 35.Schorb M, Haberbosch I, Hagen WJH, Schwab Y & Mastronarde DN Software tools for automated transmission electron microscopy. Nat. Methods 16, 471–477 (2019). [DOI] [PMC free article] [PubMed] [Google Scholar]
- 36.Zheng SQ et al. MotionCor2: anisotropic correction of beam-induced motion for improved cryo-electron microscopy. Nat. Methods 14, 331–332 (2017). [DOI] [PMC free article] [PubMed] [Google Scholar]
- 37.Rohou A & Grigorieff N CTFFIND4: Fast and accurate defocus estimation from electron micrographs. J. Struct. Biol. 192, 216–21 (2015). [DOI] [PMC free article] [PubMed] [Google Scholar]
- 38.Zivanov J et al. New tools for automated high-resolution cryo-EM structure determination in RELION-3. Elife 7, e42166 (2018). [DOI] [PMC free article] [PubMed] [Google Scholar]
- 39.Punjani A, Rubinstein JL, Fleet DJ & Brubaker MA cryoSPARC: algorithms for rapid unsupervised cryo-EM structure determination. Nat. Methods 14, 290–296 (2017). [DOI] [PubMed] [Google Scholar]
- 40.Waterhouse A et al. SWISS-MODEL: homology modelling of protein structures and complexes. Nucleic Acids Res. 46, W296–W303 (2018). [DOI] [PMC free article] [PubMed] [Google Scholar]
- 41.Goddard TD et al. UCSF ChimeraX: Meeting modern challenges in visualization and analysis. Protein Sci. 27, 14–25 (2018). [DOI] [PMC free article] [PubMed] [Google Scholar]
- 42.Adams PD et al. PHENIX: a comprehensive Python-based system for macromolecular structure solution. Acta Crystallogr. D Biol. Crystallogr. 66, 213–21 (2010). [DOI] [PMC free article] [PubMed] [Google Scholar]
- 43.Emsley P & Cowtan K Coot: Model-building tools for molecular graphics. Acta Crystallogr. D Biol. Crystallogr. 60, 2126–2132 (2004). [DOI] [PubMed] [Google Scholar]
- 44.Abraham MJ et al. GROMACS: High performance molecular simulations through multi-level parallelism from laptops to supercomputers. SoftwareX 1-2, 19–25 (2015). [Google Scholar]
- 45.Huang J & Mackerell AD CHARMM36 all-atom additive protein force field: Validation based on comparison to NMR data. J. Comput. Chem. 34, 2135–2145 (2013). [DOI] [PMC free article] [PubMed] [Google Scholar]
- 46.Abagyan R, Totrov M & Kuznetsov D ICM: A new method for protein modeling and design: Applications to docking and structure prediction from the distorted native conformation. J. Comput. Chem. 15, 488–506 (1994). [Google Scholar]
- 47.Jo S, Kim T, Iyer VG & Im W CHARMM-GUI: A web-based graphical user interface for CHARMM. J. Comput. Chem. 29, 1859–1865 (2008). [DOI] [PubMed] [Google Scholar]
- 48.Lomize MA, Pogozheva ID, Joo H, Mosberg HI & Lomize AL OPM database and PPM web server: resources for positioning of proteins in membranes. Nucleic Acids Res. 40, D370–6 (2012). [DOI] [PMC free article] [PubMed] [Google Scholar]
- 49.Kim S et al. CHARMM-GUI ligand reader and modeler for CHARMM force field generation of small molecules. J. Comput. Chem. 38, 1879–1886 (2017). [DOI] [PMC free article] [PubMed] [Google Scholar]
- 50.Michaud-Agrawal N, Denning EJ, Woolf TB & Beckstein O MDAnalysis: A toolkit for the analysis of molecular dynamics simulations. J. Comput. Chem. 32, 2319–2327 (2011). [DOI] [PMC free article] [PubMed] [Google Scholar]
- 51.Bakan A, Meireles LM & Bahar I ProDy: Protein dynamics inferred from theory and experiments. Bioinformatics 27, 1575–1577 (2011). [DOI] [PMC free article] [PubMed] [Google Scholar]
- 52.Gur M, Zomot E & Bahar I Global motions exhibited by proteins in micro- to milliseconds simulations concur with anisotropic network model predictions. J. Chem. Phys. 139, 121912 (2013). [DOI] [PMC free article] [PubMed] [Google Scholar]
- 53.Krissinel E Stock-based detection of protein oligomeric states in jsPISA. Nucleic Acids Res. 43, W314–9 (2015). [DOI] [PMC free article] [PubMed] [Google Scholar]
Associated Data
This section collects any data citations, data availability statements, or supplementary materials included in this article.
Supplementary Materials
Data Availability Statement
The cryo-EM density maps and corresponding coordinates have been deposited in the Electron Microscopy Data Bank (EMDB) and the Protein Data Bank (PDB), respectively, under the following accession codes: EMD-20822 and 6UO8 (GABAB bound to SKF97541 and GS39783), EMD-20823 and 6UO9 (GABAB bound to SKF97541, int-2 state), EMD-20824 and 6UOA (GABAB bound to SKF97541, int-1 state), and EMD-21219 and 6VJM (GABAB in the apo state).
Figs. 2e, f, 3e, f and Extended Data Figs. 1a–d, Extended Data Fig. 8, 9 have associated raw data. Supplementary information file contains the uncropped gel shown in Extended Data Fig. 1f. All other data are available from the authors on reasonable request.


