

Abstract
Background:
Deep learning diagnostic algorithms are proving comparable results with human experts in a wide variety of tasks, and they still require a huge amount of well-annotated data for training, which is often non affordable. Metric learning techniques have allowed a reduction in the required annotated data allowing few-shot learning over deep learning architectures.
Aims and Objectives:
In this work, we analyze the state-of-the-art loss functions such as triplet loss, contrastive loss, and multi-class N-pair loss for the visual embedding extraction of hematoxylin and eosin (H&E) microscopy images and we propose a novel constellation loss function that takes advantage of the visual distances of the embeddings of the negative samples and thus, performing a regularization that increases the quality of the extracted embeddings.
Materials and Methods:
To this end, we employed the public H&E imaging dataset from the University Medical Center Mannheim (Germany) that contains tissue samples from low-grade and high-grade primary tumors of digitalized colorectal cancer tissue slides. These samples are divided into eight different textures (1. tumour epithelium, 2. simple stroma, 3. complex stroma, 4. immune cells, 5. debris and mucus, 6. mucosal glands, 7. adipose tissue and 8. background,). The dataset was divided randomly into train and test splits and the training split was used to train a classifier to distinguish among the different textures with just 20 training images. The process was repeated 10 times for each loss function. Performance was compared both for cluster compactness and for classification accuracy on separating the aforementioned textures.
Results:
Our results show that the proposed loss function outperforms the other methods by obtaining more compact clusters (Davis-Boulding: 1.41 ± 0.08, Silhouette: 0.37 ± 0.02) and better classification capabilities (accuracy: 85.0 ± 0.6) over H and E microscopy images. We demonstrate that the proposed constellation loss can be successfully used in the medical domain in situations of data scarcity.
Keywords: Few-shot learning, histopathology, metric learning
INTRODUCTION
Distance metric learning approaches[1,2,3] work by learning embedding representations that keep close together for similar data points while maintaining them far for dissimilar data points. Among distance metric learning applications, we can find face recognition,[4] signature verification,[5] authorship verification,[6] few-shot learning,[7,8] plant recognition,[9] and visual similarity for product design[10] among others. With the popularization of convolutional neural networks,[11,12] deep metric learning has been deeply analyzed in the last years. Deep metric learning[6,7,13,14,15,16] has proven to be effective at learning nonlinear embeddings of the data outperforming existing classical methods. Normally, specific network architectures are trained to minimize a Euclidean-based loss function where a nonlinear embedding representation is learned to bond together embeddings from similar classes while taking apart embeddings of different classes. The definition of appropriate loss functions is crucial for fast convergence and optimal global minimum search[7] and they have received a lot of attention in the last years. In this sense, losses such as contrastive loss function[17] focus same-class or different-class pairs are normally used. Triplet loss function[2,18] extended contrastive loss by considering a query sample and two additional samples (one positive and one negative). This triplet loss simultaneously enlarges the distances between the embeddings of the query and negative sample while reducing the distance between the positive and query samples. However, these methods suffer from slow convergence and poor local optima[16] as, at each update, embeddings are only optimized against one negative class. This was partially solved by the incorporation of the multi-class N-pair loss[16] that generalizes triplet loss by simultaneously optimizing against N-1 negative samples from different classes instead of a single negative class yielding to better performance and faster convergence. However, multi-class N-pair loss functions still ignore the distances among the different negative classes among them and thus, not assuring optimization among the different negative class embeddings. In this work, we extend multiclass-N-pair loss with the proposed constellation loss metric, where the distances among all class combinations are simultaneously learned. Figure 1 graphically shows the interaction among the different class samples distances during a single gradient descent step for the analyzed losses and the newly proposed constellation loss.
Figure 1.
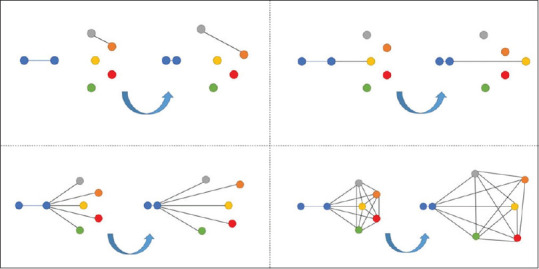
Visual representation of a gradient descent step for each of the compared losses: Contrastive loss,[17] triplet loss,[2] multi-class N-pair loss[16] and the proposed Constellation loss. Each color represents a different class sample
In this work, we validate experimentally that constellation loss outperforms other metrics for class embedding tasks resulting in higher class classification performance and better cluster separability metrics such as Silhouete[19] and Davis-Boulding index.[20] We also remove the need of using specific supporting architectures such as Siamese Neural Networks[7] for learning the embedding representations. To this end, we propose the use of smart batch selection dealing with the same functional cost. This improves both multi-class scalability and reducing training memory needs that occur when using Siamese approaches.
Discriminative loss functions for distance metric learning
Conventionally, most of the image classification networks such as AlexNet,[10] VGGNet,[21] GoogleNet,[22] or ResNet[18] adopted cross-entropy based softmax loss function to solve classical classification problems. However, discriminative metric learning loss functions have better generalization ability[23] and have received more attention for feature learning purposes in the latest years not only for verification problems[2,4] but also for few-shot learning[7,8] as they overcome learning capabilities of traditional classification approaches under the small number of training images conditions. This is achieved by learning an image embedding fi from an image xi. This embedding represents a class-representative vector, that is, a vector that contains the most important features associated with the corresponding class of the image. This is commonly performed by Euclidean distance-based loss functions. These loss functions conceptually constrain the learned embeddings fi to fulfil the condition of presenting distance 0 among elements of the same class and greater distances among elements from different classes. The Euclidean-distance-based loss functions like contrastive loss[17] measure pairs of samples. This was extended by triplet loss[2] by comparing triplets with a positive and a negative sample. Multiclass-N-pair loss objective function[16] has focused on improving previous distance metric loss functions by generalizing triplet loss. First, it allows joint comparison among more than one negative example, concretely, N-1 negative examples, and second, an efficient batch construction strategy was introduced to reduce computation. This loss function has demonstrated superiority over triplet loss as well as other metric learning functions. Finally, we propose the constellation loss where distances among all negative classes among them are taken into account simultaneously.
The different losses are detailed below.
Contrastive loss
Contrastive loss (1) only focuses on positive and negative pairs. Positive pairs are composed by same-class images and negative ones by distinct-class pairs. Formally, the network transforms the pair of input images x1, i and x2, i into f1, I, and f2, i embedding vectors. The labels are either yi= 0 for positive pairs or yi= 1 for the negative pairs.

where m is the margin, usually set to 1 and N is the batch size. Intuitively, this loss penalizes when a positive pair is far away or a negative pair too close. Therefore, in an optimal case, positives are nearby 0.0 and negatives close to 1.0.
Triplet loss
Triplet loss (2) goes one step further by considering positive and negative pairs at the same time. This is done by setting an anchor, from which a distance will be calculated to a sample of the same class (positive) and a sample of a different class (negative). Hence, the set of input images is a triplet of an anchor, a positive and a negative class {xai,xpi,xni} and their correspondent {fai,fpi,fni} embedding vectors are. no label is needed.
where α is a parameter to avoid convergence to trivial solutions and N is the batch size. The aim of this loss is to maximize the distance between the anchor and the negative while minimizing the distance between the anchor and positive. Nonetheless, there is no gain when  and for that reason, hard-triplet mining is commonly applied. This technique considers only hard or semi-hard triplets, that is, using for computation only the triplets that give a positive loss. This way, it forces the network to try harder and it improves convergence.
Multiclass-N-pair objective loss
Multi-class-N-pair loss objective is a generalization of triplet loss that incorporates at each optimization update the other negative classes that the triplet loss does not consider. This allows joint comparison among more than one negative example at each update while reducing the computational burden of evaluating deep embedding vectors. Hence, when having N classes, the distances to the N-1 negative classes are also considered. When only one negative sample is used for calculation (N = 1), this loss in comparable to triplet loss.

where refers fato the anchor, fa ' refers to the transpose of the ith embedding vector and fip to an embedding of a positive pair.
Constellation loss
The proposed loss is a similar formulation to multiclass-N-pair loss, but it also includes the distances among the different negative samples among themselves, as depicted in Figure 1. The hyperparameter K sets the number of negative samples we want to incorporate in the formula, this way, considering more negative terms than the usual triplet loss. Even though increasing K parameter means a bigger computational effort, we prove for our dataset that at some point, the fact of increasing K does not affect much the result. This is due to the randomness in the choice of each term, which can be composed of several distinct negative values. Therefore, there is no need for a high K value to improve triplet loss or multiclass-N-pair loss. The main difference is that multiclass-N-pair-loss subtracts dot products of same class pairs whereas constellation loss does something like triplet loss by subtracting a dot product of an anchor and negative embedding; and a dot product of an anchor and positive embedding.
where fa refers to the anchor embedding, fp to the positive embedding and fn to negative embeddings.
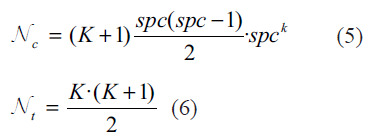
The number of taken combinations is defined by equation (5) where spc refers to the samples per class present in input batch. The maximum number of combinations we can get is defined by (6) referring. Nt to the number of exponential terms present in each constellation. For a small number of classes, K = N-1 makes see, but when the number of classes is significantly large, Nc and Nt become computationally expensive. Due to this problem, we need to find an optimal choice of K, when the results are good and computationally feasible. Also, a smaller K allows more same-class pairs on a batch without depleting computing resources. Even if we just have one sample per class, one-shot learning, we can assume that augmented pairs are distinct images of the same class.
Deep neural network for embedding learning
One way to perform deep embedding extraction is by using a siamese neural network architecture[7,6] in a similar way as done in.[8] These networks employ a twin network architecture where their weights are tied and joined by a loss function that is computed in the top. However, some loss functions like triplet loss are already implemented for single network architecture. This network is normally selected from the state-of-the-art CNN architectures such as VGGNet,[21] that was successfully used by,[7,8] Inception[24] or ResNet[25] among others. In our experiments, we have chosen Resnet50 classification architecture, where the last layer is replaced as suggested by[16] by a global average pooling layer and a 128-neuron layer as an embedding layer, fi, that acts as a low-dimensional representation of the input images. The embedding layer has a sigmoid activation and it is L2 normalized in the case of triplet and constellation loss. L2 normalization makes the training process more stable for these loss functions. There is no need for L2 normalization when training with multiclass-N-pair objective loss as it already incorporates in the loss. After loss optimization procedure, the trained base network is able to extract a embedding fi from an image xi that is able to keep similar samples together and dissimilar one apart.
Validation
In this paper, we validate the proposed loss function on two clustering metrics and classification accuracy. The proposed backbone network (Resnet50) is trained by means of any of the previous loss functions in order to learn the image embeddings fi. This embedding vector is a low-dimensional representation of Xi that minimizes its correspondent loss function and thus, are designed to estimate the distance among classes. In order to validate the suitability of these embeddings we analyze, the quality of the class clusters generated by the embedding vector and also the performance of a classification task that can be achieved by the learned embeddings. This validation procedure is illustrated in Figure 2.
Figure 2.
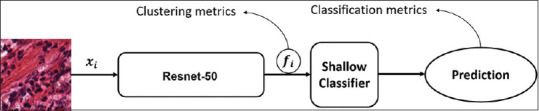
Illustration of the validation procedure for the extracted embeddings using a shallow classifier
Clustering metrics
We analyze the quality of the class clusters that are generated by the embedding vectors sets to measure the quality of the generated clusters. As the main goal of the network is to create better, these metrics show how well are the test embeddings grouped in clusters. Two specific metrics were selected: Davis-Boulding index[20] is a metric that evaluates clustering quality. The smaller the value, the better the result. The index uses quantities and features inherent to the dataset and its drawback is that good value does not imply the best information retrieval. The Silhouette score[19] is a measure of how similar an object is to its own cluster compared to other clusters. The value of this metric ranges from-1-1 and the closest to 1, the better the result.
Classification metrics
We also evaluate the classification accuracy that a machine learning model can obtain by using the learned embeddings. To this end, we select k-nearest neighbors as the simpler shallow classifier to predict the class associated with each embedding. First, images go through the network and it outputs the embeddings of all the images, both training and test sets. Then, a k-nearest neighbour classifier is used to predict the classes of the test embeddings.
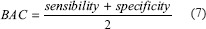
We selected the balanced accuracy metric (7) for performance evaluation as it is a single and accurate metric that eliminates the effect of unbalanced datasets normally causes to the accuracy metric.
METHODS
We assess the performance of the proposed constellation loss for visual class embedding extraction. We validate the capability of the tested loss functions to extract appropriate embeddings for the entrusted visual task of histology image classification.
Dataset
Public dataset[26] from the University Medical Center Mannheim (Germany). Contains tissue samples obtained from low-grade and high-grade primary tumors of digitalized colorectal cancer tissue slides. The database is divided into eight different types of textures that are present on the tumors samples: (1) tumor epithelium, (2) simple stroma, (3) complex stroma, (4) immune cells, (5) debris and mucus, (6) mucosal glands, (7) adipose tissue and (8) background, as depicted in Figure 3. There are 625 image samples per class, producing a total dataset of 5000 image tiles of dimension 150 px × 150 px (74 μm × 74 μm).
Figure 3.

Sample images from the dataset. First row: Tumour epithelium, simple stroma, complex stroma, immune cells. Second row: debris, mucosa, adipose and empty tile samples are depicted
Computing infrastructure
The experiments were run on a Gigabyte GeForce GTX Titan X 12GB GDDR5 GPU. The GPU is installed in a local server that we access by an SSH client. We used an Anaconda distribution and the main libraries we used are Keras, Tensorflow, and Scikit-Learn. Keras was used for the main architecture and Tensorflow for the loss functions. Scikit-Learn was very helpful for machine learning models like k-nearest neighbors, and also for BAC, David-Bouldin index and Silhouette metrics.
Training
Our main goal is to evaluate the capabilities of the different loss functions to embed the image description. To validate this, we train the deep metric learning architecture detailed in section 3 for the different losses to obtain a network capable of extracting the embedding vector, fi, from an input signal. As a baseline, we trained a classical classification Resnet-50 network by learning with a softmax loss function. The same Resnet-50 architecture is trained with different loss functions with the necessary modifications.
All the experiments were run for 30 epochs and optimized with Adam with a learning rate value 0.0001. A very simple generator was used in order to feed the images to the network. The size of the image is not modified during this process, and no augmentation was used, as the aim of the loss function we are working with is to train on datasets that have not enough images per class. The batch size was set to 40 for baseline, triplet, and multiclass-N-pair. In the case of the constellation, we tried different setups by changing k but we kept spcK< 100 to avoid dealing with a very large computational effort.
We trained each network on 20 samples per class. Training was repeated ten times and each time the samples selected was different, but always maintaining same splits for the different networks for comparison purposes. The test set is the same for all the experiments. We calculated the metrics for each split and gathered them in Table 1 by averaging over the splits. This way, we show the mean value and the standard deviation.
Table 1.
Accuracy, silhouette and Davis-Bouldin metrics of the different experiments 20 samples per class
| Loss | Metrics | ||
|---|---|---|---|
| BAC | Silhouette | Davis-Bouldin | |
| Imagenet | 78.1±0.2 | 0.12±0.00 | 2.97±0.00 |
| Triplet | 84.6±1.0 | 0.23±0.01 | 1.99±0.10 |
| Npairs | 84.6±0.9 | 0.35±0.01 | 1.48±0.04 |
| Cn*3 | 85.0±0.6 | 0.37±0.02 | 1.41±0.08 |
| Cn*5 | 84.4±0.8 | 0.37±0.02 | 1.43±0.09 |
| Cn*7 | 84.5±0.3 | 0.37±0.02 | 1.43±0.09 |
BAC: Balanced accuracy
RESULTS
Table 1 shows the results obtained by the different approaches. Balanced accuracy (BAC) metric measures the classification performance of the method, whereas Silhouette and Davis-Boulding metrics measure their clustering capabilities.
To serve as a baseline method, we employ the embeddings extracted by resnet50 pretrained over the image dataset following by minimizing the categorical cross-entropy function in a similar way than in.[8] The triplet and the Multi-class-N-pair and the proposed constellation loss are compared. Constellation loss is set with three different K: 3,5 and 7.
In addition, a t-distributed Stochastic Neighbor Embedding (t-SNE)[27] visualization method is used to project the generated multidimensional clusters into a two-dimensional graph. This methodology is capable of maintaining the cluster distances that are present in the high dimensional space when these are projected into the two-dimensional space, and thus, the differences among clusters can be visualized. Figure 4 depicts the clusters generated by the different classes.
Figure 4.

Comparison of the clustering capabilities. The figure shows a two-dimensional t-distributed Stochastic Neighbor Embedding[27] visualization of the embedding vectors in the test set for the triplet, N-pairs and the proposed constellation loss
DISCUSSION
Table 1 shows that constellation loss scored better results on clustering metrics beating both triplets and multiclass-npairs in all cases and that it also surpassed or equaled the other methods on classification performance (BAC).
If we analyze Figure 4 where the embeddings are shown in a reduced two-dimensional space,[27] we clearly see more compact clusters in the case of multiclass N-pair-loss and constellation loss than in the other losses in concordance with the obtained silhouette and Davis-Bouldin metrics.
In Figure 5, we depict the t-SNE visualization for the constellation loss by including sampled images of that class. We can appreciate that different clusters have been created. For example, the adipose tissue, which is characterized by large cells with empty space, are clustered together in a very compact cluster. This adipose cluster is separated but not far from the cluster representing the empty classes where not tissue is present as it presents some similarity (empty space) among them. Healthy mucosa and tumoral mucosa were separated into two well defined and separated clusters. As both healthy and tumoral tissues are of the mucosa, we can appreciate that the clusters are close together. Besides this, we can appreciate a spurious image from tumoral tissue that is close to the healthy mucosa cluster, representing probably an incipient tumor or mixed tissue. Lymphoid tissue, debris, and stroma are also well characterized into three differentiated clusters, and the complex class that represents various tissue types at the same time is represented as an equidistant center class from all the others. This shows the capabilities of constellation loss not only to generate appropriate clusters for the different classes but to allow extracting meaningful information over the visual similarity and clinical relationship among the different classes.
Figure 5.
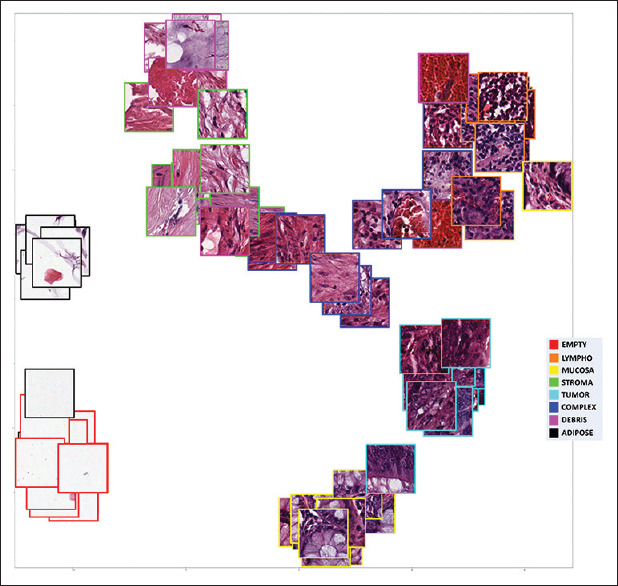
Image based t-distributed Stochastic Neighbor Embedding[27] visualization of test image embeddings extracted with the model trained with constellation loss
When analyzing the balanced accuracy obtained by the different methods, we appreciate that all metric learning-based methods outperform the results obtained by classical fine-tuning based deep learning methods. It is noteworthy to explain the importance of the K value for the constellation loss as it will depend on the dataset characteristics and on the number of classes, and it is a hyperparameter that has to be taken into account when setting constellation loss applications.
CONCLUSIONS
In this work, we have compared the performance of different metric learning losses for extracting discriminative embeddings under deep metric learning approach over histology images. Our proposed constellation loss metric considers the distances among all class combinations that are simultaneously learned. The extracted embeddings have been validated for image classification tasks over the selected dataset, showing that our loss function overperforms the other methods by obtaining more compact clusters. This better representation of the classes allows machine learning models such as k-nearest neighbors achieve better results in classification especially when showing images from classes not previously seen during the training process. Moreover, we showed that constellation loss surpasses Multiclass-N-pair loss in classification accuracy by using a similar mathematical formulation. This demonstrates that few-shot techniques can be successfully used in the medical domain for learning in situations of data scarcity.
Financial support and Source Code
Source code is available at: https://git.code.tecnalia.com/comvis_public/piccolo/constellation_loss/.
Conflicts of interest
There are no conflicts of interest.
Acknowledgments
This work was partially supported by PICCOLO project. This project has received funding from the European Union's Horizon2020 Research and Innovation Programme under grant agreement No. 732111. The sole responsibility of this publication lies with the author. The European Union is not responsible for any use that may be made of the information contained therein.
Footnotes
Available FREE in open access from: http://www.jpathinformatics.org/text.asp?2020/11/1/38/301600
REFERENCES
- 1.Xing EP, Jordan MI, Russell SJ, Ng AY. Advances in Neural Information Processing Systems. Cambridge, MA: MIT Press; 2003. Distance metric learning with application to clustering with side.information; pp. 521–8. [Google Scholar]
- 2.Weinberger KQ, Blitzer J, Saul LK. Advances in Neural Information Processing Systems. Corvalis: Oregon; 2006. Distance metric learning for large margin nearest neighbor classification; pp. 1473–80. [Google Scholar]
- 3.Davis JV, Kulis B, Jain P, Sra S, Dhillon IS. Proceedings of the 24th International Conference on Machine Learning. Corvalis, Oregon: ACM Press; 2007. Information-theoretic metric learning; pp. 209–16. [Google Scholar]
- 4.Liu W, Wen Y, Yu Z, Li M, Raj B, Song L. The IEEE Conference on Computer Vision and Pattern Recognition (CVPR) NYC: IEEE; 2017. Sphereface: Deep hypersphere embedding for face recognition; p. 1. [Google Scholar]
- 5.Bromley J, Guyon I, LeCun Y, Säckinger E, Shah R. Advances in Neural Information Processing Systems. Corvalis: Oregon; 1997. Signature verification using a" siamese" time delay neural network; pp. 737–44. [Google Scholar]
- 6.Du W, Fang M, Shen M. Tech Rep. Stanford University; 2017. Siamese convolutional neural networks for authorship verification. [Google Scholar]
- 7.Koch G, Zemel R, Salakhutdinov R. ICML Deep Learning Workshop. France: Lille; 2015. Siamese neural networks for one-shot image recognition; p. 2. [Google Scholar]
- 8.Medela A, Picon A, Saratxaga CL, Belar O, Cabezon V, Cicchi R, et al. IEEE International Symposium on Biomedical Imaging. Venice: IEEE; 2019. Few shot learning in histopathological images: Reducing the need of labeled data on biological datasets. [Google Scholar]
- 9.Argüeso D, Picon A, Irusta U, Medela A, SanEmeterio MG, Bereciartua A, et al. Few-shot learning approach for plant disease classification using images taken in the field. Comp Electron Agriculture. 2020;175:105542. [Google Scholar]
- 10.Bell S, Bala K. Learning visual similarity for product design with convolutional neural networks. ACM Trans Graphics. 2015;34:98. [Google Scholar]
- 11.Krizhevsky A, Sutskever I, Hinton GE. Advances in Neural Information Processing Systems. Cambridge, MA: MIT Press; 2012. Imagenet classification with deep convolutional neural networks; pp. 1097–105. [Google Scholar]
- 12.Simonyan K, Zisserman A. Very deep convolutional networks for large-scale image recognition. arXiv preprint arXiv. 2014;1409:1556. [Google Scholar]
- 13.Hoffer E, Ailon N. International Workshop on Similarity-Based Pattern Recognition. Copenhagen, Denmark: Springer; 2015. Deep metric learning using triplet network; pp. 84–92. [Google Scholar]
- 14.Yi D, Lei Z, Liao S, Li SZ. 2014 22nd International Conference on Pattern Recognition. Stockholm: IEEE; 2014. Deep metric learning for person re-identification; pp. 34–9. [Google Scholar]
- 15.Hu J, Lu J, Tan YP. Proceedings of the IEEE Conference on Computer Vision and Pattern Recognition. Colombus, Ohio: IEEE; 2014. Discriminative deep metric learning for face verification in the wild; pp. 1875–82. [Google Scholar]
- 16.Sohn K. Advances in Neural Information Processing Systems. Cambridge, MA: MITPress; 2016. Improved deep metric learning with multi-class n-pair loss objective; pp. 1857–65. [Google Scholar]
- 17.Chopra S, Hadsell R, LeCun Y. In 2005 IEEE Computer Society Conference on Computer Vision and Pattern Recognition (CVPR'05) Vol. 1. IEEE; 2015. Learning a Similarity Metric Discriminatively, with Application to Face Verification; pp. 539–546. [Google Scholar]
- 18.Schroff F, Kalenichenko D, Philbin J. Facenet: A Unified Embedding for Face Recognition and Clustering CoRR, abs/150303832. 2015 [Google Scholar]
- 19.Rousseeuw P. Silhouettes: A Graphical aid to the Interpretation and Validation of Cluster Analysis. 1987 [Google Scholar]
- 20.Davies DL, Bouldin DW. A Cluster Separation Measure. IEEE Transactions on Pattern Analysis and Machine Intelligence, no.2. 1979:224–7. [PubMed] [Google Scholar]
- 21.Simonyan K, Zisserman A. Very Deep Convolutional Networks for Large-Scale Image Recognition. CoRR, abs/14091556. 2014 [Google Scholar]
- 22.Szegedy C, Liu W, Jia Y, Sermanet P, Reed SE, Anguelov D, et al. Going Deeper with Convolutions CoRR, abs/14094842. 2014 [Google Scholar]
- 23.Cheng G, Yang C, Yao X, Guo L, Han J. When deep learning meets metric learning: Remote sensing image scene classification via learning discriminative cnns. IEEE Trans Geoscience Remote Sensing. 2018;56:2811–21. [Google Scholar]
- 24.Szegedy C, Vanhoucke V, Ioffe S, Shlens J, Wojna Z. Rethinking the Inception Architecture for Computer Vision. CoRR, abs/1512. 2015 [Google Scholar]
- 25.He K, Zhang X, Ren S, Sun J. Proceedings of the IEEE Conference on Computer Vision and Pattern Recognition. 2016. Deep residual learning for image recognition; pp. 770–8. [Google Scholar]
- 26.Kather JN, Weis CA, Bianconi F, Melchers SM, Schad Timo Gaiser LR, Marx A, et al. Multi-class texture analysis in colorectal cancer histology. Sci Rep. 2016;6:27988. doi: 10.1038/srep27988. [DOI] [PMC free article] [PubMed] [Google Scholar]
- 27.Hinton GE, Salakhutdinov RR. “Re-ducing the dimensionality of data with neural net-works. Science. 2006;313:504–7. doi: 10.1126/science.1127647. [DOI] [PubMed] [Google Scholar]