Fig. 5.
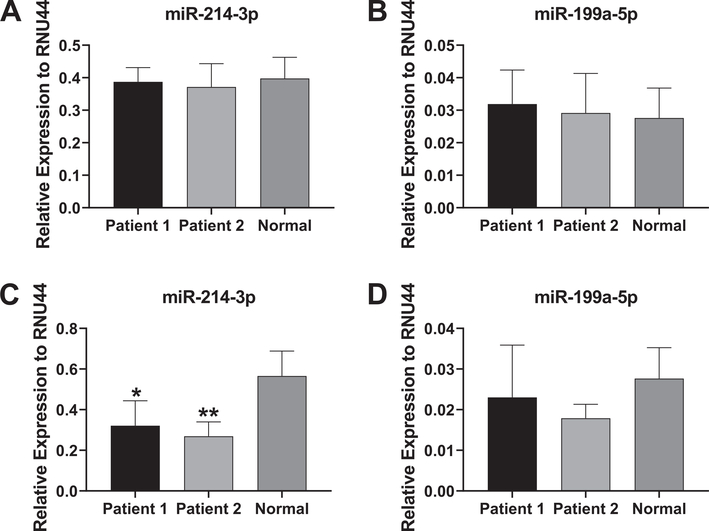
Expression of miR-214 and miR-199a in patient and control fibroblasts. A, B. Relative levels of the functional miR-214–3p and miR-199a-5p strands in the two patient sample fibroblasts and control, non-diseased fibroblasts at baseline. C, D. Relative levels of miR-214–3p and miR-199a-5p in patient or control fibroblasts following 3 days of osteogenic induction. miRNA levels are expressed as relative abundance to RNU44. Experiments were carried out four times and a Student’s t-test was used to determine statistical significance in miRNA expression between the control sample and each of the patient sample (*p < 0.05; **p < 0.01).

