

Abstract
Live imaging is critical to determining the dynamics and spatial interactions of cells within the tissue environment. In the lung, this has proven to be difficult due to the motion incurred by ventilation and cardiac contractions. Previously, Thornton et al 2012 (Curr. Protoc. Cytom. 60:12.28.1–12.28.12) reported protocols for imaging ex vivo live lung slices and the intact mouse lung. Here, we update those protocols by adding new methodologies, approaches for quantitative image analysis and description of new areas of potential application. In this updated chapter, sections with no new updates were preserved in their original form reported by Thornton et al 2012.
Keywords: intravital imaging, lung imaging, lung slices, two-photon microscopy
INTRODUCTION
A majority of the analytical methods used to study experimental systems are end-point assays that provide a snap-shot view of biological processes. While much useful information can be gleaned from these assays, there is often a need to visualize the dynamics and spatial interactions of cells and their environment in real time. This data can only be obtained from live imaging, and here we present the basic protocols for live imaging in the mouse lung.
Basic Protocol 1 details the methods needed to image live lung slices from the mouse. This protocol has the advantages of superior image stabilization and imaging depth, increased imaging durability, and ready access to the lung parenchyma for immunostaining of cells. Basic Protocol 2 provides the methods for intravital imaging in the mouse lung. This protocol relies on image stabilization with a thoracic suction window, and is ideal for time-lapsed imaging of the lung microcirculation, alveolar spaces and blood cell trafficking. Both of the protocols require familiarity with mouse surgery and advanced microscopy.
The current chapter updates the chapter published by Thornton EE, Krummel MF, and Looney MR in 2012 (Curr. Protoc. Cytom. 60:12.28.1–12.28.12).
NOTE: All protocols using live animals must first be reviewed and approved by an Institutional Animal Care and Use Committee (IACUC) and must follow officially approved procedures for the care and use of laboratory animals.
BASIC PROTOCOL 1. LIVE IMAGING OF LUNG SLICES
The use of lung slices provides access to the lung parenchyma as well as airways of varying sizes. Previous studies have used this method to examine airway smooth muscle contraction (Bergner & Sanderson, 2002), but it is also a valuable tool to understand immune reactions that contribute to ongoing immune responses. By choosing sections of varying depth, one can obtain a real-time picture of cellular behavior in most compartments in the lung. The tradeoff for access to the deepest parts of the tissue is that blood and lymph flow to and from the organ is absent. Therefore, findings using live imaging of lung slices should be verified as much as possible with the use of lung intravital imaging (Basic Protocol 2).
Materials
Transgenic mouse of interest
Anesthetic: e.g., 2.5% (w/v) Avertin
70% (v/v) ethanol
2% (w/v) low-melting-temperature agarose (see recipe)
Phosphate-buffered saline (PBS; appendix 2a), 4°C
Vetbond (3M)
RPMI 1640 medium without phenol red
Dissection board
Dissection instruments
Suture: 3–0 silk
Plastic sheath from 18-G catheter (Exel Safelet Cath, Fisher Scientific)
1-ml syringe without a needle
Vibratome
Plastic cover slips (Fisher)
Microscope
Perfusion system: peristaltic pump, in-line heater, and heated imaging chamber (Warner Instruments)
Additional reagents and equipment for intraperitoneal injection of mice (Donovan and Brown, 2006)
Protocol step and annotations
Preparation of lungs for section live imaging
-
1
Inject the mouse i.p. (Donovan & Brown, 2006) with a lethal overdose of an anesthetic permitted by IACUC (e.g., 1 ml of 2.5% Avertin). Wait for the mouse to stop breathing.
Note: Cervical dislocation and carbon dioxide euthanasia can detrimentally affect lung viability and should be avoided.
-
2
Sterilize the mouse with 70% ethanol and immobilize on a dissection board.
-
3
Open the peritoneum and cut the descending aorta so that blood pools in the abdomen and not the chest cavity.
-
4
Open the chest cavity by cutting up through the diaphragm. Perform a sternotomy by cutting from the xyphoid process through the top of the sternum. Continue to cut through the skin and connective tissue over the trachea.
Note: Care must be taken to not damage the lungs or to cut through the trachea.
-
5
Expose the trachea and separate it from the surrounding connective tissue, being careful not to cut the trachea itself. Thread the 3–0 suture material under the trachea and tie in a loose knot.
-
6
Snip a small opening in the exposed trachea parallel to the cartilaginous rings, as close to the larynx as possible, taking care not to cut completely through. Cut the tip of the plastic sheath from an 18-G catheter at a 45° angle to form a beveled end. Gently insert the catheter sheath into the trachea. Tighten the suture material around the trachea to secure the catheter in place (Fig. 1A).
Note: Insert the catheter only 2 to 3 mm. You should be able to see the end of the catheter through the trachea. By inserting too deeply, you may traumatize the carina or only inflate one side of the lungs.
-
7
Using a syringe, without a needle, containing 1 ml of 2% agarose (taken directly from a bottle in a constant 37°C temperature bath), slowly instill the agarose through the catheter into the lungs.
-
8
Once the lungs are fully inflated, pour approximately 50 ml of PBS (4°C) over the inflated lungs. Allow the lungs to cool for 1 min to set the agarose. Remove the catheter sheath and tighten the suture material around the trachea to prevent any non-solidified agarose from leaking.
-
9
Holding onto the trachea with forceps directly above the suture, cut through the trachea. Gently pull the trachea up, pulling the lungs out of the chest cavity. Cut away the connective tissue and esophagus until the lungs are separated from the mouse (Fig. 1B).
-
10
Place lungs in cool RPMI medium without phenol red for transport (between 4°C and room temperature). Do not place lungs on ice.
Figure. 1.
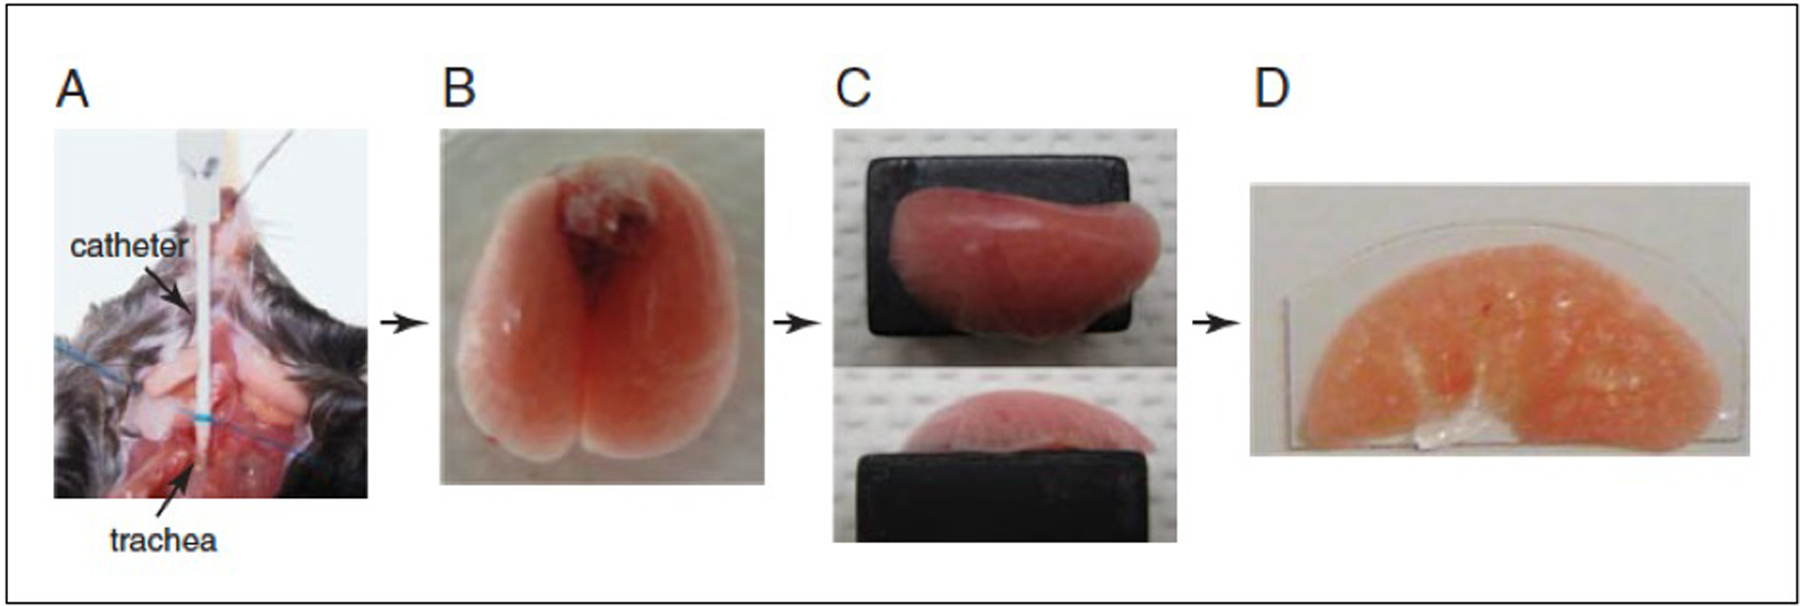
Protocol for preparing lungs for slice imaging. (A) Catheter inserted in the trachea is stabilized with suture. (B) Lungs filled with 1 ml low melting temperature agarose. (C) Left lobe mounted on a Vibtratome block with Vetbond. (D) 300-μm section immobilized on a plastic coverslip.
Vibratome sectioning and mounting for live imaging
-
11
Fill the Vibratome half with room temperature and half with 4°C PBS to achieve a temperature of ~16°C.
-
12
Separate the left lobe from the other lobes/heart/thymus by gently separating it with your fingers and cutting the mainstem bronchus.
-
13
Place the lobe on a Kimwipe and pat gently until the surface is almost dry.
-
14
Mount the lobe bronchus–side-down with Vetbond so that the largest surface area possible is in contact with the Vibratome slug (Fig. 1C).
-
15
Section the lung into 300-μm slices.
-
16
Mount slices on plastic cover slips cut to the size of the imaging chamber, using Vetbond (Fig. 1D).
-
17
Maintain slices at room temperature in RPMI without phenol red, until imaging.
Imaging lung sections
-
18
Set up perfusion system (consisting of a peristaltic pump, in-line heater, heated stage, and vacuum suction) on the microscope with oxygenated RPMI without phenol red so that the medium in the chamber measures as close to 37°C without going over.
Note: Warner Instruments sells all of the components for heated perfusion systems, which can be adapted to most microscope set-ups.
-
19
Place the section of interest into the chamber and allow it to equilibrate to the chamber temperature (about 5 min).
-
20
Use the microscope eyepieces and magnification adjustment to locate the surface of the lung section. For two-photon microscopy, adjust laser power, excitation laser wavelength, photomultiplier tubes voltage/gain/offset and appropriate filter cubes to optimally excite and capture images for the chosen fluorophore (Fig. 2).
Figure. 2.

Motility of c-fms-EGFP+ cells in lung sections. (A) Actin-CFP c-fms-EGFP lung slice shows motility of cells within the tissue with overlaid tracks. (B) Quantification of c-fms-EGFP cells shows increased motility near the airway.
SUPPORT PROTOCOL 1. STAINING LUNG SECTIONS WITH FLUORESCENT ANTIBODIES
Despite the large number of available fluorescently-labeled transgenic mice (see Table 3), one marker is often not sufficient to fully understand what specific cell type is being visualized. In addition, labeling certain surface molecules such as CD31 (blood vessels) and Lyve-1 (lymphatics) can provide context for the interactions occurring within the tissue (Fig. 3). Lung sections can be labeled with fluorescently tagged antibodies that are commonly used for flow cytometry. By staining after sectioning and incubating at room temperature, the entire section can be stained without impacting cell behavior.
Table 3.
Identification of different cell types using fluorescent reporter mice.
| Mice | Cell with fluorescence | References |
|---|---|---|
| Lys-EGFP mice | Green neutrophils, monocytes and macrophages | Faust et al., Blood, 2000 |
| CX3CR1-EGFP mice | Green monocytes | Jung et al., Mol. Cell. Biol., 2000 |
| CD41-YFP mice | Yellow platelets | Stadfield et al., Exp. Hematology, 2007 |
| CD2-RFP mice | Red T cells | Looney et al., Nat. Methods, 2011 |
| Ly6G-tdTomato (Catchup) mice | Red neutrophils | Hasenberg et al., Nat. Methods, 2015 |
| IL1β-DsRed | Red IL1β+ cells | Yao et al., J. Immunol., 2015 |
| Lifeact-RFP mice | Red actin fibers | Riedl et al., Nat. Methods, 2010 |
| DsRed mice | Red in all tissues | Vintersten et al., Genesis, 2004 |
| CAG::GFP-GPI mice | Green in all tissues including ES cells | Rhee et al., Genesis, 2006 |
Figure. 3.

Staining of Lyve-1 and CD31 in lung slices. Lung sections stained as in Support Protocol 1 show Lyve-1 (blue) and CD31 (red).
Materials
Lung sections (Basic Protocol 1, step 15)
RPMI 1640 medium without phenol red
Primary antibodies: Lyve-1, unconjugated (R&D) and PE-conjugated CD31 (BioLegend)
Secondary antibody: anti-goat Dylight 649 for Lyve-1 primary (Jackson ImmunoResearch)
24-well cell culture plate
Shaking platform
Staining of lung sections
Place sections into 300 μl of RPMI without phenol red in a 24-well cell culture plate.
Add antibody to each well at two times the concentration normally used for flow cytometry: 1 to 2 μg for Lyve-1 (to stain lymphatics) and/or CD31 (to stain blood vessels) or the isotype-matched control antibody (negative control).
Incubate the sections at room temperature on a shaking platform for 2 hr in the dark.
Wash each section three times, each time for 5 min, with 1 ml of RPMI.
If using an unconjugated antibody, add a secondary antibody (6 μg anti-goat Dylight 649 for Lyve-1 primary).
Incubate the sections at room temperature on the shaking platform for 2 hr in the dark.
Wash each section three times, each time for 5 min, with 1 ml of RPMI.
Mount sections and image as in Basic Protocol 1.
BASIC PROTOCOL 2. LIVE IMAGING IN THE MOUSE LUNG
Intravital imaging has been routinely applied to many tissues including the brain, cremaster, liver, and lymph nodes. A common feature shared by these tissues is easy accessibility and tissue stabilization, both of which are problematic with lungs. To gain access to the surface of the lungs, the pleural cavity must first be breached, which leads to the loss of negative pleural pressures and lung collapse. Therefore, mechanical ventilation is needed to provide positive pressures that inflate the exposed lung. Remaining, however, is the major problem of motion both from the respiring lung and from cardiac contractions. To overcome the motion obstacle, several investigators have applied techniques of using a vacuum-enabled thoracic suction window to gently immobilize the lung and allow for stable visualization (Bennewitz et al., 2017; Bennewitz, Watkins, & Sundd, 2014; Kreisel et al., 2010; Looney et al., 2011; Ueki, Wang, Zhao, Gunzer, & Kawaoka, 2020).
Materials
Mice (procedure is best performed in adult mice >20 g in body weight)
Anesthetics: ketamine, xylazine, isoflurane
Compressible gases (21%, 100% oxygen)
Phosphate-buffered saline (PBS; appendix 2a)
Alcohol swabs
Two-photon microscope with motorized and heated stage
Rectal thermometer
Adhesive tape
Suture: 3–0 silk
Vetbond (3M)
Fiber optic illuminator (Cole Parmer) for surgery
Surgical tools for tracheotomy and thoracotomy
Thermal cautery instrument (e.g., Geiger Medical Technologies Inc)
PE-90 tubing (Intramedic)
Mechanical ventilator (e.g., Kent Scientific or Harvard Apparatus)
Isoflurane vaporizer (Molecular Imaging Products, cat. no. AS-01–0007; http://www.mipcompany.com/)
Customized thoracic suction window (see annotation to step 14, below)
Micromanipulator (Thorlabs; http://www.thorlabs.com)
12-mm glass coverslips
High vacuum grease (e.g, Dow Corning)
Hypromellose (0.3%) lubricant eye gel (e.g., GenTeal Tears, Alcon Laboratoties, Inc.)
Suction regulator and tubing
Additional reagents and equipment for intraperitoneal injection of mice (Donovan & Brown, 2006).
Protocol steps and annotations
Anesthesia and mechanical ventilation
-
1
Anesthetize mouse with i.p. injections (Donovan & Brown, 2006) of ketamine (100 mg/kg) and xylazine (20 mg/kg).
Note: Alternative anesthetics may be used with the goal of achieving 10 to 30 min of anesthesia prior to initiating isoflurane (maintenance) anesthesia via the mechanical ventilator.
-
2
Place mouse on a heated microscope stage to achieve a rectal temperature of 37°C.
-
3
Position mouse in the supine position by taping the limbs to the heated stage. Flatten the neck and head by looping 3–0 silk suture around the incisors and taping the suture to the stage. Illuminate surgical area with fiber-optic illuminator.
-
4
Once adequate anesthesia has been induced (paw pinch), use small scissors and forceps to dissect the trachea and make a small horizontal incision with fine scissors in the anterior trachea. Insert trimmed (beveled edge) PE-90 tubing into the trachea and secure with Vetbond or 3–0 silk suture (see Basic Protocol 1).
-
5
Turn on mechanical ventilator and adjust settings.
Note: Both volume- and pressure-regulated mechanical ventilators can be used to deliver positive-pressure breaths. For volume-regulated ventilators, tidal volumes of 8 to 10 μl/g body weight with respiratory rates of approximately 120 breaths per min is appropriate. For pressure-regulated ventilators, peak inspiratory pressures of 10 to 15 cm H2O can be used. It is important to calibrate the mechanical ventilator for the tidal volume being delivered at the end of the ventilator tubing. This is best done using a glass 1-ml syringe.
Depending on the experimental procedure, either room air (21% oxygen) or higher fractions of oxygen (upto 95%) can be used. The P50 for the oxygen saturation of mouse hemoglobin is ~ 2-folds higher than humans, therefore, the Fraction of Inspired Oxygen (FiO2) higher than 0.21 is recommended to avoid hypoventilation of mice in open-chest studies such as intravital lung microscopy (Bennewitz et al., 2014; Schwarte, Zuurbier, & Ince, 2000).
Positive-end expiratory pressure (PEEP) (approximately 3 cm H2O) should be applied to the exhalation circuit before exhaled gases are scavenged with activated charcoal.
-
6
Connect tracheotomy tube (PE-90 tubing inserted in step 4) to the mechanical ventilator tubing and observe for inward and outward displacement of the thorax.
-
7
Dial isoflurane vaporizer to deliver 1% to 2% gas.
For details regarding mechanical ventilation in mice refer to Schwarte et al.(Schwarte et al., 2000).
Thoracotomy and placement of thoracic window
-
8
Reposition mouse on its right side (right lateral decubitus position). Place a capped needle or similar sized object under the front shoulders of the mouse to lift the left thoracic cavity. Re-tape the mouse to the heated stage.
-
9
Administer an i.p. injection (Donovan & Brown, 2006) of pre-warmed physiological saline (0.5 to 1.0 ml).
Note: This injection is given to replace surgical and insensible blood loss that occur during the experiment. A repeat injection of 0.3 ml saline can be given at 2 hr, and hourly thereafter.
-
10
Reassess depth of anesthesia with a paw pinch.
-
11
Use an alcohol swab to wet the mouse fur overlying the left thoracic cavity.
Note: Alternatively, small clippers can be used to shave the mouse fur.
-
12
Use fine scissors and forceps to remove mouse fur and underlying subcutaneous tissue overlying the left thoracic cavity. Delicately dissect until the ribs are visualized. Remove all tissue overlying approximately four anterior ribs. Using low heat, cauterize any bleeding vessels.
-
13
The bleeding during the thoracic surgery needs to be minimized by using a combination of scissors and cauterizer. Use of scissors causes bleeding around the serrated ribs, leading to a drop in mean arterial blood pressure and hypovolemic shock (Bennewitz et al., 2014). Thus, it is necessary to monitor the arterial blood pressure of mice during the intravital imaging using a pressure transducer connected to the carotid artery catheter, so that all the observations are recorded under physiological conditions (mean arterial pressure ≥ 50 mm Hg). Use fine scissors and forceps to transect and remove three anterior ribs overlying the left lung lobe (Fig. 4). Using low heat, very carefully cauterize bleeding vessels. Avoid any lung injury.
Note: The left lung is chosen for imaging as it is one large lobe without fissures in the mouse. Extreme caution must be used to not touch the surface of the lung with surgical instruments or with the transected ribs.
-
14
Attach thoracic suction window (Fig. 4) to strut and use a micromanipulator to adjust height and horizontal plane. Use vacuum grease to seal a 12-mm glass coverslip onto the suction window.
Note: A Solid Works design of the thoracic suction window is available at https://bidc.ucsf.edu/other-microscopy-resources. Click on Biomicroscopy Wiki. Then, on the left-hand side under “Instruments,” click on “Design Repository”.
-
15
Apply 20 to 25 mmHg suction to the thoracic window and lower onto the left lung; the lung will then enter the thoracic window and be stabilized for imaging. Lower the two-photon microscope objective to just above the glass coverslip and apply lubricant eye gel to form a meniscus between the suction window coverslip and the microscope objective.
Note: Use as little suction as necessary for the lung to enter the thoracic window. It is imperative that the suction window be absolutely horizontal to avoid tangential imaging (i.e., imaging through a tilted coverslip).
-
16
Locate the top (pleural surface) of the lung and use z-steps to scan to the deepest lung depth.
-
17
For two-photon microscopy, adjust laser power, excitation laser wavelength, photomultiplier tubes (detector) voltage/gain/offset and appropriate filter cubes to optimally excite and capture images for the chosen fluorophore (Figure 2).
Figure. 4.

Surgical preparation for lung intravital microscopy. (A) Anterior and posterior views of the thoracic suction window fitted with a coverslip. (B) Side-view rendering of the suction window showing suction chamber, cover slip (green arrows), and vacuum flows (blue arrows near tissue, red arrows toward suction regulator). (C) Surgical preparation of left thorax with exposed left lung. (D) Suction window in situ. Scale bars, 5 mm (B), 10 mm (C, D) (Looney et al., 2011).
SUPPORT PROTOCOL 2. INTRATRACHEAL INSTILLATIONS
For selected experiments using Basic Protocol 1 or 2, intratracheal instillations may be desired. Intratracheal instillations of cells, proteins, or labeling agents may facilitate experimental protocols. Here we describe basic methods and materials for these procedures.
Additional Materials (also see Basic Protocols 1 and 2)
Fluorescent dyes or microbeads (Invitrogen; also see recipe)
PE-10 tubing (Intramedic)
30-G needle (or the smallest you can find)
Syringes (0.5 to 1 ml sizes)
For intratracheal instillations, direct, noninvasive, visualized instillations can be done as previously described (Su, Looney, Robriquet, Fang, & Matthay, 2004). Alternatively, once the tracheotomy tube has been inserted, instillations can be done through this tube using PE-10 tubing attached to a small syringe (0.5 to 1.0 ml) and inserted into the PE-90 tracheotomy tube.
Mice can be positioned by manipulating the microscope stage to selectively instill into the left lobe.
Instillation of small (1 μm) fluorescent microbeads is especially useful to delineate the alveolar spaces in the imaged lung.
SUPPORT PROTOCOL 3. INTRAVASCULAR INSTILLATIONS
Intravascular administration of various fluorophore-conjugated antibodies and proteins (see Table 2), chemical and pharmacological compounds, as well as adoptive transfer of diverse fluorescently labeled and non-labeled cells or extracellular vesicles, play a large part in experimental design of the mouse lung intravital imaging studies. Although intravascular bolus administration (injection) can be performed before the imaging, intravascular catheterization allows for administration of antibodies, dyes and cells in real time during the imaging. Additionally, carotid artery catheterization allows for continuous monitoring of mice mean arterial blood pressure and heart rate during the entire experiment (see Monitoring Vital Signs of Mouse During Live Lung Imaging). Here, we describe basic methods and materials for intravascular installation procedures.
Table 2.
Identification of different cell types or vasculature using fluorescent antibodies or dyes.
| Cell type | Surface antigen | References |
|---|---|---|
| Neutrophils | Ly6G Gr-1 |
Bennewitz et al., JCI Insight, 2017 Tsiganov et al., J. Immunol., 2014 |
| Platelets | CD49b CD41 |
Vats et al., Am. J. Respir. Crit. Care. Med., 2019 Bagamery et al., Cytom. A, 2005 |
| Endothelial Cells | CD31 Isolectin |
Runnels et al., Mol. Imaging, 2006 Tanaka et al., Plos One, 2014; Koike et al., J. Thromb. Thrombolysis, 2011 |
| Monocytes | Ly6C | Peng et al., J. Immunol., 2009; Rose et al., Cytom. A, 2012 |
| Red blood cells | Ter-119 | Kina et al., Br. J. Haematol., 2000; Bennewitz et al., Intravital, 2014 |
| Blood circulation | Fluorescent dextran Evans Blue |
Brzoska et al., JCI Insight, 2020; Looney et al., Nature Methods, 2011 Heck et al., Atherosclerosis, 1976; Bennewitz et al., Intravital, 2014 |
| Leukocytes | Rhodamine 6G | Baatz et al., Int. J. Microcirc. 1995; Eriksson et al., Circulation, 2011 |
Additional Materials (also see Basic Protocol 2)
30-G needle (or the smallest you can find)
Syringes (0.5 to 1 ml sizes)
Heparinized saline (4 U/ml)
Catether: PE-10 tubing (Intramedic)
Vetbond (3M)
Needle clipping device
Additional reagents and equipment for intravascular catheterization of mouse (Jacobs & Hopper-Borge, 2014)
For intravenous bolus injections, a variety of entry sites can be utilized including the lateral tail vein, femoral vein, or retro-orbital venous plexus.
-
Attach a small (e.g., 30-G) needle to a 0.5- or 1.0-ml syringe. Depending on the site of injection, blood can be aspirated to verify proper placement.
Note: For more details refer to (Hedrich & Bullock, 2004).
Carotid artery, jugular vein, femoral vein or artery can be utilized for setting up an intravascular catheter.
Use needle clipping device to cut off sharp tip of the needle (e.g., 30-G). Connect the blunt needle tip to PE-10 tubing, and then attach tip to a 0.5- or 1.0-ml syringe filled with heparinized saline (4 U/ml).
-
Following successful catheterization (Jacobs & Hopper-Borge, 2014), apply Vetbond to secure the PE-10 tubing to the blood vessel.
Note: Length of the PE-10 tubing should be long enough to allow reagent administration during imaging without moving the mouse from the microscope stage. However, long tubing may increase the dead volume in the tubing, therefore, initial volume of the administrated reagent should be adjusted to compensate for the dead space. Refer to specific IACUC guidelines on administering substances to laboratory animals.
SUPPORT PROTOCOL 4. MONITORING VITAL SIGNS OF THE MOUSE DURING LIVE LUNG IMAGING
Laboratory mice have distinctive physiological characteristics such as fast heart rates and low respiratory volumes (see Table 1). Accurate and continuous monitoring of vital signs including animal’s body temperature, heart rate, blood pressure and blood oxygen saturation, is critically important for gauging the depth of anesthesia, maintaining the animal’s safety, and preserving the physiological relevance of the experimental data generated by the mouse lung intravital imaging studies. Importantly, appropriate control of experimental variables is essential to generate reproducible results and conserve research resources.
Table 1. Normative data for the laboratory mouse.
Adapted from Bogdanske JJ et al., Laboratory Mouse Manual, 2011, CRC Press.
| Parameters | Physiological value |
|---|---|
| Pressure Systolic Diastolic |
133 – 160 mm Hg 102 – 110 mm Hg |
| Volume Plasma Whole blood |
3.15 ml/100 g body weight 5.85 ml/100 g body weight |
| Heart Rate | 310–840 beats per minute |
| Tidal Volume | 0.18 (0.09 – 0.38) ml |
| Plasma pH CO2 |
7.2–7.4 21.9 mmol/l |
| Respiration rate | 163 (60 −220) beats per minute |
| O2 consumption | 1.69 O2/gm/hour |
Materials (also see Basic Protocol 2 and Support Protocol2)
Rectal thermometer
Blood pressure transducer (e.g., Edwards Lifesciences)
Recording system (e.g., Power Lab (AdInstruments), Dataquest (Data Sciences International), NOTOCORD-hem™ (Notocord), EMKA IOX (EMKA Technologies))
Mouse pulse oximeter (e.g., MouseOx® Plus – Pulse Oximeter for Mice, Rats and Small Animals (Starr Life Sciences Corp.), Arterial oxygen saturation monitoring Mouseox (Bioseb))
Additional reagents and equipment for intravascular catheterization of mouse (Jacobs & Hopper-Borge, 2014)
Additional reagents and equipment for heart rate and arterial blood pressure measurement in mouse (Zhao et al., 2011)
Core body temperature
-
1
Traditionally, for the core body temperature assessment in mice, rectal thermometers are the most widely used in mouse lung intravital microscopy (also see Basic Protocol 2, step 2).
Note: Two-photon microscope equipped with thermostat-controlled heated stage and air-heated imaging chamber facilitates the maintenance of mouse core body temperature during the entire imaging session.
Heart rate and arterial blood pressure
-
2
Hemodynamic parameters, including the heart rate and arterial blood pressure can be monitored utilizing noninvasive tail cuff system or fluid filled catheter system that can be connected to an arterial catheter.
Note: For details regarding arterial pressure monitoring in mice refer to an excellent review by Zhao et al. (Zhao et al., 2011).
Blood oxygen saturation
-
3
Blood oxygen saturation in mouse during intravital lung imaging can be determined using pulse oximetry, a simple non-invasive method to monitor the percentage of oxygen-saturated hemoglobin in blood.
Note: Commercially available sensors designed for mouse various body parts (neck, thigh and foot) allow convenient monitoring of blood oxygen saturation during intravital lung imaging.
SUPPORT PROTOCOL 5. ANTIBODIES
The ability to assess the kinetics of the trafficking of specific cell types in living mouse is crucial for intravital lung imaging study. Lineage-marker-specific antibodies conjugated with fluorescent dyes have dramatically increased our understanding of how cells interact with tissue, other cells and move across tissue barriers in mice during healthy and disease conditions. Table 2 provides a comprehensive list of antibodies commonly used to visualize specific cell types in live imaging of the mouse lung.
SUPPORT PROTOCOL 6. FLUORESCENT REPORTER MICE
Transgenic or knock-in reporter mice expressing a fluorescent protein under the control of a cell-specific promoter or knocked into a cell specific locus have emerged as an invaluable tool in intravital lung microscopy. In recent years, many such mouse lines have been developed to study the in vivo trafficking of diverse cell types. Table 3 lists some of the available fluorescent reporter mouse lines and their potential use in intravital fluorescence microscopy.
BASIC PROTOCOL 3. QUANTIFICATION OF NEUTROPHIL-PLATELET AGGREGATION IN PULMONARY VASCULATURE
Recently, we have shown that cellular aggregates, primarily composed of neutrophils and platelets, promote pulmonary vaso-occlusion (POV) and blood stasis in pulmonary microcirculation of sickle cell disease (SCD) mice (Bennewitz et al., 2017; Bennewitz et al., 2020; Sparkenbaugh et al., 2020; Vats, Brzoska, et al., 2020). Here, we describe how to acquire, analyze and quantify neutrophil-platelet aggregation leading to pulmonary vaso-occlusion. Follow the Basic Protocol 2 to successfully perform mouse thoracotomy and place imaging window on left lung. Specific antibodies and compounds to track neutrophils, platelets and blood flow in the mouse lung are listed in the Table 2 (see Support Protocol 5).
Materials
Image analysis software
Note: Image analysis software can be purchased commercially or obtained for free via shareware (e.g., ImageJ, a free image-processing tool from the NIH with an extensive library of plug-ins; http://rsb.info.nih.gov/ij/). Image analysis can also be conducted using image processing tool box in MATLAB (MathWorks Inc). For image acquisition, processing and analysis, we used NIS-Elements (Nikon Instruments Inc). System requirements to run these programs vary depending on imaging needs. Generally, a PC with X64-based processor (32 GB RAM @ 3.6 GHz) running a 64-bit operating system (such as Windows 10) is recommended.
Protocol steps and annotations
Data Acquisition
-
1
Identify pulmonary arterioles vs venules by determining the direction of blood flow.
Note: In arterioles, the flow is directed down a large vessel into the pulmonary capillaries; whereas in venules, the flow is directed from the pulmonary capillaries into a larger vessel.
-
2
Capture time-series of images (~5–10 min long) of multiple (10–15) random fields of view (FOV) over several mice in each group to avoid any sampling bias.
Image Analysis
-
3Define aggregates composed of neutrophils and platelets based on the following criteria:
- The population of resident neutrophils in pulmonary capillaries is referred to as the “marginated pool” and has been shown to exist even in healthy lungs. Therefore, quantify neutrophil-platelet aggregates extending from the arteriolar branches into the capillaries.
- Quantify only the cellular aggregates completely filling the lumen of the arteriolar branches.
-
Take into consideration only arteriolar branches occluded by more than 2 neutrophils in the absence of platelets.Note: Small vaso-occlusion containing only 1 or 2 neutrophils can just be the result of normal neutrophil trafficking throughout the lung.
- Quantify multiple aggregates per FOV when several separate arteriolar branches are occluded.
-
4
Use software counting tool to asses number of cellular aggregates per FOV. Report results as the average number of cellular aggregates per FOV and the percent of FOVs with cellular aggregates (Fig. 5).
-
5
Use software line tracing tool to measure the area of cellular aggregates (Fig. 5).
-
6Classify the aggregates into three categories based on their cellular composition:
- Predominantly neutrophils with few platelets adhered to neutrophils (neutrophil vaso-occlusion);
- Predominantly platelets with few neutrophils attached to platelets (platelet vaso-occlusion);
- Predominantly other cell types with few neutrophils and/or platelets (other vaso-occlusion) (Fig. 5).
Figure 5. Quantification of neutrophil-platelet aggregation in pulmonary vasculature.

(Adapted from Bennewitz et al., JCI-Insight 2017). (A) Conceptual schematic of pulmonary vaso-occlusions. Large neutrophil-platelet aggregates (yellow dotted ellipses) block arteriolar bottlenecks. Neutrophil vaso-occlusion (red arrow): few platelets (green) adhered to a neutrophil macro-aggregate (red). Platelet vaso-occlusion (green arrow): few neutrophils embedded inside a platelet macro-aggregate. Erythrocytes (purple) are trapped within neutrophil-platelet aggregates. Black arrow denotes direction of blood flow. Asterisks denote alveoli. (B) Quantitative fluorescence intravital lung microscopy (qFILM) image of a SCD mouse challenged with 0.1 μg/kg intravascular (IV) lipopolysaccharide (LPS). Pulmonary microvasculature is shown in purple, neutrophils are shown in red and platelets are shown in green. All 4 arteriolar bottlenecks are blocked by neutrophil (red arrows) or platelet (green arrows) vaso-occlusions. Diameter of arteriole shown is ~28 μm. (C) Neutrophil vaso-occlusion (magnified from B) showing mostly neutrophils (red) bound to few platelets (green). (D) Platelet vaso-occlusion (magnified from B) showing mostly platelets bound to one neutrophil (white arrow). (E, F) qFILM images showing 2 pulmonary vaso-cclusions (dotted ellipses) in SCD mice (E) and absence of pulmonary vaso-occlusions in control mice (F) administered 0.1 μg/kg IV LPS. Pulmonary microvasculature is shown in purple, neutrophils are shown in red and platelets are shown in green. White arrows in B, E, and F denote direction of blood flow. Scale bars: 20 μm. (G-J) Control and sickle cell disease (SCD) mice were injected intravenously (IV) with saline (n = 3 mice per group; control: 23 fields of view [FOVs]; SCD: 29 FOVs) or 0.1 μg/kg LPS (n = 5 mice per group; control: 54 FOVs; SCD: 48 FOVs). Arterioles were imaged 2–2.5 hours after IV saline or 0.1 μg/kg IV LPS using qFILM. (G) Number of pulmonary vaso-occlusions (PVO) per FOV, (H) Percent FOVs with PVO, (I) Number of PVOs per FOV classified by cellular composition, and (J) Number of PVOs per FOV with area <1,000 μm2 or >1,000 μm2 in SCD and control mice administered IV saline or IV LPS. Average number of PVOs per FOV, cellular composition of PVOs, and area of PVOs were compared using t tests with Bonferroni correction. Percent of FOVs with PVOs were compared using 4-fold table analyses with Bonferroni χ2 statistics. Size of FOV: ~67,600 μm2. Data represent mean ± SEM. *P < 0.05 for control vs. SCD and #P < 0.05 for IV saline vs. 0.1 μg/kg IV LPS (Bennewitz et al., 2017).
BASIC PROTOCOL 4. QUANTIFICATION OF PLATELET-DEPENDENT PULMONARY THROMBOSIS
We recently reported that acute intravascular hemolysis in mice promotes adenosine diphosphate (ADP)-dependent platelet activation, leading to thrombosis in the precapillary pulmonary arterioles (Brzoska et al., 2020). Here, we describe how to acquire and analyze data to quantify platelet-dependent in situ pulmonary thrombosis. Follow the Basic Protocol 2 to successfully perform mouse thoracotomy and place imaging window on left lung. Specific antibodies and compounds to track platelets and blood flow in the mouse lung are indicated in the Table 2 (see Support Protocol 5). Mouse should be catheterized in order to intravascularly administer platelet agonist, fluorescent Antibodies or vascular dyes, monitoring blood pressure and collecting blood samples at different time-points during the imaging session (see Support Protocol 3).
Materials (see Basic Protocol 3)
Protocols steps and annotations
Data Acquisition
-
1
Identify pulmonary arteriole by determining the direction of blood flow.
-
2
Acquire a time series of the images of pulmonary arteriolar microcirculation in an FOV prior to and immediately following intravascular administration of platelet agonist.
Image Analysis
-
3
Use software binary layer tool to define region of interest (ROI, platelet-rich thrombi) by converting acquired images into binary images and adjusting the threshold range of the intensity histograms uniformly over the entire FOV in each image frame of the time series (Fig. 6).
-
4
Using software, measure obtained ROIs areas.
Note: Alternatively, use software line tracing tool to manually measure the area of each platelet-rich thrombus.
-
5
Platelet aggregates only larger than 10 µm2 sequestered within the precapillary pulmonary arterioles and extending into the pulmonary capillaries, should be considered as platelet-rich pulmonary thrombi.
-
6
For each frame, sum up all of the obtained area values to generate total pulmonary thrombi area, and plot them as a function of time (Fig. 7).
Note: Changes in total pulmonary thrombi area over time allows to follow the kinetics of pulmonary thrombosis in the observed FOV.
-
7
Changes in total pulmonary thrombi area over time may serve to calculate pulmonary thrombi maximum area and area under the curve (AUC) (Fig. 7).
Note: Pulmonary thrombi maximum area value reflects the maximum total area of platelet-rich thrombi in a FOV during the observation period. AUC is a combined measure of both the size and lifetime of platelet-rich thrombi during the observation period.
Figure 6. Quantification of platelet-dependent pulmonary thrombosis.

(Adapted from Brzoska et al., JCI-Insight 2020). Platelets are shown in green and pulmonary microcirculation in purple. White arrow marks the direction of blood flow. Scale bar 50 μm. (A) Pulmonary arterioles were identified as blood vessels draining blood into smaller daughter arterioles followed by pulmonary capillaries. Platelet-rich pulmonary thrombi were defined as platelet aggregates (area > 10 µm2) sequestered within the pre-capillary pulmonary arterioles and extending down into the pulmonary capillaries. Two-dimensional sizes (areas in µm2) of platelet-rich thrombi were estimated by converting (B) qFILM platelet-rich thrombi images into (C) binary images and adjusting the threshold range of the intensity histograms uniformly over the entire field of view (FOV) in each image frame of the time-series. The sizes of all the platelet-rich thrombi in a single image frame were added to generate total pulmonary thrombi area, which was plotted as a function of time. Changes in total pulmonary thrombi area over time served to calculate pulmonary thrombi maximum area and area under the curve (Brzoska et al., 2020).
Figure 7. Adenosine diphosphate (ADP) triggers reversible acute pulmonary thrombosis in mice.

(Adapted from Brzoska et al., JCI-Insight 2020). WT mice were intravascularly (IV) administered either 0.5 mg/kg ADP (n = 4 mice) or 2.5 mg/kg ADP (n = 7 mice) and pulmonary circulation was imaged using quantitative fluorescence intravital lung microscopy (qFILM). (A) qFILM images of the same field of view (FOV) at 8 different time points are shown. t = 0 s corresponds to time point before IV ADP administration and other displayed time points are relative to IV ADP. Pulmonary thrombosis was absent at t = 0 s. Following 2.5 mg/kg IV ADP, medium (500–1000 µm2) and large size (˃1000 µm2) platelet-rich thrombi (white arrowheads) sequestered in the pulmonary arteriole (t = 36 s). The thrombi obstructed the arteriolar bottlenecks (t = 55 s) resulting in loss of the pulmonary blood flow, which was evident by the absence of the vascular dye (purple fluorescence) in the capillaries downstream of the embolized arteriole. Pulmonary thrombosis resolved and the capillary blood flow recovered (purple fluorescence was back) by t = 115 s. Platelets (green) and pulmonary microcirculation (purple). * denote alveoli. White arrow marks the direction of blood flow. The diameter of the arteriole shown in A is 41 μm. Scale bar 50 μm. (B) Pulmonary thrombi area plotted as a function of time to show changes in the total area of platelet-rich thrombi following 2.5 mg/kg IV ADP within FOV shown in panel A. Pulmonary thrombi maximum area (Pulmonary thrombi max area) value marked by red arrow. (C) Pulmonary thrombi max area and (D) area under the curve (AUC) were estimated to compare pulmonary thrombosis development in mice following 0.5 mg/kg IV ADP (n = 4 mice) and 2.5 mg/kg IV ADP (n = 7 mice). Pulmonary thrombi max area and AUC were compared using Wilcoxon-Mann-Whitney test. Data represent mean ± SE. *P < 0.05, **P<0.01 for 0.5 mg/kg vs. 2.5 mg/kg IV ADP (Brzoska et al., 2020).
BASIC PROTOCOL 5. QUANTIFICATION OF PULMONARY VASCULAR PERMEABILITY
Under homeostasis, pulmonary vascular permeability is tightly regulated. Lung injury or inflammation may lead to vascular leakage of blood cells and/or plasma into the air spaces. Intravital lung imaging provides an invaluable tool to study and analyze kinetics of vascular permeability, which can be reported as an accumulation of fluorophore inside the air spaces as a function of time. In order to successfully perform lung surgery and assess pulmonary vasculature permeability, follow the Basic Protocol 2. Intravascularly administrated Evans blue or dextran conjugated with fluorescent dyes are the most commonly used reagents to assess increased pulmonary vascular permeability and vascular leakage into the air spaces (see Table 2).
Materials (see Basic Protocol 3)
Protocols steps and annotations
Data Acquisition
-
1
Record time series of pulmonary microcirculation images prior and immediately after vascular injury.
Vascular leakage can be achieved by laser induced tissue damage or following intratracheal or intravenous administration of infectious stimuli. At a specific time point of choice following lung insult, capture time-lapsed images of random fields of view (FOVs) over several mice in each group to avoid any bias.
Image Analysis
-
2
Utilize software line tracing tool to manually outline the air spaces (ROIs) (Fig. 8).
-
3
Measure changes in mean fluorescence intensity over time in the outlined air spaces (ROIs) and plot as a function of time (Fig. 8).
Figure 8. Quantification of pulmonary vascular permeability.

(A) Quantitative fluorescence intravital lung microscopy (qFILM) image showing vascular leakage of intravascularly (IV) administrated texas-red-dextran (red) into the air spaces in wild type mouse following laser induced tissue damage. Neutrophils shown in green. Arrow shows direction of blood flow in feeding arteriole. (B) Magnified view of region marked with dashed box in A. Three representative air spaces (marked with dashed outline) show accumulation of texas-red-dextran (red color) inside them, which can be measured as change in mean intensity of texas-red-dextran over time (inset). Arrows mark neutrophils migrating into the air spaces.
COMMENTARY
Background Information
Lung slice imaging
Lung slices have been used to assess smooth muscle contraction (Dandurand, Wang, Phillips, & Eidelman, 1993). The technique has evolved to provide for optimal contractility and the analysis of calcium fluxes within the tissue (Bergner & Sanderson, 2002). These advances in physiology can also be applied to immunology. Live imaging has allowed the field of immunology to move from snapshots of the immune system to following the elaboration of an immune response. While flow cytometry and fixed section staining are useful tools to understand what cells are present in the tissue, interactions between cells cannot be adequately assessed by these methods. Early work with lymph node explants demonstrated that in vivo imaging is not always necessary to see interactions of interest (Miller, Wei, Parker, & Cahalan, 2002). Slice imaging allows the measurement of cell behaviors deep within the lung tissue that would not be accessible through any other method. Despite the advantage of imaging deep into the lung parenchyma, the ex vivo conditions result in loss of blood and lymph flow. Live imaging is required in cases where ingress and egress are necessary for the study; however, there are caveats in depth of imaging when lungs are filled with air due to the numerous air-water interfaces. Future studies using the slice method will help to define the complicated field of lung immunology. Data that identify which cells actively contribute to pathogenic immune responses in viral infections, asthma, acute lung injury, and other lung-related diseases can lead to improved and directed treatments.
Lung intravital imaging
Intravital microscopy is an extremely powerful tool that enables imaging of biological processes in live animals. The ability to provide cellular and subcellular resolution images of organs in live animals has enabled major advances in diverse fields such as hemostasis, tumor biology, immunology and neurobiology. Intravital imaging of moving organs at single-cell resolution represents a major challenge in studying complex biology in living systems. The lung provides a particular challenge as it propagates motion resulting from cardiac contractions, pulsatile blood flow and overall movements during the inhalation-exhalation cycle. In addition, the lung tissue is very fragile and can be easily injured through accidental contact with surgical instruments, necessitating extra care during surgical preparation. Major breakthrough in intravital lung imaging occurred in 2011, when Looney and colleagues, for the first time, introduced a novel method to stabilize a small area of the mouse lung through the application of a gentle vacuum (suction) (Looney et al., 2011). This approach enabled real-time visualization of leukocyte trafficking within the pulmonary microcirculation of wild type (WT) C57BL/6 mice and transgenic mice expressing fluorescent cells. Additionally, they measured perfusion velocities in the lung subtended by the thoracic window, and gentle immobilization does not alter normal perfusion or lead to abnormal immune cell recruitment. Inspired by the approach of Looney et al 2011, we and others have used similar approaches to understand the biology of thrombo-inflammation contributing to lung inflammation in diverse pathological conditions (Bennewitz et al., 2017; Bennewitz et al., 2014; Kreisel et al., 2010; Ueki et al., 2020).
Our group has primarily adapted and modified protocol of Looney et al 2011 to study lung pathophysiology in sickle cell disease (SCD) mice. First, we introduced quantitative fluorescence intravital lung microscopy (qFILM) and used it to establish that red blood cell and neutrophil trafficking in the absence of an inflammatory stimulus is comparable between transgenic humanized SCD and control mice (Bennewitz et al., 2014). Next, we used qFILM to monitor acute vaso-occlusive events following a nano-gram dose of systemic lipopolysaccharide sufficient to trigger events in SCD but not control mice (Bennewitz et al., 2017). We observed cellular micro-embolism of precapillary pulmonary arteriolar bottlenecks by neutrophil-platelet aggregates (Fig. 9). Our subsequent qFILM study in SCD mice showed that platelet-derived extracellular vesicles contribute to lung vaso-occlusion and injury in SCD by promoting IL-1β–dependent platelet–neutrophil aggregation in the lung microvasculature (Vats, Brzoska, et al., 2020) (Fig. 10). Next, we used qFILM to investigate the role of P-selectin in the pathophysiology of SCD. We found that P-selectin–deficient SCD mice are protected from lung vaso-occlusion (Bennewitz et al., 2020). Moreover, P-selectin–glycoprotein-ligand–immunoglobulin (TSGL-Ig) fusion molecule containing four P-selectin binding sites, significantly attenuated intravenous oxyhemoglobin triggered lung vaso-occlusion in SCD mice (Vats, Tutuncuoglu, et al., 2020). We have also used qFILM to show that tissue factor inhibition also reduces pulmonary arteriole micro-embolism by neutrophil-platelet aggregates in SCD mice (Sparkenbaugh et al., 2020). Most recently, we utilized qFILM to demonstrate that acute intravascular hemolysis triggers ADP-mediated platelet-dependent in situ pulmonary thrombosis in mice (Brzoska et al., 2020) (see Fig. 7).
Figure 9. Pulmonary arteriole micro-embolism by a neutrophil-platelet aggregate in sickle cell disease (SCD) mice in vivo.

(Adapted from Bennewitz et al., JCI-Insight 2017). Sickle cell disease (SCD) mice were injected intravenously (IV) with 0.1 μg/kg of lipopolysaccharide (LPS), and arterioles were imaged using quantitative fluorescence intravital lung microscopy (qFILM) to evaluate the formation of pulmonary vaso-occlusion. qFILM images of the same field of view (FOV) at 3 different time points showing pulmonary vaso-occlusion enabled by a microembolic large neutrophil-platelet aggregate. t = 0 s shows the arteriole before the microembolus appears in the FOV. At t = 1.5 seconds, a microembolus comprising several neutrophils attached to a few platelets appears (white dotted circle) and begins to travel down the arteriole. The microembolus gets trapped in the “arteriolar bottleneck,” resulting in a pulmonary vaso-occlusion by t = 16.2 seconds. Neutrophils are shown in red, platelets in green, pulmonary microcirculation in purple. Asterisks denote alveoli. Thin white arrows mark the direction of blood flow within the feeding arterioles. The diameter of the arteriole shown is 26 μm. Scale bar: 20 μm. (Bennewitz et al., 2017).
Figure 10. Platelet extracellular vesicles (EVs) promote lung vaso-occlusion in sickle cell disease (SCD) mice in vivo.

(Adapted from Vats, Brzoska, et al., AJRCCM 2020). Donor SCD mice were intravenously administered lipopolysaccharide (LPS; 1 mg/kg); platelet EVs were isolated from the blood, fluorescently stained with DiI and adoptively (intravenously) transferred into unchallenged recipient SCD mice. Lung vaso-occlusion was assessed in recipient mice using quantitative fluorescence intravital lung microscopy (qFILM). qFILM image show SCD platelet EVs (yellow) bound to neutrophil aggregates (red) in the lung arterioles (purple) of recipient SCD mice. Alveoli are marked with asterisks. The white arrow denotes the direction of blood flow (scale bar, 20 mm) (Vats, Brzoska, et al., 2020).
Limitations of lung intravital microscopy include the inability to penetrate deep into the lung for imaging due to the scattering of light within the lung tissue at the air-liquid interfaces. Visualizing cellular trafficking in real-time within the pulmonary microcirculation necessitates the use of fluorescence imaging techniques, such as two-photon excitation (TPE) microscopy or confocal microscopy, due to their high resolution in the z-direction compared with epifluorescence microscopy. For live tissue imaging, TPE microscopy is superior to confocal microscopy. TPE microscopy involves the simultaneous absorption of two near-infrared (NIR) photons to excite a fluorochrome instead of the single photon absorption employed by confocal microscopy. In contrast to confocal microscopy, which utilizes a pinhole to exclude out-of-focus light and generate z-stacks, TPE inherently allows optical sectioning of tissue in the z-direction. In TPE, the probability of simultaneous absorption of two photons is greatly confined to the focal plane of excitation, and thus produces localized fluorescence only at the focal plane. In addition, TPE has other advantages over confocal techniques, as it exhibits reduced photobleaching, less phototoxicity, and an improved signal-to-noise ratio. Furthermore, TPE utilizes NIR wavelengths (> 700 nm) generated by a short-pulsed laser emitting excitation pulses of 10−13 s duration and 10−8 s apart, which leads to deeper tissue penetration (50–100 µm for lung tissue) than confocal microscopy. Readers interested in the physics behind TPE are advised to read Cella et al. (Cella & Diaspro, 2010).
Alternative approaches to thoracic-suction-window include using Vetbond to glue a coverslip to the lung surface (Kreisel et al., 2010), clamping of the ipsilateral bronchus to interrupt the motion from ventilation (Hasegawa et al., 2010), and coordinated acquisition of images by timing image capture with inspiration/expiration or by temporarily stopping ventilation altogether (Tabuchi, Mertens, Kuppe, Pries, & Kuebler, 2008). The ex vivo isolated and perfused lung preparation is an elegant alternative approach that allows ventilation, perfusion and provides optimal image stabilization (Hook et al., 2018; Kiefmann, Rifkind, Nagababu, & Bhattacharya, 2008; Kuebler, Ying, Singh, Issekutz, & Bhattacharya, 1999).
Recent advances in probe-based confocal laser endo/bronchomicroscopy systems (Cellvizio, Mauna Kea Tech.) have enabled in vivo imaging of lung in humans (Fuchs et al., 2011; Thiberville et al., 2009). Until such platforms are optimized for mice lung imaging, intravital imaging can be combined with ex vivo perfused lung imaging and the ex vivo lung slice method to image both subpleural alveolar structures and deeper into the lung parenchyma.
Post-hoc Denoising
Noise is a fundamental component of fluorescence microscopy, which dictates the quality of fluorescence images as a function of signal to noise ratio (SNR). In confocal and TPE microscopy, noise is primarily a result of shot noise which arises due to discrete sampling and digitization of photons by a PMT (detector) to create an image. Shot noise follows a Poisson distribution and its contribution to SNR increases as a square root of the decreasing input signal (Meiniel, Olivo-Marin, & Angelini, 2018).
In order to preserve tissue specimen health and avoid photo-bleaching, excitation-laser exposure time must be short, resulting in low SNRs (Meiniel et al., 2018). The low SNR of fluorescence microscopy images of living specimens is the main factor limiting the use of short exposure time and preventing in vivo imaging at greater depths. Denoising allows to improve the SNR, reduce exposure time and increase frame rates without increasing radiation dose, which could enable acquisition of cellular and sub-cellular events at high frame rates. Finally, if the point spread function of the objective is not affected by denoising, images may still be compatible with a deconvolution process. This allows to significantly increase the performances of deconvolution algorithms for images with low SNRs and as a consequence, the ability to detect and track objects of interest. Many denoising methods have been described in the literature, and a recent comprehensive review can be found in (Meiniel et al., 2018).
Our group use, Denoise.ai plug-in for NIS-Elements software recently introduced by Nikon Instruments Inc (https://www.microscope.healthcare.nikon.com/products/confocal-microscopes/a1hd25-a1rhd25/nis-elements-ai). Denoise.ai employs a convolutional neural network encoded with several thousand examples of acquired Nikon confocal data, which was trained to recognize and remove the Poisson shot noise component from confocal datasets. The denoising algorithm preserves the same intensity and structure in the processed image as the original image, by only removing the variances in intensity (shot noise). Removing the noise component enhances the quality of output images by 8–16 folds, which is particularly useful for low-intensity data. The enhancement in SNR also allow users to image at higher frame rates and/or with lower laser excitation power, thus enabling faster imaging and preventing photobleaching or sample damage at the same time. Most importantly, this deep learning-based Artificial Intelligence (AI) algorithm can be used in real-time as well as post-acquisition for noise removal and SNR enhancement in live imaging of the mouse lung.
Critical Parameters and Troubleshooting
Microscope set-up
The multitude of biological questions that can be answered by live imaging requires a variety of different imaging set-ups to acquire the desired data. In order to test how a cell is circulating through the vasculature or extravasating into the tissue, video-rate imaging is required to capture the events of interest. In contrast, imaging interactions between tissue-resident cells may only require a timepoint every 30 sec. These considerations should be taken into account when choosing a microscope and again during acquisition.
The laser power that reaches the sample has the ability to easily cause injury to the lung tissue. It is therefore critical to have the appropriate settings in place before beginning an experiment. Several parameters can be adjusted to achieve optimal illumination without damage to the tissue. First, the amount of laser light that reaches the sample, the number of frames averaged, and photomultiplier tube (PMT) gain should all be optimized to allow for the best signal-to-noise ratio while keeping the laser power and dwell time to a minimum. In order to test the settings, a transgenic mouse line that marks motile cells, such as CD2-RFP or c-fms-EGFP, should be tested. The cells of interest should be motile throughout the imaging session, and the sample should not dim or bleach at all. Cell motility and maintenance of fluorescence are important indicators of the health of the tissue. If either is impaired, the settings should be reconfigured and tested again.
For two-photon imaging with water-dipping lenses, one should periodically assess the meniscus formed by water or lubricant-eye-gel applied to the coverslip or medium in the imaging chamber. Both should be added or replaced as needed. Ambient light should be carefully screened from the microscope and PMTs. For in vivo imaging, monitoring of the mouse should be done in between timepoints and with as little intervention as possible.
Majority of two-photon excitation (TPE) systems are equipped with a single tunable laser capable of generating near-IR/IR excitation wavelengths (λ~700–1300 nm) to excite all the fluorchromes being used in the experiment. Unfortunately, the TPE excitation spectra (λmax for TPE excitation) of all fluorochromes do not overlap, thus, limiting the acquisition to maximum of three fluorochromes at a given wavelength. This imitation has been partially overcome by newer two laser systems with a fixed (1050 nm) and a tunable (700–1300 nm) laser operating simultaneously to allow acquisition of up to four fluorochromes at a given time point. Alternatively, four or more fluorochromes can also be visualized using spinning-disk confocal microscope systems for live imaging of the mice lung (Yipp et al., 2017). Spinning disk confocal systems use four or more fixed visible-wavelength lasers (380–750 nm) and a camera that allow video-rate (30fps or higher) visualization/acquisition of several fluorochromes at higher x-y but lower z-resolution and lower penetration-depth compared to TPE systems. Experimenters are advised to consider above mentioned pros and cons for choosing TPE vs confocal systems for live lung imaging.
Imaging reagents
Fluorescently tagged mouse strains and in vivo staining reagents require different excitation light for two-photon than single-photon imaging. Although one would expect the TPE excitation λmax of a fluorchrome to be ~2x of single-photon-excitaion λmax, this not generally the case due to the nonlinear nature of TPE excitation. A general rule of thumb is that protein dyes such as GFP are excited with 910-nm light. Chemical dyes such as CFSE or FITC or several Alexa Fluor green or red dyes are generally excited with 810–900 nm excitation wavelength. A notable exception is mCherry and TdTomato that are excited below 810 and ideally above 1000 nm. Emission of fluorophores is the same in two-photon imaging as with single photon. When designing an experiment, it is important to know that all of the fluorophores of interest are excited by the same wavelength of light or to obtain a system with two lasers (described in previous paragraph) for simultaneous excitation with two wavelengths of light. Pilot experiments should be performed to verify that all fluorophores are excited as expected and to determine the bleed-through between all the channels.
Mouse surgery and anesthesia
Surgical preparation is the key to optimal lung imaging. Great care must be taken to avoid touching the surface of the lung during the thoracotomy and placement of the thoracic suction window. After the thoracic window is placed, it can be easily removed and replaced by turning off the suction. A rim of atelectasis may appear after the window is released, but a gentle recruitment maneuver performed by slightly pinching the expiratory limb of the ventilator circuit will resolve the atelectasis.
Depth of anesthesia is also a critical parameter. Mice must be deeply anesthetized with isoflurane during the imaging to obtain quality movies. This can be periodically assessed with a paw pinch, and the isoflurane flow rate can be adjusted. Neuromuscular blockade is a potential option to avoid any motion artifact, but in our hands it is not needed.
When using mechanical ventilation in mice, it is easy to mistakenly deliver either inappropriately high or low tidal volumes. In either scenario, there are untoward physiologic and structural consequences. We cannot emphasize enough the proper calibration of delivered tidal volumes, which is best done using a 1-ml glass syringe attached to the Y-connector at the end of the ventilator tubing. Because of the dead space of the compressible tubing used in the experimental set-up, the tidal volume that is set on the ventilator may be very different than the tidal volume actually delivered to the animal. If needed, arterial blood gas sampling or pulse oximetry can be done to verify appropriate ventilation.
Lung and section viability
When imaging over an extended period of time, it is important to periodically assess the health of the tissue. One simple and fast way to assess the health of lung sections is to look for ciliary beating along the large airways. Only the first few branches are ciliated, but these airways continue beating throughout imaging. Cell motility can also act as a “canary in the coal mine,” since motility is very sensitive to temperature, oxygen levels, and phototoxicity. If cells slow down or do not move during an imaging session, the imaging set-up should be checked for any of these three critical parameters. Placing lungs or lung sections on ice can also negatively affect the motility of some immune cells. Video 12.28.1 (http://www.currentprotocols.com/protocol/cy1228) shows appropriate motility of c-fms-EGFP cells in an actin-CFP lung.
In intravital lung imaging, each preparation should be tested for viability at the beginning of an experiment. Dextran leak and neutrophil accumulation can be used as measures of tissue damage. 70-kD dextran should not leak from a good surgical preparation. Neutrophils (injected i.v. or in a LysM-GFP mouse) should not accumulate during imaging and will make for a good control population to assess motility (see Video 12.28.2 at http://www.currentprotocols.com/protocol/cy1228).
Anticipated Results
Slice lung imaging can allow for imaging of cell-cell interactions within the lung over the course of several hours. Although blood and lymph flow are interrupted, comparisons between airways of different sizes within the same lobe can be made by imaging sequential sections. With antibody labeling, the number of detectors on the microscope is the only limit to how many cell surface markers can be identified.
With care and diligence, lung intravital microscopy can be successfully performed, but it takes the coordinated involvement of the following skills: anesthesia, thoracic surgery, and advanced microscopy and image acquisition. Mice can be imaged for several hours with proper anesthesia, warming to 37°C, and fluid replacement. Looney and coworkers are currently optimizing an optional surgical approach using a custom, miniaturized thoracic window that can be inserted between ribs spread by a retractor. This option would allow for the ribs to be closed at the end of the experiment and for the mouse to be recovered, extubated (mouse could be orally intubated instead of the tracheotomy), and perhaps re-imaged at a later timepoint.
Image Acquisition and Analysis
Live mouse lung imaging experiments require a careful planning and attention to details. Experimental design should take into consideration the type of data to be acquired, how to be acquired and how the data has to be analyzed. Since, intravital imaging generates enormous amount of data, processing power and memory capacity of the analysis platform are crucial for data acquisition and analysis.
Time Considerations
Imaging lung slices.
Preparation of lung tissue for imaging takes between 30 min and 1 hr. Sectioning an entire lobe can take as little as 15 min. As with all protocols, it takes repetition to achieve the optimal timing. Lung slices can be imaged for 8 hr without changes in immune cell behavior, but any imaging after that timepoint should be validated.
Intravital lung imaging.
Set-up of ventilator, suction apparatus, and microscope should take approximately 20 min. Anesthesia, tracheotomy, thoracotomy, and placement of the thoracic suction window should take an additional 30 min. Image acquisition can proceed for several hours, depending on the experimental conditions.
Reagents and Solutions
Use physiological saline (0.9% NaCl) in all recipes and protocol steps. For common stock solutions,visit: https://doi.org/10.1002/0471142956.cya02as09
Low melting point agarose, 2% in PBS
To make 20 ml of solution, weigh 0.4 g of agarose (SeaPlaque GTG Agarose, Lonza), add to 20 ml phosphate-buffered saline (PBS; https://doi.org/10.1002/0471142956.cya02as09), and heat.
Note: Agarose will solidify at room temperature, so maintain in a 37°C water bath until used for intratracheal instillation.
Fluorescent dextran conjugates
Molecular Probes (ThermoFisher) is an excellent source for fluorescent dextran conjugates in many different colors and sizes (https://www.thermofisher.com/us/en/home/references/molecular-probes-the-handbook/tables/molecular-probes-selection-of-dextran-conjugates.html). The dextran conjugates are reconstituted, aliquoted, and stored frozen at −80°C.
Fluorescent microspheres
Unmodified polystyrene FluoSpheres (1 μm, Invitrogen; ThermoFisher) can be used for blood flow velocity measurement or visualization of blood flow. The color should be chosen based on other fluorochromes being used in the experiment to avoid spectral overlap. As these beads are very bright, it is recommended to adjust the laser power or detector voltage/gain to ensure minimal bleed through between channels.
Acknowledgements
Authors would like to thank Emily E. Thornton, Matthew F. Krummel and Mark R. Looney for writing an elegant first version (2011) of this updated chapter.
The authors of both the updated and the first version of the chapter would like to thank Sebastian Peck and Jessica Wong in the Biological Imaging Development Core at UCSF and Caitlin Sorensen, Oishee Bose, and Debasish Sen (UCSF) for helpful assistance in developing these protocols. Authors would also like to thank Wayne Lamm and Robb Glenny at the University of Washington, Seattle, for helpful discussions with previous authors and for providing the thoracic suction window to previous authors for initial experiments.
This work was supported by NHLBI 1R01HL128297–01 (PS), NHLBI 1R01 HL141080–01A1 (PS), American Heart Association 18TPA34170588 (PS), funds from the Hemophilia Center of Western Pennsylvania and Vitalant (PS) and American Society of Hematology Postdoctoral Scholar Award (TB).
Literature Cited
- Bennewitz MF, Jimenez MA, Vats R, Tutuncuoglu E, Jonassaint J, Kato GJ, … Sundd P (2017). Lung vaso-occlusion in sickle cell disease mediated by arteriolar neutrophil-platelet microemboli. JCI Insight, 2(1), e89761. doi: 10.1172/jci.insight.89761 [DOI] [PMC free article] [PubMed] [Google Scholar]
- Bennewitz MF, Tutuncuoglu E, Gudapati S, Brzoska T, Watkins SC, Monga SP, … Sundd P (2020). P-selectin-deficient mice to study pathophysiology of sickle cell disease. Blood Adv, 4(2), 266–273. doi: 10.1182/bloodadvances.2019000603 [DOI] [PMC free article] [PubMed] [Google Scholar]
- Bennewitz MF, Watkins SC, & Sundd P (2014). Quantitative intravital two-photon excitation microscopy reveals absence of pulmonary vaso-occlusion in unchallenged Sickle Cell Disease mice. Intravital, 3(2), e29748. doi: 10.4161/intv.29748 [DOI] [PMC free article] [PubMed] [Google Scholar]
- Bergner A, & Sanderson MJ (2002). Acetylcholine-induced calcium signaling and contraction of airway smooth muscle cells in lung slices. J Gen Physiol, 119(2), 187–198. doi: 10.1085/jgp.119.2.187 [DOI] [PMC free article] [PubMed] [Google Scholar]
- Brzoska T, Vats R, Bennewitz MF, Tutuncuoglu E, Watkins SC, Ragni MV, … Sundd P (2020). Intravascular hemolysis triggers ADP-mediated generation of platelet-rich thrombi in precapillary pulmonary arterioles. JCI Insight, 5(14). doi: 10.1172/jci.insight.139437 [DOI] [PMC free article] [PubMed] [Google Scholar]
- Cella F, & Diaspro A (2010). Two-Photon Excitation Microscopy: A Superb Wizard for Fluorescence Imaging. In Diaspro A (Ed.), Nanoscopy and multidimensional optical fluorescence microscopy. Boca Raton: CRC Press/Taylor & Francis Group. [Google Scholar]
- Dandurand RJ, Wang CG, Phillips NC, & Eidelman DH (1993). Responsiveness of individual airways to methacholine in adult rat lung explants. J Appl Physiol (1985), 75(1), 364–372. doi: 10.1152/jappl.1993.75.1.364 [DOI] [PubMed] [Google Scholar]
- Donovan J, & Brown P (2006). Parenteral injections. Curr Protoc Immunol, Chapter 1, Unit 1 6. doi: 10.1002/0471142735.im0106s73 [DOI] [PubMed] [Google Scholar]
- Fuchs FS, Zirlik S, Hildner K, Frieser M, Ganslmayer M, Schwarz S, … Neurath MF (2011). Fluorescein-aided confocal laser endomicroscopy of the lung. Respiration, 81(1), 32–38. doi: 10.1159/000320365 [DOI] [PubMed] [Google Scholar]
- Hasegawa A, Hayashi K, Kishimoto H, Yang M, Tofukuji S, Suzuki K, … Nakayama T (2010). Color-coded real-time cellular imaging of lung T-lymphocyte accumulation and focus formation in a mouse asthma model. J Allergy Clin Immunol, 125(2), 461–468 e466. doi: 10.1016/j.jaci.2009.09.016 [DOI] [PubMed] [Google Scholar]
- Hedrich HJ, & Bullock GR (2004). The laboratory mouse. Amsterdam; Boston: Elsevier Academic Press. [Google Scholar]
- Hook JL, Islam MN, Parker D, Prince AS, Bhattacharya S, & Bhattacharya J (2018). Disruption of staphylococcal aggregation protects against lethal lung injury. J Clin Invest, 128(3), 1074–1086. doi: 10.1172/JCI95823 [DOI] [PMC free article] [PubMed] [Google Scholar]
- Jacobs JD, & Hopper-Borge EA (2014). Carotid artery infusions for pharmacokinetic and pharmacodynamic analysis of taxanes in mice. J Vis Exp(92), e51917. doi: 10.3791/51917 [DOI] [PMC free article] [PubMed] [Google Scholar]
- Kiefmann R, Rifkind JM, Nagababu E, & Bhattacharya J (2008). Red blood cells induce hypoxic lung inflammation. Blood, 111(10), 5205–5214. doi: 10.1182/blood-2007-09-113902 [DOI] [PMC free article] [PubMed] [Google Scholar]
- Kreisel D, Nava RG, Li W, Zinselmeyer BH, Wang B, Lai J, … Miller MJ (2010). In vivo two-photon imaging reveals monocyte-dependent neutrophil extravasation during pulmonary inflammation. Proc Natl Acad Sci U S A, 107(42), 18073–18078. doi: 10.1073/pnas.1008737107 [DOI] [PMC free article] [PubMed] [Google Scholar]
- Kuebler WM, Ying X, Singh B, Issekutz AC, & Bhattacharya J (1999). Pressure is proinflammatory in lung venular capillaries. J Clin Invest, 104(4), 495–502. doi: 10.1172/JCI6872 [DOI] [PMC free article] [PubMed] [Google Scholar]
- Looney MR, Thornton EE, Sen D, Lamm WJ, Glenny RW, & Krummel MF (2011). Stabilized imaging of immune surveillance in the mouse lung. Nat Methods, 8(1), 91–96. doi: 10.1038/nmeth.1543 [DOI] [PMC free article] [PubMed] [Google Scholar]
- Meiniel W, Olivo-Marin JC, & Angelini ED (2018). Denoising of Microscopy Images: A Review of the State-of-the-Art, and a New Sparsity-Based Method. IEEE Trans Image Process, 27(8), 3842–3856. doi: 10.1109/TIP.2018.2819821 [DOI] [PubMed] [Google Scholar]
- Miller MJ, Wei SH, Parker I, & Cahalan MD (2002). Two-photon imaging of lymphocyte motility and antigen response in intact lymph node. Science, 296(5574), 1869–1873. doi: 10.1126/science.1070051 [DOI] [PubMed] [Google Scholar]
- Schwarte LA, Zuurbier CJ, & Ince C (2000). Mechanical ventilation of mice. Basic Res Cardiol, 95(6), 510–520. doi: 10.1007/s003950070029 [DOI] [PMC free article] [PubMed] [Google Scholar]
- Sparkenbaugh EM, Chen C, Brzoska T, Nguyen J, Wang S, Vercellotti GM, … Pawlinski R (2020). Thrombin activation of PAR-1 contributes to microvascular stasis in mouse models of sickle cell disease. Blood, 135(20), 1783–1787. doi: 10.1182/blood.2019003543 [DOI] [PMC free article] [PubMed] [Google Scholar]
- Su X, Looney M, Robriquet L, Fang X, & Matthay MA (2004). Direct visual instillation as a method for efficient delivery of fluid into the distal airspaces of anesthetized mice. Exp Lung Res, 30(6), 479–493. doi: 10.1080/01902140490476382 [DOI] [PubMed] [Google Scholar]
- Tabuchi A, Mertens M, Kuppe H, Pries AR, & Kuebler WM (2008). Intravital microscopy of the murine pulmonary microcirculation. J Appl Physiol (1985), 104(2), 338–346. doi: 10.1152/japplphysiol.00348.2007 [DOI] [PubMed] [Google Scholar]
- Thiberville L, Salaun M, Lachkar S, Dominique S, Moreno-Swirc S, Vever-Bizet C, & Bourg-Heckly G (2009). Human in vivo fluorescence microimaging of the alveolar ducts and sacs during bronchoscopy. Eur Respir J, 33(5), 974–985. doi: 10.1183/09031936.00083708 [DOI] [PubMed] [Google Scholar]
- Ueki H, Wang IH, Zhao D, Gunzer M, & Kawaoka Y (2020). Multicolor two-photon imaging of in vivo cellular pathophysiology upon influenza virus infection using the two-photon IMPRESS. Nat Protoc, 15(3), 1041–1065. doi: 10.1038/s41596-019-0275-y [DOI] [PMC free article] [PubMed] [Google Scholar]
- Vats R, Brzoska T, Bennewitz MF, Jimenez MA, Pradhan-Sundd T, Tutuncuoglu E, … Sundd P (2020). Platelet Extracellular Vesicles Drive Inflammasome-IL-1beta-Dependent Lung Injury in Sickle Cell Disease. Am J Respir Crit Care Med, 201(1), 33–46. doi: 10.1164/rccm.201807-1370OC [DOI] [PMC free article] [PubMed] [Google Scholar]
- Vats R, Tutuncuoglu E, Pradhan-Sundd T, Tejero J, Shaw GD, & Sundd P (2020). Tandem P-selectin glycoprotein ligand immunoglobulin prevents lung vaso-occlusion in sickle cell disease mice. Exp Hematol, 84, 1–6 e1. doi: 10.1016/j.exphem.2020.03.002 [DOI] [PMC free article] [PubMed] [Google Scholar]
- Yipp BG, Kim JH, Lima R, Zbytnuik LD, Petri B, Swanlund N, … Kubes P (2017). The Lung is a Host Defense Niche for Immediate Neutrophil-Mediated Vascular Protection. Sci Immunol, 2(10). doi: 10.1126/sciimmunol.aam8929 [DOI] [PMC free article] [PubMed] [Google Scholar]
- Zhao X, Ho D, Gao S, Hong C, Vatner DE, & Vatner SF (2011). Arterial Pressure Monitoring in Mice. Curr Protoc Mouse Biol, 1, 105–122. doi: 10.1002/9780470942390.mo100149 [DOI] [PMC free article] [PubMed] [Google Scholar]
Key References
- Looney et al., 2011 and Bennewitz et al., 2014. See above.These references describe in detail the methods needed for two-photon, intravital microscopy in the mouse lung.