Abstract
Background:
The heterogeneity of colorectal cancer (CRC) poses a significant challenge to the precise treatment of patients. CRC has been divided into 4 consensus molecular subtypes (CMSs) with distinct biological and clinical characteristics, of which CMS4 has the mesenchymal identity and the highest relapse rate. Autophagy plays a vital role in CRC development and therapeutic response.
Methods:
The gene expression profiles collected from 6 datasets were applied to this study. Network analysis was applied to integrate the subtype-specific molecular modalities and autophagy signature to establish an autophagy-based prognostic signature for CRC (APSCRC).
Results:
Network analysis revealed that 6 prognostic autophagy genes (VAMP7, DLC1, FKBP1B, PEA15, PEX14, and DNAJB1) predominantly regulated the mesenchymal modalities of CRC. The APSCRC was constructed by these 6 core genes and applied for risk calculation. Patients were divided into high- and low-risk groups based on APSCRC score in all cohorts. Patients within the high-risk group showed an unfavorable prognosis. In multivariate analysis, the APSCRC remained an independent predictor of prognosis. Moreover, the APSCRC achieved higher prognostic power than commercialized multigene signatures.
Conclusions:
We proposed and validated an autophagy-based signature, which is a promising prognostic biomarker of CRC patients. Further prospective studies are warranted to test and validate its efficiency for clinical application.
Keywords: autophagy, colorectal cancer, prognosis, regulatory network inference, subtype
1. Introduction
Colorectal cancer (CRC) is one of the most common malignancies in the world and a leading cause of cancer-related death.[1] In 2017, the prevalence rate of CRC in China ranked the third among all malignant tumors, about 37.6 per 100,000, and the mortality rate ranked the fourth, about 19.1 per 100,000.[1] Although great progress has been made in CRC treatment including surgery and adjuvant chemotherapy, the 5-year survival of CRC patients is still not optimistic due to the high recurrence rate.[2,3] At present, tumor staging remains the gold standard for estimating the prognosis of CRC. However, the clinical prognosis of many CRC patients with the same stage or treatment strategy varies.[4] The genetic heterogeneity of patients greatly affects intrinsic clinical diversity.[5] Therefore, there is a need to integrate tumor heterogeneity to identify novel prognostic predictors for CRC.
Over the past 20 years, researchers have identified a number of CRC prognostic marker genes and built multigene-based prognostic signatures that can assess the prognostic risk of CRC.[6–9] Due to the inherent genetic heterogeneity of CRC, the robustness of most markers is less than expected. In 2015, CRC was classified into 4 consensus molecular subtypes (CMS) with distinct molecular and clinical characteristics, among which CMS4 has mesenchymal characteristics.[10] CMS2 subtype responded well to anti-EGFR and HER2 inhibitors, while CMS1 and CMS4 showed higher response rates to HSP-like inhibitors. The CMS4 subtype showed significant chemoresistance to the combination of 5-Fu and Luminespib.[11] Importantly, the CMS4 shows the highest recurrence rate and the worst relapse-free survival (RFS) indicating the need to integrate the intrinsic modalities of this malignant subtype for risk management in CMS4.
Autophagy is an important mechanism to degrade cytoplasmic components and maintain intracellular stability[12] in many diseases, especially cancer.[13] Autophagy is thought to suppress early-stage tumor development and promote late-stage tumor development.[14] Many studies have explored the mechanism of autophagy-related genes (ATGs) in the development and drug-resistance of CRC.[15,16] Therefore, ATGs is expected to be a new prognostic indicator for CRC.
Considering the highly heterogeneous nature of CRC, we integrate molecular modalities and ATGs underlying CMS4. We pooled and analyzed 6 public cohorts containing 1428 CRC patients to develop and validate an autophagy gene-based prognostic signature for CRC (APSCRC). Although autophagy prognostic markers for CRC have already been mentioned before,[17,18] risk assessment incorporating molecular subtypes has not been investigated. Our signature incorporates the autophagy system and tumor heterogeneity and would be useful for selecting patients with CRC to give more precise treatment.
2. Materials and methods
2.1. Ethics statement
The researchers were authorized to conduct the study by the Ethics Committee of the Beilun People's Hospital, Ningbo, China. All procedures were implemented in accordance with the Declaration of Helsinki and relevant policies in China.
2.2. Patient datasets
In this study, we collected gene expression profiles (GEPs) from 6 independent datasets (Supplemental Table 1), including 1428 cases. These datasets involved patients from the GSE14333 (n = 290),[19] GSE17538 (n = 232),[20] the GSE39582 (n = 564),[21] the GSE33113 (n = 90),[22] the GSE38832 (n = 122),[23] and the GSE37892 (n = 130).[24] Expression data and corresponding clinical information for all datasets were downloaded from Gene Expression Omnibus. Molecular subtyping information was retrieved from Guinney's study.[10] Detailed clinical characteristics of these 6 datasets were described in Table 1. The design and workflow of this study were shown in Figure 1A. For each cohort, the GEPs probe IDs were transformed to genes symbols, if multiple probe IDs correspond to the same genes symbol, the one with the highest mean value was kept as the representative of the corresponding gene.[25]
Table 1.
Patients’ characteristics in public data sets.
| Training cohort | Validation cohorts | |||||
| GSE14333 (n = 290) | GSE17538 (n = 232) | GSE39582 (n = 564) | GSE33113 (n = 90) | GSE37892 (n = 130) | GSE38832 (n = 122) | |
| Age (y) | 66 (26–92) | 65 (23–94) | 67 (22–97) | 70 (34–95) | 68 (22–97) | |
| Gender | ||||||
| Female | 126 (43%) | 110 (47%) | 256 (45%) | 48 (53%) | 61 (47%) | |
| Male | 164 (57%) | 122 (53%) | 309 (55%) | 42 (47%) | 69 (53%) | |
| Location | ||||||
| Left | 161 (56%) | 342 (61%) | 72 (55%) | |||
| Right | 128 (44%) | 223 (39%) | 57 (44%) | |||
| Unknown | 1 (1%) | |||||
| Stage | ||||||
| I | 44 (15%) | 28 (12%) | 32 (6%) | 18 (15%) | ||
| II | 94 (32%) | 72 (31%) | 264 (47%) | 90 (100%) | 73 (56%) | 35 (29%) |
| III | 91 (31%) | 76 (33%) | 205 (36%) | 57 (44%) | 39 (32%) | |
| IV | 61 (21%) | 56 (24%) | 60 (11%) | 30 (25%) | ||
| Unknown | 4 (1%) | |||||
| MSI status | ||||||
| msi | 75 (13%) | 25 (28%) | ||||
| mss | 443 (78%) | 65 (72%) | ||||
| Unknown | 47 (8%) | |||||
| BRAF | ||||||
| Wild | 460 (81%) | 73 (81%) | ||||
| Mut | 51 (9%) | 17 (19%) | ||||
| Unknown | 54 (10%) | |||||
| Subtype | ||||||
| CMS1 | 63 (22%) | 43 (19%) | 91 (16%) | 20 (22%) | 11 (8%) | 20 (16%) |
| CMS2 | 119 (41%) | 72 (31%) | 232 (41%) | 34 (38%) | 49 (38%) | 29 (24%) |
| CMS3 | 50 (17%) | 36 (16%) | 69 (12%) | 10 (11%) | 19 (15%) | 19 (16%) |
| CMS4 | 58 (20%) | 47 (20%) | 126 (22%) | 21 (23%) | 39 (30%) | 33 (27%) |
| Unknown | 34 (15%) | 47 (8%) | 5 (6%) | 12 (9%) | 21 (17%) | |
CMSs = consensus molecular subtypes.
Figure 1.
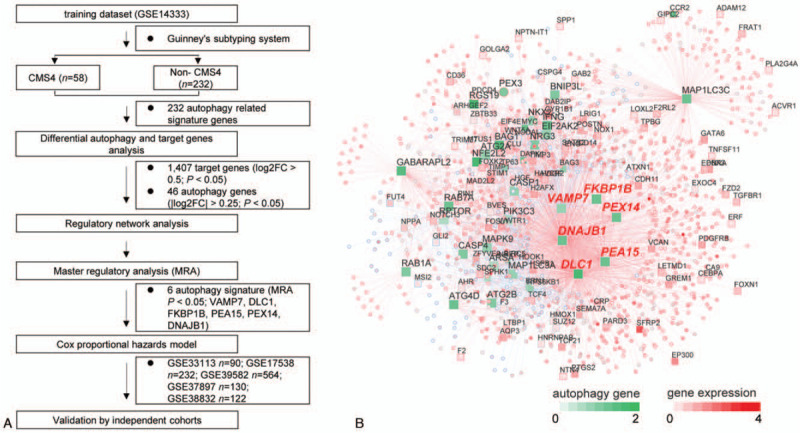
Network inference identifies 6 autophagy genes as key regulators of the CMS4 subtype of CRC. Study design of the current work (A). Integrated network displays the relationships between the 6 autophagy genes (VAMP7, DLC1, FKBP1B, PEA15, PEX14, and DNAJB1) and target genes expression data (B). CMSs = consensus molecular subtypes, CRC = colorectal cancer.
2.3. Integrated network analysis
ATGs were downloaded from the HADb database.[26] ATGs measured by all datasets were screened. Regulatory network inference was applied to investigate the relationship between ATGs and potential target genes underlying CMS4. Together, we used the GSE14333 dataset as the training cohort. Forty-six ATGs (|log2FC| > 0.25, P < .05) and 1407 target genes (|log2FC| > 0.5, P < .05) were determined differentially expressed in CMS4 compared with the other 3 subtypes (CMS1, CMS2, and CMS3). Integrated analysis was performed by the “RTN” (R package, version 2.10.0).[27] Master regulator analysis (MRA) was performed to examine the overrepresentation of epithelial–mesenchymal transition (EMT) signature[28] within each autophagy gene's regulon.
2.4. Development of the autophagy-based prognostic signature for CRC (APSCRC)
Six autophagy genes were the master regulatory factors and differentially expressed in CMS4 which is the worst survival molecular subtype in CRC. Based on these 6 autophagy genes, the multivariable cox proportional-hazards model was used to construct the APSCRC in the training cohort. The risk-score formula was constructed as follows: risk score = (0.1991 x DLC1) + (0.2351 x FKBP1B) + (0.0973 x PEA15) + (0.5989 x DNAJB1) +(−0.1977 x VAMP7) +(−0.1584 x PEX14).
2.5. Validation of the APSCRC
The prognostic relevance of APSCRC was further evaluated in 5 independent validation cohorts by Kaplan–Meier analysis, respectively. To test whether the APSCRC can be considered as an independent prognostic predictor of CRC patients, univariate and multivariate cox analyses were performed with other clinical factors. In the multivariable cox regression, gender, tumor locations, microsatellite instability (MSI) status, and BRAF mutation status were included as covariates.
2.6. Gene set enrichment analysis (GSEA)
GSEA[29] was conducted using the “fgsea” package (Bioconductor package, version 1.12.0) with 1000 permutations. Gene sets were retrieved from the Molecular Signature Database (MSigDB hallmark and kegg, version 7).[29] A P value below .05 was used to choose significant gene sets.
2.7. Statistical analysis
Differential analysis of autophagy genes and target genes between CMS4 subtype and non-CMS4 subtypes was done by package “limma.”[30] For each cohort, the upper quantile risk value was used to stratify patients into high- and low-risk groups. Kaplan–Meier analysis was performed using the log-rank test using “survival” (R package, version 2.41.3). Univariate cox regression analysis was conducted to show the prognostic value for the selected autophagy signature. Uni- and multivariable analyses were conducted by the Cox proportional hazards model. The subtype prediction power of APSCRC was determined by receiver operating characteristic curves. For all tests, a P value below.05 was used to choose significant gene sets. Statistical significance is presented as following ∗P < .05, ∗∗P < .01, ∗∗∗P < .001. All the statistical tests were conducted using R (version 3.6.1).
3. Results
3.1. Integrative analysis reveals 6 autophagy genes as key regulators in the CMS4 subtype of CRC
CRC is a heterogeneous disease. In recent studies,[10] 4 CMSs have been identified, among which CMS4 has the worst RFS and overall survival (OS) (Supplemental Fig. 1A, B). Therefore, we intended to integrate the molecular modalities under this subtype to improve risk assessment of CRC hereafter. Focusing on the CMS4 subtype of CRC, we applied a network-based approach to investigate the regulatory role of the autophagy system underlying this particular subtype. A total of 1428 CRC patients from 6 independent public cohorts were included (Table 1). Two hundred thirty-two autophagy-related genes (ATGs) were downloaded from the HADb database.[26] Based on the GSE14333 dataset, we performed differential analysis. As a result, 46 ATGs (|log2FC| > 0.25, P < .05) and 1407 target genes (|log2FC| > 0.5, P < .05) were differentially expressed in the CMS4 subtype compared with non-CMS4 subtypes (Fig. 1A). Under the expression profiles of these prioritized autophagy genes and target genes, a regulatory network was constructed by calculating the mutual information between an autophagy signature and its potential targets[31] (Fig. 1B). MRA identified 6 autophagy genes (VAMP7, DLC1, FKBP1B, PEA15, PEX14, and DNAJB1) as the key factors of CMS4 (Supplemental Table 2). Univariable Cox regression analysis demonstrated prognostic association of the 6 autophagy genes with RFS in more than 1 set of cohorts (Fig. 2A–D). Therefore, the network-based approach identified 6 subtype-specific autophagy genes, with prognostic value in CRC, as key regulators of the CMS4 subtype of CRC and can be potentially applied for risk assessment of CRC patients.
Figure 2.
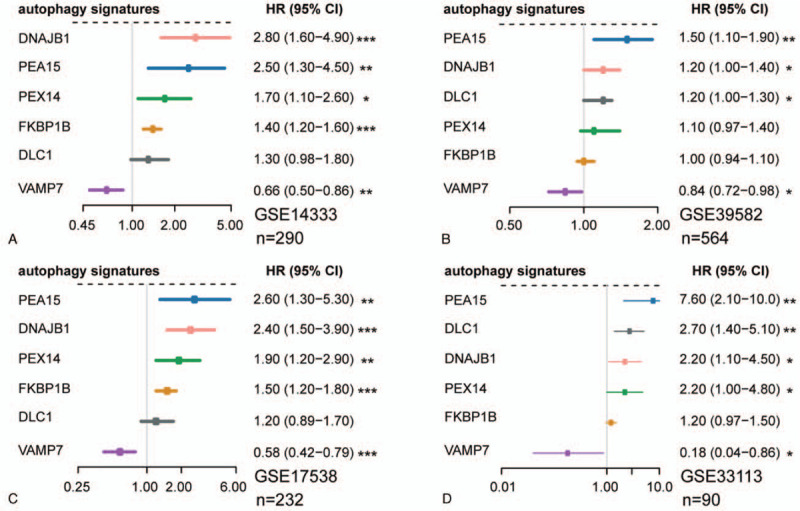
Forest plots show the prognosis association of these 6 autophagy genes in GSE14333 (A), GSE39582 (B), GSE17538 (C), and GSE33113 (D). (∗P < .05, ∗∗P < .01, ∗∗∗P < .001).
3.2. Development of an autophagy-based prognostic signature for CRC (APSCRC)
Using the GSE14333 cohort as the training set, a risk model designated APSCRC was constructed with these 6 autophagy genes as following formula: risk score = (0.1991 x DLC1) + (0.2351 x FKBP1B) + (0.0973 x PEA15) + (0.5989 x DNAJB1) +(−0.1977 x VAMP7) +(−0.1584 x PEX14). Subsequently, risk scores were calculated for all the training and validation cohorts (Supplemental Table 3). The risk scores showed high efficiency in detecting the CMS4 subtype, suggesting that the APSCRC correlated with mesenchymal phenotype (Fig. 3A–D). The upper quartile risk value was set as the cutoff to separate patients into high- and low-risk groups across all datasets. In the training set, the high-risk group patients displayed significantly poorer RFS than patients in the low-risk group (HR: 2.71, 95% CI: 1.55 - 4.77; P = 2.91 x 10⁻⁴) (Fig. 4A). When considering patients with stage II CRC only, the APSCRC remained prognostic in terms of RFS for the training set (HR: 3.77, 95% CI: 1.31-10.9; P = 8.44 x 10⁻³) (Fig. 5A).
Figure 3.
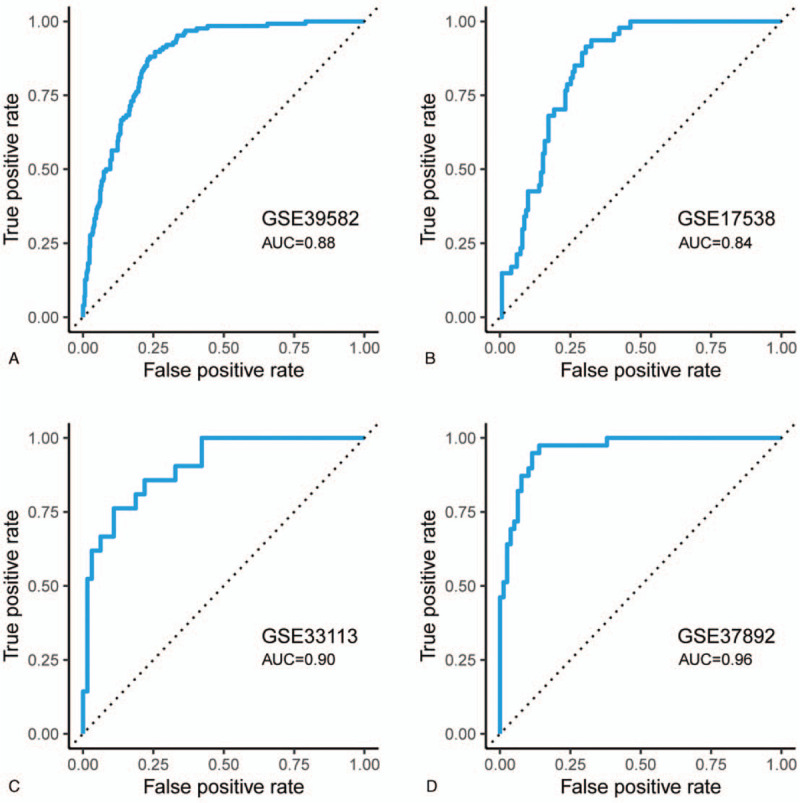
ROC curves show the detection efficiency of the CMS4 subtype for APSCRC in GSE39582 (A), GSE17538 (B), GSE33113 (C), and GSE37892 (D). CMSs = consensus molecular subtypes, ROC = receiver operating characteristic.
Figure 4.

Prognostic value of the APSCRC in CRC. Kaplan–Meier survival analysis showed that the high-risk group has an unfavorable RFS in GSE14333 (A), GSE17538 (B), GSE39582 (C), GSE33113 (D), GSE37892 (E), GSE38832 (F), and the pooled validation cohorts (G). P values are calculated by the log-rank tests. APSCRC = autophagy-based prognostic signature for CRC, CRC = colorectal cancer.
Figure 5.
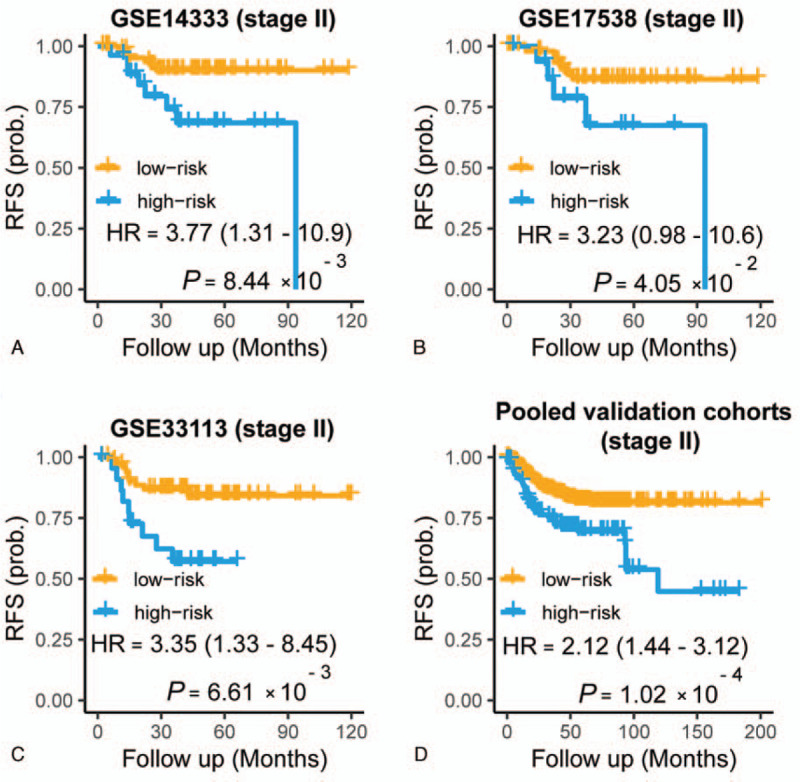
Prognostic value of the APSCRC for stage II CRC within GSE14333 (A), GSE17538 (B), GSE33113 (C), and the pooled validation cohorts (D). P values are calculated by the log-rank tests. APSCRC = autophagy-based prognostic signature for CRC, CRC = colorectal cancer.
3.3. Validation of the APSCRC for survival prediction
To verify the prognostic power of the APSCRC, we calculated the survival difference within the 2 risk groups in 5 validation cohorts. As expected, the high-risk group showed significantly reduced RFS (P =.03 to P = 5.04 x 10⁻⁵) (Fig. 4, B–F) and OS (P =.003 to P = 7.62 x 10⁻⁶) (Fig. 6A–C) compared with the low-risk group in 5validation cohorts. When considering patients within stage II CRC only, the APSCRC remained prognostic in terms of RFS for validation cohorts (P = .04 to P = .006) (Fig. 5, B and C). When pooled all validation datasets together, a more obvious RFS (HR: 1.96, 95% CI: 1.58-2.42; P < 3.07 x 10⁻¹⁰) (Fig. 4G), stage II RFS (HR: 2.12, 95% CI: 1.44-3.12; P = 1.02 x 10⁻⁴) (Fig. 5D) and OS (HR: 1.94, 95% CI: 1.54-2.45; P = 1.52 x 10⁻⁸) (Fig. 6D) differences were observed between the high- and low-risk groups. Moreover, the APSCRC also showed prognostic value for stage I, III, and IV CRC patients, in addition to stage II CRC (Supplemental Fig. 2A–C). To testify whether the APSCRC was an independent prognostic predictor, uni- and multivariate Cox regression analyses were conducted. After adjusting for gender, tumor locations, MSI status, and BRAF mutation status, the APSCRC remains an independent predictor of prognosis (Table 2).
Figure 6.
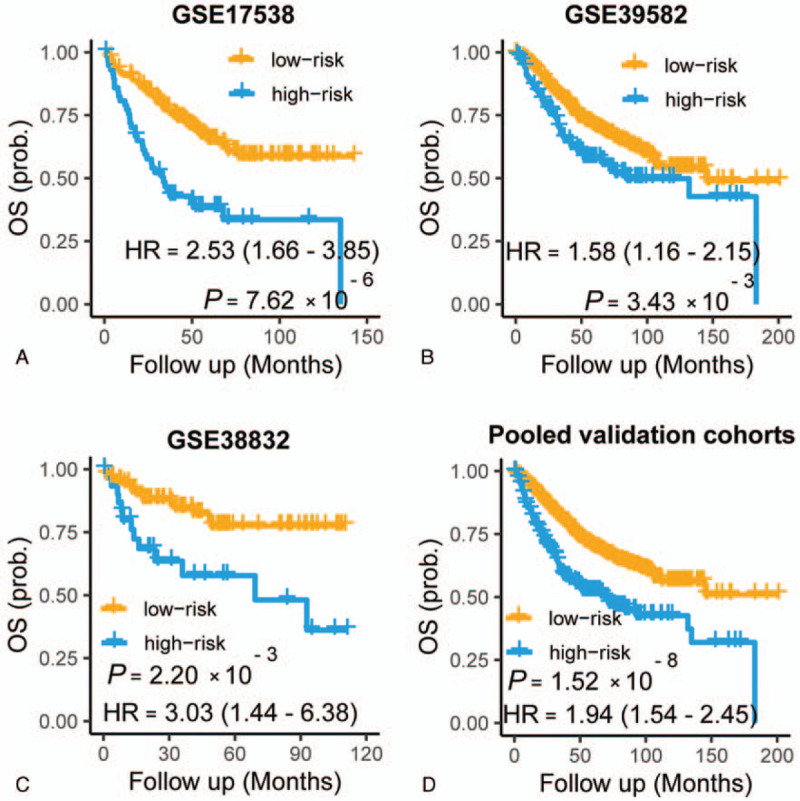
Kaplan–Meier plots showing differences in overall survival among different risk groups within GSE17538 (A), GSE39582 (B), GSE38832 (C), and the pooled validation cohorts (D). P values are calculated by the log-rank tests.
Table 2.
Univariate and multivariate analysis of autophagy signature and clinicopathological factors.
| Pooled validation cohorts | ||||
| Univariate | Multivariate | |||
| HR (95% CI) | P | HR (95% CI) | P | |
| Gender (male vs female) | 1.12 (0.89–1.42) | .33 | 1.07 (0.76–1.51) | .68 |
| Location (left vs right) | 1.22 (0.92–1.61) | .16 | 1.36 (0.94–1.97) | .11 |
| MSI (msi vs mss) | 2.48 (1.44–4.28) | 1.00E-03 | 4.54 (2.08–9.90) | 1.0E-04 |
| BRAF (mut and wild) | 1.01 (0.62–1.65) | .97 | 1.98 (0.99–3.99) | .05 |
| APSCRC (high vs low risk) | 1.79 (1.40–2.86) | 3.50E-06 | 2.00 (1.35–2.97) | 5.0E-04 |
APSCRC = autophagy-based prognostic signature for CRC.
3.4. Biological annotation of the APSCRC
To gain insight into the biological differences between risk groups, we performed GSEA analysis. Enrichment analysis between high- and low-risk groups identified that many mesenchymal phenotype-related pathways, including the TGF-beta signaling, epithelial–mesenchymal transition, and focal adhesion, were positively enriched in the high-risk group (Fig. 7A–D and Supplemental Table 4). When compared with a clinically applicable and commercialized biomarker Oncotype Dx Colon Cancer,[32] the APSCRC achieved a higher C-index in training and validation cohorts (Fig. 8A and B).
Figure 7.

The enrichment of dysregulated pathways between the high- and low-risk groups.
Figure 8.
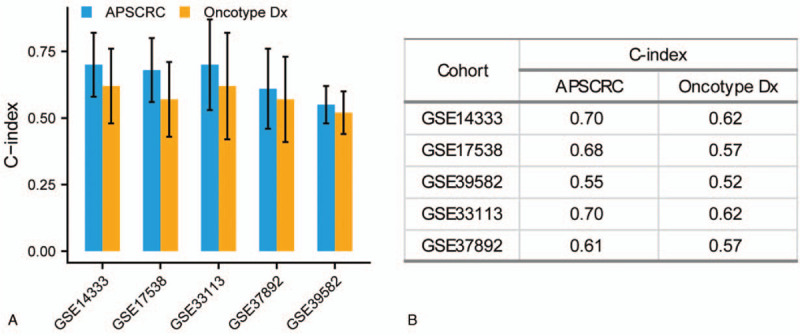
The comparison of C-index between APSCRC and Oncotype DX Colon Cancer (A). C-index values in different cohorts (B). APSCRC = autophagy-based prognostic signature for CRC.
4. Discussion
CRC is one of the most common types of cancer worldwide and the fourth leading cause of cancer-related deaths.[33,34] In recent years, researchers have constructed numerous multigene-based prognostic biomarkers that can divide CRC patients into different risk groups.[6–9] However, due to the genetic heterogeneity of CRC, the robustness of most markers is less than expected. A deeper understanding of the molecular characteristics of CRC may lead to better risk stratification of CRC patients. In 2015, CRC was classified into 4 CMS with distinct molecular and clinical characteristics.[10] Patients within CMS4 had the highest recurrence rate and the worst RFS. Autophagy is thought to suppress early-stage tumor development and promote late-stage tumor development.[14] Autophagy can be classified into 3 major types; macro-autophagy, micro-autophagy, and chaperone-mediated autophagy.[35] Inhibition of macro-autophagy promotes CMA-dependent degradation of mutant p53.[36] Higher expression of LAMP-2A indicated activated CMA in CRC.[37] However, these processes have not been well studied in CRC. Micro-autophagy is a direct engulfment of cellular components through late indentation of the late endosome. There is evidence in lung cancer that amino acid starvation, an important factor in cancer growth, causes microautophagy.[38] However, the role of micro-autophagy in CRC has not been studied in detail. Many studies have explored the mechanism of ATGs in the development and drug resistance of CRC.[15,16] Meanwhile, autophagy-based prognostic markers for CRC have also been reported.[17,18] However, most studies only focus on autophagy without considering the heterogeneity of CRC. To our knowledge, no research has been done for risk stratification by integrating the autophagy system and the mesenchymal modalities of CMS4 in CRC.
In this study, we identified 6 autophagy genes as the key factors of CMS4 and constructed an APSCRC. Within these 6 autophagy genes, FKBP1B is involved in an autophagy-based prognostic panel for multiple myeloma.[39] PEA15 shows a critical role in chemoresistance and metastasis in CRC. Meanwhile, the PEA15 expression level is significantly associated with the prognosis of CRC patients.[40] DNAJB1 actively regulates the EGFR signaling pathway by destabilizing MIG6.[41] DLC1 is a direct target gene for miR-106b and correlates with prolonged survival in CRC.[42] Each patient was assigned a risk score by the APSCRC in all cohorts. Patients within each cohort could be separated into high- and low-risk groups based on the upper quartile risk value. The APSCRC was proved as a stable prognostic biomarker of CRC, and patients with high risk scores were correlated with poor RFS and OS in 5 independent validation cohorts. Cox regression analyses indicated that the APSCRC was an independent prognostic predictor after adjusting several clinical risk factors. Moreover, some mesenchymal phenotype-related pathways, such as EMT, TGF-beta, and focal adhesion, were positively enriched in the high-risk group. When compared with a clinically applicable and commercialized biomarker Oncotype Dx Colon Cancer,[32] the APSCRC achieved a higher C-index. Our autophagy gene-based signature can effectively predict patient survival of CRC patients.
This study still has some limitations. First, the prognostic signature was screened from gene expression profiles generated from microarray platforms, which are expensive, difficult to operate, and involve professional bioinformatics expertise, so it is difficult to be popularized in daily clinical application. Second, the training and validation data sets were all from retrospective studies in the study. In the following improvement process, more datasets containing more clinical characteristics need to be included for more extensive screening and validation. Finally, a uniform risk threshold needs to be established to facilitate potential clinical applications.
Taken together, we applied a network-based approach to construct an autophagy-based prognostic signature for CRC. Our study is the first attempt to integrate colorectal cancer heterogeneity and the autophagy system to develop the prognostic signature for CRC.
Author contributions
Conceptualization: peng shu, Xingguo Zhang.
Data curation: Liangbin Wang, Xinlei Jiang.
Formal analysis: Liangbin Wang, Xinlei Jiang.
Investigation: Xingguo Zhang.
Methodology: Liangbin Wang.
Project administration: peng shu, Xingguo Zhang.
Software: Liangbin Wang.
Supervision: peng shu.
Validation: Liangbin Wang.
Visualization: Liangbin Wang.
Writing – original draft: peng shu, Liangbin Wang.
Writing – review & editing: peng shu, Xingguo Zhang.
Supplementary Material
Supplementary Material
Supplementary Material
Supplementary Material
Supplementary Material
Supplementary Material
Footnotes
Abbreviations: ATGs = autophagy-related genes, CMSs = consensus molecular subtypes, CRC = colorectal cancer, EMT = epithelial-to-mesenchymal transition, GEP = gene expression profiles, MRA = master regulator analysis, OS = overall survival, RFS = relapse-free survival.
How to cite this article: Wang L, Jiang X, Zhang X, Shu P. Prognostic implications of an autophagy-based signature in colorectal cancer. Medicine. 2021;100:13(e25148).
The authors have no conflicts of interest to disclose.
The datasets generated during and/or analyzed during the current study are available from the corresponding author on reasonable request.
Supplemental digital content is available for this article.
References
- [1].Torre LA, Bray F, Siegel RL, et al. Global cancer statistics, 2012. CA Cancer J Clin 2015;65:87–108. [DOI] [PubMed] [Google Scholar]
- [2].Roxburgh CSD, McMillan DC. The role of the in situ local inflammatory response in predicting recurrence and survival in patients with primary operable colorectal cancer. Cancer Treat Rev 2012;38:451–66. [DOI] [PubMed] [Google Scholar]
- [3].Van Cutsem E, Nordlinger B, Adam R, et al. Towards a pan-European consensus on the treatment of patients with colorectal liver metastases. Eur J Cancer 2006;42:2212–21. [DOI] [PubMed] [Google Scholar]
- [4].Dienstmann R, Mason MJ, Sinicrope FA, et al. Prediction of overall survival in stage II and III colon cancer beyond TNM system: a retrospective, pooled biomarker study. Ann Oncol 2017;28:1023–31. [DOI] [PMC free article] [PubMed] [Google Scholar]
- [5].Chang W, Gao X, Han Y, et al. Gene expression profiling-derived immunohistochemistry signature with high prognostic value in colorectal carcinoma. Gut 2014;63:1457–67. [DOI] [PubMed] [Google Scholar]
- [6].Barrier A, Boelle P-Y, Roser F, et al. Stage II colon cancer prognosis prediction by tumor gene expression profiling. J Clin Oncol 2006;24:4685–91. [DOI] [PubMed] [Google Scholar]
- [7].Wang Y, Jatkoe T, Zhang Y, et al. Gene expression profiles and molecular markers to predict recurrence of Dukes’ B Colon Cancer. J Clin Oncol 2004;22:1564–71. [DOI] [PubMed] [Google Scholar]
- [8].Yothers G, O’Connell MJ, Lee M, et al. Validation of the 12-gene colon cancer recurrence score in NSABP C-07 as a predictor of recurrence in patients with stage II and III colon cancer treated with fluorouracil and leucovorin (FU/LV) and FU/LV plus oxaliplatin. J Clin Oncol 2013;31:4512–9. [DOI] [PMC free article] [PubMed] [Google Scholar]
- [9].Salazar R, Roepman P, Capella G, et al. Gene expression signature to improve prognosis prediction of Stage II and III colorectal cancer. J Clin Oncol 2011;29:17–24. [DOI] [PubMed] [Google Scholar]
- [10].Guinney J, Dienstmann R, Wang X, et al. The consensus molecular subtypes of colorectal cancer. Nat Med 2015;21:1350–6. [DOI] [PMC free article] [PubMed] [Google Scholar]
- [11].Sveen A, Bruun J, Eide PW, et al. Colorectal cancer consensus molecular subtypes translated to preclinical models uncover potentially targetable cancer cell dependencies. Clin Cancer Res 2018;24:794–806. [DOI] [PubMed] [Google Scholar]
- [12].Rabinowitz JD, White E. Autophagy and metabolism. Science 2010;330:1344–8. [DOI] [PMC free article] [PubMed] [Google Scholar]
- [13].Kondo Y, Kanzawa T, Sawaya R, et al. The role of autophagy in cancer development and response to therapy. Nat Rev Cancer 2005;5:726–34. [DOI] [PubMed] [Google Scholar]
- [14].Janku F, McConkey DJ, Hong DS, et al. Autophagy as a target for anticancer therapy. Nat Rev Clin Oncol 2011;8:528–39. [DOI] [PubMed] [Google Scholar]
- [15].Koustas E, Sarantis P, Papavassiliou AG, et al. Upgraded role of autophagy in colorectal carcinomas. World J Gastrointest Oncol 2018;10:367–9. [DOI] [PMC free article] [PubMed] [Google Scholar]
- [16].Koustas E, Sarantis P, Kyriakopoulou G, et al. The interplay of autophagy and tumor microenvironment in colorectal cancer-ways of enhancing immunotherapy action. Cancers 2019;11:533. [DOI] [PMC free article] [PubMed] [Google Scholar]
- [17].Koustas E, Sarantis P, Theoharis S, et al. Autophagy-related proteins as a prognostic factor of patients with colorectal cancer. Am J Clin Oncol 2019;42:767–76. [DOI] [PMC free article] [PubMed] [Google Scholar]
- [18].Huang Z, Liu J, Luo L, et al. Genome-wide identification of a novel autophagy-related signature for colorectal cancer. Dose Response 2019;17:1559325819894179. [DOI] [PMC free article] [PubMed] [Google Scholar]
- [19].Jorissen RN, Gibbs P, Christie M, et al. Metastasis-associated gene expression changes predict poor outcomes in patients with Dukes Stage B and C colorectal cancer. Clin Cancer Res 2009;15:7642–51. [DOI] [PMC free article] [PubMed] [Google Scholar]
- [20].Smith JJ, Deane NG, Wu F, et al. Experimentally derived metastasis gene expression profile predicts recurrence and death in patients with colon cancer. Gastroenterology 2010;138:958–68. [DOI] [PMC free article] [PubMed] [Google Scholar]
- [21].Marisa L, de Reyniès A, Duval A, et al. Gene expression classification of colon cancer into molecular subtypes: characterization, validation, and prognostic value. PLoS Med 2013;10:e1001453. [DOI] [PMC free article] [PubMed] [Google Scholar]
- [22].Melo FdSE, Colak S, Buikhuisen J, et al. Methylation of cancer-stem-cell-associated Wnt target genes predicts poor prognosis in colorectal cancer patients. Cell Stem Cell 2011;9:476–85. [DOI] [PubMed] [Google Scholar]
- [23].Tripathi MK, Deane NG, Zhu J, et al. Nuclear factor of activated T-cell activity is associated with metastatic capacity in colon cancer. Cancer Res 2014;74:6947–57. [DOI] [PMC free article] [PubMed] [Google Scholar]
- [24].Laibe S, Lagarde A, Ferrari A, et al. A seven-gene signature aggregates a subgroup of stage II colon cancers with stage III. OMICS 2012;16:560–5. [DOI] [PubMed] [Google Scholar]
- [25].Miller JA, Cai C, Langfelder P, et al. Strategies for aggregating gene expression data: the collapseRows R function. BMC Bioinformatics 2011;12:322. [DOI] [PMC free article] [PubMed] [Google Scholar]
- [26].HADb: Human Autophagy Database. Available at: http://autophagy.lu/index.html. [Google Scholar]
- [27].Fletcher MNC, Castro MAA, Wang X, et al. Master regulators of FGFR2 signalling and breast cancer risk. Nat Commun 2013;4:2464. [DOI] [PMC free article] [PubMed] [Google Scholar]
- [28].Zhao M, Kong L, Liu Y, et al. dbEMT: an epithelial-mesenchymal transition associated gene resource. Sci Rep 2015;5:11459. [DOI] [PMC free article] [PubMed] [Google Scholar]
- [29].Subramanian A, Tamayo P, Mootha VK, et al. Gene set enrichment analysis: a knowledge-based approach for interpreting genome-wide expression profiles. Proc Natl Acad Sci U S A 2005;102:15545–50. [DOI] [PMC free article] [PubMed] [Google Scholar]
- [30].Ritchie ME, Phipson B, Wu D, et al. limma powers differential expression analyses for RNA-sequencing and microarray studies. Nucleic Acids Res 2015;43:e47. [DOI] [PMC free article] [PubMed] [Google Scholar]
- [31].Margolin AA, Nemenman I, Basso K, et al. ARACNE: an algorithm for the reconstruction of gene regulatory networks in a mammalian cellular context. BMC Bioinformatics 2006;7:S7. [DOI] [PMC free article] [PubMed] [Google Scholar]
- [32].O’Connell MJ, Lavery I, Yothers G, et al. Relationship between tumor gene expression and recurrence in four independent studies of patients with stage II/III colon cancer treated with surgery alone or surgery plus adjuvant fluorouracil plus leucovorin. J Clin Oncol 2010;28:3937–44. [DOI] [PMC free article] [PubMed] [Google Scholar]
- [33].Arnold M, Pandeya N, Byrnes G, et al. Global burden of cancer attributable to high body-mass index in 2012: a population-based study. Lancet Oncol 2015;16:36–46. [DOI] [PMC free article] [PubMed] [Google Scholar]
- [34].Ferlay J, Shin H-R, Bray F, et al. Estimates of worldwide burden of cancer in 2008: GLOBOCAN 2008. Int J Cancer 2010;127:2893–917. [DOI] [PubMed] [Google Scholar]
- [35].Devenport SN, Shah YM. Functions and implications of autophagy in colon cancer. Cells 2019;8:1349. [DOI] [PMC free article] [PubMed] [Google Scholar]
- [36].Vakifahmetoglu-Norberg H, Kim M, Xia H-G, et al. Corrigendum: Chaperone-mediated autophagy degrades mutant p53. Genes Dev 2016;30:870. [DOI] [PMC free article] [PubMed] [Google Scholar]
- [37].Kon M, Kiffin M, Koga H, et al. Chaperone-mediated autophagy is required for tumor growth. Sci Transl Med 2011;3:109–17. [DOI] [PMC free article] [PubMed] [Google Scholar]
- [38].Mejlvang J, Olsvik H, Svenning S, et al. Starvation induces rapid degradation of selective autophagy receptors by endosomal microautophagy. J Cell Biol 2018;217:3640–55. [DOI] [PMC free article] [PubMed] [Google Scholar]
- [39].Zhu F, Wang X, Zeng H, et al. A predicted risk score based on the expression of 16 autophagy-related genes for multiple myeloma survival. Oncol Lett 2019;18:5310–24. [DOI] [PMC free article] [PubMed] [Google Scholar]
- [40].Funke V, Lehmann-Koch J, Bickeböller M, et al. The PEA-15/PED protein regulates cellular survival and invasiveness in colorectal carcinomas. Cancer Lett 2013;335:431–40. [DOI] [PubMed] [Google Scholar]
- [41].Park S-Y, Choi H-K, Seo JS, et al. DNAJB1 negatively regulates MIG6 to promote epidermal growth factor receptor signaling. Biochim Biophys Acta 2015;1853:2722–30. [DOI] [PubMed] [Google Scholar]
- [42].Zhang G-J, Li J-S, Zhou H, et al. MicroRNA-106b promotes colorectal cancer cell migration and invasion by directly targeting DLC1. J Exp Clin Cancer Res 2015;34:73. [DOI] [PMC free article] [PubMed] [Google Scholar]
Associated Data
This section collects any data citations, data availability statements, or supplementary materials included in this article.


