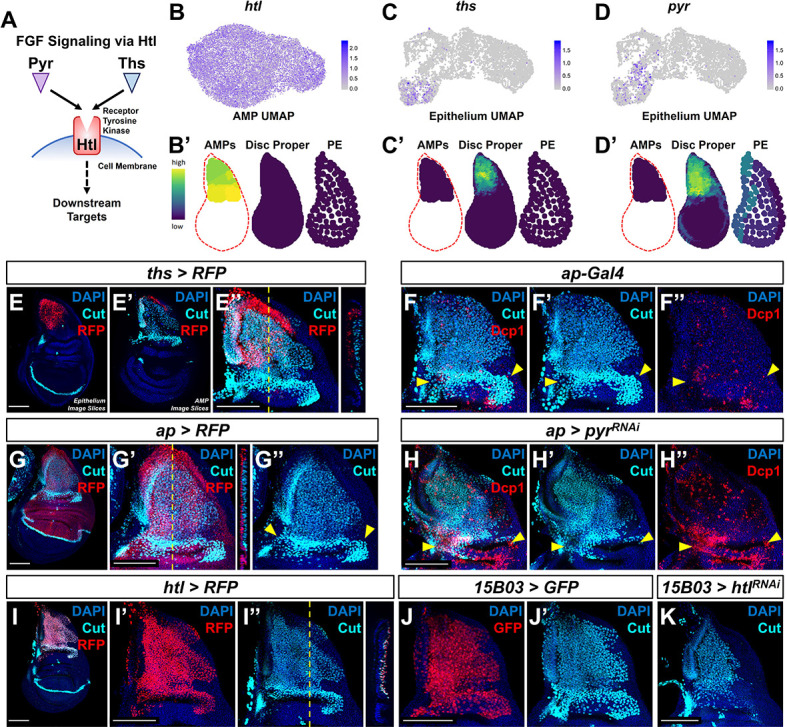
Figure 3. Fibroblast growth factor (FGF) signaling between adult muscle precursors (AMPs) and epithelium is critical for AMP viability and numbers.

(A) FGF signaling pathway diagram. FGF ligands (Pyr and Ths) signal through the FGFR (Htl). (B–D') Expression of htl (B, B'), ths (C, C'), and pyr (D, D') in the single-cell data. (B), (C), and (D) show UMAPs of these genes, in either the AMPs (for htl) or disc epithelium (for ths and pyr). (B’), (C’), and (D’) show virtual disc map predictions for the expression of these genes in the AMPs, disc proper, and peripodial epithelium. (E–E'') ths expression domain (as shown by ths-Gal4 driving the expression of RFP) in the wing disc. (E), (E’), and (E’’) are max projections over image slices of the disc epithelium, images slices of the AMPs, and all image slices (both epithelium and AMPs), respectively. AMPs are visualized with anti-Cut (cyan). Orthogonal section (apical is left, basal is right) corresponds to the dashed yellow line in (E’’). Note that ths reporter expression is specific to the notum epithelium and absent from the AMPs. (F–H'') Notum regions of wing discs with ap-Gal4 transgene alone (F–F'') or ap-Gal4 transgene driving expression of either >RFP (G–G'') or >pyrRNAi (H–H''). AMPs are visualized by anti-Cut staining (cyan), shown in (F, F', G–H'); cell death is visualized by anti-Dcp1 staining (red), shown in (F, F'', H, H''). RFP (red fluorescent protein) expression shown in (G, G'') indicates that the domain of ap-Gal4 covers the entire epithelium adjacent to the AMPs. Dashed yellow line in (G’) corresponds to the adjacent orthogonal section. Yellow arrowheads indicate expected location of direct AMPs. Note the loss of ventral- and posterior-localized AMPs following pyr knockdown, with increased anti-Dcp1 staining (H–H''). (I–I'') htl expression domain (as shown htl-Gal4 driving the expression of RFP) in the wing disc. (I') and (I'') show DAPI and either RFP or anti-Cut staining, respectively. Orthogonal section corresponds to the dashed yellow line in (I’’) (contrast with the orthogonal section in E''). Note that the htl reporter is expressed by the AMPs, which are visualized by anti-Cut staining (cyan). (J–K) The notum regions from wing discs with AMP-specific 15B03-Gal4 driving the expression of >GFP (J, J') and >htlRNAi (K). AMPs visualized with anti-Cut. Note the reduction of AMPs, especially of the direct AMPs. UMAP color scales correspond to normalized counts on a natural-log scale. All notum images are max projections across image slices. Microscopy scale bars = 100 μm.
