

Summary
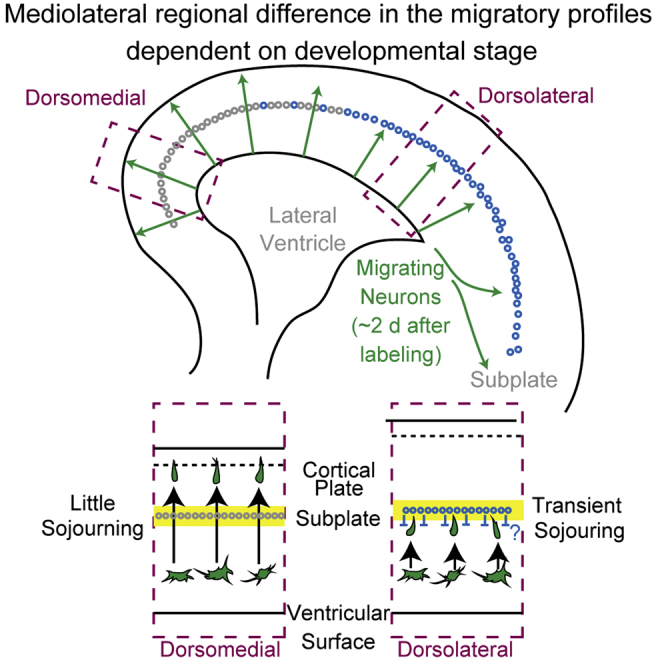
In the mammalian cerebral neocortex, different regions have different cytoarchitecture, neuronal birthdates, and functions. In most regions, neuronal migratory profiles are speculated similar based on observations using thymidine analogs. Few reports have investigated regional migratory differences from mitosis at the ventricular surface. In this study, we applied FlashTag technology, in which dyes are injected intraventricularly, to describe migratory profiles. We revealed a mediolateral regional difference in the migratory profiles of neurons that is dependent on developmental stage; for example, neurons labeled at embryonic day 12.5–15.5 reached their destination earlier dorsomedially than dorsolaterally, even where there were underlying ventricular surfaces, reflecting sojourning below the subplate. This difference was hardly recapitulated by thymidine analogs, which visualize neurogenic gradients, suggesting a biological significance different from the neurogenic gradient. These observations advance our understanding of cortical development and the power of FlashTag in studying migration and are thus resources for future neurodevelopmental studies.
Subject Areas: Biological Sciences, Neuroscience, Developmental Neuroscience, Neuroanatomy, Techniques in Neuroscience
Graphical abstract
Highlights
-
•
FlashTag visualized mediolateral regional differences of cortical migratory profiles
-
•
Mediolateral differences were observed when neurons were labeled at E12.5–15.5
-
•
Late-born neurons transiently sojourned below the dorsolateral subplate (SP) cells
-
•
The difference was unclear in reeler cortex, where SP cells position superficially
Biological Sciences ; Neuroscience ; Developmental Neuroscience ; Neuroanatomy ; Techniques in Neuroscience
Introduction
The mammalian cerebral neocortex is a well-organized, six-layered structure that contains a diversity of neurons. Neuronal migration is an essential step in the precise formation of the complex cortical cytoarchitecture, which underlies the evolution of mammalian cognitive function. At the earliest stage of cortical development, neural stem cells form a pseudostratified structure called the neuroepithelium, and these stem cells undergo self-renewal to expand the cortical areas (Caviness et al., 1995; His, 1889; Rakic, 1995; Sauer, 1935; Subramanian et al., 2017). They then begin to produce the earliest-born neurons (Bystron et al., 2006; Iacopetti et al., 1999), which form the preplate (PP) or primordial plexiform layer (Marin-Padilla, 1971) (see Figures S1A and S1B, Table 1, and the histological terminology section in transparent methods). These neurons include Cajal-Retzius cells and future subplate (SP) neurons, most of which are transient populations that undergo cell death postnatally (Hoerder-Suabedissen and Molnár, 2015; Kostovic and Rakic, 1990; Price et al., 1997). In the pallium, the production of cortical projection neurons follows. They derive from radial glial cells in the ventricular zone (VZ). Some daughter cells become postmitotic soon after they exit the VZ (Tabata et al., 2009) whereas others divide in a more basal structure (the subventricular zone [SVZ]) (Boulder-Committee, 1970; Takahashi et al., 1996). In both cases, they migrate radially through the intermediate zone (IZ), SP, and the cortical plate (CP) to the primitive cortical zone (PCZ) (Sekine et al., 2011, 2012), the most superficial part of the CP. Migrating neurons overtake earlier-born neurons to finish their migration in the PCZ. This process serves as a basis for the inside-out pattern of neuronal positioning, in which earlier-born neurons position deeply and later-born neurons position superficially (Sekine et al., 2011; Shin et al., 2019).
Table 1.
Definitions of abbreviations used in the text and figures
| Abbreviations | Explanations |
|---|---|
| 3H-TdR | Tritiated thymidine |
| BrdU | 5-bromo-2′-deoxyuridine |
| CAS | Caudal amygdaloid stream |
| CC | Corpus callosum |
| CFSE | Carboxyfluorescein succinimidyl ester |
| CGE | Caudal ganglionic eminence |
| CP | Cortical plate |
| DAPI | 4′,6-diamidino-2-phenylindole |
| E | Embryonic days |
| EdU | 5-ethynyl-2′-deoxyuridine |
| FT | FlashTag |
| GM | Gray matter |
| i-GONAD | Improved genome editing via oviductal nucleic acids delivery |
| Ins | Insular cortex |
| IZ | Intermediate zone |
| LCS | Lateral cortical stream |
| LGE | Lateral ganglionic eminence |
| LI | Cortical layer I |
| LV | Lateral ventricle |
| MAZ | Multipolar cell accumulation zone |
| MGE | Medial ganglionic eminence |
| moRG | Mouse outer radial glial cells |
| MZ | Marginal zone |
| P | Postnatal days |
| PCZ | Primitive cortical zone |
| pH3 | Phospho-histone H3 |
| Pir | Piriform cortex |
| PP | Preplate |
| PSB | Pallial-subpallial boundaries |
| R | Reservoir |
| REP | Rapidly exiting population |
| SEP | Slowly exiting population |
| SP | Subplate |
| SVZ | Subventricular zone |
| VZ | Ventricular zone |
| WM | White matter |
For detailed explanations, see Figures S1A and S1B, and the histological terminology section of transparent methods.
Different cortical regions have different functions. The cerebral cortex is subdivided into many cortical areas based on cytoarchitectonics (Brodmann, 1909), which have high correlations with function. According to the protomap hypothesis, the neural stem cells in the VZ provide a protomap of prospective cytoarchitectonic areas (Rakic, 1988). At a time of concurrent innervation from the thalamus (Moreno-Juan et al., 2017), neuronal migration takes place between proliferation at the ventricular surface and the formation of cytoarchitectonics. Therefore, the whole-brain visualization of neuronal migratory profiles from mitosis at the ventricular surface to arrival at their final destinations may serve as basic information to further understand the formation of the complex mammalian brain.
To reveal the above-mentioned neuronal behaviors (neurogenesis, positioning, and neuronal migration), thymidine analogs have long been used. Interkinetic nuclear migration of the VZ stem cells (Fujita, 1963) and the inside-out pattern of neuronal birthdate (Angevine and Sidman, 1961; Bayer and Altman, 1991; Hicks and D'Amato, 1968) were clearly shown by tritiated thymidine (3H-TdR). The limitation of the use of these S-phase markers to study neuronal migration was hardly discussed; however, in the last 20 years, growing evidence suggests that many projection neurons, especially superficial layer neurons, are generated indirectly in the SVZ from intermediate neural progenitors (Haubensak et al., 2004; Kowalczyk et al., 2009; Miyata et al., 2004; Noctor et al., 2004; Takahashi et al., 1996) and basal radial glial cells (Fietz et al., 2010; Hansen et al., 2010) that derive from (apical) radial glial cells, in addition to direct neurogenesis (Tabata et al., 2009). In addition, interneurons are born in the ventral forebrain and migrate to the cortex (tangential migration) (Anderson et al., 1997; Marin and Rubenstein, 2001; Tamamaki et al., 1997). Thymidine analogs are incorporated in the S-phase and retained by the progeny of dividing cells that undergo final mitosis irrespective of the anatomical position. Basal progenitors are already in the midst of migration when they are in the S-phase and because interneurons incorporate thymidine analogs ventrally, migratory “profiles” of neurons revealed by thymidine analogs contain those with different “starting points” (i.e., cellular positions when thymidine analogs are incorporated).
As a method of aligning the “starting points,” we previously developed in utero electroporation, in which expression plasmids are injected into the lateral ventricle (LV), and electrical pulses are given to transfect the cells lying along the ventricular surface at the time of labeling (Tabata and Nakajima, 2001, 2008). This method is supposed to label apical progenitors in the S/G2/M phase preferentially (Pilaz et al., 2009). Using this method, we previously described (1) different migratory profiles between the direct progeny of apical progenitors and basal progenitors and (2) regional differences in the abundance of the two modes of neurogenesis between the dorsomedial and dorsolateral cortices (Tabata et al., 2009). As it is well known that neurogenic events progress along the lateral-to-medial gradient (Hicks and D'Amato, 1968; Smart and McSherry, 1982; Smart and Smart, 1982; Takahashi et al., 1999), we hypothesized that the migratory profiles of the dorsomedial (future cingulate) cortex and the dorsolateral cortex (future somatosensory cortex where there is an underlying VZ prenatally) differ significantly. On the other hand, the aforementioned work (Bayer and Altman, 1991) and others (Hicks and D'Amato, 1968) using thymidine analogs did not describe this. The former studied regional differences in the migration of later-born cortical neurons in rats and observed that it took approximately 2 days for labeled neurons to reach the top of the CP in the dorsomedial and dorsolateral cortices, where there is an underlying VZ, whereas neurons migrating to the lateral (future presumptive insular and piriform) cortex, which lacks an underlying VZ, took longer because they migrate in a sigmoid manner to circumvent the growing striatum along the lateral cortical stream (LCS). The overall migratory profiles of neurons born at ventricular surfaces in different cortical regions at different stages remain to be described.
To visualize the migration of neurons of different cortical regions that undergo mitosis at the ventricular surface at a given time, we decided to take advantage of FlashTag (FT) technology (Govindan et al., 2018; Telley et al., 2016), in which fluorescent dyes are injected into the ventricle. This technique is used to label ventricular cells specifically in the M-phase. Once the hydrophobic precursor fluorescent molecules (5(6)-carboxyfluorescein diacetate succinimidyl ester; CFDA-SE), often called carboxyfluorescein succinimidyl ester (CFSE) in biological contexts, diffuse into the cell, cellular esterases cleave them to produce carboxyfluorescein succinimidyl ester, which is fluorescent and covalently bonded to intracellular proteins (Telley et al., 2016). FT also refers to the use of other compounds with identical modes of action, including CytoTell Blue (Telley et al., 2016). Here, we successfully visualized the migration of projection neurons in different cortical regions with high temporal resolution. We describe mediolateral regional differences in the migratory profiles of neurons born at different stages in regions where there is an underlying VZ, which were not clearly detected by experiments using thymidine analogs.
Results
Characterization of cell population labeled with FT
FT technology has been increasingly used to label neuronal progenitors on the ventricular surfaces and their positioning (Govindan et al., 2018; Mayer et al., 2018; Oberst et al., 2019; Telley et al., 2016, 2019), but has rarely been used to study overall migratory profiles. Therefore, we first characterized the cellular population labeled with FT to ensure the validity of our analyses. We performed an intraventricular injection of ~0.5 μL of 1 mM CFSE. We decreased the concentration of CFSE and the quantity of organic solvent to one-tenth of that used in the previous studies (Govindan et al., 2018; Telley et al., 2016) to minimize any possible but unknown side effects from injection, although the original concentration was successfully used. To characterize the population of cells labeled with FT, we injected CFSE into the LV of E14 Institute of Cancer Research (ICR) mouse embryos and fixed them 0.5–9.5 h later (Figures 1A–1E). When brains were fixed 0.5 h after dye injection, strong fluorescence was observed in the most apical cells in the pallial VZ, which often overlapped with phospho-histone H3 (pH3, a mitosis marker) (Hendzel et al., 1997; Kim et al., 2017)-positive cells along the ventricular surface (Figure 1A). More than one-third of the labeled cells were positive for pH3 (Figure 1F, −0.5 h). This mitosis rate will be underestimated due to the time lag between dye injection and fixation and the dephosphorylation of histone H3 after telophase (Hendzel et al., 1997). Almost all pH3-positive cells on the ventricular surface were labeled with FT 0.5 h after injection (dorsolateral: 97.9% ± 1.3%, 71 cells from 5 brains; dorsomedial: 98.9% ± 1.1%, 55 cells from 5 brains; mean ± standard error of means [SEM], t test, p = 0.37, the sample numbers in the statistical analyses were the number of brains), suggesting that almost all cells undergoing mitosis on the ventricular surface were labeled with FT when CFSE occupied the LV. FT-labeled cells moved basally to leave the ventricular surface (Figures 1A–1D), and 3.5 h after FT labeling, FT-labeled cells had already left the ventricular surface and were almost never immunolabeled with pH3 (Figures 1B and 1F, −3.5 h). This observation suggests that the labeling time window is less than a few hours, which is compatible with previous observations (Telley et al., 2016). To visualize the difference between cellular populations labeled with FT and thymidine analogs, we performed bolus injection of 5-ethynyl-2′-deoxyuridine (EdU, a thymidine analog) into the intraperitoneal cavity of the mother mice at the same time as, or 3–9 h after, FT labeling (Figures 1A–1E). No cells were double-positive for FT and EdU when EdU and FT labeling were performed simultaneously (Figures 1A and 1F, -0.5 h). Nine hours after FT, some FT-labeled (FT+) cells were also labeled with EdU (EdU+), indicating that they had reentered the S-phase (Figures 1D and 1G, −9.5 h). We observed slight differences in EdU+/FT+ between the dorsomedial and dorsolateral cortices (Figure 1G, -9.5 h; the definitions of dorsomedial, dorsal, and dorsolateral cortices as well as the cortical zones mentioned in this study are shown in Figures S1A and S1B). This observation might reflect differences in cell-cycle lengths and/or the proportions of direct neurogenesis (Polleux et al., 1997).
Figure 1.

Characterization of cell populations labeled with the FlashTag (FT) technology
(A–G) 1 mM 5- or 6-(N-succinimidyloxycarbonyl) fluorescein 3′,6′-diacetate (CFSE) was injected into the lateral ventricles (LV) at embryonic day (E)14 of ICR mice and fixed 0.5 (A), 3.5 (B), 6.5 (C), and 9.5 (D) h later. Intraperitoneal bolus injection of 5-ethynyl-2′-deoxyuridine (EdU) was performed maternally 0.5 h before fixation. Photomicrographs from the dorsolateral cortex are shown. In (A), FT-labeled cells are positioned most apically and are often positive for phospho-histone H3 (pH3) (F, −0.5 h, dorsolateral: 36.1% ± 4.0%, 339 cells from five brains; dorsomedial: 35.2% ± 4.7%, 249 cells from 5 brains, t test, p = 0.82) but negative for EdU administered at the same time (G, −0.5 h, dorsolateral: 0.0% ± 0.0%, 339 cells from 5 brains; dorsomedial: 0.0% ± 0.0%, 249 cells from 5 brains, t test not applicable). The nuclei of EdU-positive cells are positioned basally in the VZ. 3.5 h after FT injection, FT-labeled cells have left the ventricular surface but are still near it and are no longer positive for pH3 (B) (F, pH3, −3.5 h, dorsolateral: 2.8% ± 0.7%, 530 cells from 5 brains; dorsomedial: 1.1% ± 0.5%, 415 cells from 5 brains, t test, p = 0.22) (G, EdU, −3.5 h, dorsolateral: 0.76% ± 0.58%, 530 cells from 5 brains; dorsomedial: 2.3% ± 1.2%, 415 cells from 5 brains, t test, p = 0.38). At 6.5 h after labeling, almost no cells are adjacent to the lateral ventricle (C) (F, pH3, −6.5 h, dorsolateral: 0.48% ± 0.34%, 695 cells from 5 brains; dorsomedial: 0.17% ± 0.17%, 501 cells from 5 brains, t test, p = 0.52) (G, EdU, −0.5 h, dorsolateral: 5.6% ± 0.87%, 695 cells from 5 brains; dorsomedial: 5.1% ± 1.3%, 501 cells from 5 brains, t test, p = 0.83). At 9.5 h after labeling, most of the labeled cells are in about the basal two-thirds of the VZ and some are double-labeled for EdU, suggesting that some re-enter the S-phase (D, G) (F, pH3, -9.5 h, dorsolateral: 0.0% ± 0.0%, 711 cells from 5 brains; dorsomedial: 0.37% ± 0.23%, 546 cells from 5 brains, t test, p = 0.19) (G, EdU, −9.5 h, dorsolateral: 15.9% ± 2.5%, 711 cells from 5 brains; dorsomedial: 33.4% ± 6.6%, 546 cells from 5 brains, t test, p = 0.025). A schematic representation of these experiments is shown in (E). In (F), percentages of pH3+ cells based on all FT-labeled cells are shown. Magenta, pH3+ FT+/FT+ in the dorsolateral cortex. Green, pH3+ FT+/FT+ in the dorsomedial cortex. In (G), percentages of EdU+ cells of all FT-labeled cells are shown. Orange, EdU+ FT+/FT+ in the dorsolateral cortex. Blue, EdU+ FT+/FT+ in the dorsomedial cortex.
(H–L) EdU was administered 3 (I), 6 (J), and 9 (K) h before FT labeling. At 0.5 h after FT labeling, the brains were harvested. A schematic representation of these experiments is shown in (H). Nuclei of the EdU-labeled cells are positioned more apically in brains in which EdU was administered 3.5 h before fixation (I) compared with (A), and some of the EdU-labeled cells are positioned at the ventricular surface to enter the M phase (interkinetic nuclear migration). In brains in which EdU was administered 6.5 (J) and 9.5 (K) h before fixation, EdU-labeled cells positioned even more apically. In mice treated with EdU 3–9 h before FT, FT-labeled cells are often co-labeled with EdU (I–K) (L, −9.5 h: dorsolateral, 76.6% ± 2.4%, 328 cells from 5 brains, dorsomedial, 65.1% ± 1.5%, 369 cells from 5 brains, t test, p = 0.014; −6.5 h: dorsolateral, 96.1% ± 0.5%, 304 cells from 5 brains, dorsomedial, 96.7% ± 1.2%, 217 cells from 5 brains, t test, p = 0.58; −3.5 h: dorsolateral, 81.2% ± 1.9%, 263 cells from 6 brains, dorsomedial, 81.5% ± 1.9%, 287 cells from 6 brains, t test, p = 0.92). Note that EdU and FT never co-label when administered simultaneously (A). In the graph in (L), the percentage of EdU+ cells based on all FT-labeled cells is shown. Data for −0.5 h in (L) correspond to those for −0.5 h in (G). Orange, EdU+ FT+/FT+ in the dorsolateral cortex. Blue, EdU+ FT+/FT+ in the dorsomedial cortex.
(M–O) CytoTell Blue was injected into the LV of the E12.5 (M–N) and 15.5 (O) GAD67-GFP brains. In the E15.5 dorsolateral cortex labeled at E12.5, most of the labeled cells (red) are in the deep part of the cortical plate (CP) (M, N). The majority of the labeled cells are negative for GFP (E12.5–15.5 dorsolateral cortex, 93.3% ± 2.5%, 1,653 cells from 3 brains) (N, N1–3). In postnatal day (P)1 dorsolateral cortex labeled at E15.5 (O), most of the labeled cells are found in the superficial gray matter (GM). Again, most of the labeled cells are negative for GFP (E15.5–P1, 95.5% ± 0.5%, 1,455 cells from 5 brains) (O, O1–3). Arrowheads in (N) and (O) show rare examples of cells positive for both FT and GFP.
Scale bars: 20 μm in (A–D, I–K, N3, O3), 50 μm in (N, O), and 200 μm in (M). See also Figure S1. Data are presented as mean ± standard error of the mean (SEM). The sample numbers in the statistical analyses refer to the number of brains.
To further define the differences in the labeled cellular populations, we performed bolus injection of EdU into the intraperitoneal cavity of the mother mice at the same time as, or 3–9 h before, FT (Figures 1H–1L). Brains were harvested 0.5 h after FT. Approximately 60%–90% of FT-labeled cells in mice treated with EdU 3–9 h before FT were co-labeled with EdU (Figure 1L, −3.5, −6.5, 9.5 h). As EdU is incorporated in the S-phase, these observations suggest that S-phase cells move apically to the ventricular surface by interkinetic nuclear migration over the course of several hours and are labeled with FT when they are around the M-phase. Collectively, these observations suggest that FT labels cells around the M phase on the ventricular surface and that FT can serve as a method to describe neuronal migration from a single starting point, that is, the ventricular surface.
To investigate whether cortical interneurons were also labeled with FT, CytoTell Blue, another fluorescent dye used for FT labeling (Govindan et al., 2018; Telley et al., 2016), was injected into the LV of the E12.5 (Figures 1M and 1N) and E15.5 (Figure 1O) GAD67-GFP knock-in mouse brains (Tamamaki et al., 2003), in which interneurons are labeled with GFP. Several days after labeling, most of the FT-labeled cells were in the CP/gray matter (GM) and a vast majority of the cells were negative for GFP. Many migrating cells in the LCS or “reservoir” (Bayer and Altman, 1991) were also mostly negative for GFP (Figure S1C, C1–C3). More ventrally, FT-labeled cells were identified in the caudal amygdaloid stream (CAS) (Remedios et al., 2007) and were negative for GFP (Figure S1C, C4–C6). GFP-labeled interneurons that migrated into the dorsal pallium were rarely labeled with FT, except for a small number of cells that were positive for both FT and GFP (Figures 1N and 1O, arrowheads), suggesting that when FT labeling is performed at E12.5–15.5, most of the FT-labeled cells in the cortex are projection neurons.
Why did we observe only a few FT-labeled interneurons in the cortex, although the ventral progenitors of the interneurons are also labeled with FT (Mayer et al., 2018) (Figures S1D and S1E)? We reasoned that frequent abventricular cell division might dilute the fluorescent dyes, thereby attenuating the fluorescent labeling. Indeed, when we performed immunohistochemistry against pH3, we confirmed that abventricular mitosis is very frequent in the ganglionic eminences (Figures S1D and S1E), which is consistent with previous reports (Katayama et al., 2013; Smart, 1976; Tan et al., 2016; Tan and Shi, 2013). We next reasoned that injection of a fluorescent dye into the SVZ might prevent loss of fluorescence by dilution upon abventricular mitosis. To address this question, we injected CytoTell Blue into the parenchyma of the ganglionic eminences of GAD67-GFP mice at E12.5 (the injection sites were retrospectively identified, e.g., a presumptive injection site is shown by an asterisk in Figure S1F). Cells were far more strongly labeled than with intraventricular injections. FT and GFP-double-labeled cells with tangential morphologies were distributed throughout the hemispheres, especially in the SVZ and the marginal zone (MZ) of the dorsal pallium at E15.5 (Figure S1F, F1–10). These observations are compatible with the idea that FT-labeled interneuron progenitors in the VZ undergo mitosis in the SVZ, resulting in loss of FT fluorescence in the migrating cortical interneurons when fluorescent dyes are delivered intraventricularly. Another group independently reported that projection neurons formed the majority of the FT-labeled cells, based on single-cell RNA sequencing (Telley et al., 2019).
In summary, when fluorescent dyes were injected intraventricularly, the FT-labeled cells at early (E12.5) and late (E15.5) stages of neurogenesis were mostly non-GABAergic projection neurons. We do not preclude a small subpopulation of interneurons from being labeled with FT, which will be described later in the late and very late stages of neurogenesis (E15.5 and E17.0 cohort).
FT visualizes clear regional differences in neuronal migration profiles in the cerebral cortex
Using FT technology, we noticed regional differences in neuronal migration during the development of the cerebral cortex. We performed FT labeling at E14.5 and fixation 2 days later (Figure 2A). Many FT-labeled cells had reached the top of the CP in the dorsomedial cortex, whereas most of the labeled cells were still below the SP in the dorsolateral cortex (the lower border of the SP is represented by yellow dotted lines). This suggests the presence of clear regional differences in neuronal migration profiles, for example, in the times required for cells to reach the top of the CP, even where there is an underlying ventricular surface, when mitotic cells on the ventricular surface are selectively labeled with FT.
Figure 2.

Regional differences in neuronal migration in the cerebral cortex revealed by FT
(A–C) To visualize the migration profile of the whole telencephalon, CFSE was injected into the ventricles of the E14.5 embryos, and 5-ethynyl-2′-deoxyuridine (EdU) was injected into the peritoneal cavity of the mother at the end of the surgery. Harvested at E16.5, many cells labeled with FT reach the superficial part of the CP in the dorsomedial cortex (cyan dotted line), whereas almost no cells reach the CP in the dorsolateral cortex (A, C). In the dorsolateral cortex, many neurons are just below the subplate (SP) (yellow dotted line). Such a clear difference in neuronal migration is not detected by EdU (B, C).
(D) FT labeling was performed at E14.0, and slice culture was prepared at E14.5. Labeled cells left the VZ and migrate in the MAZ in multipolar morphology (10:08–25:21). They gradually acquire polarity and migrate in the intermediate zone (IZ) (20:17–30:25), reaching points just below the SP (the relatively dark band in the transmitted light channel, highlighted by white arrows). Neurons in the dorsomedial cortex (more medial than the magenta arrow) migrate smoothly to reach the most superficial part of the cortical plate (25:21–30:25), whereas in the dorsolateral cortex (more lateral than the magenta arrow), neurons seem to sojourn transiently below the SP (clear in the regions lateral to the magenta arrow; 30:25–35:29). These cells subsequently migrate into the CP in locomotion mode (35:29–40:34).
(E) FAST 3D imaging of E16.5 brains in which FT labeling was performed at E14.5. Anterior and posterior representative sections are shown in addition to a section at the interventricular foramen. Video S1 shows a 3D video taken from this brain. M, medial; L, lateral; D, dorsal; V, ventral. Scale bars: 200 μm in (A–C and E) and 100 μm in (D).
See also Figure S2.
To compare migration profiles visualized with FT with those visualized with thymidine analogs, EdU was co-administered with FT. The distribution of EdU-positive cells was similar to that reported previously (Bayer and Altman, 1991). As expected, we found no clear difference between the distributions of labeled cells in the dorsomedial and dorsolateral regions when examined where there was an underlying VZ (Figures 2B and 2C). A small number of EdU-positive GABAergic interneurons were distributed sparsely, mainly in the multipolar cell accumulation zone (MAZ) and IZ (Figure S2). The EdU-labeled neurons in the dorsolateral CP (Figure 2B) should have passed the SP to enter the CP earlier than the FT-labeled cells (Figure 2A), although the M-phase-labeled (FT-labeled) cells should have started migration earlier than the S-phase-labeled (EdU-labeled) cells if they were labeled in the VZ. Therefore, EdU-labeled neurons in the dorsolateral CP in Figure 2B would have been in the S-phase in the SVZ at the time of FT labeling and EdU administration. We previously reported that a mitotically active population leaving the VZ (rapidly exiting population [REP]) (Tabata et al., 2009), most of which corresponds to the basal and glial progenitors (Tabata et al., 2009, 2012), is more abundant in the dorsolateral cortex than in the dorsomedial cortex. This population would have contributed to the EdU-labeled cells in the dorsolateral CP.
To further characterize these regional differences, we performed time-lapse imaging of the FT-labeled cells (Figure 2D). In the dorsolateral cortex, labeled cells left the VZ to enter and accumulate in the MAZ, a zone enriched in postmitotic multipolar cells (Tabata et al., 2009, 2012) (Figure 2D, 10:08–25:21). They then migrated through the IZ and transiently sojourned just below the SP (Figure 2D, 30:25–35:29) before entering the CP (Figure 2D, 40:34). This sojourning behavior below the SP corresponds to the stationary period (Ohtaka-Maruyama et al., 2018). It should be noted that this sojourning behavior was not clear in the dorsomedial cortex. To visualize the migratory profile in three dimensions (3D), we injected the dye at E14.5, fixed approximately 2 days later, and subjected the brains to 3D FAST imaging (Seiriki et al., 2017, 2019). The mediolateral difference in the migratory profile was preserved along the anteroposterior axis (Figure 2E, Video S1). The difference was somewhat clearer in the posterior cortex (presumptive retrosplenial-visual cortex) than in the anterior (presumptive medial prefrontal cortex—somatosensory cortex). These observations suggest that this mediolateral difference in neuronal migration profiles may, at least in part, result from a transient pause just below the dorsolateral SP.
Regional migratory/positional profiles differ from neuronal birthdates at the ventricular surface
It was previously reported that early- and late-born neurons migrate differently (Hatanaka et al., 2004). Do both early-born and late-born neurons show similar regional differences? Do regional differences have birthdate-dependent characters? To better understand the migration profiles of neurons born at different embryonic stages, we injected CFSE at E10.5, 11.5, 12.5 13.5, 14.5, 15.5, and 17.0 and fixed chronologically. Subsequent observations were carried out on the coronal section in which the interventricular foramen was visible.
E10.5 cohort
One day after injection, at E11.5, some labeled cells were already located in the PP in both the dorsomedial and dorsolateral cortex (Figures 3D, 3E, and S3A), although the PP was then very thin, especially in the dorsomedial cortex (Figure 3D). Many other labeled cells were still in the VZ, which consisted of densely packed, radially oriented (Boulder-Committee, 1970) Pax6-positive (Englund et al., 2005) nuclei of radial glia. Two days after injection, at E12.5, most of the labeled cells were in the PP (Figures 3A, 3D, 3E, and S3B). Mediolateral migratory differences were not clear in these observations.
Figure 3.

Cohort of cells born at E10.5
(A–E) Coronal sections of 12.5 (A), 13.5 (B), and 16.5 (C) brains labeled at E10.5. See also Figure S2 for coronal sections from E11.5 to 16.5, shown with FT and 4′,6-diamidino-2-phenylindole (DAPI). Higher-magnification micrographs from the dorsomedial cortex and dorsolateral cortices from E11.5 to 16.5 are shown in (D) and (E), respectively. As early as E11.5, some cells are found in the preplate (PP), which is very thin in the dorsomedial cortex, as well as in the VZ (D, E, Figure S3A). At E12.5, many cells are in the PP, sometimes in a tangential morphology (A, D, and E). At E13.5, CSPG and nuclear staining show that PP splitting proceeds in a lateral-to-medial direction, and the CP (asterisks) is observed in the dorsolateral cortex but not in the dorsomedial cortex (B). In the dorsomedial cortex, labeled cells are in the PP, often with a somewhat rounded morphology (D). In the dorsolateral cortex, on the other hand, many labeled cells are in the CP (shown with blue arrows) and MZ (E). Note that few cells are found below the CP, as identified by nuclear and CSPG staining (B, E, Figure S3C). At E14.5, a thin CP is also identified in the dorsomedial cortex (D, E, Figure S2D). Some labeled cells are seen in the deep part of the CP in the dorsomedial cortex, but many labeled cells are still in the MZ (D). In the dorsolateral cortex, many labeled cells are found near the boundary between the CP and SP (E, Figure S3D). At E15.5, labeled cells are found at the boundary between the SP and CP as well as in the MZ in the dorsomedial cortex (D, Figures S3E and S3E′), which is similar to the dorsolateral cortex of E14.5 (E, Figure S3D). In the E15.5 dorsolateral cortex, many labeled cells are in the CSPG-positive SP (D, E, Figures S3E and S3E′). At E16.5, in both the dorsomedial and dorsolateral cortices, labeled cells are mainly found in the SP (C, D, and E). Some cells are also found in the MZ (D, E, Figure S3G). Note that CSPG staining in the SP shows some double-track immunoreactivity strongly just above and below a distinct cell layer in the SP in the dorsal and dorsolateral cortex at E15.5–E16.5 (E). The emergence of the labeled cells in the SP seems to coincide with the emergence of a distinct layer. Scale bars: 200 μm in (A–C) and 50 μm in (D, E).
Three days after injection, at E13.5, chondroitin sulfate proteoglycan (CSPG) (Bicknese et al., 1994) and nuclear staining showed PP splitting proceeding in a lateral-to-medial direction, and the emergence of the CP was apparent in the dorsolateral cortex (asterisks in Figure 3B, blue arrows in Figure 3E) but not in the dorsomedial cortex (Figures 3B and 3D; the upper and lower borders of the nascent CP are shown by blue lines in Figures 3D and 3E), which is consistent with the lateral-to-medial neurogenic gradient. In the dorsolateral cortex, most of the labeled cells were in the CP and MZ, whereas in the dorsomedial cortex, most of the labeled cells were in the PP. Note that strongly labeled cells were hardly found in the SP just below the CP at E13.5 (Figures 3B, 3D, 3E, and S3C). At E14.5–15.5 in the dorsomedial cortex, labeled cells were found at the boundary between the SP and CP as well as in the MZ (Figures 3D, S3D, and S3E), which was similar to the dorsolateral cortex at E14.5 (Figures 3E and S3D). In the E15.5 dorsolateral cortex, many labeled cells were distributed in the CSPG-positive SP below the CP (Figures 3E and S3E). At E16.5, in both the dorsomedial and dorsolateral cortices, labeled cells were mainly found in the SP (Figures 3C–3E, and S3F) and were Tbr1 (Hevner et al., 2001)-positive (Figure S3G), suggesting that they are of pallial origin. Some cells were also found in the MZ (Figures 3C–3E, and S3G) and were also positive for Reelin (Ogawa et al., 1995) (Figures S3G), suggesting that FT labeling at E10.5 mainly labels Tbr1-positive SP cells and Cajal-Retzius cells. These observations suggest that at least some future SP neurons in the PP are in the CP and MZ when the CP begins to be formed. They might eventually move down to the SP layer in a lateral-to-medial fashion. This view is compatible with previous observations (Bayer and Altman, 1991; Osheroff and Hatten, 2009; Saito et al., 2019). Recent observations have shown that future SP neurons migrate tangentially in the PP (Pedraza et al., 2014; Saito et al., 2019), but FT failed to explicitly detect tangential migration of the future SP neurons, probably because FT labels the whole hemisphere.
In summary, the E10.5 cohort reached the PP in less than 1 day after they exited the VZ in both the dorsomedial and dorsolateral cortices. Among the E10.5 cohort, future SP neurons formed a distinct layer below the CP in a lateral-to-medial fashion, reflecting the well-described neurogenic gradient.
E11.5 cohort
As early as half a day after injection, at E12.0, most of the labeled cells were in the VZ, and some cells were in the CSPG-positive PP in both the dorsomedial (Figure 4D, arrowhead in Figures 4D and S4A) and dorsolateral cortices (Figure 4E, arrowheads in Figures 4E and S4A). At E12.5 and 13.0, more labeled cells were found in the PP in both dorsomedial (Figures 4A, 4D, S4B, and S4C) and dorsolateral cortices (Figures 4A, 4E, S4B, and S4C) and in the VZ. Many labeled cells had reached points just beneath the meninges. At E13.5, in the dorsomedial cortex, where PP splitting has not yet occurred at this stage, many neurons were in the PP just beneath the meninges (Figures 4D and S4D). However, in the dorsolateral cortex, where the PP was split, many labeled cells showed radial (parallel to the apicobasal axis) alignment in the newly formed CP (Figures 4E and S4D). The formation of the CP coincided with this radial alignment of the labeled cells at E13.5 in the dorsolateral cortex and at E14.5 in the dorsomedial cortex (Figures 4D, 4E, and S4E). At E15.5, some cells were in the MZ, others remained in the deep part of the CP and expressed the deep-layer marker Ctip2 (Arlotta et al., 2005), and still others emerged below the CP (Figures 4C–4E and S4F–S4H).
Figure 4.

Cohort of cells born at E11.5
(A–E) Coronal sections of E12.5 (A), 13.0 (B), and 15.5 (C) brains, all labeled at E11.5. Higher-magnification micrographs from the dorsomedial and dorsolateral cortices of E12.5 through E15.5 are shown in (D) and (E), respectively. See also Figure S4 for low-magnification micrographs of brains fixed at E12.5 through E15.5. At E12.0, most of the labeled cells are in the VZ, and some cells are in the CSPG-positive PP in both the dorsomedial and dorsolateral cortices (D, E, arrowheads, Figure S4A). At E12.5 and 13.0, more labeled cells are found in the PP in both dorsomedial (A, B, D, Figures S4B and S4C) and dorsolateral cortices (A, B, E, Figures S4B and S4C). At E13.5, in the dorsomedial cortex, where PP splitting does not occur at this stage, many neurons reach the PP just beneath the meninges (D, Figure S4D). Many labeled cells are in the newly formed CP and intermediate zone (IZ) in the dorsolateral cortex (E, Figure S4D). At E14.5, many cells are in the newly formed CP in both the dorsomedial and dorsolateral cortices (D, E, Figure S4E). At E15.5, many cells are in the lower part of CP and, to a lesser extent, the MZ (C, D, E, Figures S4F–S4H). Some cells are also found in the SP in the dorsolateral cortex (C, E, Figures S4F and S4H).
Scale bars, 200 μm in (A–C) and 50 μm in (D, E).
In summary, the E11.5 cohort reached the PP soon after they exited the VZ in both the dorsomedial and dorsolateral cortices, similarly to the E10.5 cohort. Radial alignment occurred just below the meningeal surface in a lateral-to-medial fashion, in parallel with the formation of the CP. As in the E10.5 cohort, future SP neurons formed a distinct layer below the CP after the CP formed in the E11.5 cohort.
E12.5 cohort
As early as half a day after injection, at E13.0, many labeled cells were observed in the VZ, but a small number of labeled cells were also found in the PP in the dorsomedial cortex (Figures 5A, 5G, S5A, and S5G). The latter cells were often weakly positive for Pax6 (Figure S5G, arrowheads) (number of FT+/Pax6+ cells, 9.0 ± 2.0 cells [mean ± SEM]; dorsomedial low-power field, n = 4 brains). On the other hand, in the dorsolateral cortex, many labeled cells were in zones just above the VZ in addition to the VZ proper and were mostly negative for Pax6 (Figures 5A, 5H, S5A, and S5H; arrows). FT+/Pax6+ cells outside the VZ were relatively rare in the dorsolateral cortex (number of FT+/Pax6+ cells, 1.6 ± 0.8 cells; dorsolateral low-power field, n = 4 brains). One day after injection, at E13.5, in the dorsomedial cortex, more labeled cells were seen in the PP in addition to the VZ, and labeled cells in the PP were no longer positive for Pax6 (Figures 5B, 5G, and S5B). In the dorsolateral cortex, the incipient CP appeared at this stage (E13.5) (see also Figure 3B), and the majority of the labeled cells were below the CP and still migrating in the IZ (Figures 5B, 5H, and S5B). Some entered and were radially aligned in the CP; others were migrating in the IZ at E14.0 (Figures 5C, 5H, and S5C). In the dorsomedial cortex of E14.0, however, when the incipient CP is about to be formed, many labeled cells had already reached points just beneath the meningeal surface (Figures 5C, 5G, and S5C). The radial alignment of the labeled cells coincided with the formation of the CP at E14.5 in the dorsomedial cortex (2 days after injection) (Figures 5D, 5G, and S5D), as in the E11.5 cohort. Most of the labeled cells occupied the CP at E15.5 in both the dorsomedial and dorsolateral cortex (Figures 5E, 5G, 5H, and S5E), and some emerged in the SP at E16.5 in the dorsomedial cortex (Figures 5F, 5G, and S5F).
Figure 5.

Cohort of cells born at E12.5
(A–H) Coronal sections of E13.0 (A), 13.5 (B), 14.0 (C), 14.5 (D), 15.5 (E), and 16.5 (F), all brains labeled at E12.5. Higher-magnification micrographs from the dorsomedial cortex and dorsolateral cortex are shown in (G) and (H), respectively. In the dorsomedial cortex at E13.0, many labeled cells are in the VZ, but a small number of labeled cells are also found in the PP (A, G, Figure S5G). At E13.5, more labeled cells are in the PP in addition to the VZ in the dorsomedial cortex (B, G). At this stage, the incipient CP appears in the dorsolateral cortex, and many labeled neurons are migrating in the IZ (B, H). In the dorsomedial cortex of E14.0, when the incipient CP is beginning to form, some labeled cells reach points just beneath the meningeal surface, whereas others seem to be still migrating (C, G). In the dorsolateral cortex, many neurons reach the superficial part of the CP, whereas others continue migrating in the IZ and CP (C, H). At E14.5, labeled cells in the dorsomedial cortex begin to be oriented radially just beneath the MZ (D, G). In the dorsolateral cortex, many strongly labeled cells are in the CP in addition to the IZ (D, H). At E15.5, most of the labeled cells distribute not only the superficial CP but also in the deep part of the CP in both the dorsomedial and dorsolateral CP, suggesting that some begin to move deeper (E, G, H). At E16.5, the main population of the labeled cells is in the somewhat deeper part of the CP in both the dorsomedial and dorsolateral cortices. In the dorsomedial cortex, many labeled cells are also distributed in the SP. Scale bars: 200 μm in (A–F) and 50 μm in (G, H).
Taken together, the results suggest slight signs of mediolateral differences in the migration profiles of neurons labeled at E12.5, that is, the dorsomedial E12.5 cohort reached the outermost region of the PP just beneath the pial surface relatively soon after leaving the VZ, whereas the dorsolateral E12.5 cohort migrated slowly in the lower part of the PP or IZ before they entered the CP. Radial alignment of the labeled cells, on the other hand, occurred in a lateral-to-medial fashion in parallel with the formation of the CP.
E13.5 cohort
Half a day after injection, at E14.0, most of the labeled cells were in or just above the VZ, that is, the MAZ, a zone enriched in postmitotic multipolar cells (Tabata et al., 2009, 2012), in both the dorsomedial and dorsolateral cortex (Figures S6A, S7A, and S7B). One day after injection, at E14.5, many labeled neurons were migrating in the IZ below the CSPG-positive SP (Figures S6B, S7A, and S7B). One and a half days after injection, at E15.0, many labeled cells reached the top of the CP in the dorsomedial cortex (Figures S6C and S7A), whereas in the dorsolateral cortex, few cells reached the CP and many cells were still migrating in the superficial IZ or beneath the SP (Figures S6C, S6H, and S7B). In the dorsolateral cortex, it was at E15.5–16.5 when most of the labeled cells reached the superficial CP (Figures S6D, S6E, and S7B). These observations suggest clear regional differences in the times required for neurons to reach the CP in the E13.5 cohort. At E16.5, E17.5, and E18.5, labeled neurons were overtaken by neurons presumptively born later and settled in the deep part of the CP (Figures S6E–S6G, S7A, and S7B) in both the dorsomedial and dorsolateral cortices. In the ventrolateral cortex, some labeled neurons were still in the reservoir, and others had migrated out of the reservoir to the insular and piriform CP (Figure S6G, G1) at E17.5, compatible with a previous observation that neurons that migrate along the LCS take longer to reach their final destinations (Bayer and Altman, 1991). Labeled neurons were also observed in the presumptive CAS (Remedios et al., 2007) (Figure S6G2).
To characterize the regional differences quantitatively, we counted the proportion of FT-labeled cells in the CP at E15.0. Consistent with the above description, significantly more neurons were observed in the CP in the dorsomedial cortex than in the dorsolateral cortex (Figure S6H).
In summary, cells labeled at E13.5 reached points just beneath the meningeal surface in approximately 1.5 days in the dorsomedial cortex, whereas those in the dorsolateral cortex took longer to enter the CP and reach comparable locations. This areal difference was similar to that observed in the E14.5 cohort in Figure 2 and is likely explained, at least in part, by transient sojourning below the SP.
E14.5 cohort
Half a day after injection, at E15.0, most of the labeled cells were in the VZ (Figures 6A, 6H, 6I, and S8A). A small number of labeled cells had left the VZ mainly in the dorsolateral cortex (Figures 6H, 6I, and 6K) (dorsomedial, 3.7 ± 0.9 cells/low-power field, n = 3 brains; dorsolateral, 23.0 ± 3.5 cells/low-power field, n = 3 brains). They had long ascending processes and retraction bulbs and were mitotically active, as shown by Ki-67 immunoreactivity (Figure 6K), which presumably corresponds to the mitotically active REP that we reported previously (Tabata et al., 2009). They were also positive for the stem cell markers Pax6 and Sox2, although outside the VZ (Figure 6K) (Pax6 positive, dorsomedial, 91.7% ± 8.3%, 11 cells from 3 brains; dorsolateral, 80.8% ± 2.9%; 69 cells from 3 brains), suggesting that most of the cells in this population have features of mouse outer radial glial cells (moRG) (Shitamukai et al., 2011; Vaid et al., 2018; Wang et al., 2011). The progeny of this population was often difficult to identify, probably because the fluorescent signals decreased upon mitosis in the SVZ. One day after injection, at E15.5, the major population of labeled cells had left the VZ and accumulated in the MAZ (Figures 6B, 6H, 6I, and S8B). One and a half days after injection, at E16.0, most of the labeled cells had migrated in the IZ (Figures 6C, 6H, 6I, and S8C). Until this time point, the mediolateral migratory difference of the major population was not clear. However, 2 days after injection, at E16.5, many cells had reached the most superficial part of the CP in the dorsomedial cortex, whereas the majority were still migrating in the IZ just beneath the SP in the dorsolateral cortex (Figures 6D, 6H, 6I, and S8D), showing a clear mediolateral difference in migration. These observations are consistent with the view that mediolateral migratory differences are attributable to the migratory behavior of neurons in the dorsolateral IZ or just beneath the dorsolateral SP. In the dorsomedial cortex, most of the labeled cells settled in the most superficial CP, or PCZ, a zone composed of densely packed immature neurons (Sekine et al., 2011, 2012; Shin et al., 2019), at E16.5–17.5 (Figures 6D, 6E, 6H, S8D, and S8E). By E18.5, they were overtaken by presumptive later-born neurons and positioned in a slightly deeper part of the CP as NeuN-positive mature neurons in the dorsomedial cortex (Figures 6F, 6H, and S8F). In the dorsolateral cortex, one additional day was required for neurons to reach the CP (Figures 6E, 6I, and S8E) compared with dorsomedial neurons; they settled in the PCZ (indicated by the double-headed arrows in Figures 6G–6I) at E17.5–18.5 (Figures 6E, 6F, 6I, S8E, and S8F). At P0.5, they were positioned in a slightly deeper part of the CP as NeuN-positive mature neurons (Figure 6G) because of being overtaken by immature neurons in the PCZ. At P7, labeled neurons were mainly positioned in layers II/III in the dorsomedial and lateral cortices and in layer IV in the dorsolateral cortex (Figure S8H).
Figure 6.

Cohort of cells born at E14.5
(A–K) Coronal sections of E15.0 (A), 15.5 (B), 16.0 (C), 16.5 (D), 17.5 (E), 18.5 (F), and P0.5 (G) brains, all labeled at E14.5. Higher-magnification micrographs from the dorsomedial and dorsolateral cortices are shown in (H) and (I), respectively. Quantitative data of migratory profiles of the dorsolateral and dorsomedial cortices are shown in (J). Higher magnification of the apical part of the dorsolateral cortical wall of E15.0 (0.5 days after injection) brains is shown in (K). At E15.0, most of the labeled cells are in the VZ in both the dorsomedial and dorsolateral cortices (A, H, and I). Some labeled cells are located outside the VZ in the dorsolateral cortex (A, I, and K), but such cells are not frequently found in the dorsomedial cortex (A, H). The labeled cells located basally often have a long ascending process (red arrowheads, K, left) as well as some retraction bulbs (blue arrowheads) and are immunoreactive for Pax6, Sox2, and Ki-67 (yellow arrowheads, K, right). Note that the ascending processes are so long that it is difficult to observe their full length in the IZ crowded with radial fibers, which are also labeled with FT. At E15.5, most of the labeled neurons are in the MAZ with multipolar morphology in both the dorsomedial and dorsolateral cortices (B, H, and I). At E16.0, most of the labeled cells are in the IZ (C, H, and I). At E16.5 in the dorsomedial cortex, many cells reach the most superficial part of the CP (D, H). On the other hand, in the dorsolateral CP, most of the labeled cells migrate in the IZ just beneath the SP (D, I; see also Figures 2A and 2C). At E17.5, the vast majority of the labeled cells in the dorsomedial cortex are in the PCZ, which is the most superficial part of the CP (E, H). In the dorsolateral cortex, most of the labeled cells continue migrating in the CP (E, I). At E18.5, the labeled cells in the dorsomedial cortex are distributed not only in the PCZ but also in the slightly deeper part of the CP as NeuN-positive mature neurons (F, H). In the dorsolateral cortex, most of the labeled cells are in the PCZ (F, I). At P0.5, in the dorsolateral cortex, many labeled cells are distributed in the slightly deeper part of the CP as NeuN-positive mature neurons (G). Small double-headed arrows show the PCZ. A bin analysis was performed for these migration profiles by dividing the cortical wall between the top of the MZ and the ventricular surface into 10 equal areas (10 bins), and the proportion of FT-labeled cells in each bin was calculated from three or more different brains (J) (E15.0, n = 4 brains; E15.5, n = 3; E15.5, n = 3; E16.5, n = 4; E17.5, n = 3; E18.5, n = 3). ∗p < 0.05 (t test). Data are presented as mean ± SEM. At earlier stages, such as E15.0, cellular positions in the dorsomedial cortex are biased superficially because the dorsomedial cortex is thinner (Figure S8J).
Scale bars: 200 μm in (A–G), 50 μm in (H, I), and 10 μm in (K). See also Figures S6–S11.
In summary, labeled cells showed similar migratory profiles until they entered the IZ in both dorsolateral and dorsomedial cortices. In the dorsolateral cortex, cells pass the SP and enter the CP more slowly, compatible with our in vitro observations in Figure 2 and similar to the E13.5 cohort. This time lag to enter the CP was not caught up until they had settled in their final destinations. These observations suggest that regional differences in the migration patterns of the E14.5 cohort derive, at least in part, from transient sojourning in the IZ below the SP.
To validate these observations quantitatively, we performed a bin analysis of the migratory profiles of neurons labeled at E14.5, from E15.0 to E18.5 (Figure 6J). We used relative rather than definitive positions to correct for individual variations in brain thickness and variations due to artifacts of histological processing. Note that the cortical thickness increases as development proceeds (Figure S8J). FT-labeled dorsomedial neurons reached the superficial part of the cortex (bin8–10) at E16.5. At this stage, many labeled neurons in the dorsolateral cortex were still below bin 6, reflecting sojourning below the dorsolateral SP. They eventually migrated into the CP and settled in the most superficial part of the cortex at E17.5–18.5. We also calculated the proportion of FT-labeled cells in the CP at E16.5, when the mediolateral migratory difference was apparent. Significantly more neurons were in the CP in the dorsomedial cortex compared with the dorsolateral cortex (paired t test, p = 0.0043, n = 3 brains). These quantitative analyses supported the observation of regional differences in neuronal migration.
E15.5 cohort
Half a day after injection, at E16.0, many of the labeled cells were in the VZ (Figures S9A, S10A, and S11A). We also observed some cells outside the VZ (Figures S9A and S11A, arrowheads), which were often positive for Pax6, as in the E14.5 cohort. Around the pallial-subpallial boundaries (PSB) were scattered a small number of cells with single long ascending processes with various orientations (Figure S11B; similar cells were observed in the E17.0 cohort and analyzed in detail).
One day after injection, at E16.5, most of the labeled cells had accumulated in the MAZ both in the dorsomedial and dorsolateral cortex (Figures S9B, S10A, and S11A). At 1.5 days after injection, at E17.0, some labeled cells had entered the IZ, which is rich in L1-positive axons including thalamocortical and corticofugal axons (Fukuda et al., 1997; Kudo et al., 2005; Yoshinaga et al., 2012), both in the dorsomedial and dorsolateral cortex (Figures S9C, S10A, and S11A). Two days after injection, at E17.5, most of the labeled cells had migrated in the superficial and deep part of the IZ in the dorsomedial cortex (Figures S9D and S10A), but in the dorsolateral cortex, migrating cells were mainly located in the deep part of the IZ (Figures S9D and S11B).
Three days after injection, at E18.5, most of the labeled cells were in the PCZ in the dorsomedial cortex (Figures S9E and S10A). On the other hand, in the dorsolateral cortex, only a small population of labeled cells had reached the PCZ, and others were still migrating in the CP and SP with a locomotion morphology (Figures S9E and S11A). In the dorsolateral cortex, one additional day was required for most to reach the PCZ, at P0.5 (Figures S9F and S11A).
At P1.5, cells labeled at E15.5 had settled in the GM both in the dorsomedial and dorsolateral cortices (Figures S9G, S10A, and S11A). In the dorsolateral cortex, some of these labeled cells had shifted to slightly deeper positions, thereby leaving the top of the CP, which was not prominently observed in the dorsomedial cortex (Figures S9G, S10A, and S11A).
These observations suggest mediolateral differences in migratory profiles in the E15.5 cohort, similar to those observed for the E13.5 and E14.5 cohorts.
E17.0 cohort
Half a day after injection, at E17.5, labeled cells were seen mainly in the VZ (Figures 7C and S12A). One to 1.5 days after injection, at E18.0–18.5, the main population of labeled cells had migrated out of the VZ into the MAZ (Figures 7C, 7D, S12B, and S12C). They entered the IZ 2 days after injection, at E19.0 (Figures 7C and S12D). In the dorsal part of the IZ/white matter (WM) at P1.0, we observed a band-like zone where cellular density was somewhat greater than in the deeper and more superficial parts of the IZ/WM (Figure 7A, inset). This slightly denser cellular zone in the IZ/WM was sandwiched by L1-positive axon bundles that were skewed. At this time point, some of the labeled cells were found in this cellular zone in the dorsal part of the IZ/WM (Figure 7A). We also observed a small number of labeled cells with single leading processes extending medially (Figures 7A and S12J). Most of the labeled cells at this stage were positive for the neuronal marker Hu (Figures S12J2–6). As late as P2.0, or 4 days after injection, labeled neurons began to migrate in the CP/GM with a bipolar morphology (Figures 7C and S12F). Approximately 5 or more days after injection, or later than P3.0, labeled cells settled in the PCZ, or the top of the GM, of the dorsal cortex (Figures 7C, S12G, and S12H). These cells had a pyramidal morphology and became positive for NeuN by P5.0 (Figure S12I), suggesting that they were indeed mature neurons.
Figure 7.

Cohort of cells labeled at E17.0
(A–C) Coronal sections of P1.0 (A) and P5.0 (B) brains labeled at E17.0. See also Figure S12 for lower-magnification micrographs of E17.5 through P5. Higher-magnification images of E17.5 through P5 from the dorsal cortex are shown in (C). At E17.5, most of the labeled cells are in the VZ (C). At E18.0, most of the labeled cells are in the VZ and MAZ (C). A small number of labeled cells are also found throughout the cortex sparsely (D). At E18.5, many labeled cells are found in the MAZ (C). Some labeled cells are sparsely distributed throughout the cortex. At E19.0, many cells enter the L1-positive IZ dorsally (C). A small number of cells are also found in the MZ and CP (F). At P1.0, many labeled cells are migrating in the IZ/white matter (WM) (A, C). Migrating cells form a slightly denser cellular structure (inset in A) sandwiched between L1-positive axon bundles (arrowheads in A). At P2.0, many neurons are migrating in the CP/cortical gray matter (GM) with a locomotion morphology (C). At P3.0, many labeled cells reach the dorsal PCZ (C). At P5.0, most of the labeled cells are in the most superficial part of the GM (B, C). Note that many cells are in the dorsal (and dorsolateral) cortex (yellow dotted line), and few cells are in the dorsomedial and lateral cortices.
(D–F) Analyses of GABAergic interneurons. Cells labeled with FT (CytoTell Blue) at E17.0 are sparsely distributed throughout the cortex at E18.0 (D, E), and they are mostly positive for GFP in GAD67-GFP mice (E). Labeled cells with similar morphologies are found in the MZ/Layer I and in the CP at E19.0 before the main population of labeled cells reaches the CP (F). Scale bars: 200 μm in (A, B, and D), 50 μm in (C, E), and 10 μm in (E3, E6, E9, F). ∗ indicates another brain on the same slide.
Collectively, labeled cells were mainly distributed dorsally, and only a few cells settled in the dorsomedial and lateral cortex. We did not observe clear sojourning just below the dorsal and dorsolateral SP as in the E13.5–15.5 cohort, but the appearance of a slightly dense zone consisting of migrating neurons may suggest sojourning and/or deceleration in the midst of migration in the IZ/WM. Axon bundles just above this zone may contain axons from the SP (Figures 7A and S12E, positive for Nurr1 and Cplx3).
Half a day after injection, at E17.5, some strongly labeled cells with long ascending processes were scattered around the PSB (Figure S12A), as with the E15.5 cohort (Figure S11B). As early as 1 day after injection, at E18.0, these cells were distributed throughout the cortex (Figures 7D and S12B). This population was mostly negative for the radial glial marker Pax6 (Figures 7C, S12A, and S12B), the glial lineage markers Gfap, Sox10 (Stolt et al., 2002; Zhou et al., 2000), and Olig2 (Tatsumi et al., 2018) (except for the ventromedial cortex) (data not shown). However, they were positive for GFP in GAD67-GFP mice (Figure 7E), suggesting that they were GABAergic interneurons. Some of these cells were positive for the caudal ganglionic eminence -derived interneuron markers Htr3a (Murthy et al., 2014) and Couptf2 (Kanatani et al., 2008, 2015), whereas others were negative, suggesting that they constitute a heterogeneous population. In addition, a few were positive for bromodeoxyuridine (BrdU) administered at E13.5, suggesting that at least some of these cells underwent final mitosis days before E17.0. These observations raise the possibility that the FT-labeled interneurons that leave the VZ earlier than the main population of FT-labeled cells are not labeled with FT at mitosis but are labeled after they become postmitotic. Labeled cells with similar morphologies were found in the MZ/Layer I and CP before the main population of the labeled cells reached the CP (Figures 7F and S12C–S12E).
We present schematic migratory profiles of the main population labeled with FT at different embryonic days in Figures 9A, 9B, and 9F.
Figure 9.

Schematic representation of migratory profiles of the main population labeled at different embryonic stages
(A) Cells labeled at very early stages (E10.5–E11.5) enter the PP soon after they leave the VZ. They next position in the incipient CP and MZ. They then move down their somata deeply to locate below the CP, or in the SP, in a lateral-early to medial-late fashion. At these stages, Cajal-Retzius cells are also labeled.
(B) Cells labeled at early to late stages (E13.5–E15.5) enter and accumulate in the MAZ. Neurons labeled at E14.5, for example, migrate in the IZ superficially and reach the CP early in the dorsomedial cortex. In the dorsolateral cortex, they sojourn transiently below the SP before entering the CP. After reaching the PCZ, labeled neurons are overtaken by newly arriving neurons. This is not clear in the dorsomedial neurons labeled at E15.5 (Figure S10A), probably because few neurons labeled later distribute in this region (Figure 7B, ∗).
(C) A hypothetical mechanism of regional differences in neuronal migration at these stages. The SP neurons (or some other structures in the SP) transiently decelerate the migration of neurons in the dorsolateral cortex.
(D) Migratory profiles in reeler brains labeled at E14.5; the SP neurons are mispositioned above the CP as superplate neurons.
(E) Migratory profiles in Gbx2 −/− brains labeled at E14.5. The thalamocortical axons are almost absent in the cortex of Gbx2 −/− brains.
(F) Cells labeled at very late stages (E17.0) migrate slowly through the MAZ and a dense cellular structure in the dorsal IZ or WM. Most of the labeled cells settle in the most superficial part of the dorsal GM.
Mechanisms of regional differences in neuronal migration
Finally, we sought to gain insight into the mechanisms of regional differences in neuronal migration. We focused on sojourning just below the SP in the E14.5 cohort. Based on our observations in Figure 2, we hypothesized that SP neurons or other structures in the SP transiently decelerate the migration of later-born neurons in the dorsolateral cortex (Figure 9C). First, to see if the SP neurons regulate the migration of neurons born at E14.5, we used reeler mice, in which SP neurons that are normally positioned below the CP are mispositioned above the CP, as revealed by Nurr1 staining (Figures 8A–8D) (Hoerder-Suabedissen et al., 2009; Ozair et al., 2018; Pedraza et al., 2014). FT labeling was performed at E14.5, and the brains were harvested at E16.5. Compared with wild-type, the mediolateral migratory differences were less clear in reeler mice (Figures 8A and 8B). In reeler mice, after neurons enter the CP, they often stop along the internal plexiform zone (Tabata and Nakajima, 2002). We believe that this resulted in the deceleration of the migration of dorsomedial neurons. In fact, we observed that FT-labeled cells tended to position along the internal plexiform zone in the dorsomedial cortex (Figure S13A). To evaluate the regulatory functions of the dorsolateral SP neurons on the profiles of migrating neurons, we examined whether there was earlier entry of migrating neurons into the CP in reeler mice in the dorsolateral cortex. We performed a bin analysis of dorsolateral migrating neurons of E16.5 reeler and control mice in which FT was applied at E14.5. In reeler mice, we observed more labeled neurons in bin 6 (Figure 8E), which roughly corresponds to the deep part of the CP of the reeler mice and the SP of the control mice (Figures 8C and 8D), suggesting that the absence of SP cells beneath the CP in reeler mice caused the earlier entry of migrating neurons into the CP (Figures 8B, 8D, and 9D).
Figure 8.

Regional differences in neuronal migration in reeler mutants and Gbx2 −/− mice
(A–E) In wild-type brains, Nurr1+ cells are observed in the SP (A), whereas in reeler mice, Nurr1+ cells are mostly observed in the superplate or beneath the meninges (B). FT was performed at E14.5, and the brains were fixed at E16.5. In contrast to wild-type mice, which clearly show regional differences in neuronal migration (A), regional differences are not clear in reeler mice (B). The main population of labeled cells in the dorsolateral cortex is observed below the SP in the controls (C). In reeler mice, many neurons migrate in a zone that roughly corresponds to the deep part of the CP where SP neurons should normally position (D). Quantitatively, we observed more labeled neurons in bin 6 (E) of reeler mice (rl/rl: 20.2% ± 3.2%, 10 brains; control: 10.5% ± 2.6%, 8 brains [3 +/+ brains and 5 rl/+ brains] from 4 mother mice; p = 0.031, t test). Bins other than bin 6 and bin 3 (p = 0.014) did not reach statistical significance (p > 0.05). The sample numbers in the statistical analyses are the number of brains.
(F and G) In Gbx2 +/− brain, Netrin G1-positive thalamocortical axons run through the SP (F1). In Gbx2 −/− brain, Netrin G1-positive thalamocortical axons are almost absent in the cortex (F2). In both cases, many neurons are observed just beneath the SP. FT labeling was performed at E14.5, and the brains were fixed 50 h later. Coronal sections slightly caudal to the main part of the interventricular foramina are shown to confirm Netrin G1 immunoreactivity in the dorsal thalamus of Gbx2 −/− brains, where cortical Netrin G1 immunoreactivity was almost absent (positive control of Netrin G1 staining). M, medial; L, lateral; D, dorsal; V, ventral. Scale bars: 200 μm in (A, B, F, G) and 50 μm in (C, D).
See also Figures S13. Data are presented as mean ± SEM.
Thalamocortical axons run to the SP at this stage (Figure 8F1). To determine whether the thalamocortical axons (Bicknese et al., 1994; Molnár et al., 1998) regulate neuronal migration, we used a Crispr-Cas9-based improved genome editing via oviductal nucleic acids delivery (i-GONAD) (Gurumurthy et al., 2019; Ohtsuka et al., 2018; Takabayashi et al., 2018) to generate Gbx2 knockout mice (Figures S13B and S13C), which lack thalamocortical axons (Hevner et al., 2002; Miyashita-Lin et al., 1999). Gbx2 knockout mice provide a great opportunity to study the role of thalamocortical axons in the regulation of cortical neuron migration, because Gbx2 is expressed in the dorsal thalamus but not in the cortex (Miyashita-Lin et al., 1999). As expected, immunoreactivity against the thalamocortical axon marker Netrin G1 (Nakashiba et al., 2002; Vue et al., 2013) was almost absent in the homozygous mice (Figure 8G1). In these mice, we performed FT labeling at E14.5 and harvested 50 h later. FT-labeled migrating neurons showed a migration profile almost identical to that of the control brains (Figures 8F, 8G, and 9E), suggesting that thalamocortical axons are not likely to regulate neuronal migration around the SP.
Taken together, these observations are compatible with the notion that the SP neurons or some other structures in the SP transiently decelerate the migration of later-born neurons in the dorsolateral cortex, although further analyses of other structures in the SP are warranted, as well as of cell-autonomous regulation of neuronal migration, which differs among cortical regions. Further direct observations, including those in brains in which SP cells are specifically and efficiently ablated, are required to draw a conclusion.
Discussion
Using FT technology, we demonstrated clear regional differences in neuronal migration in the pallium, even where there is an underlying VZ. The regional differences were dependent on the embryonic stages when the apical radial glial cells divide at the ventricular surface to produce neuronal progenitors and neurons. In the E10.5 and E11.5 cohorts, regional differences in neuronal migration, defined in the current study as movement from mitosis at the ventricular surface to settlement just beneath the meningeal surface, were not clear. In the E12.5 cohort, we described slight regional differences. In the E13.5, E14.5, and E15.5 cohorts, neurons in the dorsomedial cortex reached the top of the CP about 1 day earlier than those in the dorsolateral cortex. In the E17.0 cohort, we observed that labeled neurons were positioned nearly dorsally. We also observed migratory behavior in a subpopulation of the labeled cells, for example, in mitotically active Pax6-positive cells that leave the VZ as early as 0.5 days after labeling in the E14.5 cohort (Figures 6A, 6I, 6K, and S8A). These comprehensive descriptions provide basic information about cortical development.
How are the regional differences formed? Time-lapse imaging suggested that cells labeled at E14.5 in the dorsolateral cortex stop transiently below the SP, whereas those in the dorsomedial cortex do not (Figure 2D). It is known that SP neurons interact with later-born neurons (Ohtaka-Maruyama et al., 2018). In reeler mice, we observed that more migrating neurons had already entered a zone where SP cells would normally be located in wild-type mice when most of the migrating neurons in wild-type control brains were still migrating below the SP (Figures 8B, 8D, and 8E). These observations are compatible with the idea that SP cells transiently decelerate the migration of later-born neurons as part of normal migration. In addition to the SP neurons and thalamocortical axons, there are many other structures potentially relevant to the migratory difference: corticofugal axons (Denaxa et al., 2001), catecholaminergic axons (Lidov and Molliver, 1982), and radial-fiber bending (Mission et al., 1991; Saito et al., 2019) and branching (Takahashi et al., 1990) around the SP. In addition, we cannot exclude the possibility that cell-intrinsic mechanisms in migratory neurons are also involved. Further research, including in vivo transplantation and specific ablation of anatomical structures, would be needed to obtain mechanistic insights.
What is the physiological role of regional differences in migratory profiles? This regional difference in migratory profiles of the E14.5 cohort was clearly visualized with FT but less clearly with thymidine analogs, a standard approach to the study of neurogenic gradients. We thus think that our findings have a biological significance different from the neurogenic gradient. Migrating neurons receive synaptic contacts from the SP neurons when they pass the SP (Ohtaka-Maruyama et al., 2018). At the same stage, thalamocortical fibers wait in the SP (Lopez-Bendito and Molnar, 2003). Thus, if migrating neurons slow down beneath the dorsolateral SP, they have a greater chance of interacting with the SP and/or thalamic afferents. Along the developmental time axis, the regional difference in neuronal migration, including sojourning beneath the SP, was clear in cohorts that contained future layer IV neurons. Histologically, the dorsomedial cortex, where labeled cells did not clearly sojourn beneath the SP, is agranular and lacks a layer IV. The dorsolateral cortex, where cells sojourn just beneath the SP, corresponds to primary somatosensory areas, where layer IV neurons are predominant. These observations suggest that sojourning beneath the SP might be implicated in thalamocortical circuit formation and/or layer IV formation. In line with this, the role of the extracellular environment is estimated to be increasingly important in refining neuronal identity as they migrate and differentiate, especially in the E14-labeled future layer IV neurons (Telley et al., 2019). In addition, abnormal migration and positioning of neurons labeled at E14.0 using in utero electroporation (mainly future layer IV neurons) results in abnormal differentiation (Oishi et al., 2016a, 2016b).
PP splitting involves the establishment of the CP within the PP (Goffinet and Lyon, 1979; Marin-Padilla, 1971). It has been assumed that the cells in the earliest CP are future layer VI cells and that their active reorganization drives PP splitting (Nichols and Olson, 2010; Olson, 2014). However, it is also possible that some future SP neurons actively migrate away. In the present study, in the earliest cohorts, labeled cells were first observed in the PP and then in the CP and MZ upon the formation of the CP; finally, they moved down below the CP, supporting the downward movement of some SP neurons through the CP. This observation is compatible with previous descriptions using time-lapse imaging or in vivo observations in which future SP neurons are labeled with in utero electroporation (Saito et al., 2019), genetically (Lrp12/Mig13a-EGFP mice) (Schneider et al., 2011) and immunohistochemically (Hpca+/Reelin- and Eaac1+/Reelin-) (Osheroff and Hatten, 2009). Historical studies using 3H-TdR in cats (Luskin and Shatz, 1985) described future SP neurons transiently locating in the deep part of the histologically defined CP (Boulder-Committee, 1970) although Luskin and Shatz assumed that this is part of the SP. Bayer and Altman (1991) analyzed rats using 3H-TdR and suggested that the SP neurons temporarily reside in the CP. These observations suggest that at least some neurons in the earliest CP and MZ are future SP neurons. As FT might label only a subpopulation of cells in our study, we do not exclude the possibility that some earliest-born neurons form a distinct cell layer below the CP before or immediately after the CP forms.
Neurons labeled at E17.0 are mainly distributed dorsally and relatively rarely medially or laterally (Figure 7B). However, a small number of cells labeled at E17.0 were observed at E18–19 in the dorsomedial cortex as well (Figure S12J). Some might migrate to the subiculum and hippocampus; others might fan out sparsely in the cingulate and secondary motor cortices. Another possibility is that they divide abventricularly to lose fluorescence. Around this stage, gliogenesis accelerates, but it has been shown that there are many Hopx-positive neurogenic moRG in the medial cortex at this stage (Vaid et al., 2018). Another possibility is that they undergo programmed cell death. The fate of the majority of the dorsomedial E17.0 cohort remains to be determined.
Interneurons are born in the ganglionic eminences and the preoptic area. Ventral progenitors were also labeled with FT, but FT-labeled neurons rarely entered the cortex. This can be explained by frequent abventricular division in the ventral forebrain (Katayama et al., 2013; Tan et al., 2016; Tan and Shi, 2013) (Figures S1D and S1E). However, a small number of cortical GABAergic interneurons were labeled on E17 (Figures 7D and 7E) and presumably on E15.5 (Figure S11B), which distributed into the cortex within a day. One interpretation for this retaining of the label in interneurons in the E15.5 and E17 cohorts is that FT potentially labels a certain subpopulation that undergoes final mitosis relatively late for interneurons at the ventricular surface. Another interpretation is the labeling of migrating interneurons that undergo final mitosis earlier than dye injection. Ventricle-directed migration of interneurons, some of which touch the ventricular surface, was described from E13 in mice and E15 in rats (Nadarajah et al., 2002). If some of the migrating interneurons had touched the ventricular surface and been labeled with FT, FT-labeled interneurons should have been observed in our earlier cohort as well. In our E14.5 cohort, we observed some cells with long ascending processes that left the VZ earlier than the main population (Figures 6I and 6K). However, they were mostly positive for Pax6, a dorsal progenitor marker, suggesting that they are a different population. The origin of these interneurons labeled with FT on E15.5 and E17 remains to be determined.
In the E14.5–15.5 cohorts, we observed cells that had left the VZ within 0.5 days, mainly in the dorsolateral cortex. These cells have the distribution, migratory behavior, cycling features, and morphology of the REP earlier visualized by in utero electroporation and subsequent BrdU incorporation (Tabata et al., 2009). Many of these cells were positive for the radial glial markers Pax6 and Sox2 (Figure 6K), supporting the view that moRG cells comprise a subpopulation of the REP (Tabata et al., 2012). In the earlier cohort (labeled at E12.5, Figures 5G, S5G, and S5H), we also observed a similar Pax6-positive population that left the VZ early. This population, however, did not share the lateral-more to the medial-less gradient of distribution of the REP that we previously reported. In the early stages of corticogenesis, when the CP is not yet formed, migrating neurons show multipolar morphology (Hatanaka et al., 2004; Tabata and Nakajima, 2003) but they do not accumulate just above the VZ to form a clear MAZ. Because the accumulated multipolar cells were shown to serve as a fence to limit the apical border of the range of interkinetic nuclear migration (Watanabe et al., 2018), these Pax6-positive cells in our E12.5 cohort that leave the VZ soon and distribute sparsely may result from the presence of an inefficient fence limiting the apical border of the VZ. Conversely, we suppose that the REP and the moRG in later cohorts (E14.5 and 15.5) may have an active mechanism for passing the MAZ/SVZ.
The application of FT to visualize neuronal migration has several strengths over conventional methods. First, FT has the potential to detect differences in neuronal migration that cannot be detected by thymidine analogs. Second, this method enables the visualization of neuronal migration in the whole brain. This feature especially compliments the whole-brain 3D approach, including FAST (Seiriki et al., 2017, 2019). Third, the methodology is simple, and FT can be a versatile approach to study neuronal migration in the whole brain in healthy and disease model mice. On the other hand, FT has several technical limitations. First, tangential migration of projection neurons (e.g., lateral dispersion of the rostromedial telencephalic wall-derived future SP neurons [Pedraza et al., 2014], ventral streaming of pallial-derived, early embryonic PP neurons [Saito et al., 2019], and abnormal tangential migration of projection neurons [Pinheiro et al., 2011]) could not be efficiently visualized because FT labels mitotic cells on the ventricular surface throughout the brain. Second, the migration profile might be biased toward the slowly exiting population (Tabata et al., 2009) or the direct progeny of apical progenitors, because the fluorescence of the secondary proliferative population would decrease upon mitosis.
In summary, we applied FT to describe neuronal migration and described the migratory profiles of early- and late-born projection neurons in normal mouse cortical development. The labeling features of FT shed light on hitherto overlooked regional differences in neuronal migration profiles. This versatile approach would be useful in studying neuronal migration in disease models and transgenic animals.
Limitations of the study
The results of the FT experiments must be interpreted considering the following limitations. First, the mediolateral migratory difference is arguably not a true regional difference, but a simple reflection of the cortex being thinner medially. However, this is unlikely because the regional difference was preserved in the posterior cortex, where the thickness of the cortical wall is equivalent in the dorsomedial and dorsolateral cortices (Figure 2E, Video S1). Second, we measured developmental stages using embryonic days, but developmental stages are confounded with neurogenic gradients, which differ about 1 day mediolaterally (Takahashi et al., 1999). This point is especially important in discussing the regional differences in neuronal migration we observed in the E13.5 cohort. Cells labeled at E13.5 reached points just beneath the meningeal surface at approximately E14.5–15.0 in the dorsomedial cortex, upon formation of the CP (Figures S6B, S6C, and S7A). At this stage, somal translocation was previously observed (Nadarajah et al., 2001). It has also been reported that multipolar cells do not transform into bipolar locomotion cells before the CP forms (Hatanaka et al., 2004). In the dorsolateral cortex at this stage, in contrast, the CP structure is already formed, and labeled neurons need to transform from a multipolar migration mode to a bipolar locomotion mode (Figures S6B–S6D, and S7B). One may reason that this difference in migratory modes determines the mediolateral differences in neuronal migration profiles. However, this is unlikely because the mediolateral regional difference was also observed in the E14.5 and 15.5 cohorts when the dorsomedial CP is well developed.
Resource availability
Lead contact
Further information and requests for resources and reagents should be directed to and will be fulfilled by the Lead Contact, Kazunori Nakajima (kazunori@keio.jp).
Materials availability
This study did not generate new unique reagents. We did not deposit the Gbx2 knockout mice generated in the present study, because they were designed based on a mouse line Gbx2tm1Mrt (MGI:3665450) used in a previous study (Wassarman et al., 1997). Requests for the mice should be directed to the lead contact.
Data and code availability
This study did not generate/analyze datasets or code.
Methods
All methods can be found in the accompanying Transparent Methods supplemental file.
Acknowledgments
This work was supported by Grants-in-Aid for Scientific Research of the Ministry of Education, Culture, Sports, Science, and Technology (MEXT), Japan/Japan Society for the Promotion of Science, Japan, Grants-in-Aid for Scientific Research (KAKENHI) (JP17J05365, JP18K19379, JP19H05227, JP18K07855, JP19H01152, JP19K08306, JP20H03649, JP20H05688, JP16H06482, JP20K21467, JP20H00492, JP19H05217, JP18H05416), the Keio Gijuku Academic Development Funds, Keio Gijuku Fukuzawa Memorial Fund for the Advancement of Education and Research, Takeda Science Foundation, and, AMED, Japan (JP20dm0207061), and PRIME, AMED, Japan (JP19gm6310004, JP20gm6310004). S.Y. was a Research Fellow of Japan Society for the Promotion of Science from fiscal year (FY) 2017 to FY 2019.
We thank Drs. Ludovic Telley and Denis Jabaudon (University of Geneva) for technical advice and valuable discussions. We also thank Core Instrumentation Facility, Collaborative Research Resources, Keio University School of Medicine, Dr. Yoshifumi Takatsume, and distinguished technicians including Emiko Shimeno, Miki Sakota, Noriko Suzuki, Chisa Konno, and Maiko Saito for technical assistance. Greatest gratitude is expressed to all the members of Nakajima laboratory for the valuable advice, expertise, and encouragement.
Author contribution
Conceptualization, S.Y., K.K., and K.N.; Methodology, S.Y. M.T., A. Kasai., and H.H.; Investigation, S.Y., M.K., A. Kitazawa, K.I., and M.T.; Writing – Original Draft, S.Y.; Writing – Review & Editing, K.K. and K.N.; Visualization, S.Y., M.T., and A. Kasai; Supervision, K.-i.K. and K.N.; Funding Acquisition, S.Y., A. Kasai, H.H., K.-i.K., and K.N.
Declaration of interests
The authors declare no competing interests.
Published: April 23, 2021
Footnotes
Supplemental information can be found online at https://doi.org/10.1016/j.isci.2021.102277.
Contributor Information
Ken-ichiro Kubo, Email: ken16@jikei.ac.jp.
Kazunori Nakajima, Email: kazunori@keio.jp.
Supplemental information
Whole-brain imaging of migrating neurons after brains were FT-labeled at E14.5, fixed approximately 2 days later, and nuclear-stained with Hoechst. The video shows a series of coronal sections (1) in the posteroanterior (PA) direction from the occipital pole of the cortex to the frontal pole (FT only), (2) back in the AP direction slightly past the level of the interventricular foramen (FT + Hoechst), (3) in the PA direction to the presumptive frontal cortex (FT only), and (4) in the AP direction slightly past the interventricular foramen (FT + Hoechst).
References
- Anderson S.A., Eisenstat D.D., Shi L., Rubenstein J.L. Interneuron migration from basal forebrain to neocortex: dependence on Dlx genes. Science. 1997;278:474–476. doi: 10.1126/science.278.5337.474. [DOI] [PubMed] [Google Scholar]
- Angevine J.B., Jr., Sidman R.L. Autoradiographic study of cell migration during histogenesis of cerebral cortex in the mouse. Nature. 1961;192:766–768. doi: 10.1038/192766b0. [DOI] [PubMed] [Google Scholar]
- Arlotta P., Molyneaux B.J., Chen J., Inoue J., Kominami R., Macklis J.D. Neuronal subtype-specific genes that control corticospinal motor neuron development in vivo. Neuron. 2005;45:207–221. doi: 10.1016/j.neuron.2004.12.036. [DOI] [PubMed] [Google Scholar]
- Bayer S.A., Altman J. Raven Press; 1991. Neocortical Development. [Google Scholar]
- Bicknese A.R., Sheppard A.M., Leary D.D., Pearlman A.L. Thalamocortical axons extend along a chondroitin sulfate proteoglycan- enriched pathway coincident with the neocortical subplate and distinct from the efferent path. J. Neurosci. 1994;14:3500–3510. doi: 10.1523/JNEUROSCI.14-06-03500.1994. [DOI] [PMC free article] [PubMed] [Google Scholar]
- Boulder-Committee Embryonic vertebrate central nervous system: revised terminology. The Boulder Committee. Anat. Rec. 1970;166:257–261. doi: 10.1002/ar.1091660214. [DOI] [PubMed] [Google Scholar]
- Brodmann K. J.A. Barth; 1909. Vergleichende Lokalisationslehre der Großhirnrinde : in ihren Prinzipien dargestellt auf Grund des Zellenbaues. [Google Scholar]
- Bystron I., Rakic P., Molnar Z., Blakemore C. The first neurons of the human cerebral cortex. Nat. Neurosci. 2006;9:880–886. doi: 10.1038/nn1726. [DOI] [PubMed] [Google Scholar]
- Caviness V.S., Jr., Takahashi T., Nowakowski R.S. Numbers, time and neocortical neuronogenesis: a general developmental and evolutionary model. Trends Neurosci. 1995;18:379–383. doi: 10.1016/0166-2236(95)93933-o. [DOI] [PubMed] [Google Scholar]
- Denaxa M., Chan C.-H., Schachner M., Parnavelas J.G., Karagogeos D. The adhesion molecule TAG-1 mediates the migration of cortical interneurons from the ganglionic eminence along the corticofugal fiber system. Development. 2001;128:4635–4644. doi: 10.1242/dev.128.22.4635. [DOI] [PubMed] [Google Scholar]
- Englund C., Fink A., Lau C., Pham D., Daza R.A., Bulfone A., Kowalczyk T., Hevner R.F. Pax6, Tbr2, and Tbr1 are expressed sequentially by radial glia, intermediate progenitor cells, and postmitotic neurons in developing neocortex. J. Neurosci. 2005;25:247–251. doi: 10.1523/JNEUROSCI.2899-04.2005. [DOI] [PMC free article] [PubMed] [Google Scholar]
- Fietz S.A., Kelava I., Vogt J., Wilsch-Brauninger M., Stenzel D., Fish J.L., Corbeil D., Riehn A., Distler W., Nitsch R. OSVZ progenitors of human and ferret neocortex are epithelial-like and expand by integrin signaling. Nat. Neurosci. 2010;13:690–699. doi: 10.1038/nn.2553. [DOI] [PubMed] [Google Scholar]
- Fujita S. The matrix cell and cytogenesis in the developing central nervous system. J. Comp. Neurol. 1963;120:37–42. doi: 10.1002/cne.901200104. [DOI] [PubMed] [Google Scholar]
- Fukuda T., Kawano H., Ohyama K., Li H.-P., Takeda Y., Oohira A., Kawamura K. Immunohistochemical localization of neurocan and L1 in the formation of thalamocortical pathway of developing rats. J. Comp. Neurol. 1997;382:141–152. [PubMed] [Google Scholar]
- Goffinet A.M., Lyon G. Early histogenesis in the mouse cerebral cortex: a Golgi study. Neurosci. Lett. 1979;14:61–66. doi: 10.1016/0304-3940(79)95344-8. [DOI] [PubMed] [Google Scholar]
- Govindan S., Oberst P., Jabaudon D. In vivo pulse labeling of isochronic cohorts of cells in the central nervous system using FlashTag. Nat. Protoc. 2018;13:2297–2311. doi: 10.1038/s41596-018-0038-1. [DOI] [PubMed] [Google Scholar]
- Gurumurthy C.B., Sato M., Nakamura A., Inui M., Kawano N., Islam M.A., Ogiwara S., Takabayashi S., Matsuyama M., Nakagawa S. Creation of CRISPR-based germline-genome-engineered mice without ex vivo handling of zygotes by i-GONAD. Nat. Protoc. 2019;14:2452–2482. doi: 10.1038/s41596-019-0187-x. [DOI] [PubMed] [Google Scholar]
- Hansen D.V., Lui J.H., Parker P.R., Kriegstein A.R. Neurogenic radial glia in the outer subventricular zone of human neocortex. Nature. 2010;464:554–561. doi: 10.1038/nature08845. [DOI] [PubMed] [Google Scholar]
- Hatanaka Y., Hisanaga S., Heizmann C.W., Murakami F. Distinct migratory behavior of early- and late-born neurons derived from the cortical ventricular zone. J. Comp. Neurol. 2004;479:1–14. doi: 10.1002/cne.20256. [DOI] [PubMed] [Google Scholar]
- Haubensak W., Attardo A., Denk W., Huttner W.B. Neurons arise in the basal neuroepithelium of the early mammalian telencephalon: a major site of neurogenesis. Proc. Natl. Acad. Sci. U S A. 2004;101:3196–3201. doi: 10.1073/pnas.0308600100. [DOI] [PMC free article] [PubMed] [Google Scholar]
- Hendzel M.J., Wei Y., Mancini M.A., Van Hooser A., Ranalli T., Brinkley B.R., Bazett-Jones D.P., Allis C.D. Mitosis-specific phosphorylation of histone H3 initiates primarily within pericentromeric heterochromatin during G2 and spreads in an ordered fashion coincident with mitotic chromosome condensation. Chromosoma. 1997;106:348–360. doi: 10.1007/s004120050256. [DOI] [PubMed] [Google Scholar]
- Hevner R.F., Miyashita-Lin E., Rubenstein J.L. Cortical and thalamic axon pathfinding defects in Tbr1, Gbx2, and Pax6 mutant mice: evidence that cortical and thalamic axons interact and guide each other. J. Comp. Neurol. 2002;447:8–17. doi: 10.1002/cne.10219. [DOI] [PubMed] [Google Scholar]
- Hevner R.F., Shi L., Justice N., Hsueh Y., Sheng M., Smiga S., Bulfone A., Goffinet A.M., Campagnoni A.T., Rubenstein J.L. Tbr1 regulates differentiation of the preplate and layer 6. Neuron. 2001;29:353–366. doi: 10.1016/s0896-6273(01)00211-2. [DOI] [PubMed] [Google Scholar]
- Hicks S.P., D'Amato C.J. Cell migrations to the isocortex in the rat. Anat. Rec. 1968;160:619–634. doi: 10.1002/ar.1091600311. [DOI] [PubMed] [Google Scholar]
- His, W. (1889). Die Neuroblasten und deren Entstehung im embryonalen Mark, Vol 15 (S. Hirzel).
- Hoerder-Suabedissen A., Molnár Z. Development, evolution and pathology of neocortical subplate neurons. Nat. Rev. Neurosci. 2015;16:133–146. doi: 10.1038/nrn3915. [DOI] [PubMed] [Google Scholar]
- Hoerder-Suabedissen A., Wang W.Z., Lee S., Davies K.E., Goffinet A.M., Rakic S., Parnavelas J., Reim K., Nicolic M., Paulsen O. Novel markers reveal subpopulations of subplate neurons in the murine cerebral cortex. Cereb. Cortex. 2009;19:1738–1750. doi: 10.1093/cercor/bhn195. [DOI] [PubMed] [Google Scholar]
- Iacopetti P., Michelini M., Stuckmann I., Oback B., Aaku-Saraste E., Huttner W.B. Expression of the antiproliferative gene TIS21 at the onset of neurogenesis identifies single neuroepithelial cells that switch from proliferative to neuron-generating division. Proc. Natl. Acad. Sci. U S A. 1999;96:4639–4644. doi: 10.1073/pnas.96.8.4639. [DOI] [PMC free article] [PubMed] [Google Scholar]
- Kanatani S., Honda T., Aramaki M., Hayashi K., Kubo K., Ishida M., Tanaka D.H., Kawauchi T., Sekine K., Kusuzawa S. The COUP-TFII/Neuropilin-2 is a molecular switch steering diencephalon-derived GABAergic neurons in the developing mouse brain. Proc. Natl. Acad. Sci. U S A. 2015;112:E4985–E4994. doi: 10.1073/pnas.1420701112. [DOI] [PMC free article] [PubMed] [Google Scholar]
- Kanatani S., Yozu M., Tabata H., Nakajima K. COUP-TFII is preferentially expressed in the caudal ganglionic eminence and is involved in the caudal migratory stream. J. Neurosci. 2008;28:13582–13591. doi: 10.1523/JNEUROSCI.2132-08.2008. [DOI] [PMC free article] [PubMed] [Google Scholar]
- Katayama K., Imai F., Campbell K., Lang R.A., Zheng Y., Yoshida Y. RhoA and Cdc42 are required in pre-migratory progenitors of the medial ganglionic eminence ventricular zone for proper cortical interneuron migration. Development. 2013;140:3139–3145. doi: 10.1242/dev.092585. [DOI] [PMC free article] [PubMed] [Google Scholar]
- Kim J.-Y., Jeong H.S., Chung T., Kim M., Lee J.H., Jung W.H., Koo J.S. The value of phosphohistone H3 as a proliferation marker for evaluating invasive breast cancers: a comparative study with Ki67. Oncotarget. 2017;8:65064–65076. doi: 10.18632/oncotarget.17775. [DOI] [PMC free article] [PubMed] [Google Scholar]
- Kostovic I., Rakic P. Developmental history of the transient subplate zone in the visual and somatosensory cortex of the macaque monkey and human brain. J. Comp. Neurol. 1990;297:441–470. doi: 10.1002/cne.902970309. [DOI] [PubMed] [Google Scholar]
- Kowalczyk T., Pontious A., Englund C., Daza R.A., Bedogni F., Hodge R., Attardo A., Bell C., Huttner W.B., Hevner R.F. Intermediate neuronal progenitors (basal progenitors) produce pyramidal-projection neurons for all layers of cerebral cortex. Cereb. Cortex. 2009;19:2439–2450. doi: 10.1093/cercor/bhn260. [DOI] [PMC free article] [PubMed] [Google Scholar]
- Kudo C., Ajioka I., Hirata Y., Nakajima K. Expression profiles of EphA3 at both the RNA and protein level in the developing mammalian forebrain. J. Comp. Neurol. 2005;487:255–269. doi: 10.1002/cne.20551. [DOI] [PubMed] [Google Scholar]
- Lidov H.G.W., Molliver M.E. An immunohistochemical study of serotonin neuron development in the rat: ascending pathways and terminal fields. Brain Res. Bull. 1982;8:389–430. doi: 10.1016/0361-9230(82)90077-6. [DOI] [PubMed] [Google Scholar]
- Lopez-Bendito G., Molnar Z. Thalamocortical development: how are we going to get there? Nat. Rev. Neurosci. 2003;4:276–289. doi: 10.1038/nrn1075. [DOI] [PubMed] [Google Scholar]
- Luskin M.B., Shatz C.J. Studies of the earliest generated cells of the cat's visual cortex: cogeneration of subplate and marginal zones. J. Neurosci. 1985;5:1062–1075. doi: 10.1523/JNEUROSCI.05-04-01062.1985. [DOI] [PMC free article] [PubMed] [Google Scholar]
- Marin O., Rubenstein J.L. A long, remarkable journey: tangential migration in the telencephalon. Nat. Rev. Neurosci. 2001;2:780–790. doi: 10.1038/35097509. [DOI] [PubMed] [Google Scholar]
- Marin-Padilla M. Early prenatal ontogenesis of the cerebral cortex (neocortex) of the cat (Felis domestica). A Golgi study. Z. Anat. Entwicklungsgesch. 1971;134:117–145. doi: 10.1007/BF00519296. [DOI] [PubMed] [Google Scholar]
- Mayer C., Hafemeister C., Bandler R.C., Machold R., Batista Brito R., Jaglin X., Allaway K., Butler A., Fishell G., Satija R. Developmental diversification of cortical inhibitory interneurons. Nature. 2018;555:457–462. doi: 10.1038/nature25999. [DOI] [PMC free article] [PubMed] [Google Scholar]
- Mission J.-P., Austin C.P., Takahashi T., Cepko C.L., Caviness V.S., Jr. The alignment of migrating neural cells in relation to the murine neopallial radial glial fiber system. Cereb. Cortex. 1991;1:221–229. doi: 10.1093/cercor/1.3.221. [DOI] [PubMed] [Google Scholar]
- Miyashita-Lin E.M., Hevner R., Wassarman K.M., Martinez S., Rubenstein J.L. Early neocortical regionalization in the absence of thalamic innervation. Science. 1999;285:906–909. doi: 10.1126/science.285.5429.906. [DOI] [PubMed] [Google Scholar]
- Miyata T., Kawaguchi A., Saito K., Kawano M., Muto T., Ogawa M. Asymmetric production of surface-dividing and non-surface-dividing cortical progenitor cells. Development. 2004;131:3133–3145. doi: 10.1242/dev.01173. [DOI] [PubMed] [Google Scholar]
- Molnár Z., Adams R., Goffinet A., Blakemore C. The role of the first postmitotic cortical cells in the development of thalamocortical innervation in the reeler mouse. J. Neurosci. 1998;18:5746–5765. doi: 10.1523/JNEUROSCI.18-15-05746.1998. [DOI] [PMC free article] [PubMed] [Google Scholar]
- Moreno-Juan V., Filipchuk A., Antón-Bolaños N., Mezzera C., Gezelius H., Andrés B., Rodríguez-Malmierca L., Susín R., Schaad O., Iwasato T. Prenatal thalamic waves regulate cortical area size prior to sensory processing. Nat. Commun. 2017;8:14172. doi: 10.1038/ncomms14172. [DOI] [PMC free article] [PubMed] [Google Scholar]
- Murthy S., Niquille M., Hurni N., Limoni G., Frazer S., Chameau P., van Hooft J.A., Vitalis T., Dayer A. Serotonin receptor 3A controls interneuron migration into the neocortex. Nat. Commun. 2014;5:5524. doi: 10.1038/ncomms6524. [DOI] [PMC free article] [PubMed] [Google Scholar]
- Nadarajah B., Alifragis P., Wong R.O., Parnavelas J.G. Ventricle-directed migration in the developing cerebral cortex. Nat. Neurosci. 2002;5:218–224. doi: 10.1038/nn813. [DOI] [PubMed] [Google Scholar]
- Nadarajah B., Brunstrom J.E., Grutzendler J., Wong R.O., Pearlman A.L. Two modes of radial migration in early development of the cerebral cortex. Nat. Neurosci. 2001;4:143–150. doi: 10.1038/83967. [DOI] [PubMed] [Google Scholar]
- Nakashiba T., Nishimura S., Ikeda T., Itohara S. Complementary expression and neurite outgrowth activity of netrin-G subfamily members. Mech. Dev. 2002;111:47–60. doi: 10.1016/s0925-4773(01)00600-1. [DOI] [PubMed] [Google Scholar]
- Nichols A.J., Olson E.C. Reelin promotes neuronal orientation and dendritogenesis during preplate splitting. Cereb. Cortex. 2010;20:2213–2223. doi: 10.1093/cercor/bhp303. [DOI] [PMC free article] [PubMed] [Google Scholar]
- Noctor S.C., Martinez-Cerdeno V., Ivic L., Kriegstein A.R. Cortical neurons arise in symmetric and asymmetric division zones and migrate through specific phases. Nat. Neurosci. 2004;7:136–144. doi: 10.1038/nn1172. [DOI] [PubMed] [Google Scholar]
- Oberst P., Fievre S., Baumann N., Concetti C., Bartolini G., Jabaudon D. Temporal plasticity of apical progenitors in the developing mouse neocortex. Nature. 2019;573:370–374. doi: 10.1038/s41586-019-1515-6. [DOI] [PubMed] [Google Scholar]
- Ogawa M., Miyata T., Nakajimat K., Yagyu K., Seike M., Ikenaka K., Yamamoto H., Mikoshibat K. The reeler gene-associated antigen on cajal-retzius neurons is a crucial molecule for laminar organization of cortical neurons. Neuron. 1995;14:899–912. doi: 10.1016/0896-6273(95)90329-1. [DOI] [PubMed] [Google Scholar]
- Ohtaka-Maruyama C., Okamoto M., Endo K., Oshima M., Kaneko N., Yura K., Okado H., Miyata T., Maeda N. Synaptic transmission from subplate neurons controls radial migration of neocortical neurons. Science. 2018;360:313–317. doi: 10.1126/science.aar2866. [DOI] [PubMed] [Google Scholar]
- Ohtsuka M., Sato M., Miura H., Takabayashi S., Matsuyama M., Koyano T., Arifin N., Nakamura S., Wada K., Gurumurthy C.B. i-GONAD: a robust method for in situ germline genome engineering using CRISPR nucleases. Genome Biol. 2018;19:25. doi: 10.1186/s13059-018-1400-x. [DOI] [PMC free article] [PubMed] [Google Scholar]
- Oishi K., Aramaki M., Nakajima K. Mutually repressive interaction between Brn1/2 and Rorb contributes to the establishment of neocortical layer 2/3 and layer 4. Proc. Natl. Acad. Sci. U S A. 2016;113:3371–3376. doi: 10.1073/pnas.1515949113. [DOI] [PMC free article] [PubMed] [Google Scholar]
- Oishi K., Nakagawa N., Tachikawa K., Sasaki S., Aramaki M., Hirano S., Yamamoto N., Yoshimura Y., Nakajima K. Identity of neocortical layer 4 neurons is specified through correct positioning into the cortex. Elife. 2016;5:e10907. doi: 10.7554/eLife.10907. [DOI] [PMC free article] [PubMed] [Google Scholar]
- Olson E.C. Analysis of preplate splitting and early cortical development illuminates the biology of neurological disease. Front. Pediatr. 2014;2:121. doi: 10.3389/fped.2014.00121. [DOI] [PMC free article] [PubMed] [Google Scholar]
- Osheroff H., Hatten M.E. Gene expression profiling of preplate neurons destined for the subplate: genes involved in transcription, axon extension, neurotransmitter regulation, steroid hormone signaling, and neuronal survival. Cereb. Cortex. 2009;19(Suppl 1):126–134. doi: 10.1093/cercor/bhp034. [DOI] [PMC free article] [PubMed] [Google Scholar]
- Ozair M.Z., Kirst C., van den Berg B.L., Ruzo A., Rito T., Brivanlou A.H. hPSC modeling reveals that fate selection of cortical deep projection neurons occurs in the subplate. Cell Stem Cell. 2018;23:60–73. doi: 10.1016/j.stem.2018.05.024. [DOI] [PubMed] [Google Scholar]
- Pedraza M., Hoerder-Suabedissen A., Albert-Maestro M.A., Molnar Z., De Carlos J.A. Extracortical origin of some murine subplate cell populations. Proc. Natl. Acad. Sci. U S A. 2014;111:8613–8618. doi: 10.1073/pnas.1323816111. [DOI] [PMC free article] [PubMed] [Google Scholar]
- Pilaz L.J., Patti D., Marcy G., Ollier E., Pfister S., Douglas R.J., Betizeau M., Gautier E., Cortay V., Doerflinger N. Forced G1-phase reduction alters mode of division, neuron number, and laminar phenotype in the cerebral cortex. Proc. Natl. Acad. Sci. U S A. 2009;106:21924–21929. doi: 10.1073/pnas.0909894106. [DOI] [PMC free article] [PubMed] [Google Scholar]
- Pinheiro E.M., Xie Z., Norovich A.L., Vidaki M., Tsai L.H., Gertler F.B. Lpd depletion reveals that SRF specifies radial versus tangential migration of pyramidal neurons. Nat. Cell Biol. 2011;13:989–995. doi: 10.1038/ncb2292. [DOI] [PMC free article] [PubMed] [Google Scholar]
- Polleux F., Dehay C., Moraillon B., Kennedy H. Regulation of neuroblast cell-cycle kinetics plays a crucial role in the generation of unique features of neocortical areas. J. Neurosci. 1997;17:7763–7783. doi: 10.1523/JNEUROSCI.17-20-07763.1997. [DOI] [PMC free article] [PubMed] [Google Scholar]
- Price D.J., Aslam S., Tasker L., Gillies K. Fates of the earliest generated cells in the developing murine neocortex. J. Comp. Neurol. 1997;377:414–422. [PubMed] [Google Scholar]
- Rakic P. Specification of cerebral cortical areas. Science. 1988;241:170–176. doi: 10.1126/science.3291116. [DOI] [PubMed] [Google Scholar]
- Rakic P. A small step for the cell, a giant leap for mankind: a hypothesis of neocortical expansion during evolution. Trends Neurosci. 1995;18:383–388. doi: 10.1016/0166-2236(95)93934-p. [DOI] [PubMed] [Google Scholar]
- Remedios R., Huilgol D., Saha B., Hari P., Bhatnagar L., Kowalczyk T., Hevner R.F., Suda Y., Aizawa S., Ohshima T. A stream of cells migrating from the caudal telencephalon reveals a link between the amygdala and neocortex. Nat. Neurosci. 2007;10:1141–1150. doi: 10.1038/nn1955. [DOI] [PubMed] [Google Scholar]
- Saito K., Okamoto M., Watanabe Y., Noguchi N., Nagasaka A., Nishina Y., Shinoda T., Sakakibara A., Miyata T. Dorsal-to-Ventral cortical expansion is physically primed by ventral streaming of early embryonic preplate neurons. Cell Rep. 2019;29:1555–1567. doi: 10.1016/j.celrep.2019.09.075. [DOI] [PubMed] [Google Scholar]
- Sauer F.C. Mitosis in the neural tube. J. Comp. Neurol. 1935;62:377–405. [Google Scholar]
- Schneider S., Gulacsi A., Hatten M.E. Lrp12/Mig13a reveals changing patterns of preplate neuronal polarity during corticogenesis that are absent in reeler mutant mice. Cereb. Cortex. 2011;21:134–144. doi: 10.1093/cercor/bhq070. [DOI] [PMC free article] [PubMed] [Google Scholar]
- Seiriki K., Kasai A., Hashimoto T., Schulze W., Niu M., Yamaguchi S., Nakazawa T., Inoue K.I., Uezono S., Takada M. High-speed and scalable whole-brain imaging in rodents and primates. Neuron. 2017;94:1085–1100. doi: 10.1016/j.neuron.2017.05.017. [DOI] [PubMed] [Google Scholar]
- Seiriki K., Kasai A., Nakazawa T., Niu M., Naka Y., Tanuma M., Igarashi H., Yamaura K., Hayata-Takano A., Ago Y. Whole-brain block-face serial microscopy tomography at subcellular resolution using FAST. Nat. Protoc. 2019;14:1509–1529. doi: 10.1038/s41596-019-0148-4. [DOI] [PubMed] [Google Scholar]
- Sekine K., Honda T., Kawauchi T., Kubo K., Nakajima K. The outermost region of the developing cortical plate is crucial for both the switch of the radial migration mode and the Dab1-dependent "inside-out" lamination in the neocortex. J. Neurosci. 2011;31:9426–9439. doi: 10.1523/JNEUROSCI.0650-11.2011. [DOI] [PMC free article] [PubMed] [Google Scholar]
- Sekine K., Kawauchi T., Kubo K., Honda T., Herz J., Hattori M., Kinashi T., Nakajima K. Reelin controls neuronal positioning by promoting cell-matrix adhesion via inside-out activation of integrin alpha5beta1. Neuron. 2012;76:353–369. doi: 10.1016/j.neuron.2012.07.020. [DOI] [PMC free article] [PubMed] [Google Scholar]
- Shin M., Kitazawa A., Yoshinaga S., Hayashi K., Hirata Y., Dehay C., Kubo K.I., Nakajima K. Both excitatory and inhibitory neurons transiently form clusters at the outermost region of the developing mammalian cerebral neocortex. J. Comp. Neurol. 2019;527:1577–1597. doi: 10.1002/cne.24634. [DOI] [PubMed] [Google Scholar]
- Shitamukai A., Konno D., Matsuzaki F. Oblique radial glial divisions in the developing mouse neocortex induce self-renewing progenitors outside the germinal zone that resemble primate outer subventricular zone progenitors. J. Neurosci. 2011;31:3683–3695. doi: 10.1523/JNEUROSCI.4773-10.2011. [DOI] [PMC free article] [PubMed] [Google Scholar]
- Smart I.H. A pilot study of cell production by the ganglionic eminences of the developing mouse brain. J. Anat. 1976;121:71–84. [PMC free article] [PubMed] [Google Scholar]
- Smart I.H., McSherry G.M. Growth patterns in the lateral wall of the mouse telencephalon. II. Histological changes during and subsequent to the period of isocortical neuron production. J. Anat. 1982;134:415–442. [PMC free article] [PubMed] [Google Scholar]
- Smart I.H., Smart M. Growth patterns in the lateral wall of the mouse telencephalon: I. Autoradiographic studies of the histogenesis of the isocortex and adjacent areas. J. Anat. 1982;134:273–298. [PMC free article] [PubMed] [Google Scholar]
- Stolt C.C., Rehberg S., Ader M., Lommes P., Riethmacher D., Schachner M., Bartsch U., Wegner M. Terminal differentiation of myelin-forming oligodendrocytes depends on the transcription factor Sox10. Genes Dev. 2002;16:165–170. doi: 10.1101/gad.215802. [DOI] [PMC free article] [PubMed] [Google Scholar]
- Subramanian L., Bershteyn M., Paredes M.F., Kriegstein A.R. Dynamic behaviour of human neuroepithelial cells in the developing forebrain. Nat. Commun. 2017;8:14167. doi: 10.1038/ncomms14167. [DOI] [PMC free article] [PubMed] [Google Scholar]
- Tabata H., Kanatani S., Nakajima K. Differences of migratory behavior between direct progeny of apical progenitors and basal progenitors in the developing cerebral cortex. Cereb. Cortex. 2009;19:2092–2105. doi: 10.1093/cercor/bhn227. [DOI] [PubMed] [Google Scholar]
- Tabata H., Nakajima K. Efficient in utero gene transfer system to the developing mouse brain using electroporation: visualization of neuronal migration in the developing cortex. Neuroscience. 2001;103:865–872. doi: 10.1016/s0306-4522(01)00016-1. [DOI] [PubMed] [Google Scholar]
- Tabata H., Nakajima K. Neurons tend to stop migration and differentiate along the cortical internal plexiform zones in the Reelin signal-deficient mice. J. Neurosci. Res. 2002;69:723–730. doi: 10.1002/jnr.10345. [DOI] [PubMed] [Google Scholar]
- Tabata H., Nakajima K. Multipolar migration: the third mode of radial neuronal migration in the developing cerebral cortex. J. Neurosci. 2003;23:9996–10001. doi: 10.1523/JNEUROSCI.23-31-09996.2003. [DOI] [PMC free article] [PubMed] [Google Scholar]
- Tabata H., Nakajima K. Labeling embryonic mouse central nervous system cells by in utero electroporation. Dev. Growth Differ. 2008;50:507–511. doi: 10.1111/j.1440-169X.2008.01043.x. [DOI] [PubMed] [Google Scholar]
- Tabata H., Yoshinaga S., Nakajima K. Cytoarchitecture of mouse and human subventricular zone in developing cerebral neocortex. Exp. Brain Res. 2012;216:161–168. doi: 10.1007/s00221-011-2933-3. [DOI] [PMC free article] [PubMed] [Google Scholar]
- Takabayashi S., Aoshima T., Kabashima K., Aoto K., Ohtsuka M., Sato M. i-GONAD (improved genome-editing via oviductal nucleic acids delivery), a convenient in vivo tool to produce genome-edited rats. Sci. Rep. 2018;8:12059. doi: 10.1038/s41598-018-30137-x. [DOI] [PMC free article] [PubMed] [Google Scholar]
- Takahashi T., Goto T., Miyama S., Nowakowski R.S., Caviness V.S. Sequence of neuron origin and neocortical laminar fate: relation to cell cycle of origin in the developing murine cerebral wall. J. Neurosci. 1999;19:10357–10371. doi: 10.1523/JNEUROSCI.19-23-10357.1999. [DOI] [PMC free article] [PubMed] [Google Scholar]
- Takahashi T., Misson J.-P., Caviness V.S., Jr. Glial process elongation and branching in the developing murine neocortex: a qualitative and quantitative immunohistochemical analysis. J. Comp. Neurol. 1990;302:15–28. doi: 10.1002/cne.903020103. [DOI] [PubMed] [Google Scholar]
- Takahashi T., Nowakowski R.S., Caviness V.S., Jr. The leaving or Q fraction of the murine cerebral proliferative epithelium: a general model of neocortical neuronogenesis. J. Neurosci. 1996;16:6183–6196. doi: 10.1523/JNEUROSCI.16-19-06183.1996. [DOI] [PMC free article] [PubMed] [Google Scholar]
- Tamamaki N., Fujimori K.E., Takauji R. Origin and route of tangentially migrating neurons in the developing neocortical intermediate zone. J. Neurosci. 1997;17:8313–8323. doi: 10.1523/JNEUROSCI.17-21-08313.1997. [DOI] [PMC free article] [PubMed] [Google Scholar]
- Tamamaki N., Yanagawa Y., Tomioka R., Miyazaki J., Obata K., Kaneko T. Green fluorescent protein expression and colocalization with calretinin, parvalbumin, and somatostatin in the GAD67-GFP knock-in mouse. J. Comp. Neurol. 2003;467:60–79. doi: 10.1002/cne.10905. [DOI] [PubMed] [Google Scholar]
- Tan X., Liu W.A., Zhang X.J., Shi W., Ren S.Q., Li Z., Brown K.N., Shi S.H. Vascular influence on ventral telencephalic progenitors and neocortical interneuron production. Dev. Cell. 2016;36:624–638. doi: 10.1016/j.devcel.2016.02.023. [DOI] [PMC free article] [PubMed] [Google Scholar]
- Tan X., Shi S.-H. Neocortical neurogenesis and neuronal migration. Wiley Interdiscip. Dev. Biol. 2013;2:443–459. doi: 10.1002/wdev.88. [DOI] [PMC free article] [PubMed] [Google Scholar]
- Tatsumi K., Isonishi A., Yamasaki M., Kawabe Y., Morita-Takemura S., Nakahara K., Terada Y., Shinjo T., Okuda H., Tanaka T. Olig2-Lineage astrocytes: a distinct subtype of astrocytes that differs from GFAP astrocytes. Front. Neuroanat. 2018;12:8. doi: 10.3389/fnana.2018.00008. [DOI] [PMC free article] [PubMed] [Google Scholar]
- Telley L., Agirman G., Prados J., Amberg N., Fievre S., Oberst P., Bartolini G., Vitali I., Cadilhac C., Hippenmeyer S. Temporal patterning of apical progenitors and their daughter neurons in the developing neocortex. Science. 2019;364:eaav2522. doi: 10.1126/science.aav2522. [DOI] [PubMed] [Google Scholar]
- Telley L., Govindan S., Prados J., Stevant I., Nef S., Dermitzakis E., Dayer A., Jabaudon D. Sequential transcriptional waves direct the differentiation of newborn neurons in the mouse neocortex. Science. 2016;351:1443–1446. doi: 10.1126/science.aad8361. [DOI] [PubMed] [Google Scholar]
- Vaid S., Camp J.G., Hersemann L., Eugster Oegema C., Heninger A.-K., Winkler S., Brandl H., Sarov M., Treutlein B., Huttner W.B. A novel population of Hopx-dependent basal radial glial cells in the developing mouse neocortex. Development. 2018;145:dev169276. doi: 10.1242/dev.169276. [DOI] [PubMed] [Google Scholar]
- Vue T.Y., Lee M., Tan Y.E., Werkhoven Z., Wang L., Nakagawa Y. Thalamic control of neocortical area formation in mice. J. Neurosci. 2013;33:8442–8453. doi: 10.1523/JNEUROSCI.5786-12.2013. [DOI] [PMC free article] [PubMed] [Google Scholar]
- Wang X., Tsai J.W., LaMonica B., Kriegstein A.R. A new subtype of progenitor cell in the mouse embryonic neocortex. Nat. Neurosci. 2011;14:555–561. doi: 10.1038/nn.2807. [DOI] [PMC free article] [PubMed] [Google Scholar]
- Wassarman K., Lewandoski M., Campbell K., Joyner A.L., Rubenstein J.L., Martínez S., Martin G.R. Specification of the anterior hindbrain and establishment of a normal mid/hindbrain organizer is dependent on Gbx2 gene function. Development. 1997;124:2923–2934. doi: 10.1242/dev.124.15.2923. [DOI] [PubMed] [Google Scholar]
- Watanabe Y., Kawaue T., Miyata T. Differentiating cells mechanically limit the interkinetic nuclear migration of progenitor cells to secure apical cytogenesis. Development. 2018;145:dev162883. doi: 10.1242/dev.162883. [DOI] [PubMed] [Google Scholar]
- Yoshinaga S., Ohkubo T., Sasaki S., Nuriya M., Ogawa Y., Yasui M., Tabata H., Nakajima K. A phosphatidylinositol lipids system, lamellipodin, and Ena/VASP regulate dynamic morphology of multipolar migrating cells in the developing cerebral cortex. J. Neurosci. 2012;32:11643–11656. doi: 10.1523/JNEUROSCI.0738-12.2012. [DOI] [PMC free article] [PubMed] [Google Scholar]
- Zhou Q., Wang S., Anderson D.J. Identification of a novel family of oligodendrocyte lineage-specific basic helix-loop-helix transcription factors. Neuron. 2000;25:331–343. doi: 10.1016/s0896-6273(00)80898-3. [DOI] [PubMed] [Google Scholar]
Associated Data
This section collects any data citations, data availability statements, or supplementary materials included in this article.
Supplementary Materials
Whole-brain imaging of migrating neurons after brains were FT-labeled at E14.5, fixed approximately 2 days later, and nuclear-stained with Hoechst. The video shows a series of coronal sections (1) in the posteroanterior (PA) direction from the occipital pole of the cortex to the frontal pole (FT only), (2) back in the AP direction slightly past the level of the interventricular foramen (FT + Hoechst), (3) in the PA direction to the presumptive frontal cortex (FT only), and (4) in the AP direction slightly past the interventricular foramen (FT + Hoechst).
Data Availability Statement
This study did not generate/analyze datasets or code.