Abstract
Two new fluorescent probes based on 1,3-diphenylprop-2-en-1-one and on 1,5-diphenylpenta-2,4-dien-1-one structures are presented. Both probes posses one electron-donating dimethylamino group and one boronic acid group (electron-withdrawing group). The change between the neutral and the anionic form of the boronic acid group induced at high pH and/or in presence of sugar, induces optical changes for both probes. Spectroscopic data, pKa and dissociation constants for different monosaccharides are presented and discussed in terms of sugar detection.
For almost a decade, the development of synthetic chemosensors for saccharides using the boronic acid group has been the focus of many research groups.1-7 The boronic acids have the advantage of a reversible and fast equilibrium interaction with monosaccharides. In addition, the boronic acid group can be incorporated in many different systems giving large possibilities for the development of analytic devices for the recognition and detection of sugars. The development of these devices could find important applications, especially for diabetics. The actual technology of using enzymes for the sensing of glucose shows some limitations.8 For example, this technology is hardly applicable to implantable devices for continuous glucose monitoring in blood and/or in interstitial fluids.
The most promising probes developed to date are based on the boronic groups ability to increase its electrophilicity (acidity) in the presence of sugars. Probes using the photoinduced electron transfer based on the acid:base interaction between the boron group and an amino group has previously been developed.9,10 Most recently, we investigated the used of the electron-withdrawing property of the boronic group for the development of fluorescent probes based on the intramolecular charge transfer (ICT) mechanism.11-13 The change of charge between the neutral [R-B(OH)2] and the anionic [R-B(OH)3−] forms, at high pH and/or in presence of sugar, altered the electron-withdrawing property of the boron group and thus the spectral properties of the ICT of the excited state. Probes showing large intensity changes and/or wavelength shifts have been developed using the ICT mechanism.11-13
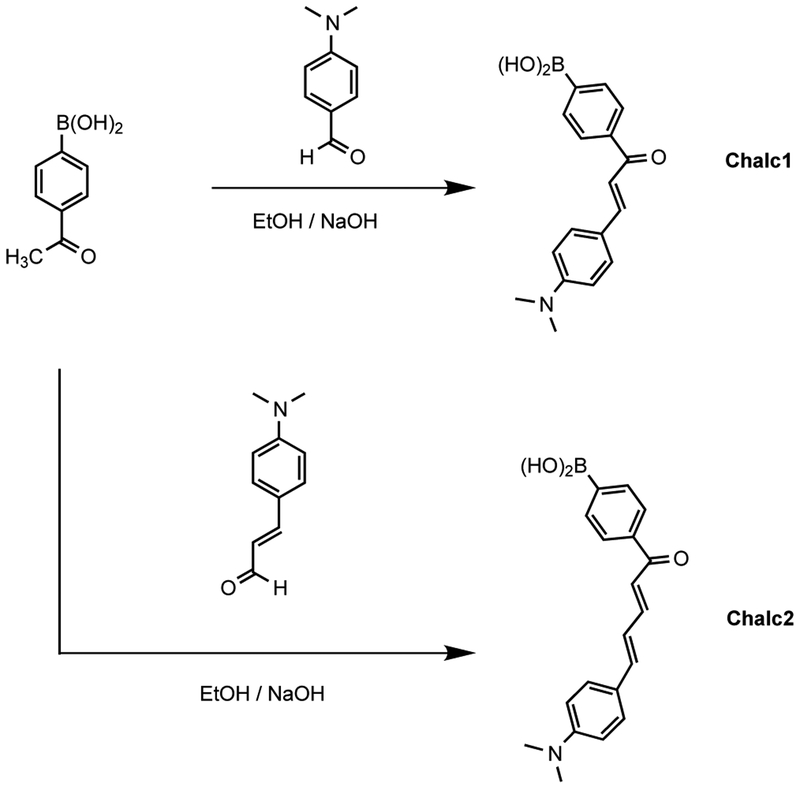
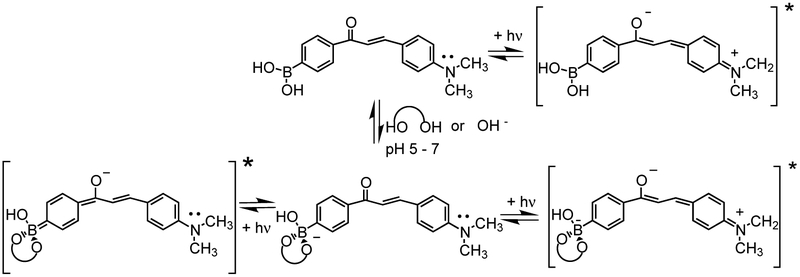
In this paper we report the incorporation and the subsequence influence of the boronic acid group on a fluorophore showing ICT between a dimethylamino (electron-donor) and a carbonyl (electron-withdrawing) group, Scheme 1. In these molecules, the boronic acid group does not directly participate in the ICT, Scheme 2. On the other hand, the boron group is in resonance with the electron-withdrawing group (the carbonyl in this case). Since the boronic acid group becomes an electron-donor under its anionic form,11-13 the competition between the boronate and the dimethylamino groups for the ICT is expected to produce spectral changes due to the perturbation of the ICT nature of the excited state.
Scheme 1.
Molecular structure of the investigated probes.
Scheme 2.
Ground and excited state electronic distributions involved in the neutral and anionic forms of the boronic acid group for Chalc1. For the case of interaction with OH−, the diol should be replaced by two -OH groups.
Scheme 1 shows the one-step synthetic pathway for both chalcone derivatives. Chalcone derivatives were prepared by the condensation reaction from the corresponding aldehydes and acetylphenylboronic acid, both commercially available. Reactions were carried at room temperature in ethanol with small amount of aqueous NaOH 10%. Spectroscopic data are in agreement with the molecular structure of both derivatives,14
Spectroscopic and photophysical data for Chalc1 and Chalc2 are shown in Table 1. The absorption spectrum of Chalc2 shows only a slight red shift in comparison with that obtained for Chalc1. On the other hand, the conjugation length shows more pronounced effect on the emission spectrum. Chalc1 shows very similar absorption and emission bands as compared with its analogue, that does not posses the boronic acid group, 3-[4′-(dimethylamino)phenyl]-1-phenyl-prop-2-en-1-one (Chalc),15 Chalc shows absorption and emission maxima at 418 and 552 nm in ethanol, respectively, with a ϕF of 0.011, in comparison to 414 and 545 nm with a ϕF of ~0.014 for Chalc1 in MeOH. This suggests that the presence of the boronic acid group, under its neutral form, has no major effect on the spectroscopic parameters of the probes.
Table 1.
Spectroscopic and photophysical parameters of Chalc1 and Chalc2 measured in phosphate buffer pH 7.0/MeOH 2:1 (v/v) at room temperature.
| Probe | λAbs (nm) | ε (M−1 cm−1) | λF (nm) | Δ (cm−1) | ϕF |
|---|---|---|---|---|---|
| Chalc1 | 438 | 21800 | 577 | 5500 | 0.007 |
| Chalc2 | 445 | 19050 | 663 | 7390 | 0.008 |
Δ: Stokes’ shift.
The intramolecular charge transfer (ICT) properties of the excited state were investigated by the effect of the polarity of the solvent on the absorption and emission bands. Both probes, Chalc1 and Chalc2, show bathochromic shifts in their absorption and emission bands with the increase of the polarity of the solvent. The shifts are more pronounced in the emission spectra than in the absorption spectra. The emission band of Chalc1 shows a red shift of ~3700 cm−1 from cyclohexane to water/methanol 2:1 (v/v), whilst a red shift of ~4260 cm−1 was typically observed for Chalc2. It is interesting to note that large Stoke’s shifts are desirable to maximize the wavelength split between the excitation and the detection emission wavelength to reduce as much as possible scattering and Raman scattering effects. Combined with the long wavelength of emission of the chalcones derivatives, both probes, Chalc1 and Chalc2, posses good spectral properties for a chemosensor. Only the low quantum yields of fluorescence of this family of dye could limit their usefulness.
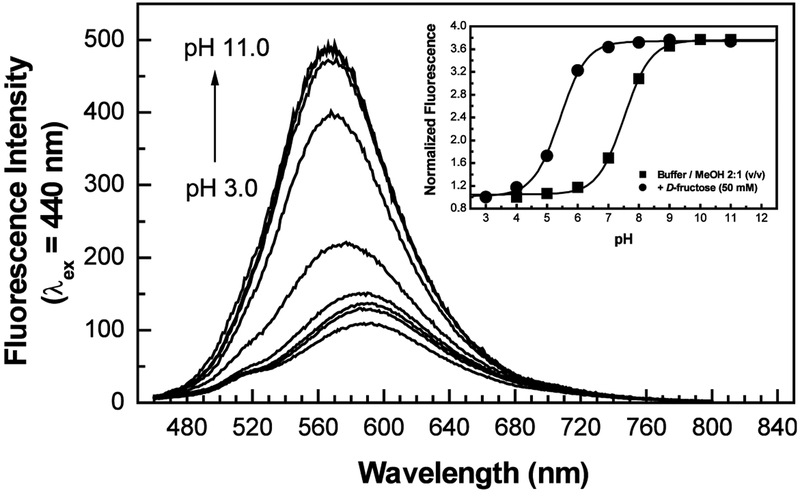
Fig. 1 shows the effect of the pH on the emission band of Chalc1. Similar effects were observed for Chalc2 (not shown) and no effect of the pH was observed in the absorption bands, for both compounds. As the pH increased, we observe an increase of the fluorescence intensity and a slight blue shift of the emission band. These spectral changes are thought to be induced by the formation of the anionic form of the boronic acid group as the pH increases.16 Similar effects have also been observed on electron donor/electron withdrawing derivatives of stilbenes,11 diphenylbutadiene,12 diphenylhexatriene12 and diphenyloxazole13 where the boronic acid group was directly involved in the ICT. For the later, the blue shift observed was much larger, ranging some 2000 to 2600 cm−1, in comparison with the blue shift observed for Chalc1, ~660 cm−1, and for Chalc2, ~560 cm-1. On the other hand, the increase of the intensity is larger for the chalcone derivatives than for the other derivatives, except for the diphenyloxazole derivative. For the four derivatives described above, the boronic acid functional group was the electron-withdrawing group, and given the charge change between the neutral and anionic forms of the boron group, one can clearly attribute this to the removal of the ICT property of the excited state. For the Chalc1 and Chalc2 derivatives, we interpret the blue shift and the increase of the intensity by a perturbation of the ICT. Since, the anionic form of the boronic acid group can act as an electron-donor group,11 at high pH, the electron withdrawing property of the carbonyl group should be decrease due to charge transfer and/or partial charge transfer from the boronate group to the carbonyl group, Scheme 2. The increase of the electronic density on the carbonyl group would decrease the ICT from the dimethylamino group and this is thought to be the origin of the spectral changes observed.
Figure 1.
Effect of pH on the emission spectrum of Chalc1. Insert, titration curves for Chalc1 as function of pH in absence and presence of fructose.
Titration curves as function of pH, for Chalc1, are shown in Fig. 1. Both derivatives show similar pKa values of 7.5 in the absence of sugar and 5.4 and 5.2 in the presence of fructose for Chalc1 and Chalc2, respectively. The pKa values for both chalcone derivatives are smaller in comparison with typical values of 8.8–9.2 in the absence of sugar and 6.0–6.6 in the presence of sugar.11,12,17,18 These lower values are attributed to the electron deficient phenyl ring which posses two electron withdrawing groups (boronic acid and carbonyl groups) causing an increase of the electrophilicity of the boron group. It is for this reason that the maximum changes between the titration curves without and with sugar were observed for pH 6.5, for both derivatives. The low pKa values allow sugar titration in the range of pH of 6 to 7 instead of the conventional pH range of 7 to 8. Such results are encouraging and this may well lead to downstream chemosensors for sugars.
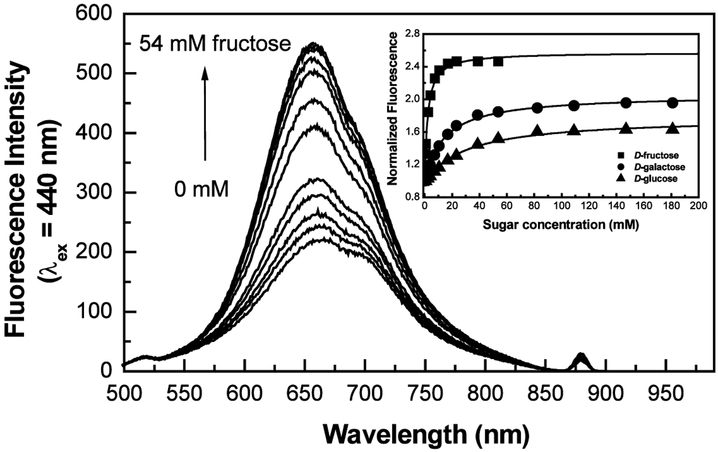
The effect of fructose on the emission spectrum of Chalc2 is shown in Fig. 2. An increase in the fluorescence intensity combined with a small blue shift is observed. Similar spectral changes were observed for Chalc1. At pH 6.5, a predominant neutral form of the boronic acid is present in solution, whilst in the presence of sugar, a predominant anionic form is present due to the decrease of the pKa of the boronic acid:sugar complex. As previously discussed for the pH effect, the change in charge of the boronic acid is thought to result in the spectral changes observed. As observed for the majority of monoboronic acid probes, Chalc1 and Chalc2 show a higher affinity for d-fructose (Kd = 2.5 for Chalc1 and 2.1 for Chalc2) and this affinity decrease for d-galactose (Kd = 16 for Chalc1 and 14 for Chalc2) and d-glucose (Kd = 34 for Chalc1 and 30 for Chalc2), respectively.7,9,11,16
Figure 2.
Effect of fructose on the fluorescence emission spectrum of Chalc2. Insert, titration curves of Chalc2 for various sugars, measured in phosphate buffer pH 6.5/MeOH 2:1 (v/v).
In summary, two new fluorescent probes have been presented for sugar signaling based on the ICT mechanism. To date, they are the longest wavelength probes for sugar involving ICT presented in the literature. Long-wavelength probes are highly desirable for biochemical analysis to decrease the interference of the autofluorescence background of biological samples. In addition, we demonstrated that the boronic acid group does not have to be directly involved in the charge transfer, as previously described for ICT probes for saccharides, to induce interesting spectral changes after sugar binding. This paves the way for the development of new synthetic probes for saccharides, Especially the use of near-infrared fluorophores that are not based on a direct ICT between an electron-donor and electron-withdrawing groups.
Acknowledgements
This work was supported by the Juvenile Diabetic Foundation International, 1-2000-546, with partial support from the NIH National Center for Research Resources, RR-08119. The authors also thank Dr. Chris Geddes for constructive discussion and for the review of the manuscript.
References
- 1.James TD; Sandanayake KS; Shinkai S Angew. Chem. Int., Ed. Engl 1996, 35, 1910–1922. [Google Scholar]
- 2.Hartley JH; James TD; Ward CJ J. Chem. Soc., Perkin Trans. 1 2000, 19, 3155–3184. [Google Scholar]
- 3.Yang W; He H; Drueckhammer DG Angew. Chem., Int. Ed 2001, 40, 1714–1718. [PubMed] [Google Scholar]
- 4.Eggert H; Frederiksen J; Morin C; Norrild JC J. Org. Chem 1999, 64, 3846–3852. [Google Scholar]
- 5.Kataoka K; Hisamitsu I; Sayama N; Okano T; Sakurai Y J. Biochem 1995, 117, 1145–1147. [DOI] [PubMed] [Google Scholar]
- 6.Pringsheim E; Terpetschnig E; Piletski SA; Wolfbeis OS Adv. Mater 1999, 11, 865–868. [Google Scholar]
- 7.Adhikiri DP; Heagy MD Tetrahedron Lett. 1999, 40, 7893–7896. [Google Scholar]
- 8.Heller A Annu. Rev. Biomed. Eng 1999, 1, 153–175. [DOI] [PubMed] [Google Scholar]
- 9.James TD; Sandanayake RS; Iguchi R; Shinkai SJ Am. Chem. Soc 1995, 117, 8982–8987. [Google Scholar]
- 10.Ward CJ; Patel P; Ashton PR; James TD Chem. Commun 2000, 3, 229–230. [Google Scholar]
- 11.DiCesare N; Lakowicz JR J. Phys. Chem. A 2001, 105, 6834–6840. [DOI] [PMC free article] [PubMed] [Google Scholar]
- 12.DiCesare N; Lakowicz JR J. Photochem. Photobiol. A 2001, 143, 39–47. [DOI] [PMC free article] [PubMed] [Google Scholar]
- 13.DiCesare N; Lakowicz JR Chem. Commun 2001, 19, 2022–2023. [DOI] [PMC free article] [PubMed] [Google Scholar]
- 14.Chalc1: orange solid (57%), mp 157–158°C. 1H NMR (CD3OD) δ (ppm) 3.01 (s, 6H) 6.79–8.05 (m, 10H). FAB-MS (glycerol matrix), m/z 352.2, [Chalc1++glycerol–2H2O]. Anal. calcd for C17H18BNO3: C, 69.18; H, 6.15; N, 4.75. Found: C, 68.47; H, 6.38; N, 4.53. Chalc2: dark red solid (40%), m.p. 266–267°C. 1H NMR (CD3OD) δ(ppm) 3.05 (s, 6H), 6.78–7.92 (m, 12H). FAB-MS (glycerol matrix), m/z 378.2, [Chalc2++glycerol-2H2O]. The elementary analysis of Chalc2 differ slightly from the expected values, but only one spot was observed on TLC and the sample shows to be spectroscopically pure.
- 15.Rurack K; Bricks JL; Reck G; Radeglia R; Resch-Genger U J. Phys. Chem. A 2000, 104, 3087–3109. [Google Scholar]
- 16.Lorand JP; Edwards JO J. Org. Chem 1959, 24, 769–774. [Google Scholar]
- 17.Yoon J; Czarnik AW J. Am. Chem. Soc 1992, 114, 5874–5875. [Google Scholar]
- 18.Shinmori H; Takeuchi M; Shinkai S J. Chem. Soc., Perkin Trans. 2 1996, 1, 1–4. [Google Scholar]


