The GRAPEX project focuses on the development of improved water management tools for vineyards.
As is the case in many parts of the world, agricultural production in California faces the dual challenges of growing demand for limited water resources and increasing interannual variability in rainfall and water availability. As a result, both the state and its agricultural community recognize the need to develop sustainable long-term water management strategies. For example, in response to the recent multiyear drought that has severely depleted both surface and groundwater stores, the California Department of Water Resources enacted the Sustainable Groundwater Management Act (SGMA) in 2014, mandating measures to curtail the severe overdraft of water in regions dependent on groundwater resources. At the same time, many in the agricultural community have taken proactive steps to develop and implement robust water management plans that both reduce consumptive water use and enhance resilience against future droughts and water shortages. As an example, producers of wine grapes—a California crop valued at nearly $6 billion annually—have actively sought tools to better monitor crop water status and manage water use.
Currently, the irrigation management decisions for many California crops are based on a combination of in situ observations of soil moisture, remote sensing–based estimates of normalized difference vegetation index (NDVI), and the application of the Food and Agriculture Organization of the United Nations (FAO) crop model using crop coefficients that have been tuned for specific crops (Allen et al. 1998). Unfortunately, these methods are not sufficiently robust, particularly for highly structured canopies such as vineyards and tree orchards. They cannot accurately separate crops and the combined interrow soil and cover crop water use, and the crop coefficients are not easily adjustable for stressed conditions (e.g., Ting et al. 2016). As a result, significant errors in the timing and amount of irrigation relative to crop water needs have led to an overprescription of irrigation applications. Moreover, later in the growing season when deficit irrigation is preferred to conserve water, ensure crop quality, or facilitate harvest, the current approach cannot reliably determine the degree of crop stress. This has led to the development of thermally based methods for irrigation scheduling (e.g., Bellvert et al. 2015, 2016)
In 2012, researchers from E. & J. Gallo Winery approached scientists with the U.S. Department of Agriculture Agricultural Research Service (USDA ARS) Hydrology and Remote Sensing Laboratory (HRSL) seeking advice on practical methods for using remote sensing from satellites or airborne systems to guide irrigation decisions. Critical decisions in wine grape production include when to begin irrigating in the spring and the timing and amount of water to apply during the growing season that balances vine health with carefully timed periods of mild stress to improve berry quality for wine production. Spatially detailed information regarding vine stress variations across the field is also needed to ensure the judicious application of water only where it is needed. The scientists at E. & J. Gallo Winery realized that accurate maps of evapotranspiration (ET) at daily to weekly increments and subfield spatial resolutions could help both reduce water use and enhance crop quality.
This collaboration has evolved into the ongoing Grape Remote Sensing Atmospheric Profile and Evapotranspiration eXperiment (GRAPEX) project and has been expanded to include personnel from other USDA ARS laboratories, the National Aeronautics and Space Administration (NASA), universities, and industry. The ultimate goal of the project is to provide wine grape producers and, in the longer term, fruit and nut orchard growers with the tools needed to generate high-resolution ET data that can be used to guide water management decisions. These tools will have the advantage over the current “business as usual” approach for assessing water needs by being applicable year-round and by providing water-use information with higher spatial and temporal detail. The tools will also differentiate between the water used by the grass cover crop, active early in the growing season, and water uptake by the grapevines themselves. In addition, the project will demonstrate the utility of using very high-resolution imagery collected via unmanned aerial vehicles (UAVs) at critical times during the growing season to assess in-field variability in vine condition and facilitate precision management.
The two-source energy balance (TSEB) developed by HRSL scientists and colleagues takes advantage of land surface temperature (LST) measurements from thermal infrared (TIR) imagery to monitor ET and has the potential to provide additional information regarding crop stress and soil moisture conditions. The model framework is well suited to the goals of the GRAPEX project because it partitions evaporative fluxes between the crop canopy and substrate surface (in this case, the soil or cover crop between the vine rows). TSEB can also be run across a range of spatial scales: from subfield resolutions using airborne data to larger scales using satellite imagery from both polar-orbiting and geostationary platforms. Nonetheless, the unique canopy architecture of vineyards and orchards, which is characterized by strongly clumped vegetation separated by significant interrow spaces containing bare soil or a cover crop, leads to several intriguing modeling and measurement challenges. First, the ET models must be able to partition the bulk moisture flux and crop stress derived from remote sensing–based products (typically at resolutions of 30 m or coarser) between the vine canopy and the interrow—environments that will likely have very different thermal characteristics and atmospheric couplings. Also, the structural characteristics of the canopy can significantly influence the turbulent flow and exchange of heat and water vapor from the vineyard, for example, by imposing dependencies on wind direction. Finally, radiation transport through structured canopies can be complex, leading to highly variable shadowing and soil surface fluxes that can confound simple modeling approaches.
To address the effects of these unique characteristics, the standard form of the TSEB model will require modification to optimize its performance over highly structured crops. Identifying the key factors affecting exchange processes over vineyards will guide the refinements to the remote sensing–based modeling scheme. This project uses in situ data to investigate the physical processes controlling turbulent transport and exchange in highly structured canopies. The GRAPEX project also seeks to use ground-based and UAV data to improve the model parameterization and design for routine application using satellite imagery. One advancement under investigation is the fusion of ET estimates retrieved using satellite data with differing spatial and temporal resolutions to generate “ET datacubes,” that is, a gridded time series dataset with both high spatial (30 m) and high temporal resolutions (daily time steps) that can be used to inform daily water management decisions at field scales.
This paper provides an overview of the measurements collected during GRAPEX along with some preliminary analyses conducted with the data collected to date. We also describe the initial evaluation of the modeling system and discuss plans for future research.
SITE AND DATA DESCRIPTION.
Study site and vineyard management.
The data used to refine and evaluate the models were collected in two pinot noir blocks located within Borden Ranch vineyard near Lodi, California (38.29°N, 121.12°W), in Sacramento County (see Fig. 1), as part of the GRAPEX project. The two adjacent vineyards differ in the age and maturity of the vines, with the north and south vineyards being 6 and 3 years old, respectively, at the beginning of the 2013 growing season. The management of the two vineyards—for example, the timing and amount of irrigation, pruning activities, cover crop, and application of agrochemicals—can also differ between blocks and from season to season. Intensive observation periods (IOPs) described below occurred at different cover crop and vine phenological stages, namely, flowering (IOP1), fruit set (IOP2), and veraison (IOP3).
Fig. 1.
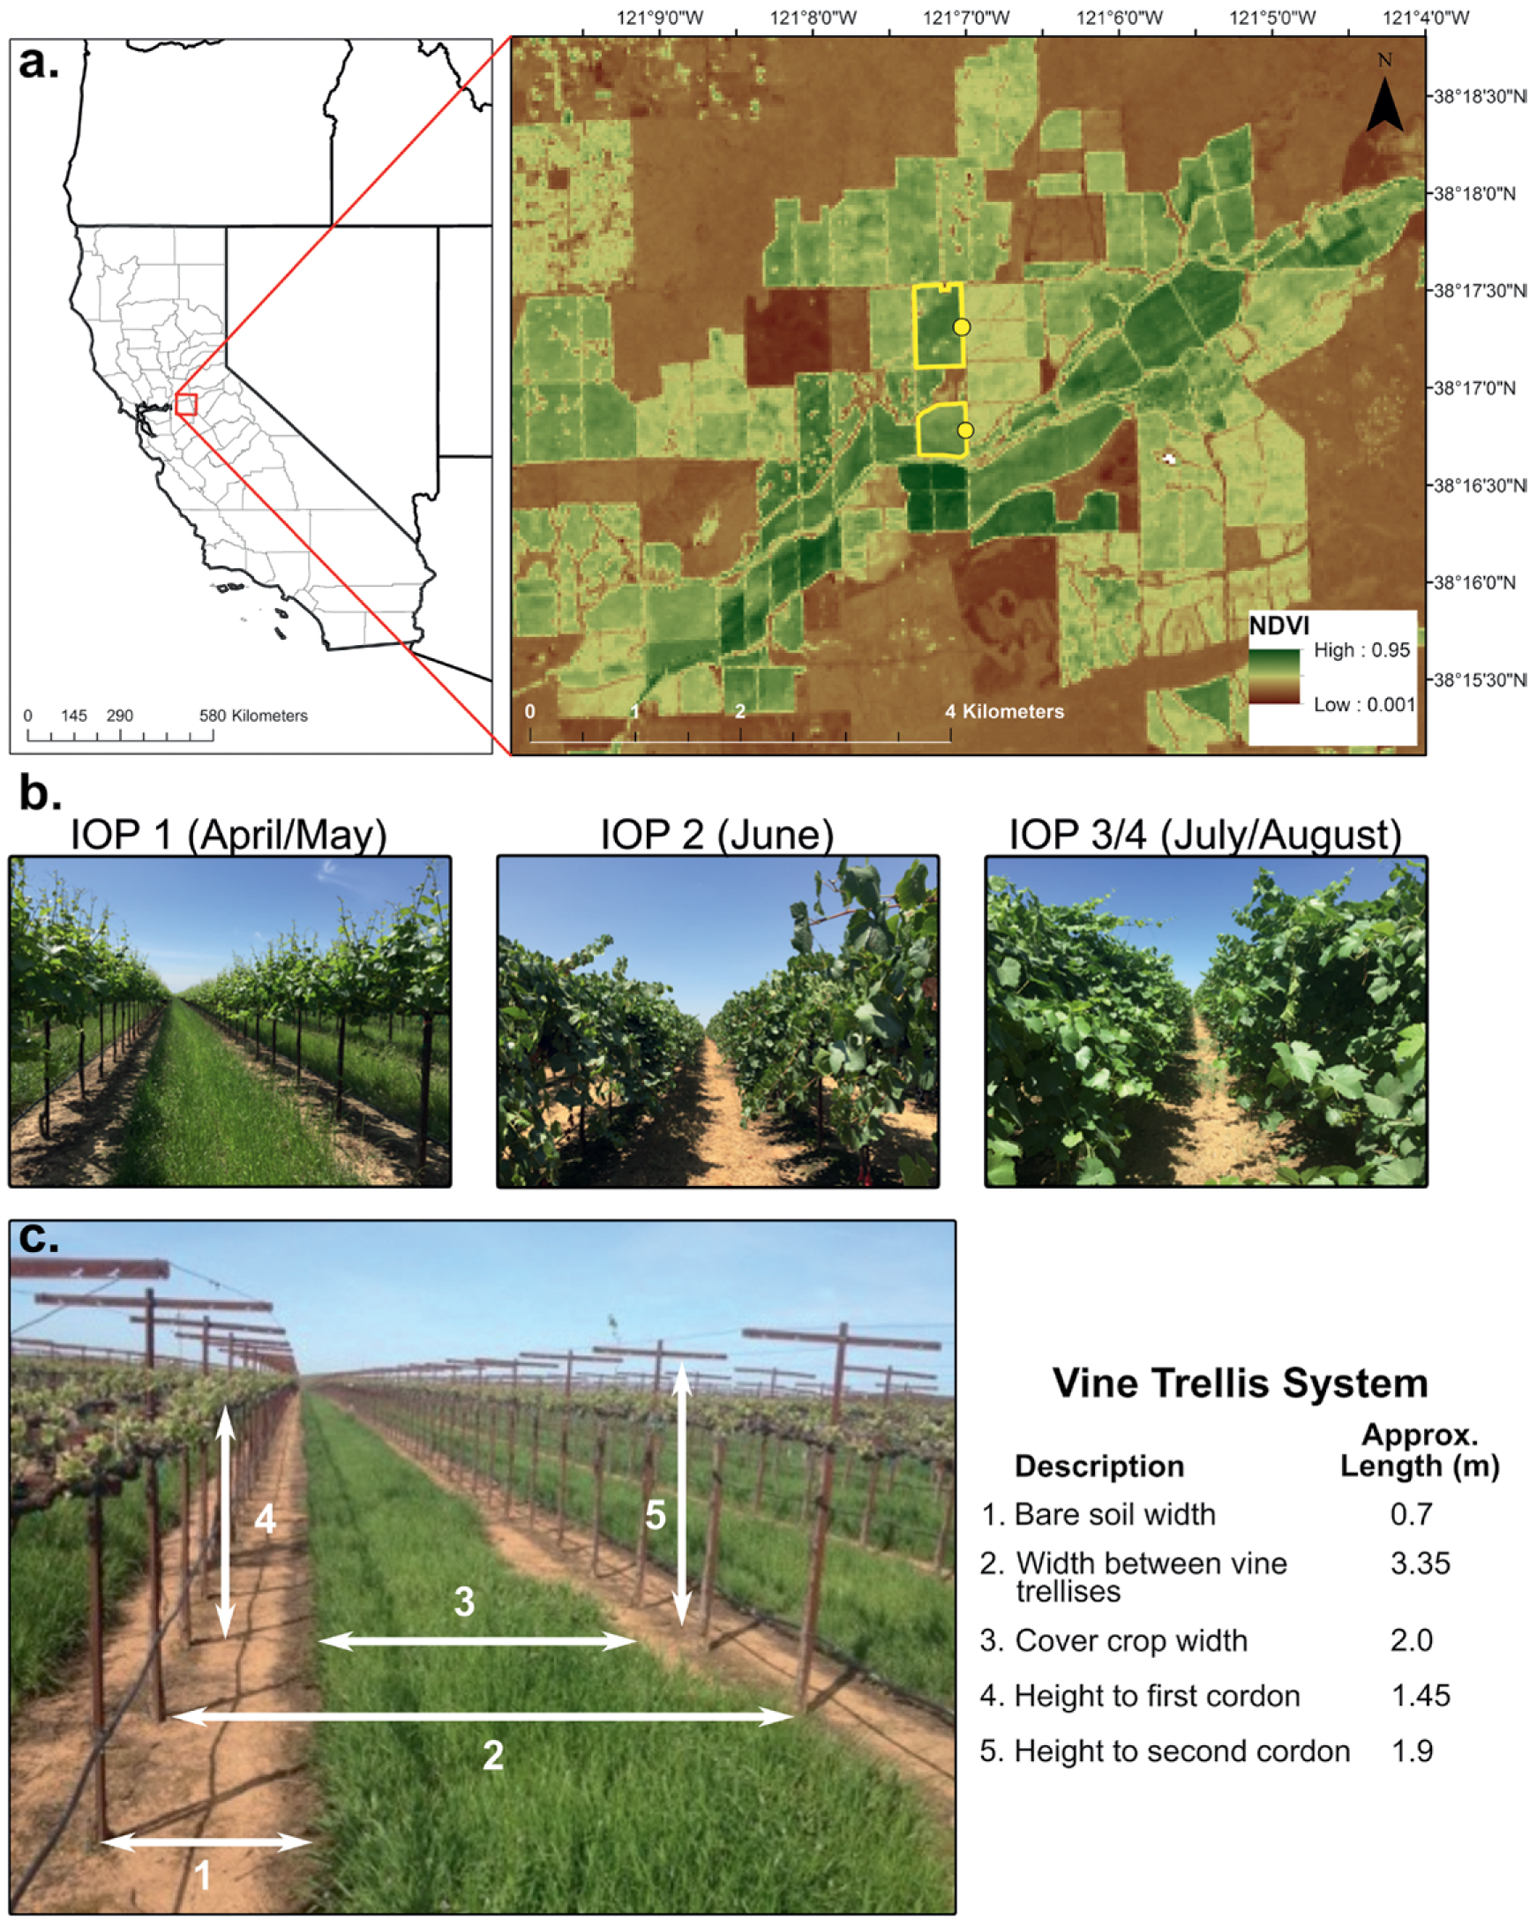
(a) (left) A county-level map of California gives the location of the pinot noir vineyards in Sacramento County and (right) a Landsat-8 NDVI map showing the location of the vineyards (yellow boundaries) and the approximate location of the flux towers (solid yellow circles). (b) The photos of the vine and cover crop are indicative of their phenology during the IOPs involving an extensive set of ground and airborne measurements (see text). (c) The vine trellis and interrow cropping design and dimensions are illustrated and listed.
In both fields, the configuration of the trellising system and interrow (Fig. 1) is the same. The vine trellises are 3.35 m apart and run east–west. There is a vine planted every 1.5 m, with the two main vine stems attached to the first cordon at a height of 1.45 m above ground level (AGL). There is a second cordon at 1.9 m AGL where vine shoots are managed. Typically, the vines reach a maximum height of 2.0–2.5 m AGL during the growing season with the vine biomass concentrated in the upper half of the total canopy height. The typical vine canopy width is nominally 1 m midseason. Pruning of the vines is mainly performed to remove shoots growing significantly into the interrow. However, the amount and timing of pruning has varied year to year.
Drip irrigation lines run along the base of the trellis at about 30 cm AGL with two drip emitters (4 L h−1) between each vine. In the interrow, the cover crop (a mixture of grasses) is approximately 2 m in width with bare soil on either side (i.e., berm) approximately 0.7 m in width. The cover crop is typically mowed two to three times per year and senesces by early June. The berm beneath the vines is kept bare through the use of a herbicide.
Continuous measurements.
Beginning with the 2013 growing season, surface fluxes (including ET) and environmental conditions have been measured continuously at both vineyards using eddy covariance micrometeorological systems. These sensor systems are summarized in a schematic and photo of the tower configuration in Fig. 2. The tower at each site is instrumented with an infrared gas analyzer (EC150, Campbell Scientific, Logan, Utah)1 and a three-dimensional sonic anemometer (CSAT3, Campbell Scientific) collocated at 5 m AGL to measure the concentrations of water and carbon dioxide and wind velocity, respectively. During the growing season, three additional sonic anemometers mounted at 2.50, 3.75, and 8 m AGL are included on the tower to investigate effects of the canopy structure on near-surface turbulence. Other measurements at the tower include the full radiation budget using a four-component net radiometer (CNR-1, Kipp and Zonen, Delft, Netherlands) mounted at 6 m AGL; incident and reflected photosynthetically active radiation (PAR) measured via quantum sensors (LI-190, LI-COR, Lincoln, Nebraska) also mounted at 6 m AGL; air temperature and water vapor pressure measured using three temperature and humidity probes (HMP45C, Vaisala, Helsinki, Finland) mounted at 2.5, 5, and 8 m AGL; and precipitation measured using a tipping-bucket rain gauge (TE-525, Texas Electronics, Dallas, Texas) mounted at 5.5 m AGL. Both vine canopy and interrow surface temperatures are measured using a pair of thermal infrared thermometers (SI-111, Campbell Scientific) mounted at 2.5 m AGL.
Fig. 2.
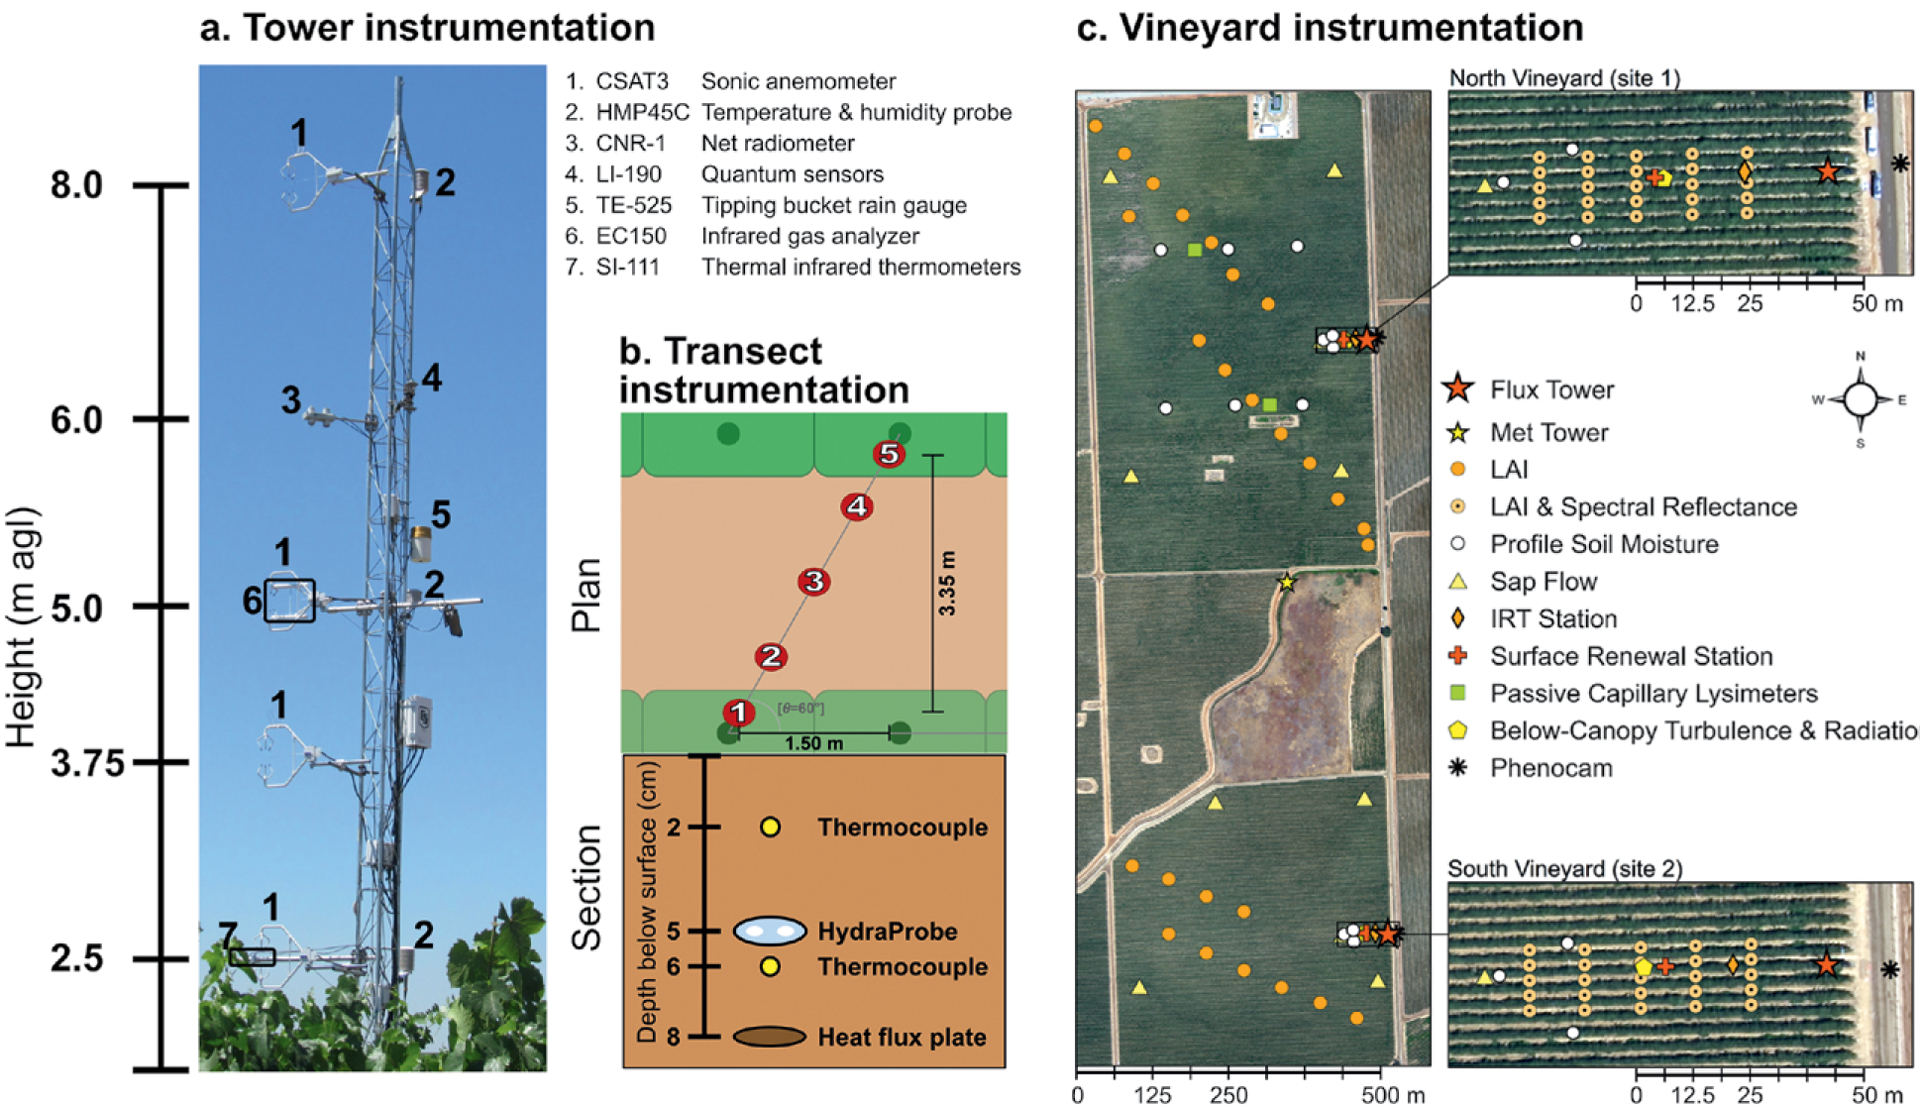
(a) A photo of the tower installation and sensor locations on the tower is provided, along with (b) a schematic of the soil heat flux sensor measurement design (see text for details). (c) GRAPEX sensor locations in the north (site 1) and south (site 2) vineyards, along with leaf area sampling locations during the IOPs.
Subsurface measurements include the soil heat flux measured via a cross-row transect of five plates (HFT-3, Radiation Energy Balance Systems, Bellevue, Washington) buried at a depth of 8 cm, soil temperature measured via thermocouples buried at depths of 2 and 6 cm, and soil moisture content measured via a soil moisture probe (SDI-12 HydraProbe, Stevens Water Monitoring Systems, Portland, Oregon) buried at a depth of 5 cm. In addition, beginning in 2016, a second array of sensors were installed to provide more detailed spatial sampling of soil heat flux (HFT-3, Radiation Energy Balance Systems), water content (HydraProbe, Stevens Water Monitoring Systems), and temperature under the vine canopy and across the interrow. This array consists of 11 sets of sensors deployed in a hexagonal pattern centered at the midrow and extended to the vines on either side. An additional profile of temperature, water content, and thermal properties was deployed with the array in order to facilitate the calorimetric approach for determining soil heat flux.
Profiles of soil water content and temperature are also measured under the vines at three locations near each flux tower (Fig. 2) using soil moisture temperature probes (HydraProbe, Stevens Water Monitoring Systems) at depths of 30, 60, and 90 cm. In the north vineyard there are also soil moisture profile measurements at six locations using Decagon (MPS-2 Decagon Pullman Washington) dielectric water potential sensors at depths of approximately 5, 50, 90, and 125 cm, with two Decagon 10HS large soil moisture sensors at 45-cm depth. Additionally, Decagon model G2 and G3 passive capillary lysimeters were installed at two interrow locations (Fig. 2) in the north vineyard for estimating interrow water use.
Sap-flow measurements using a thermal dissipation probe (TDP30, Dynamax Inc., Houston, Texas) at five locations in both the north and south vineyards (see Fig. 2) are collected to estimate the spatial and temporal variability of vine water use and status. The sap-flow measurements that lie within the eddy covariance flux footprint are being used together with eddy covariance data in an attempt to separate interrow versus vine plant water use. The passive capillary lysimeter measurements in the interrow will also be helpful in this separation.
In the 2015 and 2016 growing seasons, flowmeter sensors (manufactured by Mark Battany, University of California Cooperative Extension viticulture advisor) for monitoring irrigation (initiation and duration) were used to estimate the amount of irrigated water that was applied in both vineyards.
Vine and cover crop development through the growing season as well as throughout the whole year were visually tracked using phenocams located across the road on the east side (see Fig. 2) starting in 2013 at the north vineyard and starting in 2015 at the south vineyard. [A video of the daily photos collected in the morning (~0900 local time) for the years 2014–16 for the north vineyard can viewed at www.ars.usda.gov/grapex/phenocam.] Approximately 50 m due west of the flux towers in the north and south vineyards, instrumentation was deployed to measure the surface energy balance following the surface renewal (SR) approach (Paw U et al. 1995). The instruments included a 3D sonic anemometer (81000RE, R. M. Young Company, Traverse City, Michigan), a 76-μm-diameter Type E fine-wire thermocouple (FW3, Campbell Scientific, Inc.), and a net radiometer (NRLite, Kipp and Zonen), deployed at 2.5 m AGL. The SR station design is described in McElrone et al. (2013).
IOPs.
Timing of IOPs.
Episodic and intensive data collections, called IOPs, were conducted at different vineyard phenological stages during the growing season (see Fig. 1b). In each growing season, the first IOP usually occurred in late April or early May after bud break (grape flowering stage) with low vine cover but significant cover crop biomass. Another IOP often occurred in early to mid-June at the start of the dry season, with rapidly growing vines and fruit (preveraison, or berry development stage) and cover crop going through senescence. A third IOP typically occurred in mid- to late July or early August, with vines and fruit fully developed (veraison to postveraison stage) and cover crop fully senescent and now acting as a thatch layer. During this period the vines are still actively growing, but, through pruning and ripening of the fruit, they are now in a later stage of development. By late August or early September each year, the vineyard grapes reached the required sugar content and were harvested. In 2014, a fourth IOP was conducted in late September after harvest to evaluate vine and interrow cover conditions.
IOP biophysical observations.
During the IOPs, measurements of leaf area index (LAI; LAI-2200, LI-COR, Lincoln, Nebraska), leaf stomatal conductance, photosynthesis, and leaf water potential were collected using either a LI-COR (LI6400, LI-COR) or PPS (CIRAS-3, PP Systems, Amesbury, Massachusetts) portable photosynthesis system and a pressure chamber (615, PMS Instrument Company, Albany, Oregon) along transects across the vineyard (Fig. 2) to determine variability in vine biomass, water use, and stress. Multispectral measurements in the visible and near-infrared (NIR) wavelengths, along with leaf-level hyperspectral measurements (FieldSpec 4 Spectroradiometer, ASD Inc., Boulder, Colorado), were also collected so that satellite and airborne multispectral retrievals could be related to in situ canopy conditions. Multispectral (four band) visible and near-infrared measurements using a CROPSCAN (MSR16R, CROPSCAN, Inc., Rochester, Minnesota) instrument mounted on a pole for measuring above the vine canopy were collected over vine and interrow areas as well as a gravel lot surrounding the vineyard garage and the fallow field separating north and south vineyards (see Fig. 2). The reflectance values are being used to evaluate and calibrate the airborne and satellite spectral observations. At the sap-flow sites (see Fig. 2), leaf-level hyperspectral measurements were made for the same leaves used to measure plant conductance, photosynthetic activity, and leaf water potential to explore relationships between plant physiology and spectral response.
IOP micrometeorological observations.
During the IOPs, measurements were also collected in the interrow region within the north and south vineyard flux tower footprints to establish micrometeorological conditions between the vine canopies, near the substrate surface. Solar radiation was measured at ground level to determine radiation divergence within the vine canopy. Specifically, solar radiation in the interrow was measured within 75 m of the flux towers during the IOPs using a transect of five to eight radiation sensors from Kipp and Zonen (CMP3 and CMP11), Eppley (PSP, Eppley Laboratory Inc., Newport, Rhode Island), and Apogee (SP 212, Apogee Instruments, Inc., Logan, Utah) installed at ground level. Multiple radiometric temperature measurements of the top-, east-, and south-facing sides of the vine canopy and the interrow were collected. The two near-nadir viewing sensors at the canopy top (SI-1H1, Apogee Instruments, Inc.) were pointed north and south, while two additional Apogee SI-1H1sensors were angled at 90° for viewing the north and south sides of the vine canopy, and two thermal-infrared sensors were east facing at an oblique angle for viewing the interrow cover crop and bare soil underneath the vines. In 2015, micro–Bowen ratio (micro-BR) systems (Holland et al. 2013) were deployed for the three IOPs. There were three micro-Bowen ratio systems located on the north- and south-facing locations under the vine canopy sampling the bare soil strip and a third in the center of the interrow. Locations of these measurement sites for both the continuous measurements collected throughout the year and observations collected during IOPs are depicted in Fig. 2.
IOP UAV acquisitions.
Airborne high-resolution (<1 m) remote sensing imagery was collected during several of the IOPs in 2013–16 to evaluate and improve performance of TSEB applications at the satellite pixel scale (30 m). In 2013, a manned aircraft collected imagery at nominally 0.1-m pixel resolution in the visible and near-infrared and 0.5 m in the thermal infrared for three IOPs. A detailed description of the processing and analysis of the data is provided in Ting et al. (2016).
In the 2014–16 growing season, we moved from manned to unmanned systems, which are easier to deploy and are increasingly used in agricultural monitoring. The UAV system used in GRAPEX and its sensors are described in detail at the Utah State University (USU) Aggie Air website (http://aggieair.usu.edu/). During the IOPs, the UAV flew at a nominal altitude of 400 m AGL, resulting in 0.15-m pixel resolution in the visible and near-infrared bands and 0.60-m resolution in the thermal infrared. Ground control points collected using a survey-grade Trimble real-time kinematic (RTK) GPS with subcentimeter absolute accuracy were used to georeference the imagery. Ground-based spectral and thermal-infrared measurements of distinct land surface features were used for image calibration. Atmospheric transmissivity was also collected and used to correct at-sensor radiances to surface values.
The manned and unmanned aircraft were employed to capture microscale spatial information concurrent with Landsat overpasses during the IOPs, facilitating detailed comparisons between satellite and aerial information. In addition, both aerial systems were flown approximately an hour after sunrise and during the afternoon, thus providing the opportunity for a more complete description of energy fluxes over the diurnal cycle.
REMOTE SENSING OF EVAPOTRANSPIRATION.
Over the past decades, remote sensing approaches for mapping ET have advanced significantly (Kalma et al. 2008; Wang and Dickinson 2012), particularly surface energy balance methods using TIR observations of LST (Kustas and Anderson 2009). Using LST data from geostationary and polarorbiting satellites, or airborne imaging systems, the Atmosphere–Land Exchange Inverse model (ALEXI) framework and associated flux disaggregation technique (DisALEXI) can be used to map ET from global scales for regional water-use assessments down to subfield spatial scales for precision agricultural management (Anderson et al. 2011). Based on the two-source (soil and canopy) energy balance land surface representation, ALEXI and DisALEXI provide estimates of E (evaporation) and T (transpiration) partitioning as well as total ET. Using a multisensor data fusion methodology, ALEXI and DisALEXI can provide daily ET estimates at field-scale resolutions (Camalleri et al. 2013). This modeling system is briefly described below.
TSEB model.
The TSEB land surface energy balance scheme was developed to explicitly account for the differences in aerodynamic coupling between the soil substrate and the canopy layer (Norman et al. 1995). Figure 3 illustrates the basic set of equations used in TSEB to solve for the energy balance of both the soil substrate and vegetation canopy layers. Key inputs are the surface radiometric temperature TRAD(θ) at a view angle θ and the canopy cover fraction fC, which is related to the leaf area index. The system of equations for the energy balance of the soil/substrate and canopy are solved in parallel with the radiometric temperature balance equation in Fig. 3, which partitions TRAD into effective soil (TS) and canopy (TC) temperatures. As part of this system, the soil (Rsoil) and canopy (Rcanopy) aerodynamic resistances are used to compute sensible heat fluxes from the soil and canopy surfaces (HS and HC, respectively). These combine to yield the total sensible heat flux H determined by the temperature difference between the canopy air space TAC and the surface-layer TA and associated surface-layer aerodynamic resistance Raero. The soil and canopy temperatures constrain the sensible heat fluxes, net radiation (RN), and soil heat flux G with the added initial estimate of canopy latent heat flux (LEC) or transpiration based on either the Priestley–Taylor (PT), Penman–Monteith (PM), or light-use efficiency (LUE) parameterization (Kustas and Norman 1999; Colaizzi et al. 2014; Anderson et al. 2008). Finally, the latent heat flux from the soil (LES) is computed as the residual flux.
Fig. 3.
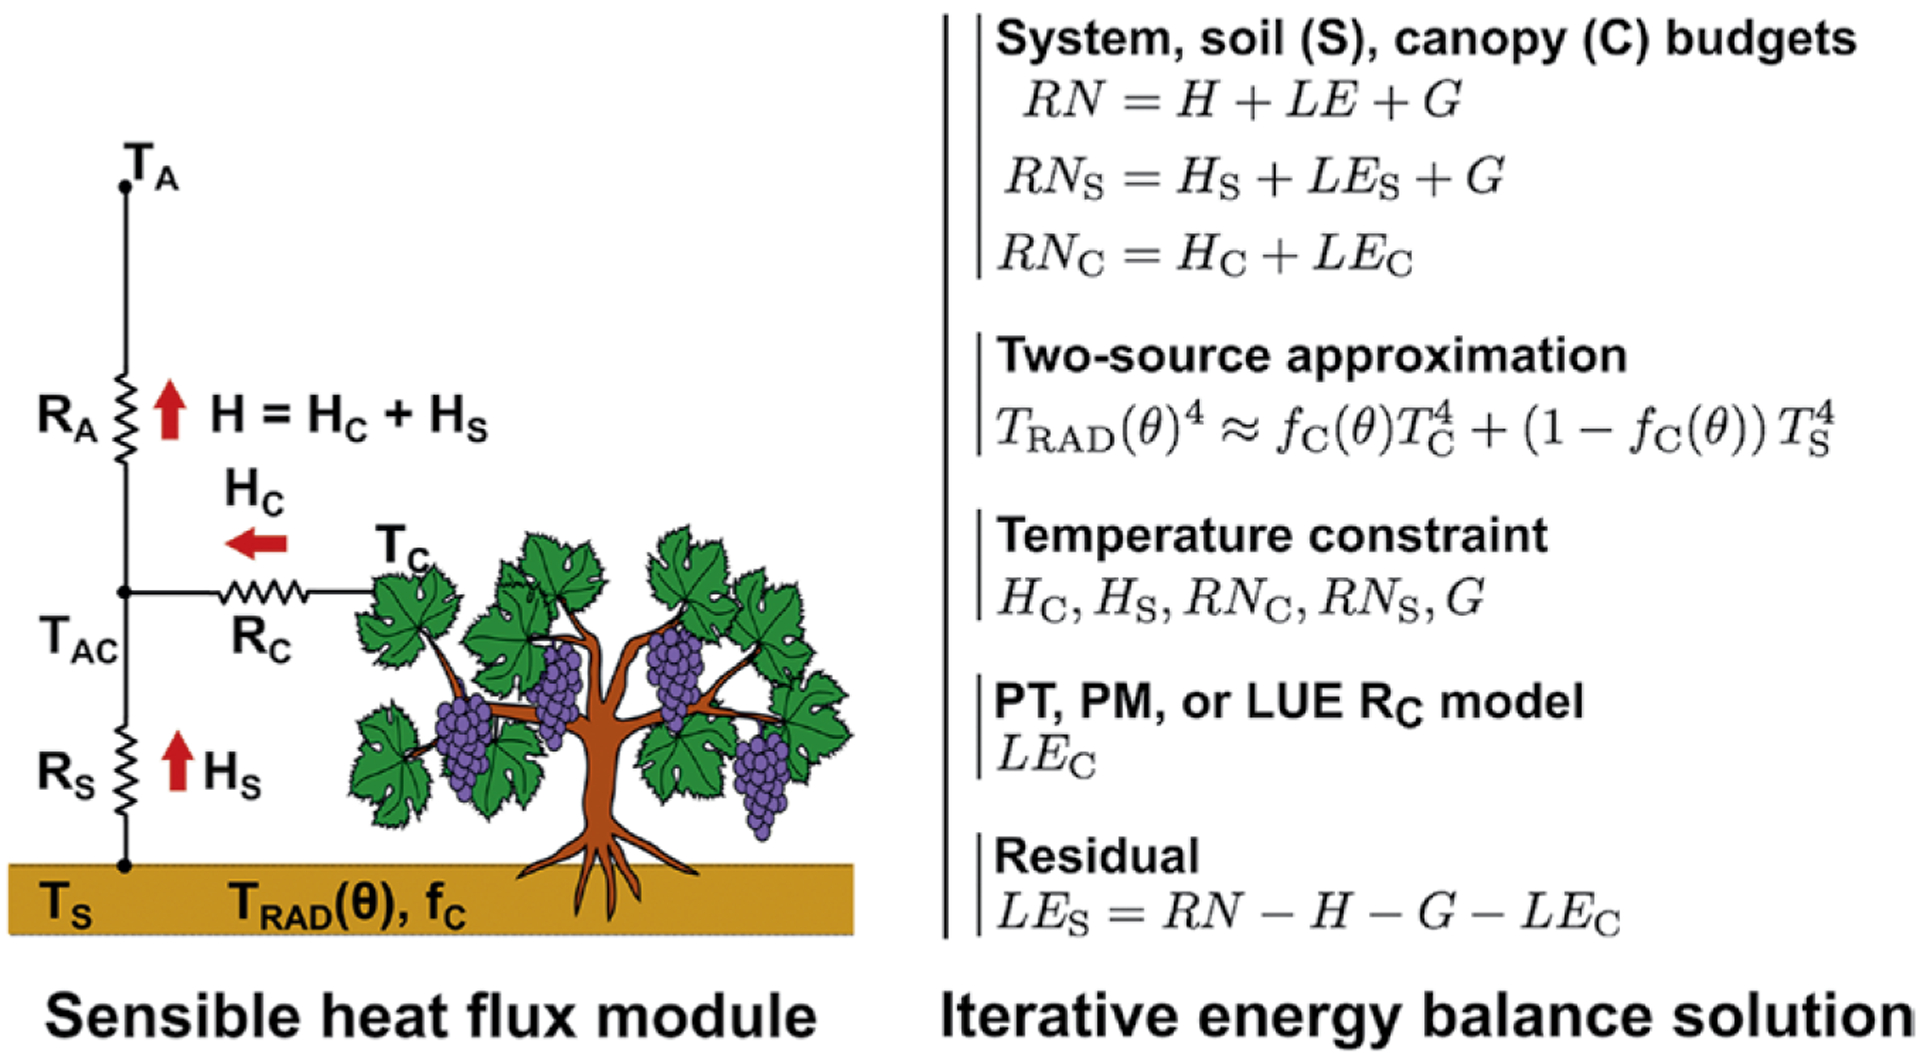
Schematic diagram of the TSEB model resistance network for sensible heat flux and the basic set of equations used to obtain an iterative solution. Terms include net radiation (RN), soil heat flux G, sensible heat flux H, latent heat flux (LE), temperature T (subscripts C and S refer to crop and soil/substrate, respectively), radiometric surface temperature TRAD, radiometer viewing angle θ, fraction vegetation cover fC, soil/substrate aerodynamic resistance RS, canopy aerodynamic resistance RC, surface-layer aerodynamic resistance RA, canopy-air temperature TAC, and surface-layer air temperature TA. To achieve an iterative solution TSEB initially computes canopy transpiration or canopy latent heat flux (LEC) using PT, PM, or LUE formulation.
Regional implementation of the TSEB.
The TSEB land surface scheme is implemented within a regional model called ALEXI (Anderson et al. 1997, 2007). The regional ALEXI system exploits the time-differential morning surface temperature signal provided by geostationary satellites to generate coarse regional maps that are reasonably robust to errors in absolute (instantaneous) LST retrieval. The associated disaggregation tool, DisALEXI, uses higher-resolution imagery from polar-orbiting Moderate Resolution Imaging Spectroradiometer (MODIS) or Landsat LST or even airborne thermal data to disaggregate ALEXI fluxes to finer spatial scales. These outputs, which have been validated against surface measurements, provide field-scale estimates of crop water use and stress (Anderson et al. 2004, 2007, 2011, 2012).
Multisensor data fusion.
The ALEXI–DisALEXI modeling system has been integrated within a data fusion methodology (see Fig. 4a) to combine approximately daily 1-km MODIS retrievals with biweekly Landsat (sharpened to 30 m) resolution retrievals to produce ET datacubes with both high spatial (30 m) and temporal (daily) resolution (Cammalleri et al. 2013, 2014). The fusion is performed using the Spatial and Temporal Adaptive Reflectance Fusion Model (STARFM; Gao et al. 2006). STARFM develops spatially distributed weighting factors describing the spectral and spatial relationship between existing Landsat and MODIS image pairs, which are then used to define the disaggregation weighting functions used with the MODIS images on days when Landsat data are not available. A new data fusion procedure under development will utilize higher-resolution LST data from the VIIRS satellite (Fig. 4b). ET fusion experiments in different land-cover types are described by Cammalleri et al. (2013, 2014), Semmens et al. (2016), Yang et al. (2017a,b), and Sun et al. (2017b).
Fig. 4.
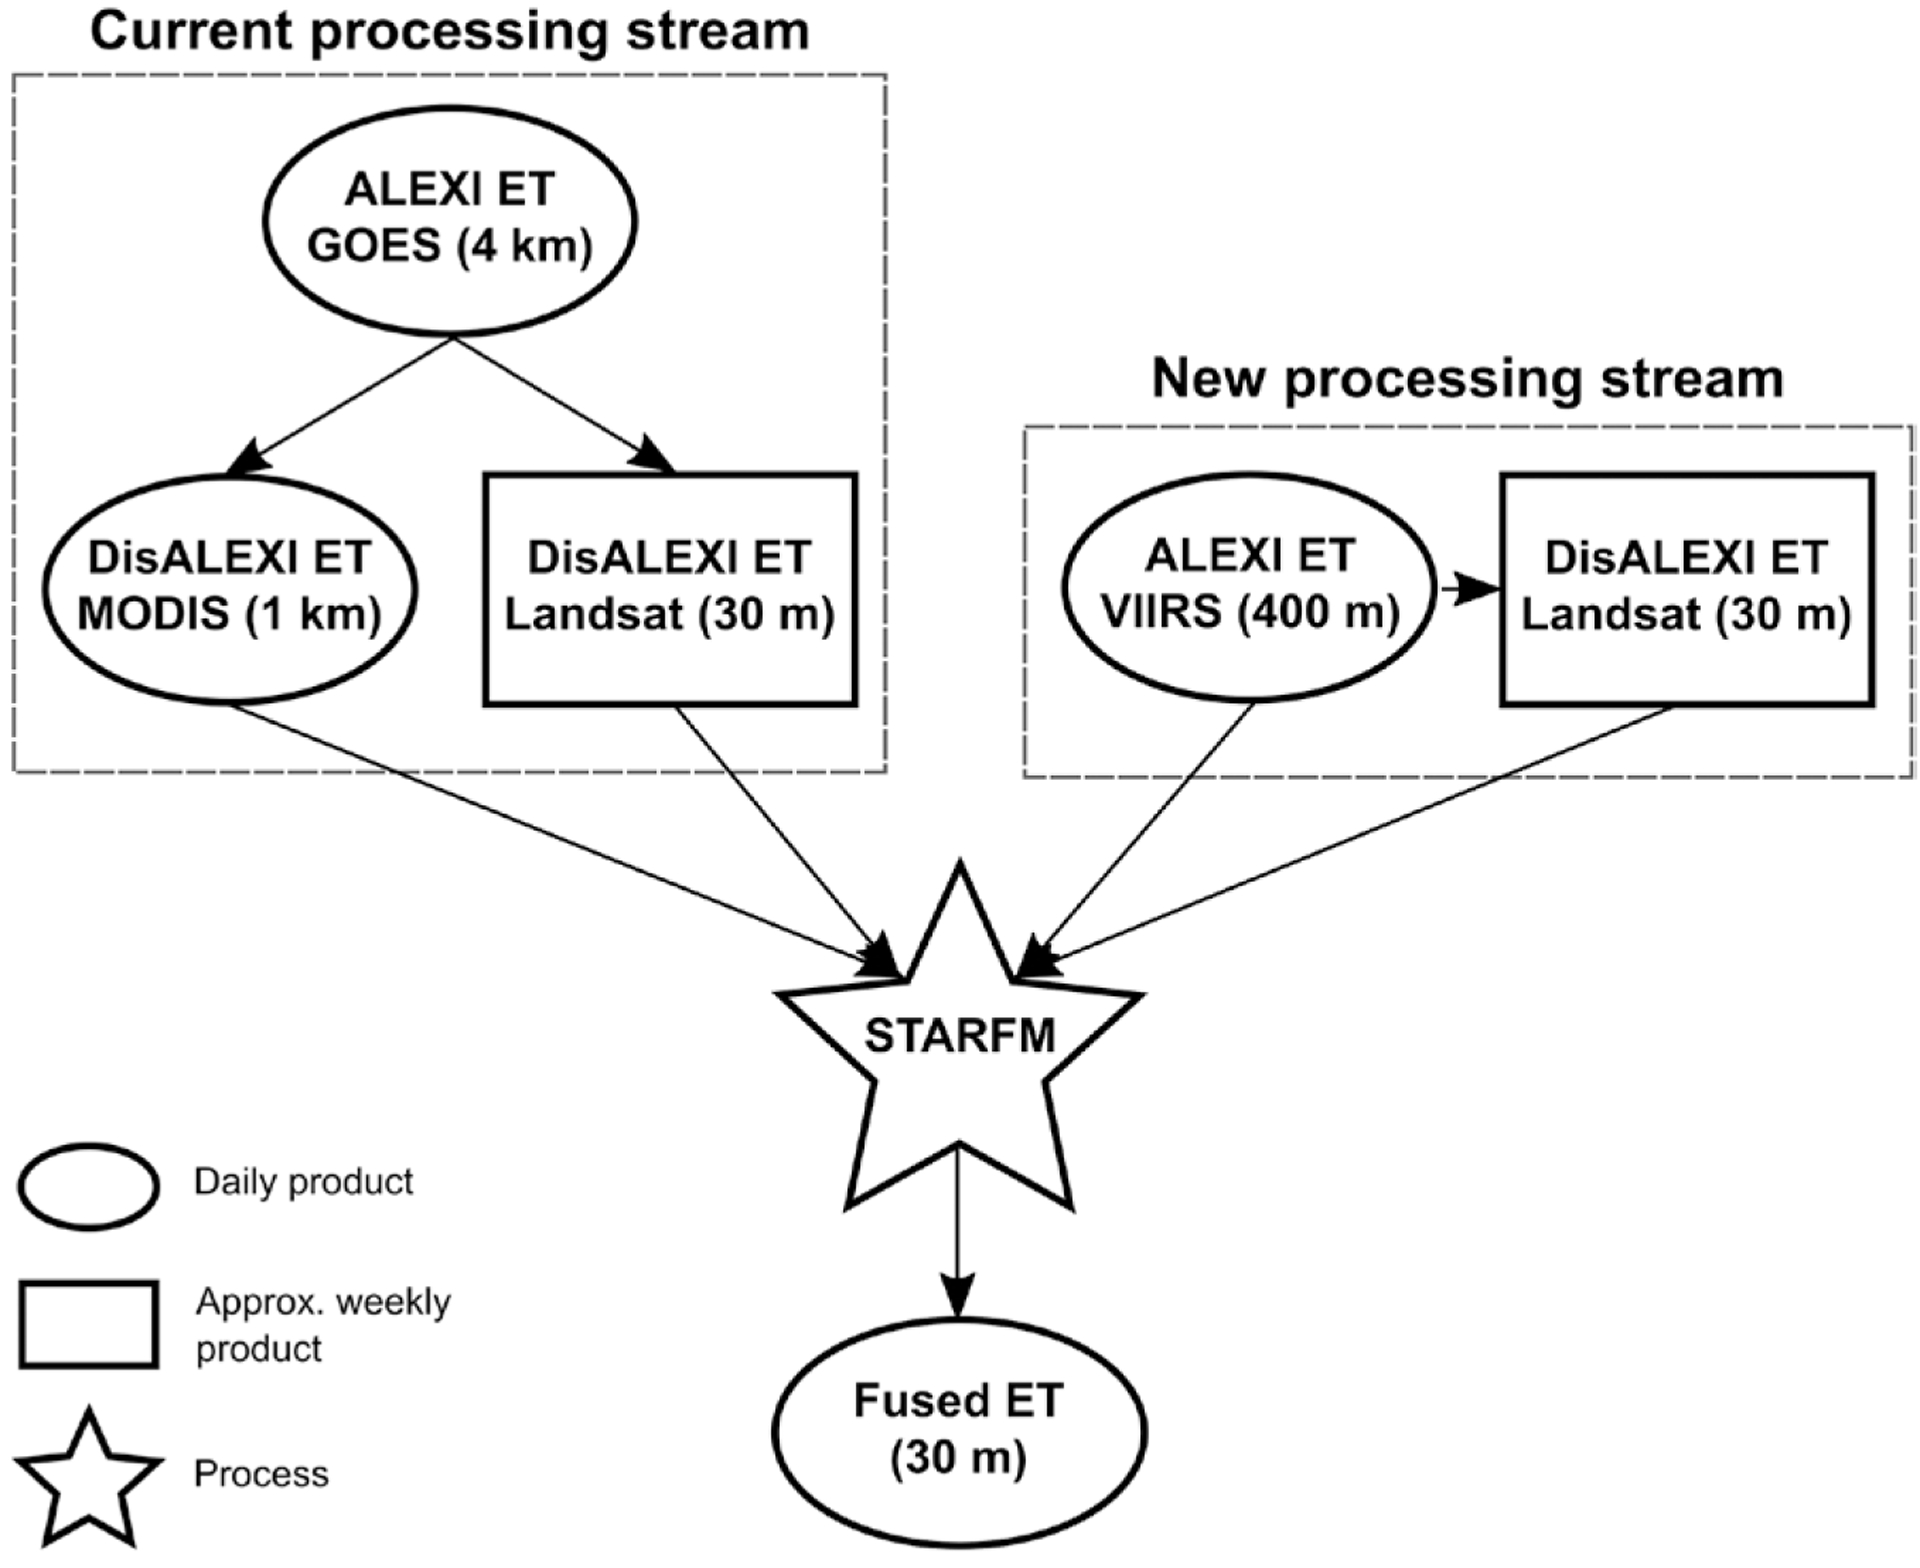
A schematic overview of the inputs and processing steps of the ET data fusion package for (left) the current processing method and (right) the new processing method under development.
ANALYSIS AND PRELIMINARY RESULTS.
Measurements.
Flux and LAI observations.
With the flux towers at the north and south vineyards separated by only a kilometer, there were no significant differences in the meteorological forcings—namely, radiation, rainfall, air temperature, vapor pressure deficit, and wind speed. However, we do expect to see differences in surface energy balance components between the north and south vineyards because of differences in irrigation, vine maturity, leaf area, and biomass.
Biomass variations are summarized by IOP in Fig. 5, showing averages of ground measurements of vine and cover crop LAI over the years 2013–16. The cover crop is most active in IOP1; however, sometimes overirrigation results in lateral water flow into the interrow causing the cover crop to thrive even in June. Over this time period, the total LAI of both the combined vine and cover crop is on the order of 0.5 units higher in the north vineyard during IOP2 (mid- to late June) and IOP3 (late July to early August).
Fig. 5.
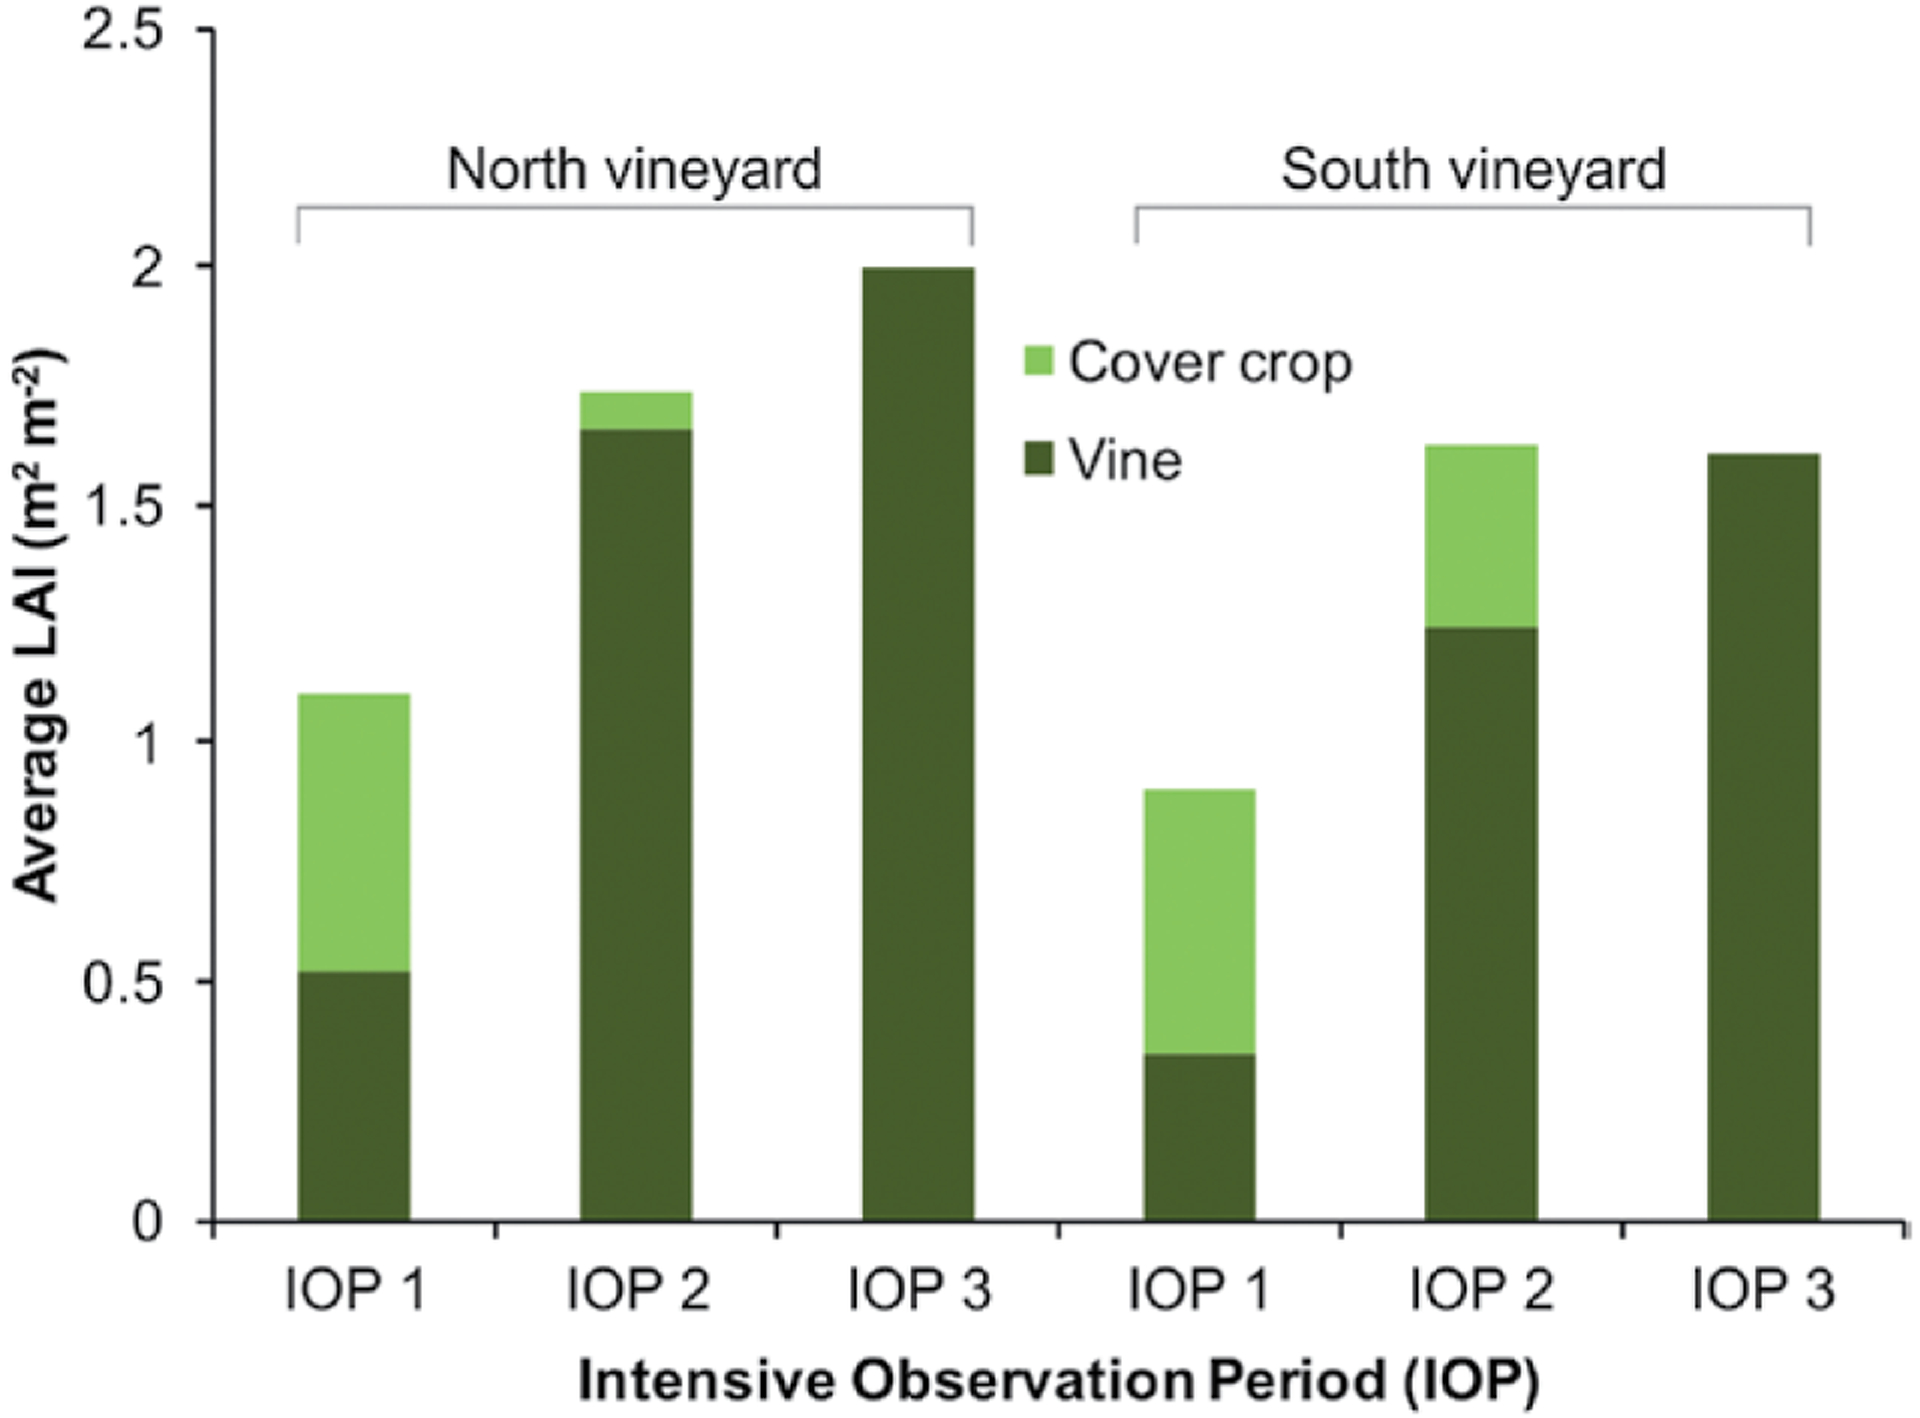
Average of the ground-based LAI measurements near the flux towers collected from the GRAPEX IOPs over the 2013–16 growing seasons in the north (site 1) and south (site 2) vineyards. Also shown is the additional LAI contributed by the cover crop when active and growing early in the spring and early summer.
To more easily visualize and contrast the main temporal dynamics in the surface energy balance at the two sites, monthly daytime fluxes were computed from the daily observations, and then these monthly fluxes were averaged over the period from 2013 to 2016 to generate normal flux curves associated with each site (Fig. 6). These normal curves show little difference in RN between the two sites at the monthly time step. However, it is apparent that the north vineyard (site 1) with greater biomass than the south (site 2) vineyard has lower sensible heat flux H and higher latent heat flux (LE) during the growing season. Most noteworthy is the decrease in H at site 1 during the period of peak incident solar radiation, which is also a period when air temperature and vapor pressure deficit (VPD) are near their maxima. This is likely due to the higher biomass in site 1 (Fig. 5), with larger evaporative response to VPD and resulting in a depression in H.
Fig. 6.
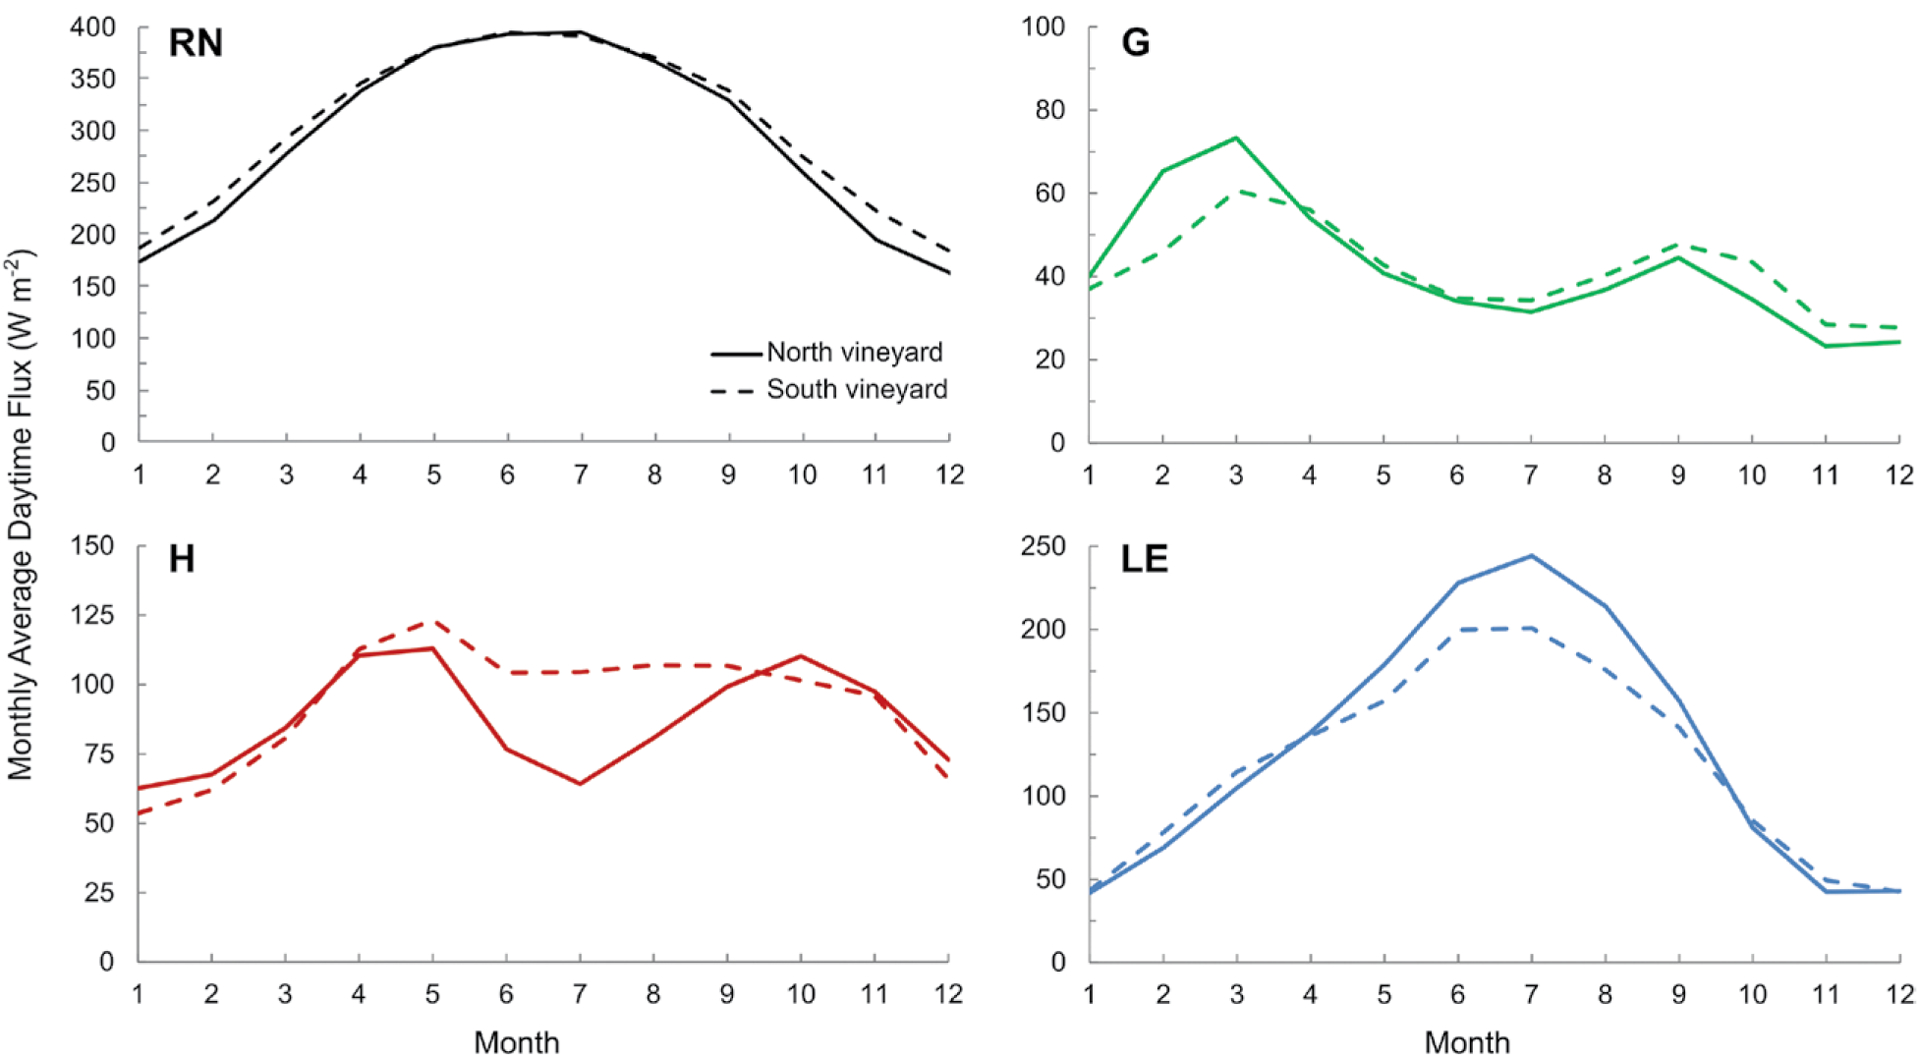
Daytime monthly average (mean of 2013–16) surface energy balance components: (top left) net radiation, (top right) soil heat flux, (bottom left) sensible heat flux, and (bottom right) latent heat flux for the north (site 1; solid line) and south (site 2; dashed line) vineyards.
The normal G flux curves also show interesting temporal behavior, indicating bimodal peaks: one in March before the vine leaves have emerged and the second in September after the vines have senesced. The higher values of G at site 1 during March are likely due to more frequent mowing of the cover crop in that field. Bud break normally occurs in mid- to late March; consequently, there is very little if any influence on shading from the vines at that time.
Soil moisture measurements.
Temporal variations in vine and cover crop biomass and associated rooting depths, along with irrigation and evaporative demand, impact patterns in the soil water profile. This is demonstrated in Fig. 7, showing evolution in soil moisture observations at 30-, 60-, and 90-cm depths collected beneath a vine in the north vineyard along with precipitation and irrigation events during 2016. The 30- and 60-cm sensors tend to be most responsive to rainfall, which largely occurs in the fall, winter, and early spring, while during irrigation events starting in the late spring (May) and much more frequently starting in early summer (June), only the 30-cm sensor shows a response to irrigation (and a few instances with the 60-cm sensor). The response at 30-cm depth in the fall and winter may be caused in part by the interrow cover crop, which remains green and active during these periods. The 60-cm sensor variation in soil moisture is not as dynamic, while the 90-cm moisture sensor registers an increase in moisture after multiple precipitation events in the fall and early winter, presumably when the vines have undergone senescence. Interestingly, the highest moisture values are with the 90-cm sensor from March through May, a period with active cover crop water use and with vines in early development. There is a decline in moisture at all three depths over this time frame, but only the 30-cm sensor responds to the frequent irrigation events starting in June suggesting the vine root zone is mainly in the upper 30 cm. This pattern is similar to other years.
Fig. 7.
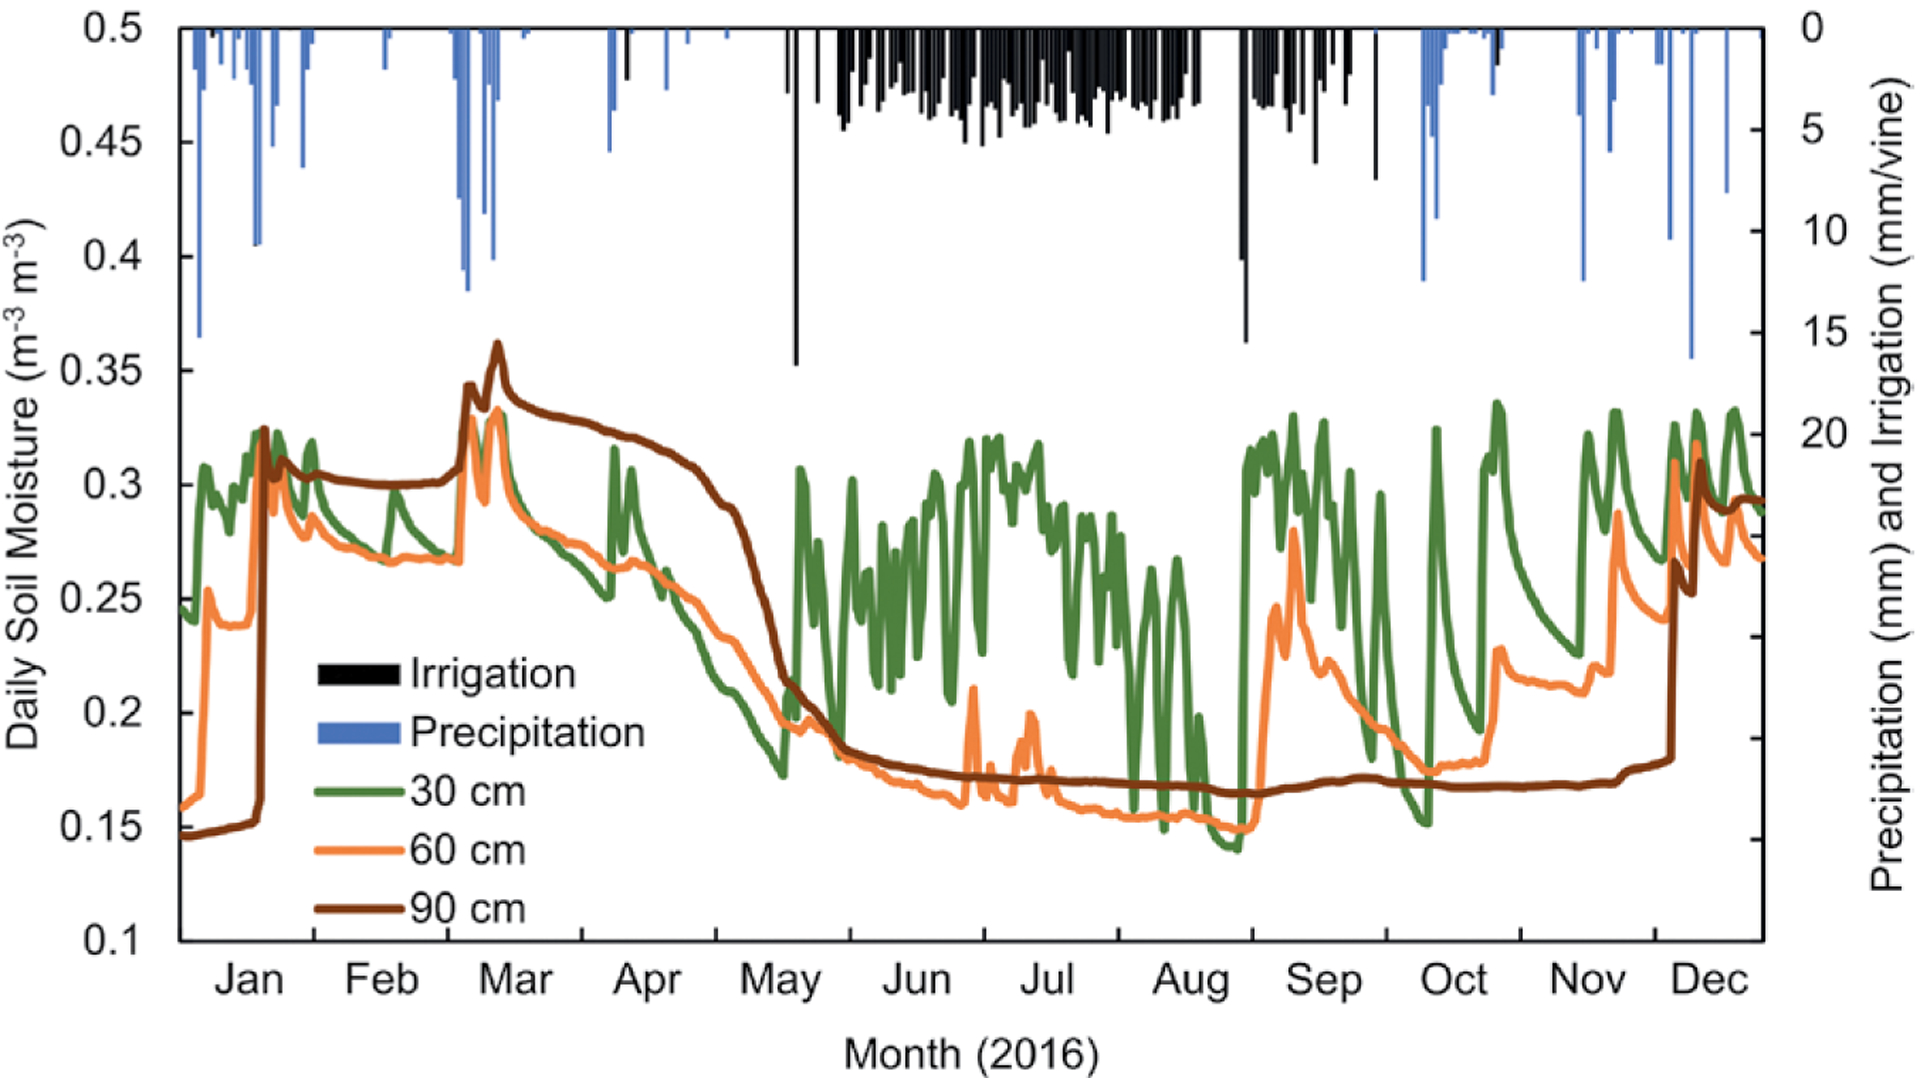
Soil moisture from the 30-, 60-, and 90-cm-depth profile sensors located underneath a vine for the north (site 1) vineyard in 2016 along with observations of precipitation (mm) and irrigation (mm per vine).
Soil moisture – ET relationship.
Daily mean soil moisture from the three profile sensors averaged over all depths is compared to measured daily ET from the tower normalized by potential or reference ET (ETO) using the Penman–Monteith equation from FAO Irrigation and Drainage Paper 56 (Allen et al. 1998) in Fig. 8. The daily data from all 4 years (2013–16) are plotted with different symbols indicating different vine phenological and seasonal stages or conditions. Although there is considerable scatter, an exponential equation using a least squares fit indicates a decrease in the ratio of ET to ETO starts to occur at a profile soil moisture average of 0.35. However, this depends to some extent on vine phenology. For example, during the period from veraison to harvest ET/ETO shows little change with the average profile of soil moisture decreasing from 0.35 to 0.25. A significantly greater change with daily average soil moisture is observed with changes in ET/ETO at the postharvest stage, while for bud break to bloom or flowering there is little relationship. This lack of a relationship stems from the fact that ET is largely coming from the cover crop in the spring, from prior to and several weeks after bud break, and is accessing very little of the available water in the profile underneath the vines.
Fig. 8.
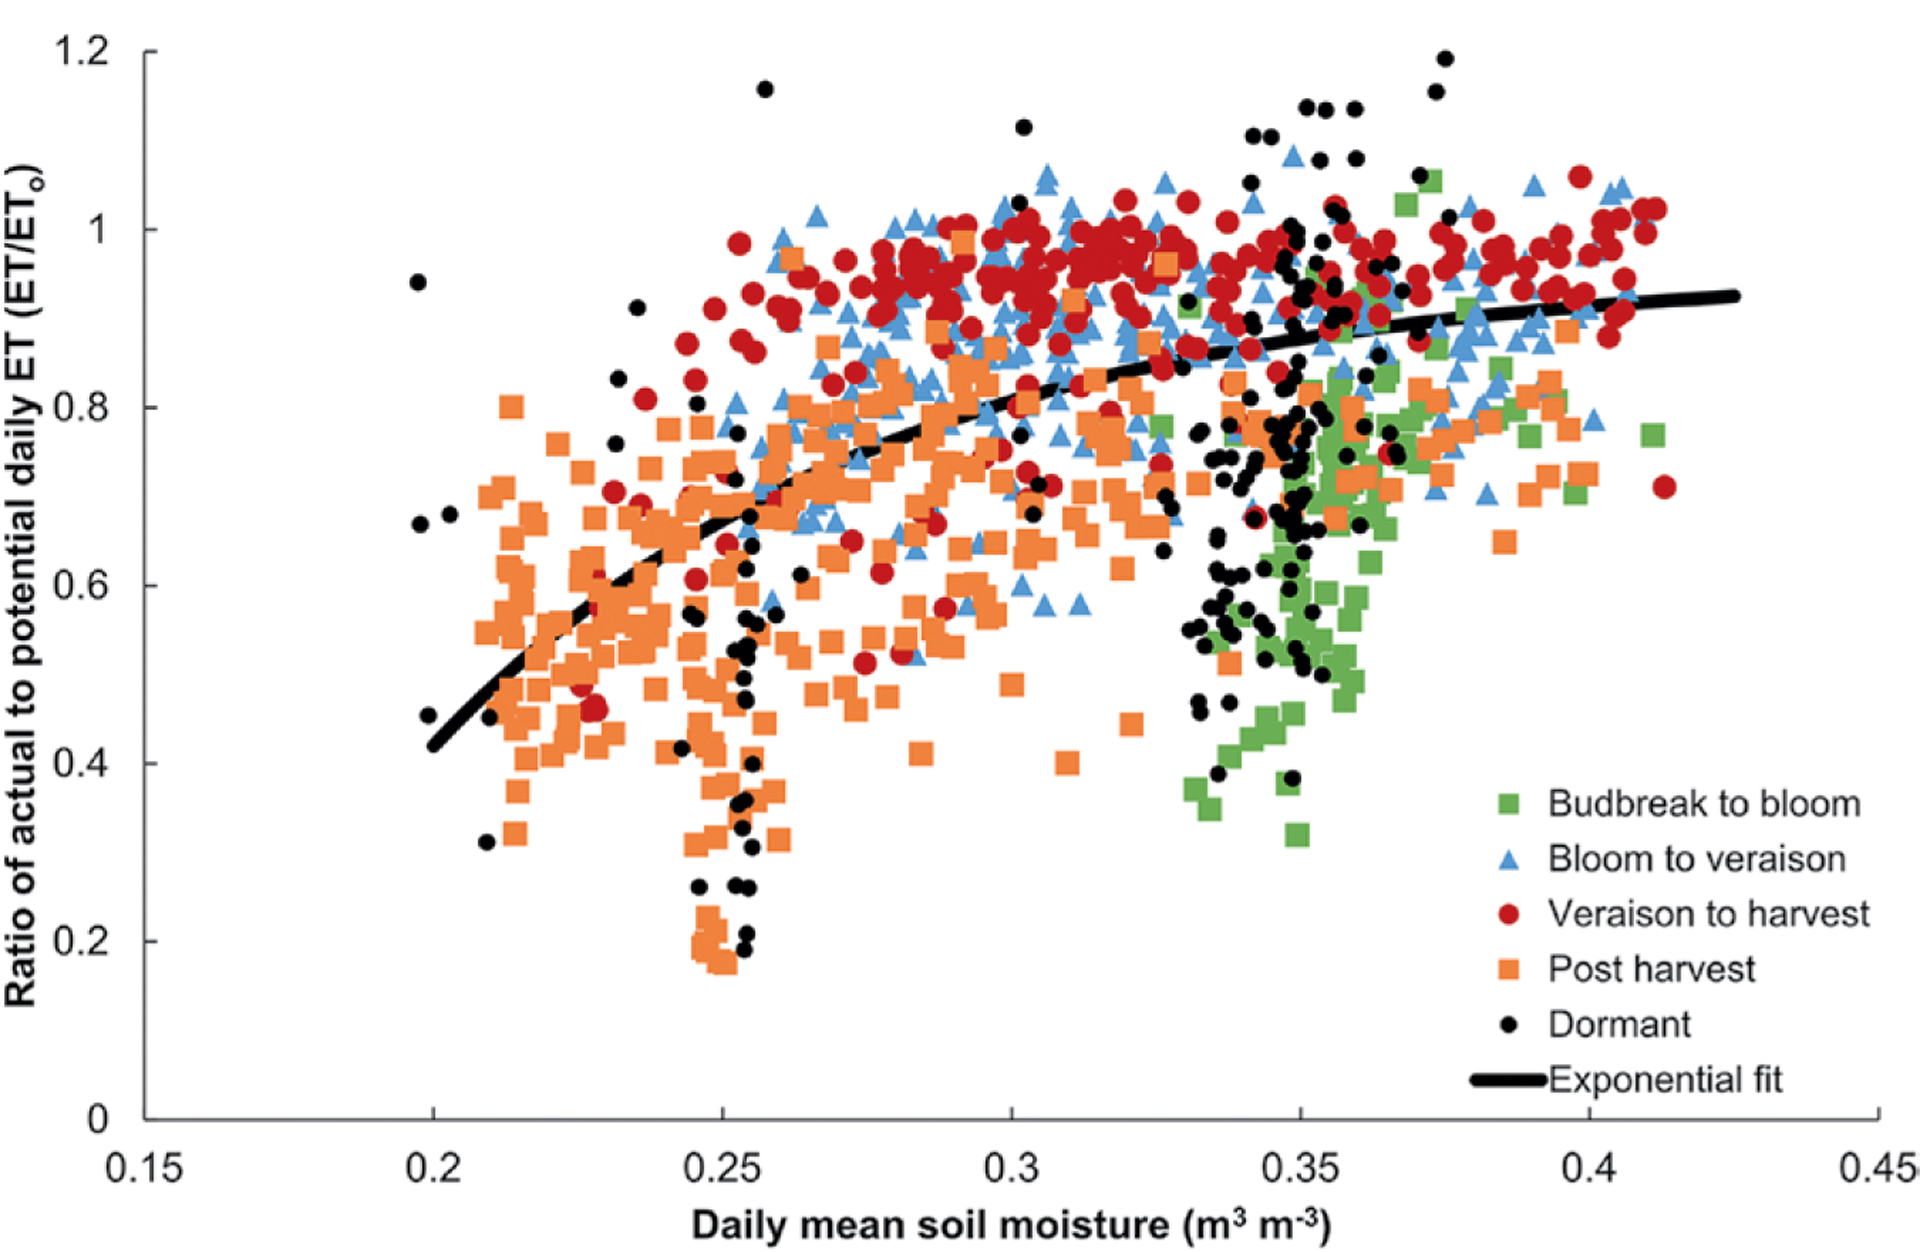
A comparison of profile average daily soil moisture vs ratio of actual to potential ET (ET/ETO) for 2013–16. The symbols represent data from different vine phenological stages. The curve is an exponential least squares fit through all the data.
Micro-BR and radiation measurements in the interrow.
To better understand the microclimate of the vine and interrow system, three micro-Bowen ratio stations were deployed during three IOPs in 2015. Additionally, for all years and IOPs, measurements of solar radiation reaching the ground were made across the vine–interrow system. These measurements will help to improve our understanding of radiation divergence through the canopy layer and to determine whether the model formulations for below-canopy flux exchange properly account for the unique effects of the vineyard architecture and microclimate (Kool et al. 2016).
An example of the diurnal fluxes from the three micro-BR systems is illustrated in Fig. 9, along with a photo and schematic illustrating the measurement design during IOP 2 (June 2015). There is significant spatial and temporal variation in the below-canopy fluxes due primarily to variability in radiation. The micro-BR unit located in the north-facing row underneath the vines receives little radiation over the course of the day and hence produces low fluxes. On the other hand, the micro-BR system under the south-facing vine row receives high radiation loading during midday and afternoon periods and yields significant soil heat and latent heat fluxes due to relatively wet soil conditions from the drip irrigation system. Interestingly the micro-BR unit in the center of the interrow yields large deviations in radiation and sensible heat flux values but with little temporal variation and magnitude in soil heat flux. In large part, this is due to a residue layer of senescent cover crop insulating the dry soil in the interrow.
Fig 9.
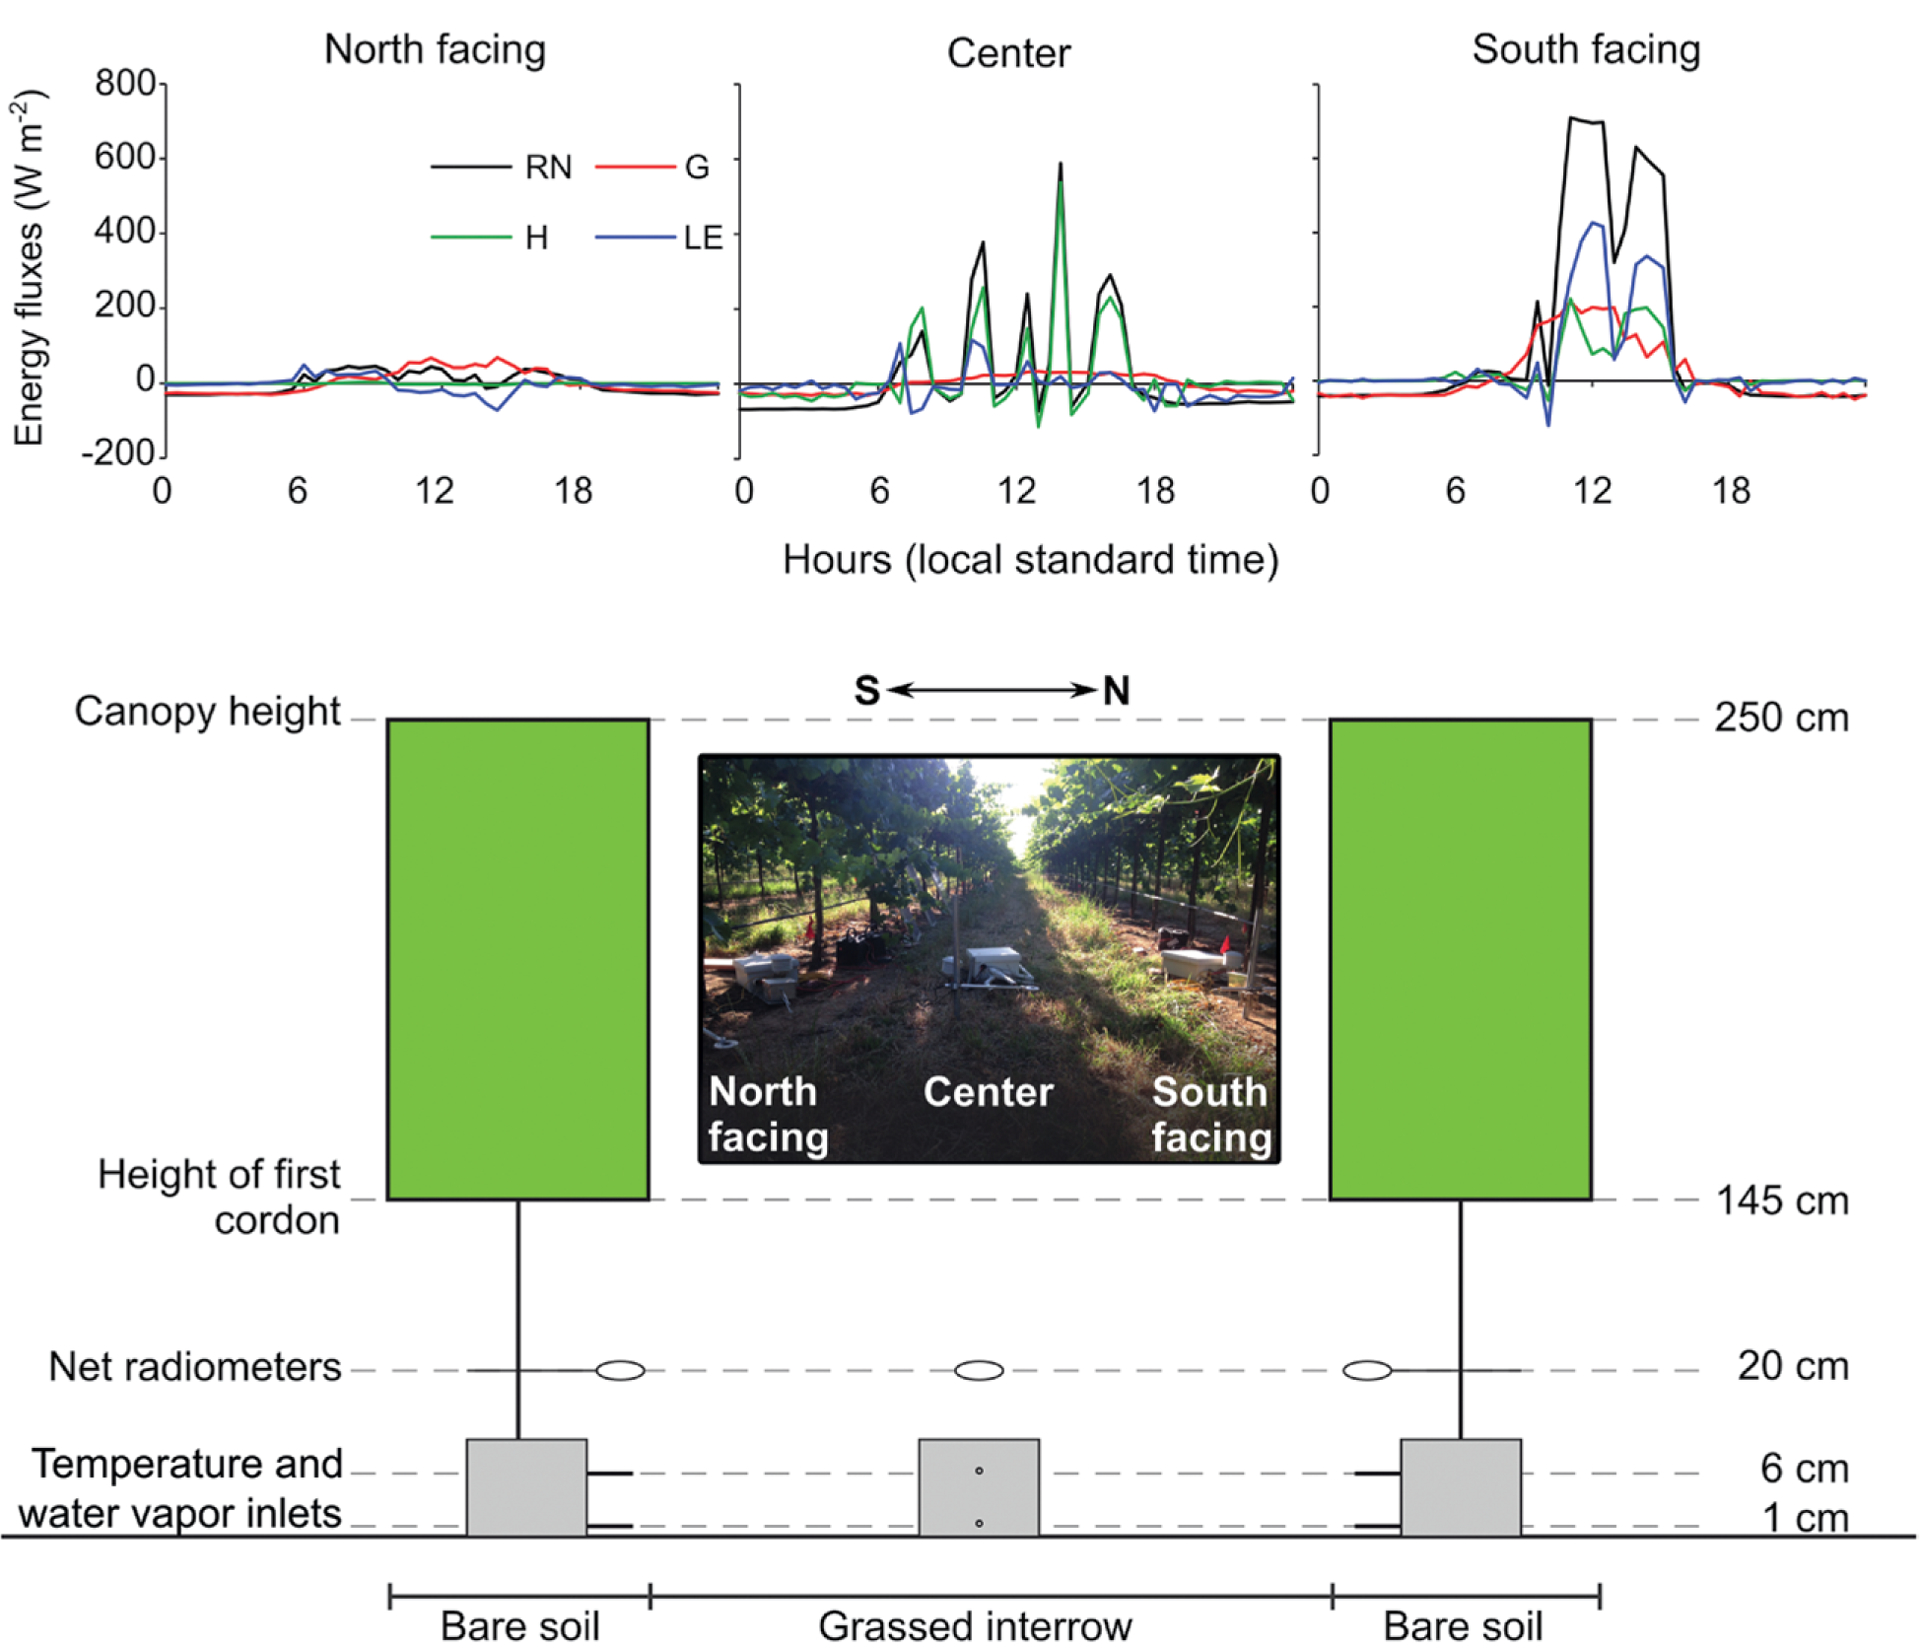
(top) The surface energy balance components for a day during IOP2 in June 2015 as measured by micro-BR systems located under the vines in bare soil area for the (left) north-facing vine row (the vine row south of the center of the interrow), (center) interrow, and (right) south-facing vine row (the vine row north of the center of the interrow). (bottom) Additionally, a schematic with photo illustrating the micro-BR deployment and measurement design.
The variation in solar radiation reaching the ground in the interrow and underneath the vines has great spatial and temporal variability as seen in the example from 11 July 2015 in Fig. 10, showing radiation measurements from five to eight sensors deployed across the interrow in the north vineyard (site 1) and south vineyard (site 2). These are fifteen min-average radiation values during peak vine cover and demonstrate that the greater biomass and leaf area of site 1 results in significantly less radiation reaching the ground surface. The heterogeneity in the vine canopy cover across the interrow results in the lack of a “smooth” sinusoidal radiation curve measured below the vine canopy.
Fig. 10.
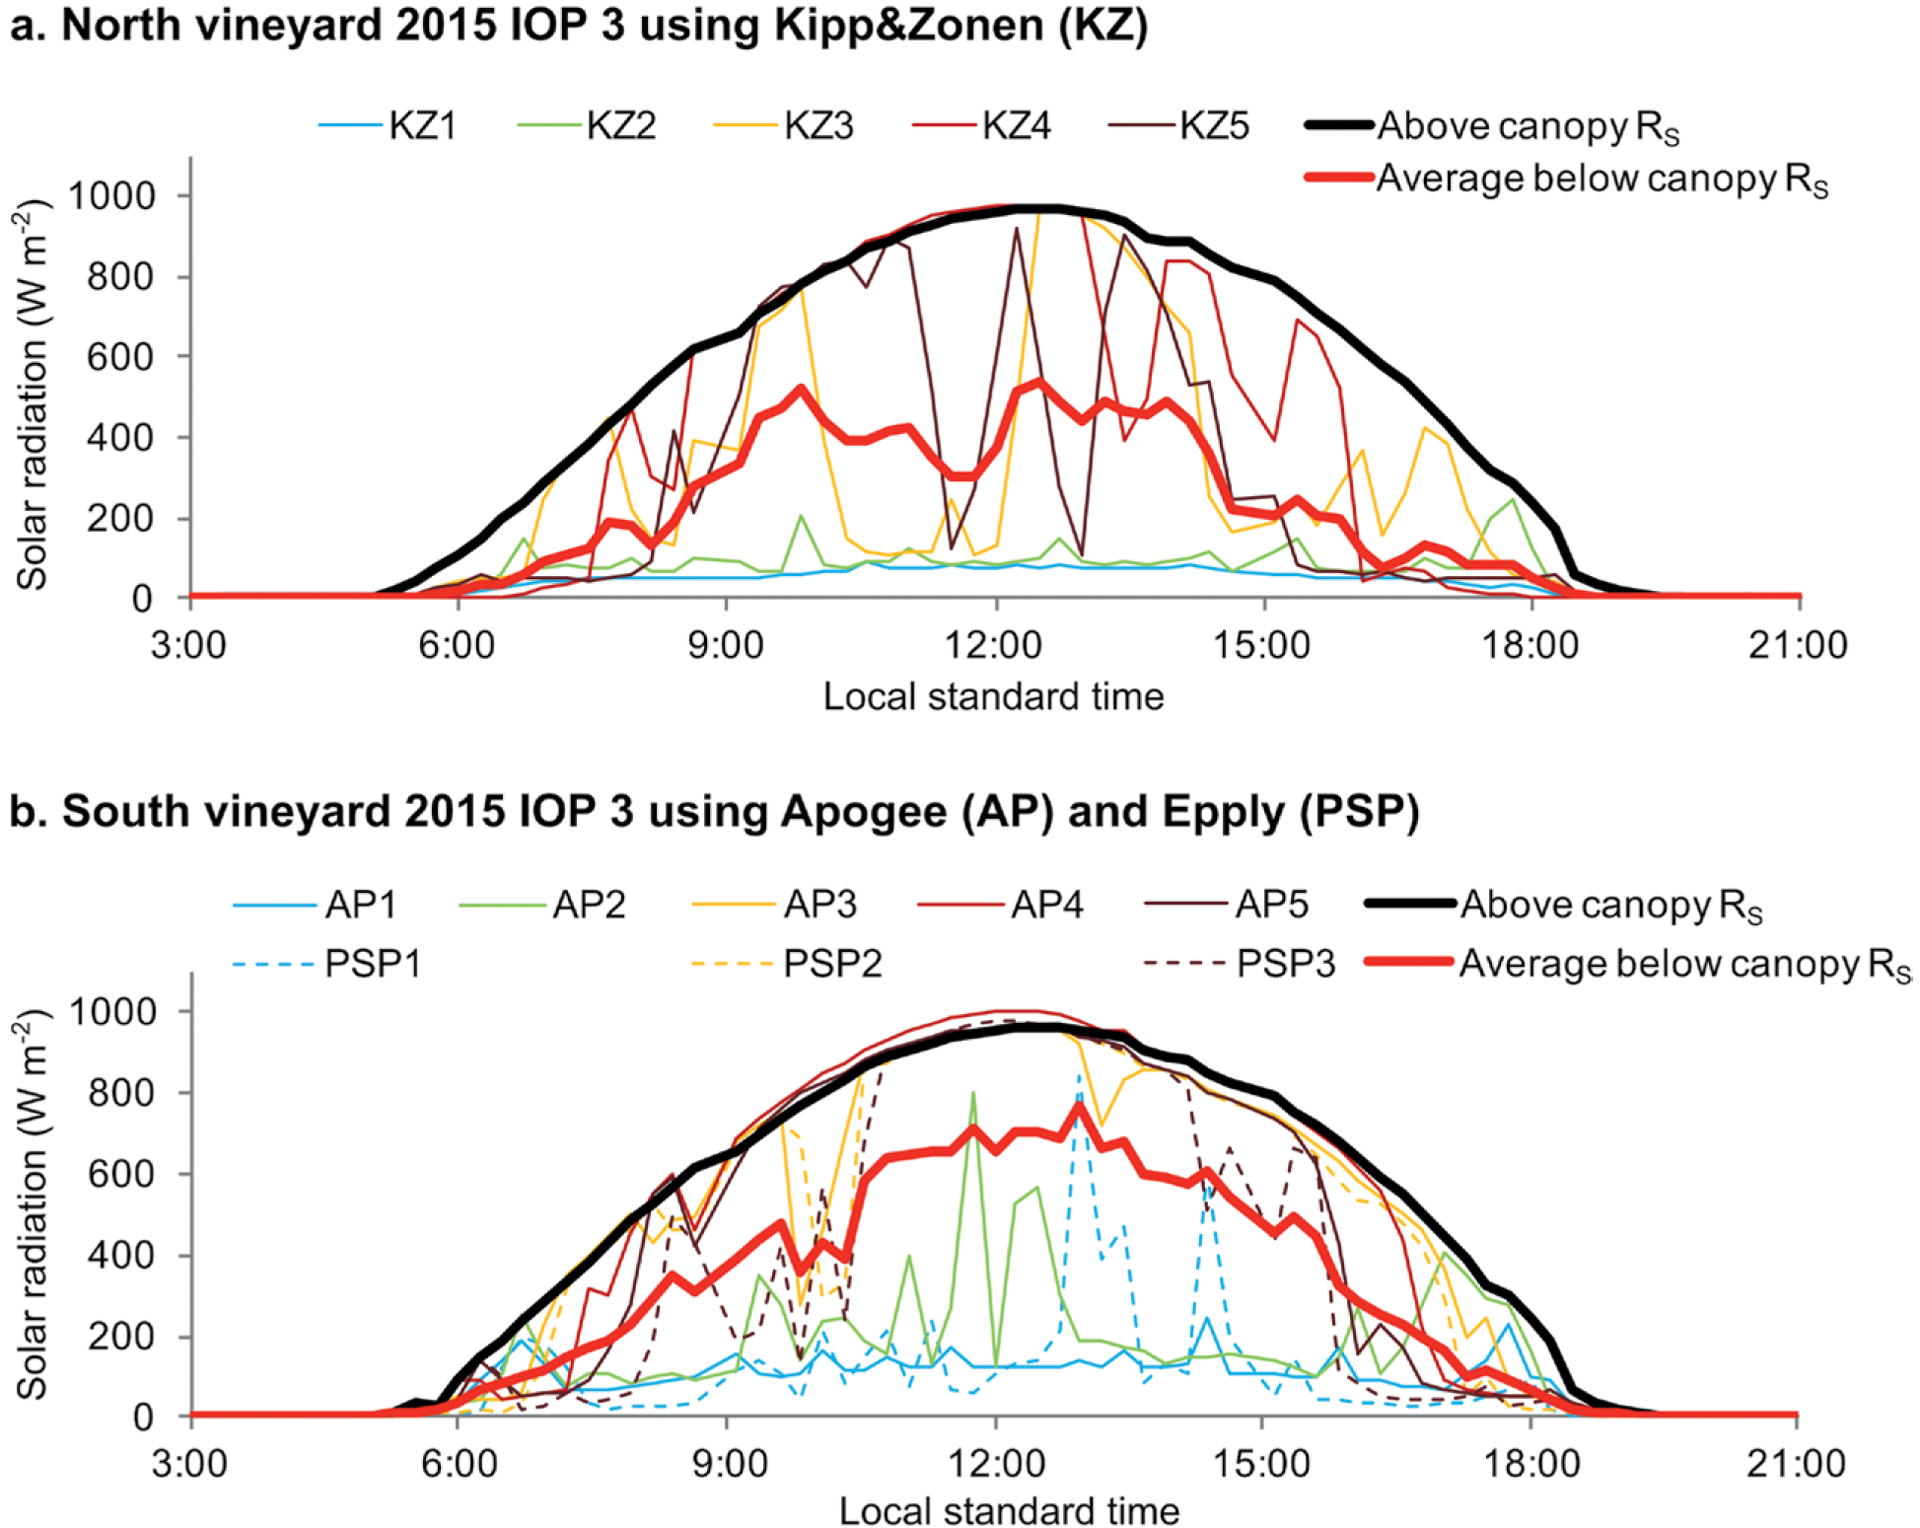
Diurnal radiation measurements above and below the vine canopy using five to eight radiation sensors at the north (site 1) and south (site 2) vineyards, respectively, for a clear day during IOP3 (11 Jul) in 2015.
Sap-flow measurements.
To evaluate model partitioning of ET into soil evaporation E and cover crop and vine transpiration T, vine sap-flow measurements were deployed at several locations in the vineyard to estimate vine T (see Fig. 2). The upscaling of sap-flow measurement to canopy level is challenging and will use LAI data collected in situ along with remote sensing–based estimates of daily LAI described below (Sun et al. 2017a). Transpiration estimates from sap-flow data will be compared to estimates from a new micrometeorological technique using turbulence data from eddy covariance flux towers that provide E and T at field scale. This method is based on flux-variance similarity theory and uses parameterized leaf-level water-use efficiency and analysis of the correlation structure of high-frequency carbon and water vapor concentration time series observations from each flux averaging interval (Scanlon and Kustas 2010, 2012). A preliminary analysis of the flux partitioning estimates using EC data for the month of June 2015 yielded a ratio of T to ET of 0.80 from sap-flow measurements versus 0.83 from the flux-variance approach. Other months and years during the growing season are currently being analyzed.
Surface Renewal.
The SR technique was proposed by Paw U et al. (1995) as a less expensive alternative to EC for estimating sensible heat flux. SR uses a fast-response thermocouple near the land surface to analyze the energy budget of air parcels that reside ephemerally within the crop canopy during the turbulent exchange process. The air parcels are manifested as ramp-like shapes in turbulent temperature time series data, and the amplitude and period of the ramps are used to calculate the sensible heat flux density. With an estimate of H, LE (and therefore ET) is computed as the residual of the energy balance equation (top equation in Fig. 3).
In early studies, the SR method required calibration when applied to different land-cover conditions (French et al. 2012) using 3D sonic measurements of H. However, it was recently shown that the calibration factor converges near the theoretically predicted value after compensating for the frequency response characteristics of the SR thermocouple (Shapland et al. 2014). This led to the development of an inexpensive, stand-alone SR method to measure sensible heat flux without the need for EC calibration.
Estimates of H from the SR station in the south vineyard were computed according to Shapland et al. (2014). The SR estimates of sensible heat flux collected over the 2015 growing season (from April through September) in the south vineyard showed good agreement with EC sensible heat flux (Fig. 11), yielding a least squares regression slope near 1 and a coefficient of determination R2 of 0.9. For daytime conditions with H > 50 W m−2, the mean absolute percentage error (MAPE), calculated as mean absolute error (MAE) divided by the mean of the observations multiplied by 100, was 20%. These results are consistent with recent findings showing strong correlation between stand-alone SR, EC, and weighing lysimetry in another experimental vineyard (Parry et al. 2018, manuscript submitted to Irrig. Sci.).
Fig. 11.
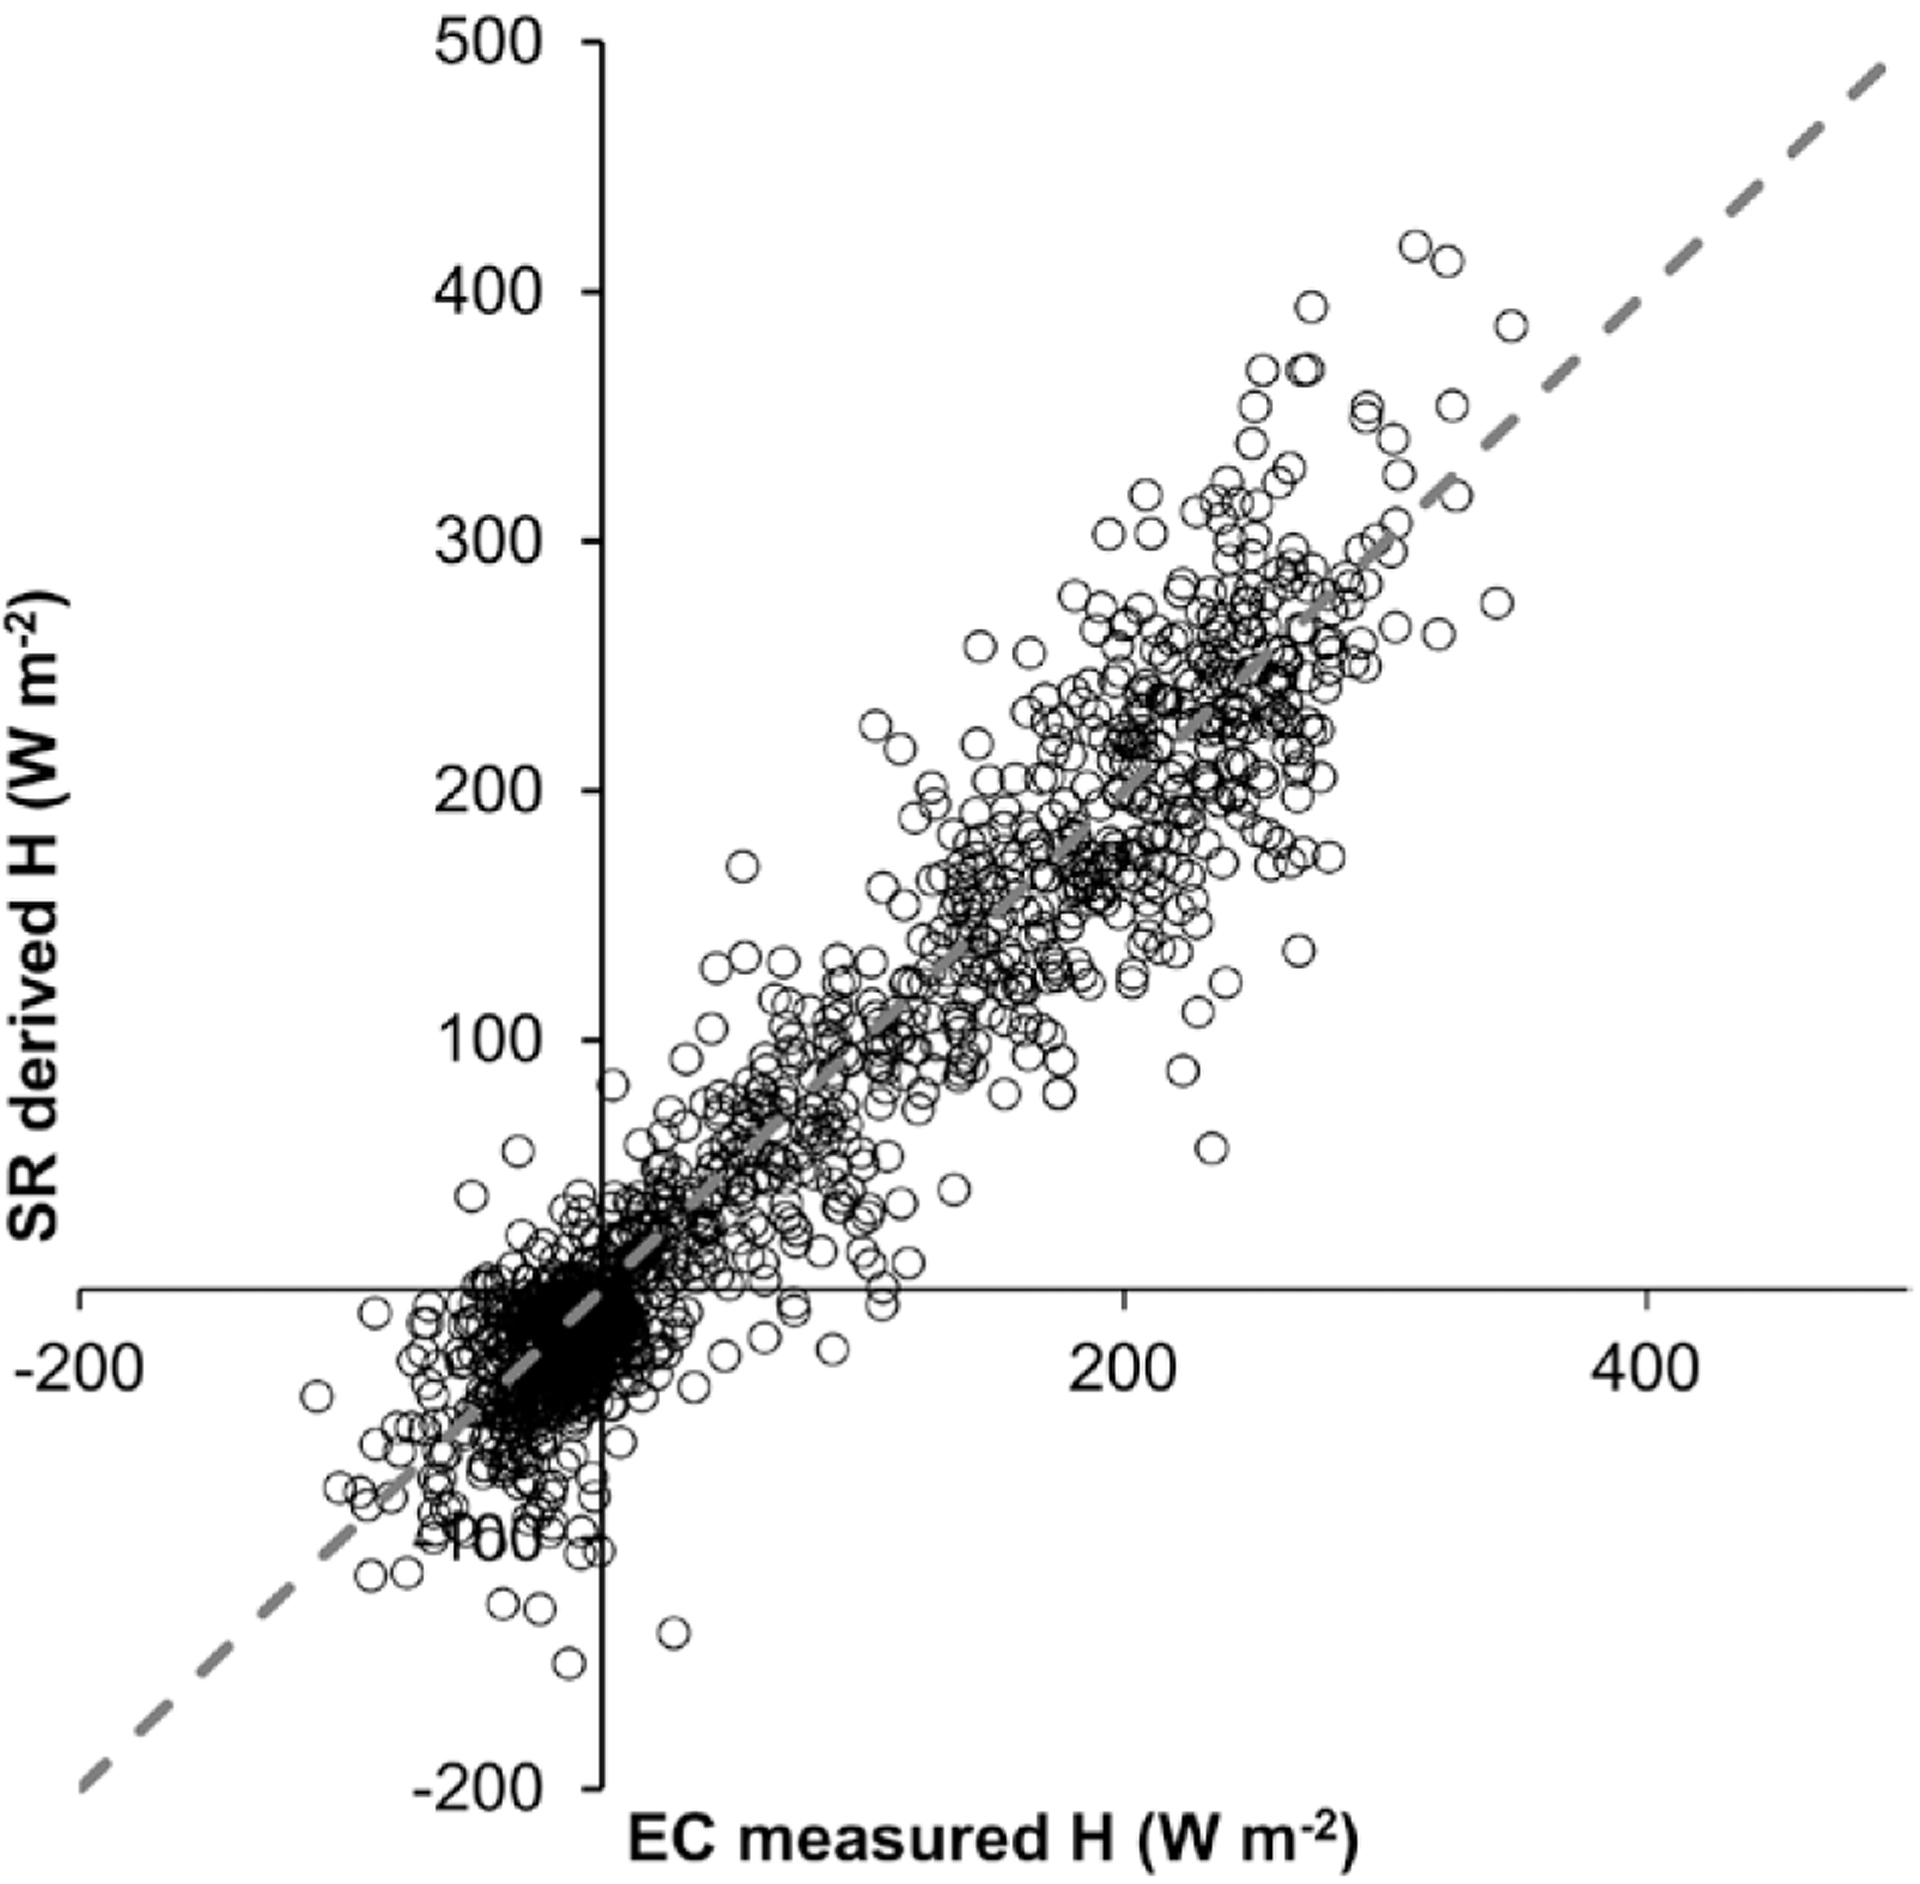
Hourly sensible heat flux H from eddy covariance measured at the south (site 2) vineyard flux tower and hourly H from the stand-alone surface renewal for the 2015 growing season. Dashed line indicates perfect agreement (1:1 line).
Evaluation of canopy formulations.
Radiation divergence within the canopy.
The downwelling shortwave radiation measurements below the vine canopy and across the interrow are being used to evaluate radiation divergence models of varying levels of complexity and methods for computing transmitted solar radiation through the canopy to the ground level. Modeled–measured differences are indicated by the scatterplots for selected models and error histograms for all models in Fig. 12. Models 1–3 use the Campbell and Norman (1998) radiation transfer model, while model 4 uses the four-stream Scattering by Arbitrary Inclined Leaves (4SAIL) model (Verhoef et al. 2007) and model 5 uses the Discrete Anisotropic Radiative Transfer (DART) model (Gastellu-Etchegorry et al. 1996). Four of the five models being tested (models 2–5) account for the unique canopy distribution of the vineyard-row-structured canopies. Models 2–4 use a geometric view factor approach (treating the canopy as either an elliptical or rectangular hedgerow), and model 5 characterizes the canopy as a three-dimensional structure. Model 1, which does not account for the canopy row crop distribution, uses an empirical clumping index meant for randomly placed canopies such as forests.
Fig. 12.
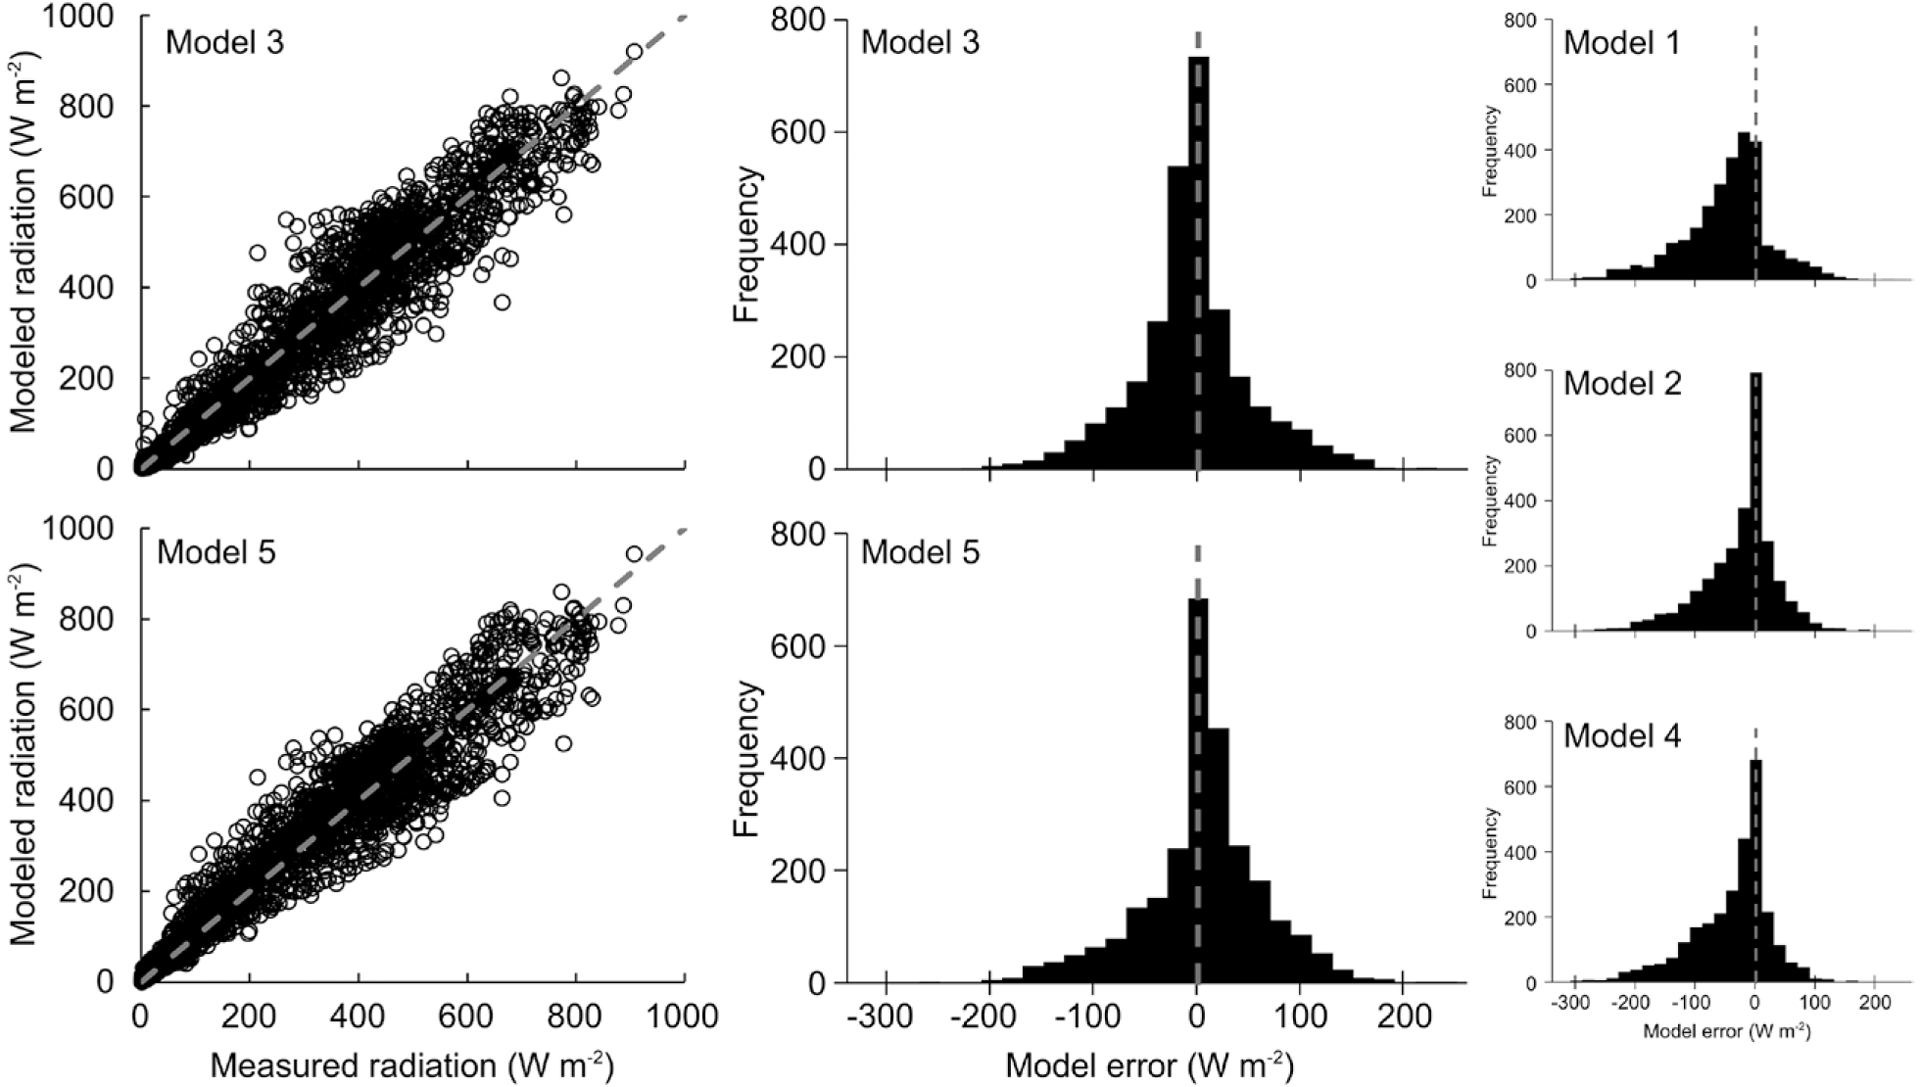
Comparison of solar radiation divergence model estimates with different levels of complexity (models 1–5) vs the below-vine-canopy solar radiation measurements (15-min averages). Error histograms for all the models indicate that the least bias and smallest error with the observations are from using models 3 and 5. Scatterplots for models 3 and 5 are provided with a dashed gray line indicating perfect agreement with observations (1:1 line).
While all five models had good agreement with the measured values (R2 ranging from 0.95 to 0.97), the models that treat row structure with greater geometric fidelity (models 2–5) showed significant improvement in comparison with the baseline (model 1) based on the error histograms. Of these, model 3 based on Colaizzi et al. (2010; 2012a) and model 5 (the most complex DART model) performed best, yielding the least bias and lowest overall error.
Canopy wind profile model.
A new canopy wind profile model proposed by Massman et al. (2017) accommodates nonuniform canopy structure and wind attenuation with depth throughout the canopy. Within-canopy wind measurements collected during GRAPEX IOPs are being used to investigate whether this new model provides a more physically realistic method for calculating wind speed attenuation for canopies of arbitrary foliage distribution and leaf area. In comparison with previously used canopy wind profiles in TSEB such as Goudriaan (1977) or Massman (1987, 1997), the new method uses an additional input describing the relative canopy foliage vertical distribution. In the case of our study site, the foliage distribution function is considered as a combination of Gaussian curves representing the foliage for the vine canopy and the cover crop layer underneath.
Preliminary results illustrated in Fig. 13 (top row) compare modeled below-canopy wind speed at 1.5 m AGL from the new Massman et al. (2017) model and the Goudriaan (1977) uniform-canopy wind model, originally used in TSEB, with measured horizontal wind speed from the 3D sonic anemometer deployed during the 2015 IOPs in the north and south vineyards. The new Massman formulation better reproduces below-canopy wind speed measurements in comparison with the Goudriaan approach, improving R2 from 0.42 and 0.69 at sites 1 and 2, respectively, to 0.54 and 0.76. When embedded within the TSEB, the Massman et al. (2017) model improved agreement with measured H fluxes (Fig. 13, bottom row) in comparison with the Goudriaan model, increasing R 2 from 0.6 to 0.7 and reducing daytime MAPE from ~30% to ~20% at both sites.
Fig. 13.
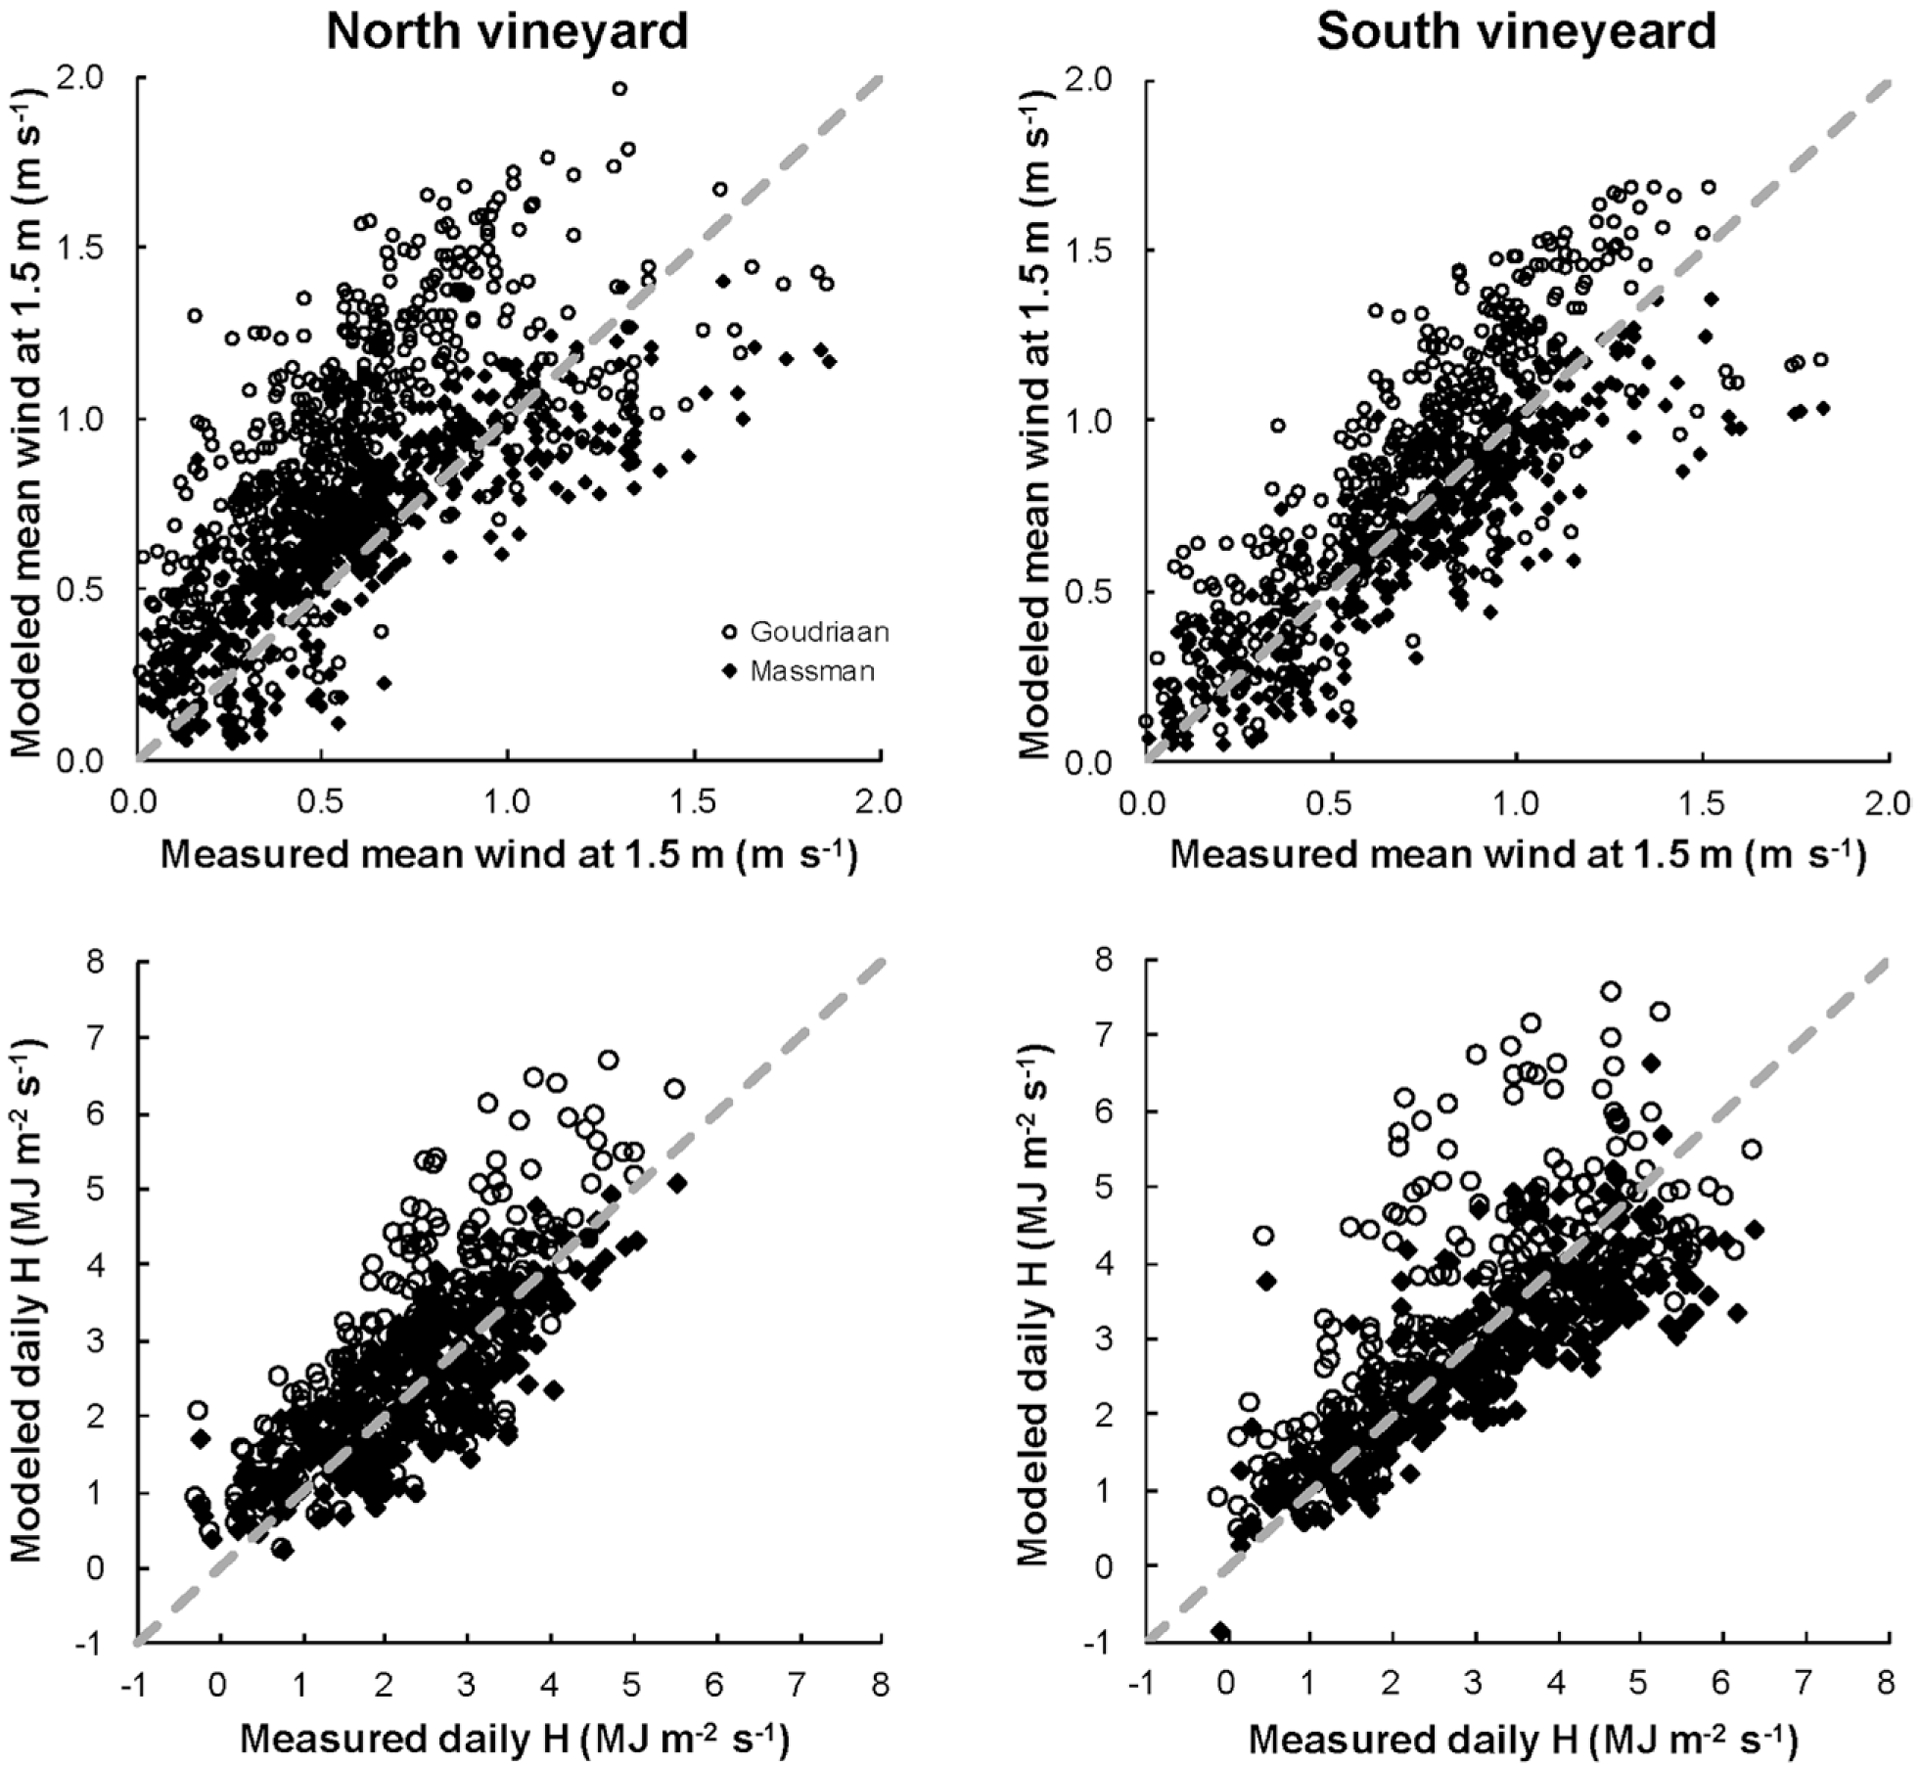
Comparison of (top) measured 1.5-m wind speeds vs TSEB values (15-min averages) derived using the Goudriaan and Massman within-canopy wind-extinction formulations for the north and south vineyards (sites 1 and 2) and (bottom) resulting impact on daytime-integrated sensible heat flux estimates over the 2015 growing season. Dashed line represents perfect agreement with the observations (1:1 line).
Evaluation of remote sensing products.
UAV data products.
For the AggieAir flights, an intermediate product from photogrammetric procedures applied to aerial imagery is the estimation of digital surface models (DSMs) describing surface topography. Because of the nature of the information (sunlight surface reflection or reflectance), these DSMs provide a topographic description of the illuminated objects in the aerial imagery, and with ground control points provided the DSM accuracy can be close to that of lidar products (vertical accuracy < 0.05 m).
Canopy volume estimations (Fig. 14) were made for individual vines in the vineyard using the DSM, derived from optical camera images at 0.1–0.15-m pixel resolution. To discriminate only canopy volume, a description of the vine spacing and trellis system, bare-vine trunk height, and survey-grade GPS coordinates of multiple bare soil locations were necessary. In operations, these canopy volume maps, which correlate well with the yield map (Fig. 14), may facilitate identification of dead/unproductive vines and within-season prediction of grape yield and its variability.
Fig. 14.
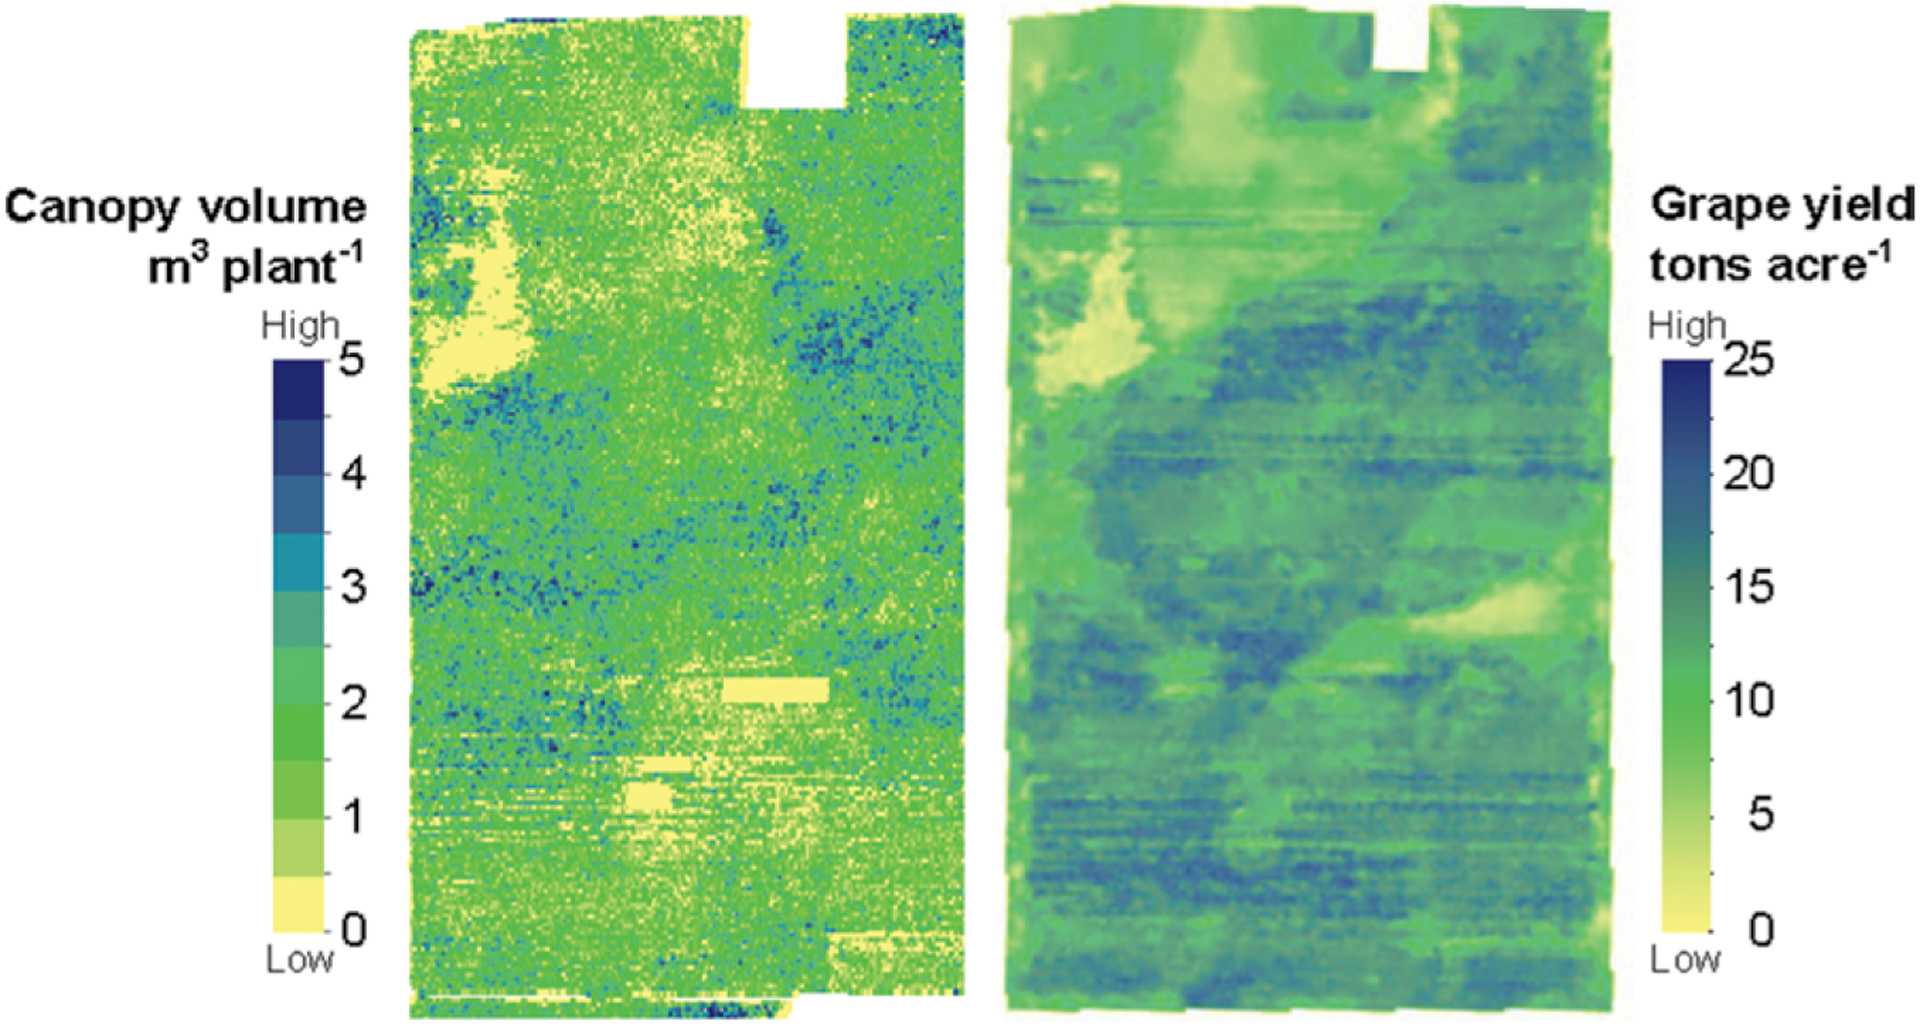
Example of (left) canopy volume estimated for individual vines for an AggieAir UAV flight in Aug 2014 and (right) the 2014 yield map for the north vineyard. Note the variability in canopy volume across the field and an area of highly stressed or dead vines in the upper left with little or no biomass.
The DSM maps also offer a detailed analysis of the influence of canopy structure and topography on signals recorded by imaging sensors. For example, vegetation oriented away from or toward the sun will appear darker or brighter, respectively, when compared to a horizontal flat surface. This microscale sun angle–canopy orientation affects the reflectance and temperature of images and introduces uncertainty in the analytic results obtained from the imagery (from simple vegetation indices to much more complicated ET or soil moisture estimates). Few studies are found in the literature that use airborne very high-resolution imagery to assess these issues, although correction methods have been developed to reduce the topographic influence on satellite data [e.g., Li et al. (2012) for Landsat-8 and Szantoi and Simonetti (2013) for Landsat-5, Landsat-7, and Système Pour l’Observation de la Terre 5 (SPOT-5)].
Related effects of canopy shadowing introduce another level of complexity to image processing known as shadow identification, deshadowing, or shadow correction (Fig. 15). Researchers have investigated shadow detection and removal from satellite imagery (e.g., Richter and Muller 2005; Arevalo et al. 2008). However, there are no analogous procedures developed for detection and removal of shadow-affected pixels for high-resolution airborne imagery. The impact of shadowing on ET estimation at high resolution is also being evaluated as part of GRAPEX (Fig. 15).
Fig. 15.
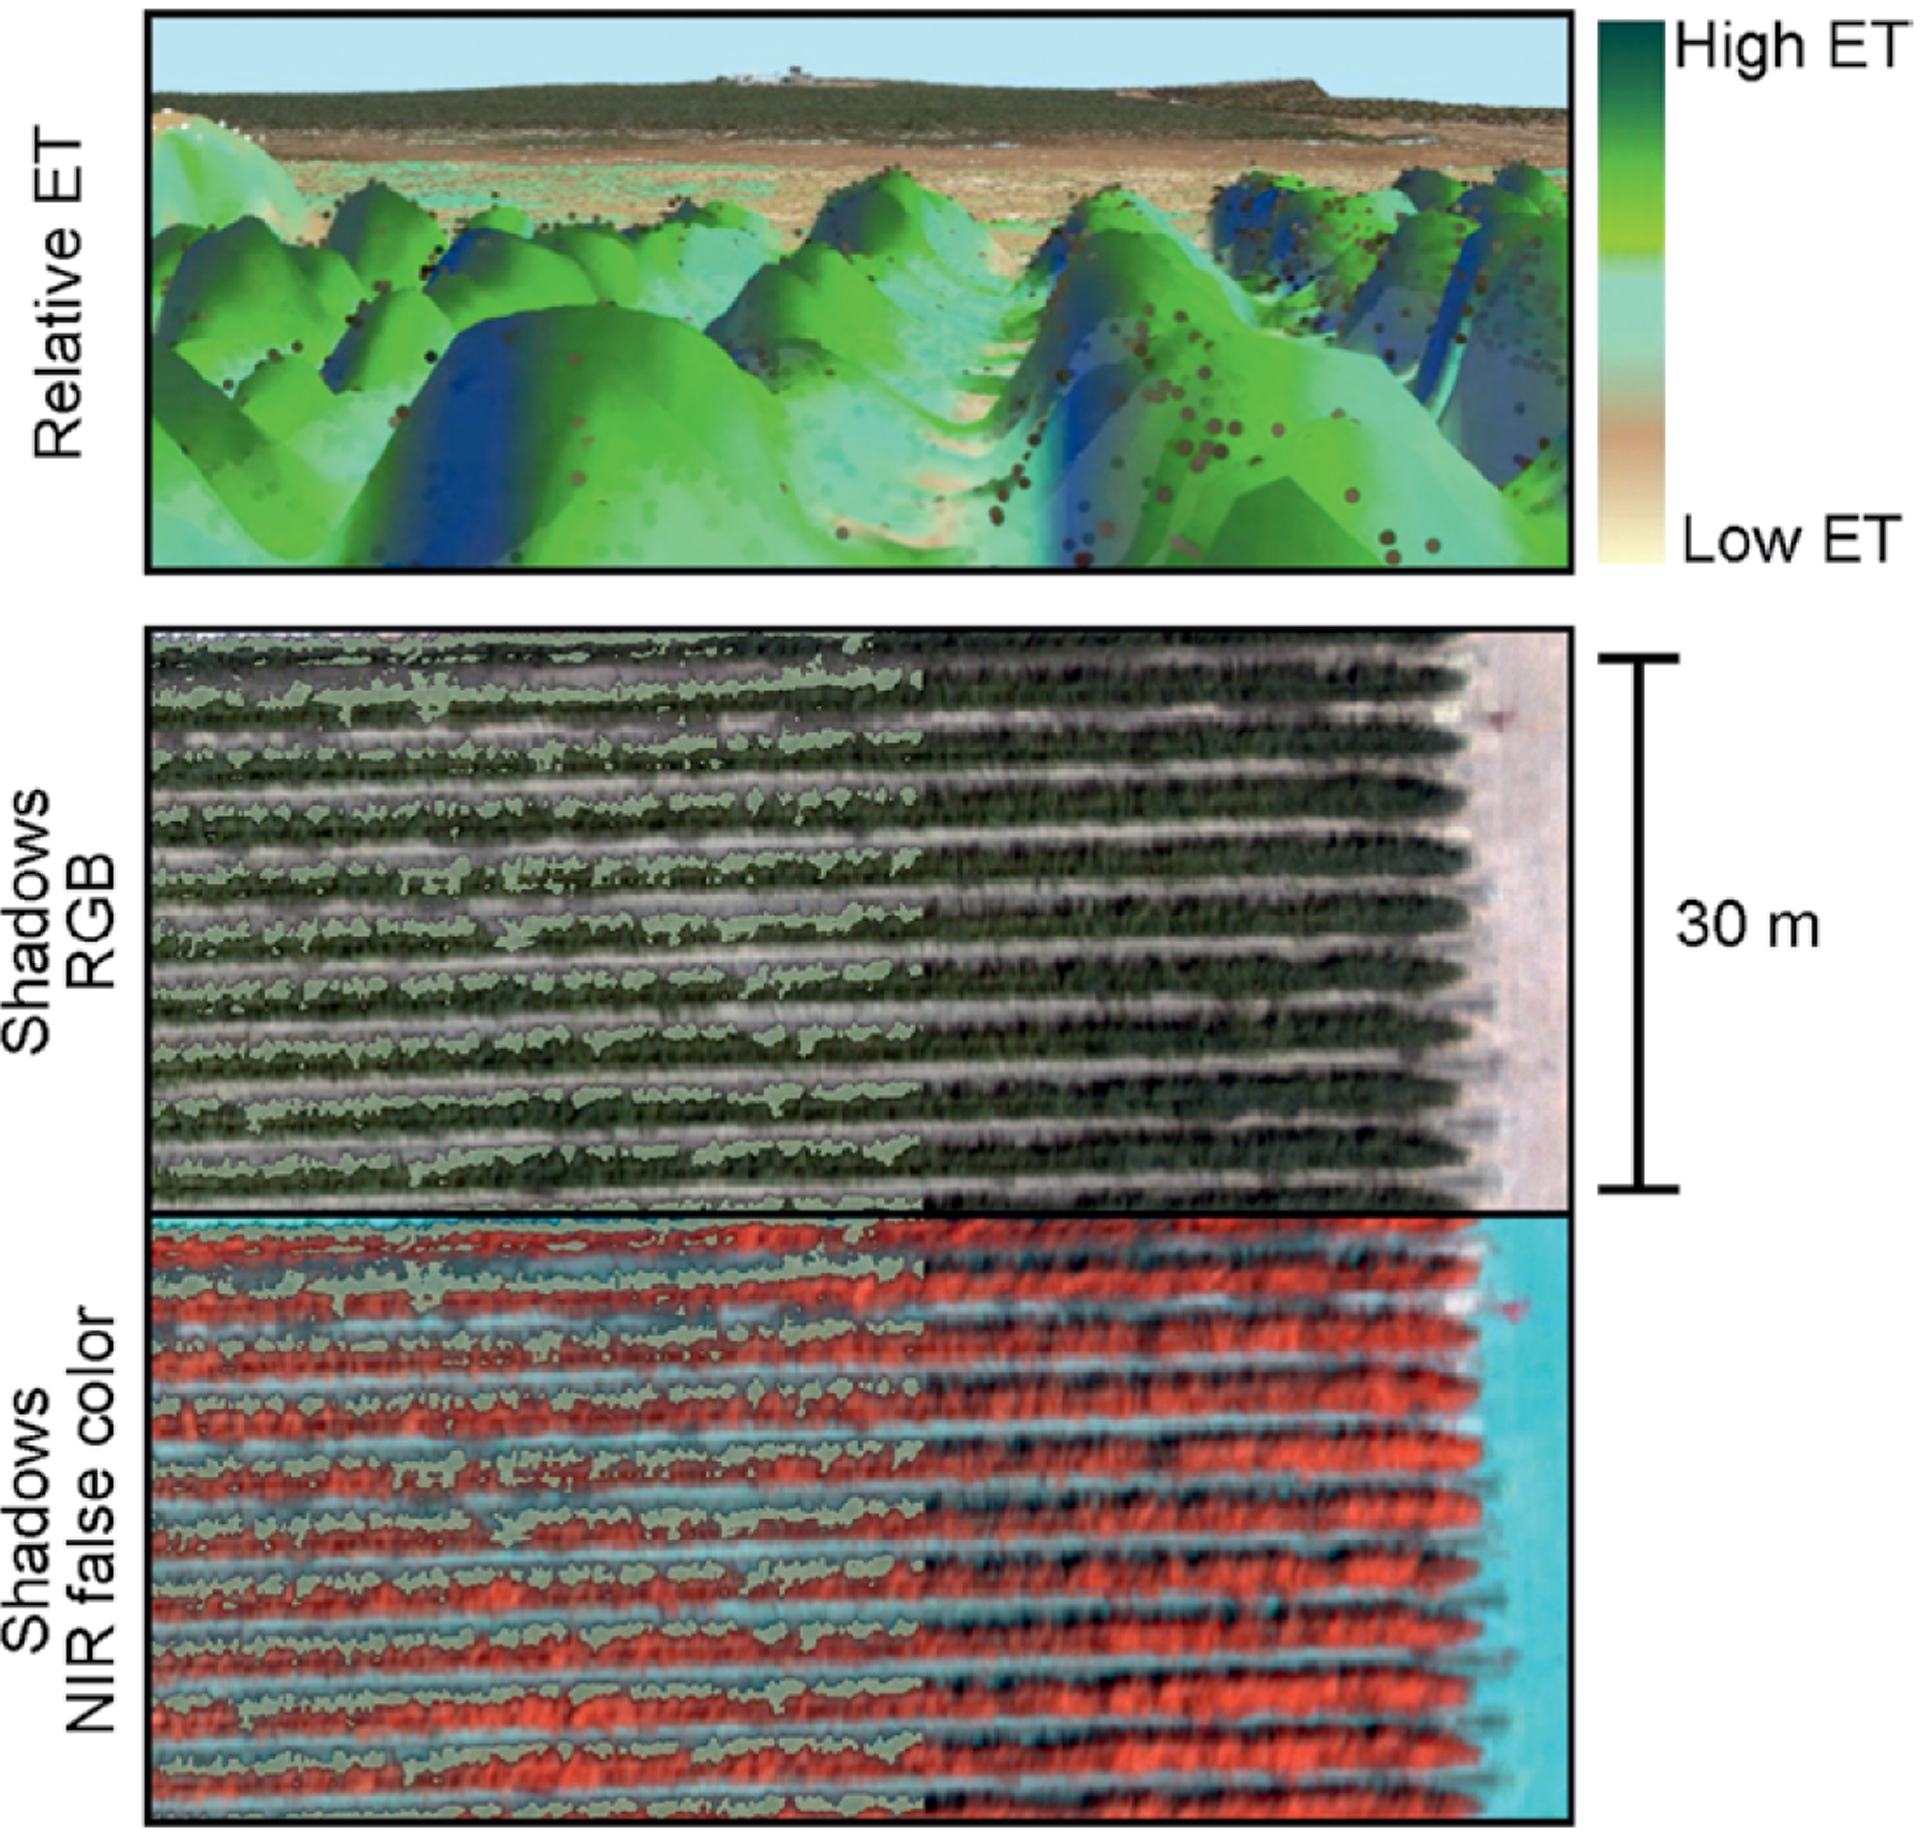
(top) Variation in modeled ET due to shadow/microtopography effects, generated using a DSM for a vine row viewed at different angles. Black and gray dots are the point cloud data. (bottom) Automated identification of shadow locations (light green color) along several rows overlay red–blue–green (RGB) and NIR false-color UAV imagery, respectively.
TSEB applications to UAV data.
The UAV imagery was used to test the performance of the TSEB at very high resolution, similar to the study by Hoffman et al. (2016). The original TSEB version, which assumes the canopy transpires at the Priestley–Taylor rate (Norman et al. 1995) as an initial first approximation (TSEB-PT), was applied to UAV-acquired thermal radiance data aggregated from the original 0.6-m resolution to 3.6-m resolution, approximately the scale of a single vine–interrow system (3.35 m wide). The submeter native resolution of the UAV imagery also allows the retrieval of the component canopy and soil/interrow temperatures that can be used directly in a two-temperature version of TSEB (TSEB-2T; Kustas and Norman 1997; Colaizzi et al. 2012b; 2016), which does not require an initial assumption of the canopy transpiration. Comparisons of EC flux observations with flux estimates from each modeling approach, generated using UAV data from 2014 and 2015, are shown in Fig. 16.
Fig. 16.
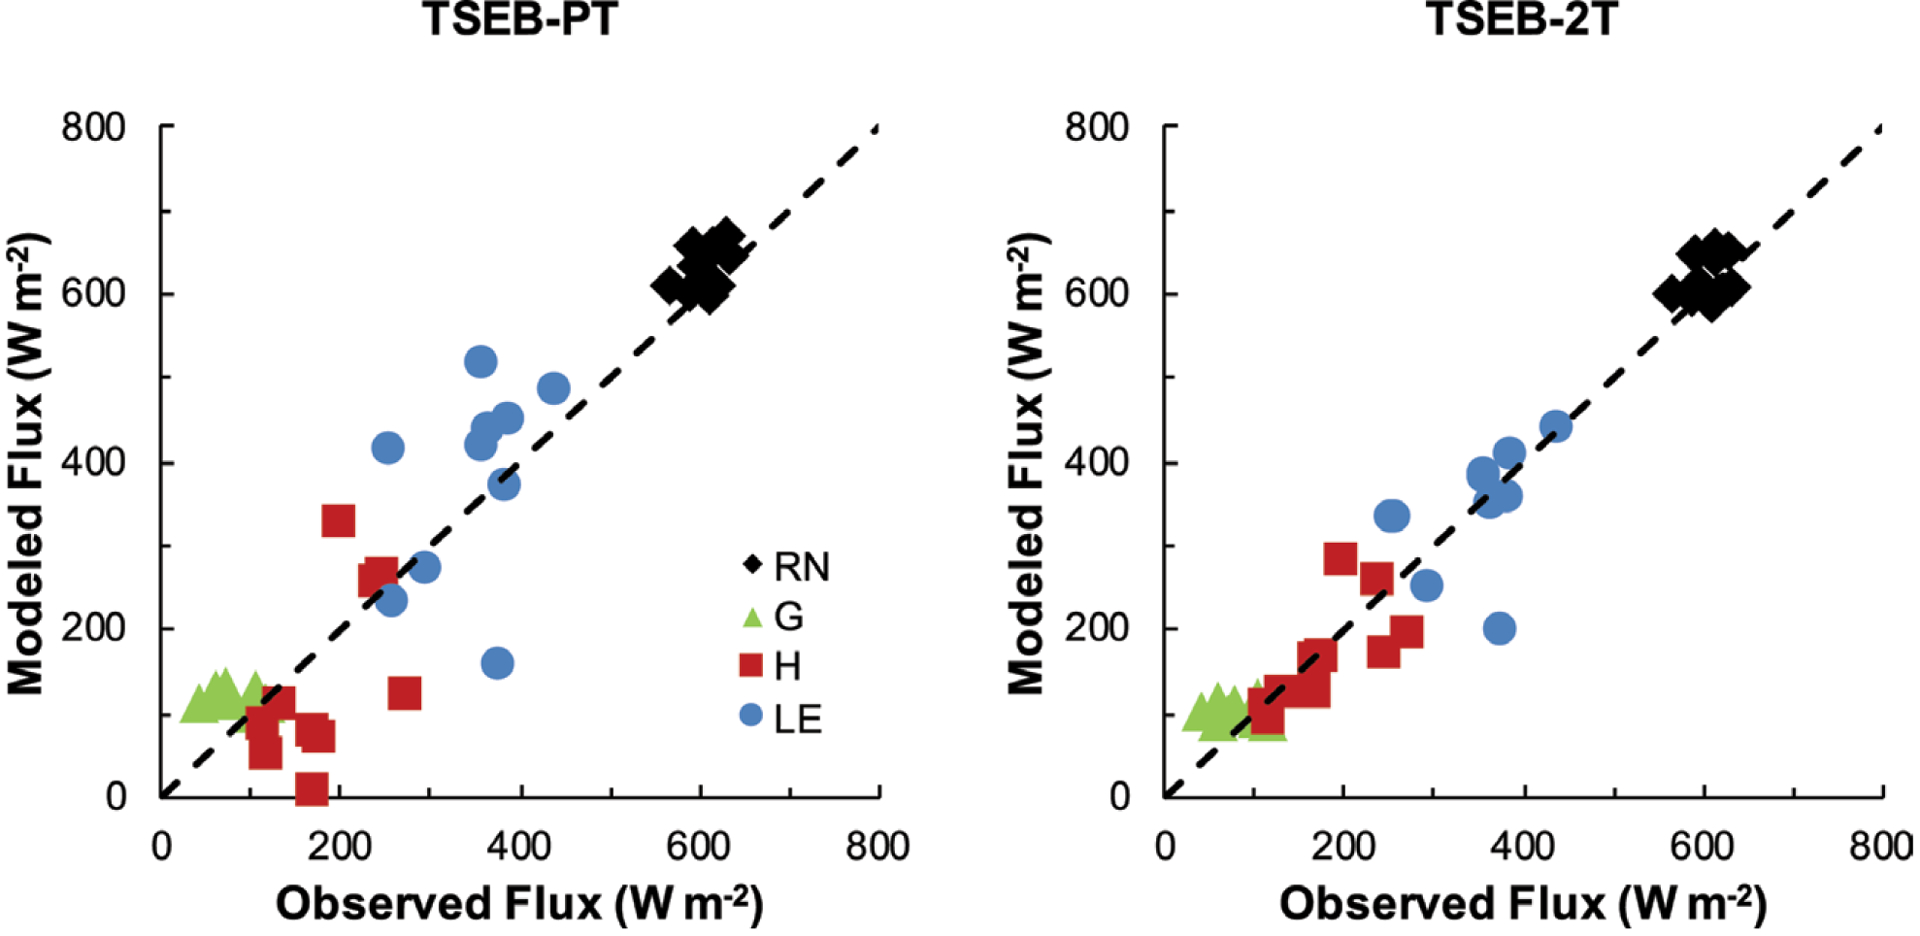
Comparison of TSEB flux estimates with energy balance components (RN, G, H, and LE) measured at the time of UAV overpass during flights in 2014 and 2015. Model results are shown (left) using composite temperatures and TSEB-PT and (right) using component temperatures and TSEB-2T. In both cases, the TSEB models were modified to account for radiation and wind transmission through row crops.
The TSEB-2T provides improved estimates of H and LE, with MAEs of 30 and 50 W m−2, respectively—nearly half of the MAE from TSEB-PT. For LE, the MAPE values were 25% and 15% for TSEB-PT and TSEB-2T, respectively. ET images generated by TSEB-PT and TSEB-2T for a UAV flight in early August of 2014 are illustrated in Fig. 17, indicating that both model versions produce similar ET patterns. The tendency is for TSEB-2T to have lower LE values in certain areas within the vineyards, indicating lower vine water use and perhaps some degree of stress. Tan areas, with LE close to zero, are found on roads, a paved residential area, and an area between the north and south vineyards composed of senescent grass. The small rectangular blocks of low ET in the north and south vineyards are protected vernal pools containing grasses and ephemeral wetlands, where vines are not allowed to be planted.
Fig. 17.
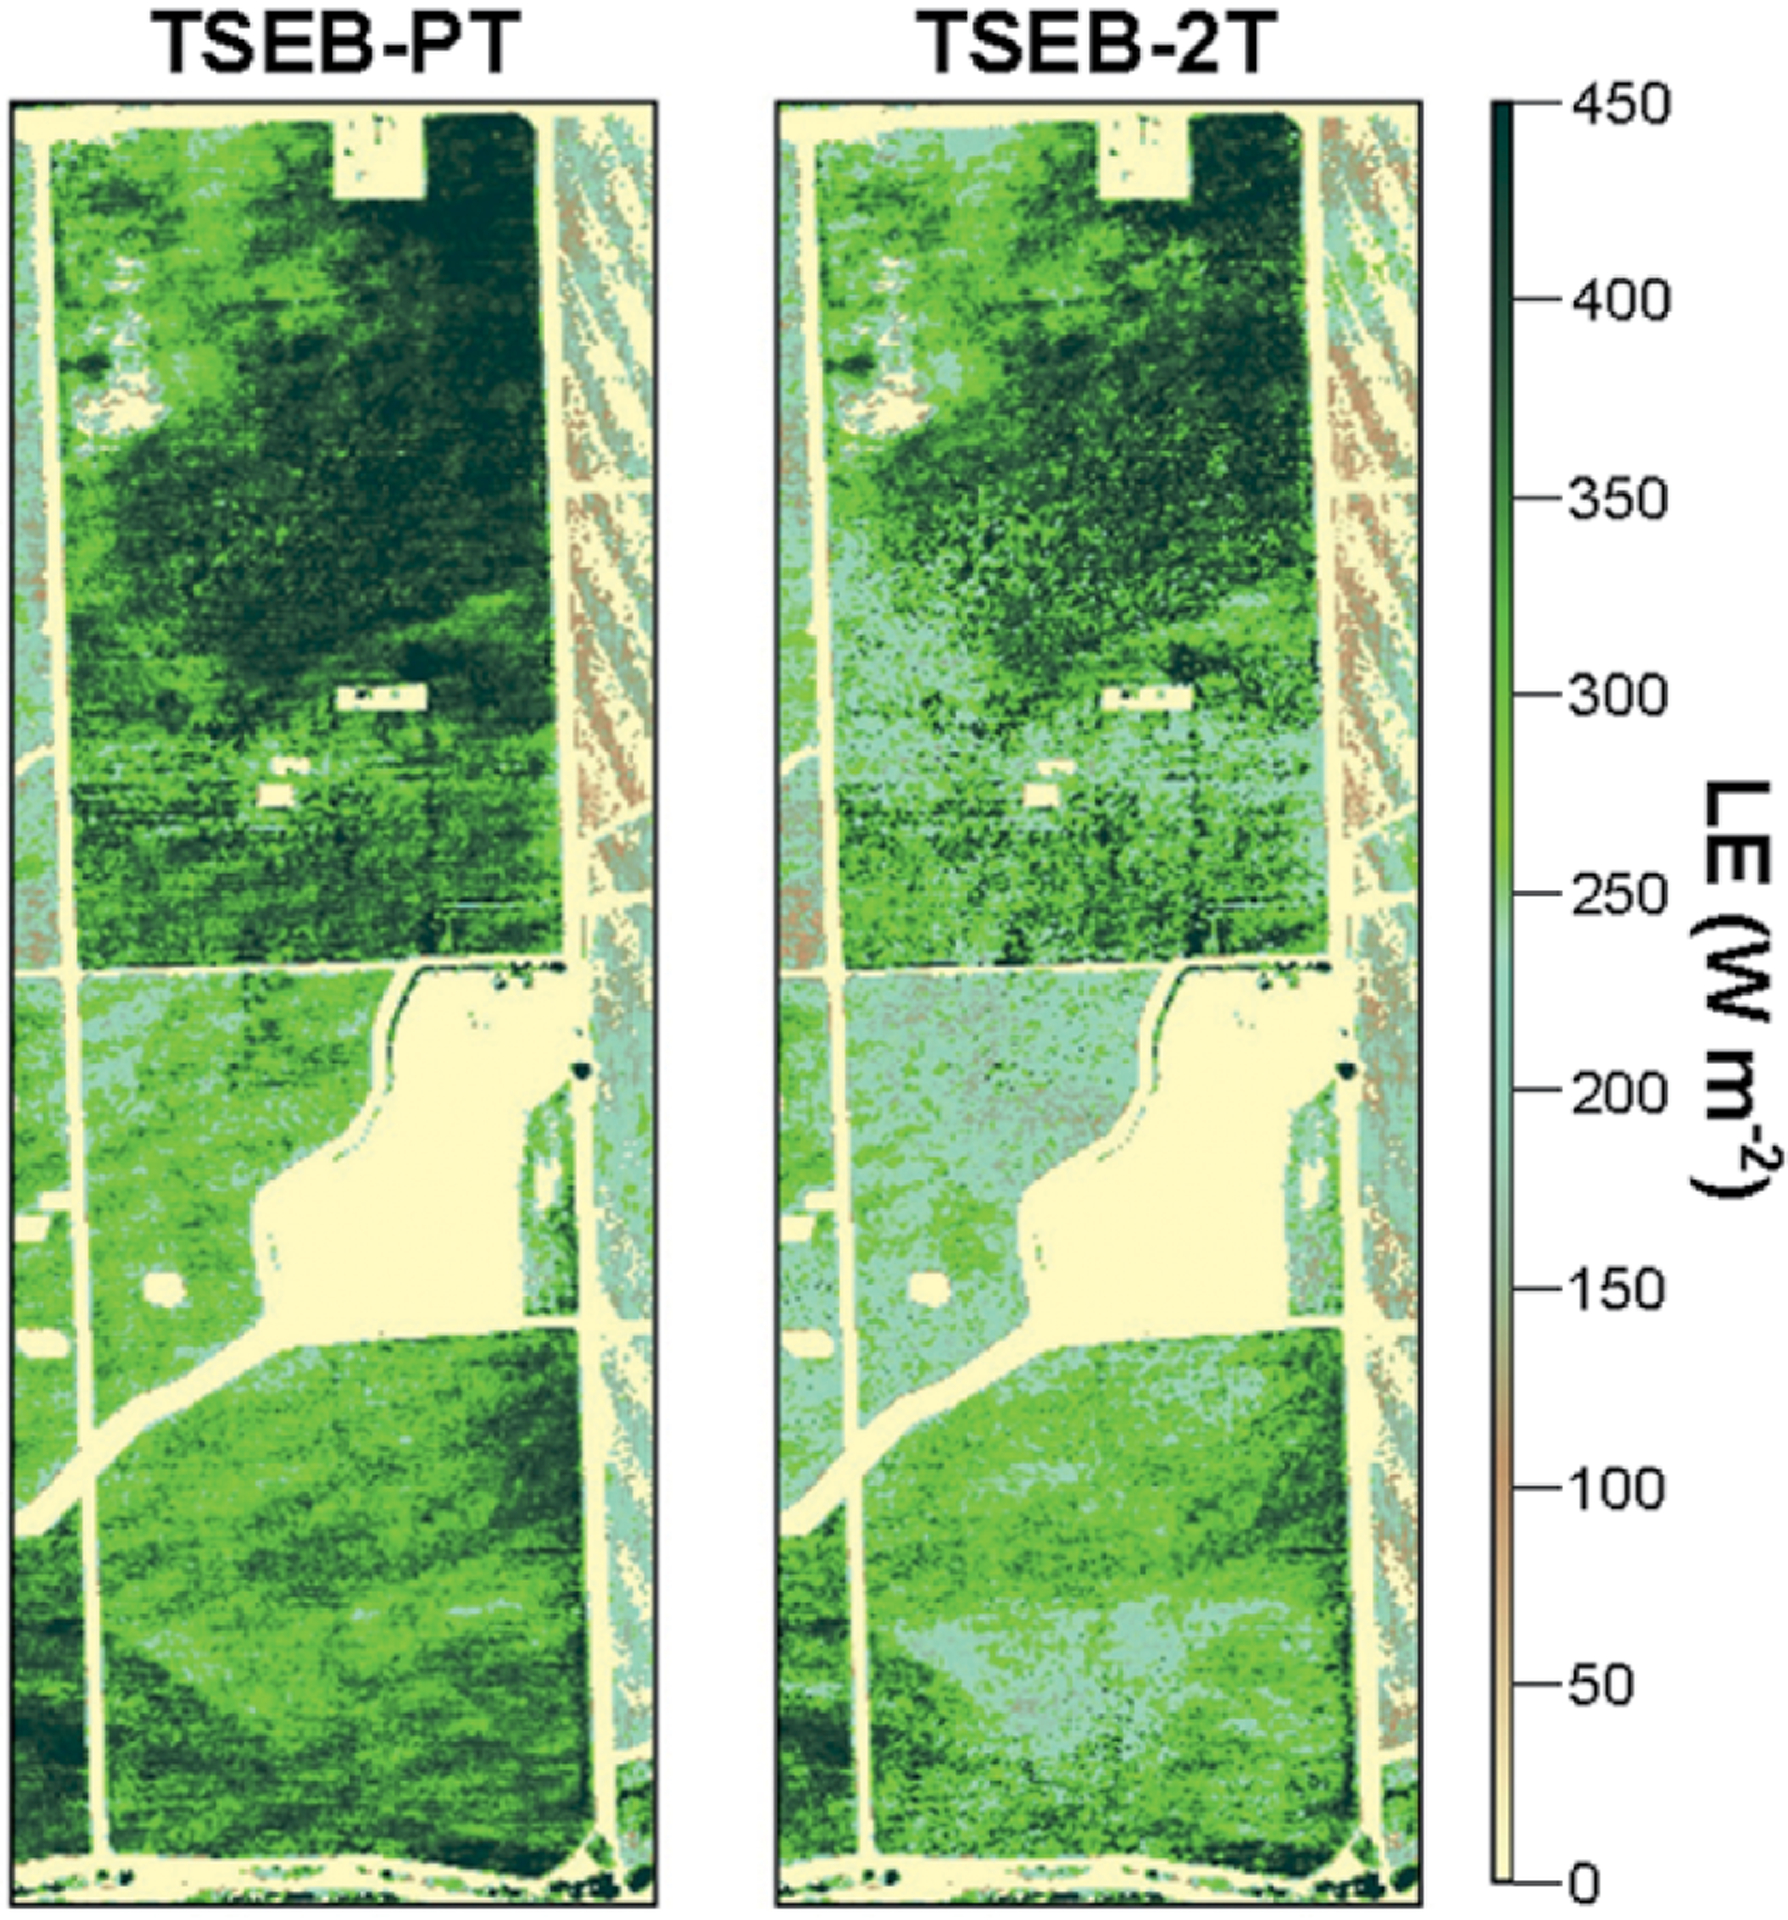
LE maps at 3.5-m resolution computed using (left) TSEB-PT and (right) TSEB-2T from the UAV imagery collected at the time of Landsat overpass on 9 Aug 2014.
Satellite-based LAI retrieval.
Leaf area index is a key input to TSEB (as well as many other land surface models) and a quantity associated with many biophysical applications (Myneni et al. 2002). Seasonal maps of LAI may also be useful for estimating grape yield in vineyards (Sun et al. 2017a). A machine learning approach (Gao et al. 2012) was applied to generate daily LAI maps at 30-m resolution over the GRAPEX field sites using Landsat surface reflectance and the MODIS LAI products. In this approach, the Cubist regression tree software was applied to train LAI and surface reflectance at the MODIS 1-km resolution. The resulting regression trees were then applied to the 30-m resolution Landsat data to generate LAI maps at Landsat scale (see example in Fig. 18). Comparison of retrieved Landsat LAI with ground LAI measurements in the north and south vineyards from 2013 to 2016 yielded an MAE of 0.44 and an MAPE of ~25% (Sun et al. 2017a). An example of the time series in daily LAI estimated from Sun et al. (2017a) versus the LAI ground sampling in 2014 near the flux towers indicates good agreement (Fig. 18). Also shown is a LAI map for the north and south vineyards at 30-m resolution near the time of peak LAI.
Fig. 18.
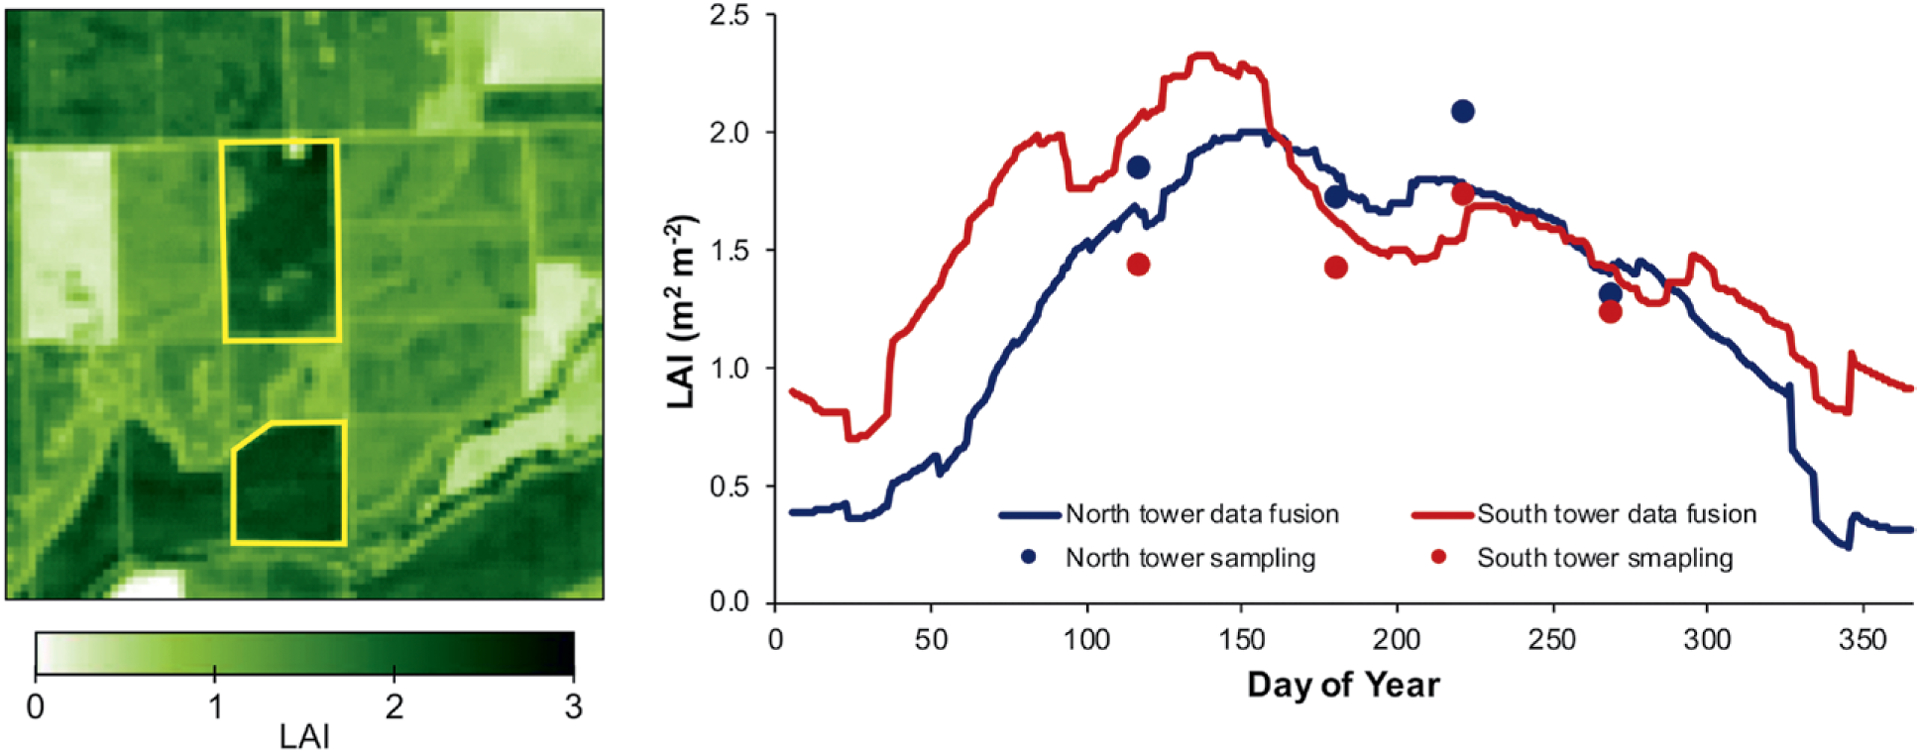
(left) A map of LAI at 30-m resolution for the north and south vineyards within the yellow boundaries at around peak LAI for year 2014 growing season, and (right) a comparison of ground-measured vs satellite-derived daily LAI near the flux towers in the north and south vineyards over the 2014 growing season [see Sun et al. (2017a) for details].
Satellite-based ET retrievals.
The performance of a prototype ALEXI–DisALEXI–data fusion ET modeling system was evaluated for the 2013 growing season by Semmens et al. (2016), yielding MAEs of 0.7 and 0.75 mm day−1 and MAPEs of ~19% and 23% in comparison with daily flux observations from the north and south vineyards, respectively. With additional years of data and model improvements based on GRAPEX field observations, model performance has improved, particularly in the ability to recover springtime evaporative fluxes, which are critical to decisions on when to start irrigation. We can now compare daily ET over multiple full annual cycles, yielding MAE values of 0.6 mm day−1 and MAPE values of 18% for both sites for the period 2013–16 (Fig. 19). The model will continue to be refined, testing the new formulations for in-canopy wind profile and radiation divergence described above, which are likely to improve agreement with the ET observations. We will also use sap-flow-based estimates of vine transpiration to test the ET partitioning capabilities of TSEB at the 30-m Landsat pixel scale. Additionally, with multiple years of daily ET maps at 30-m resolution, we can begin to investigate changes in water use that are occurring over the landscape due to varying climate as well as changes in land-use and water management strategies (Fig. 19).
Fig. 19.
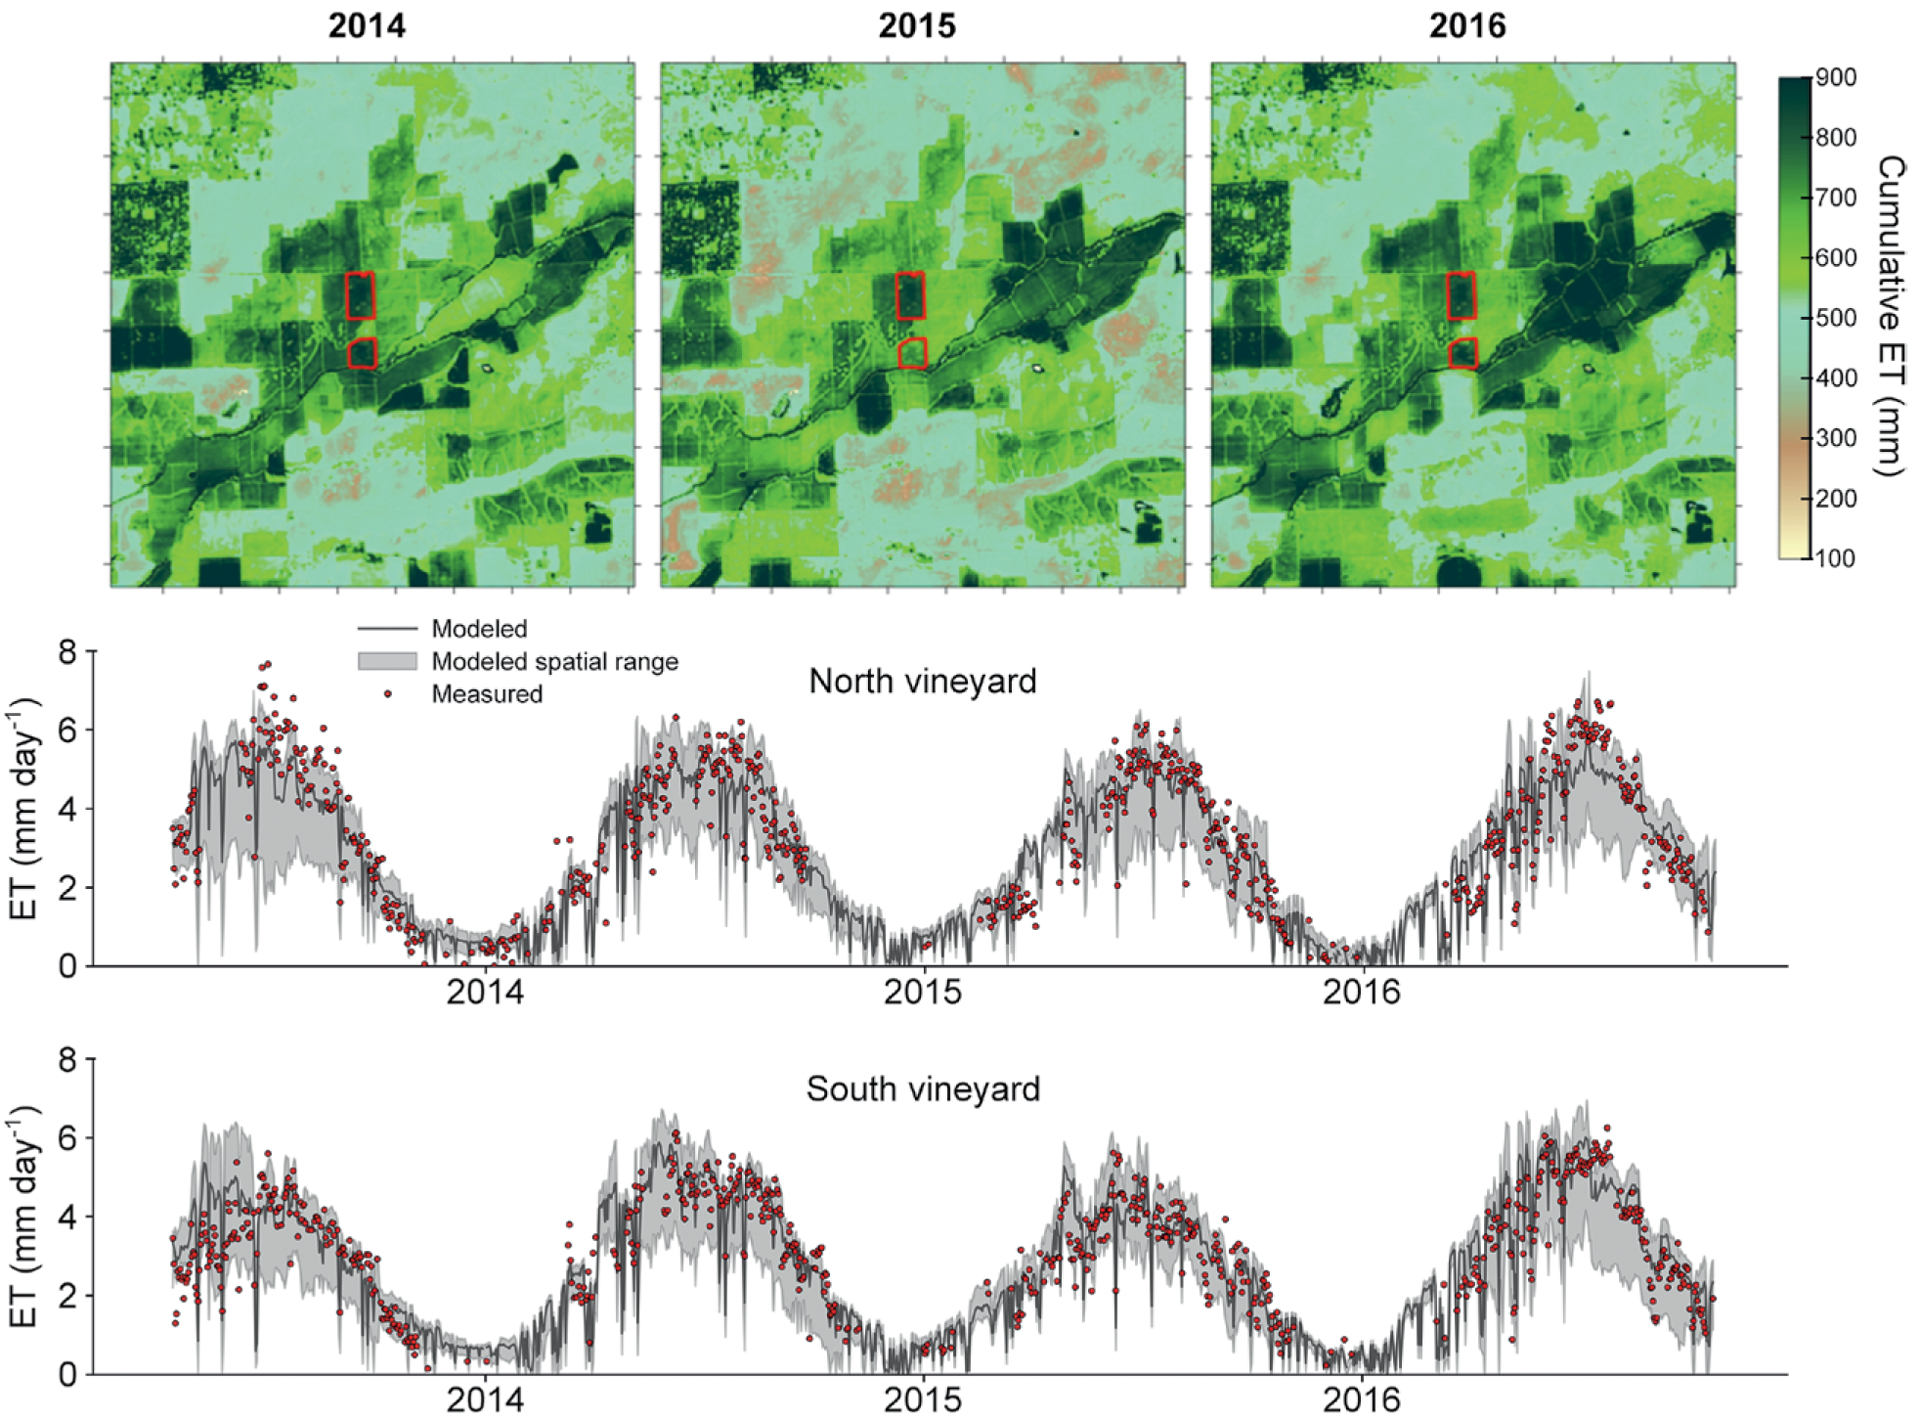
(top) Cumulative ET (mm) map at 30-m resolution over the growing season (1 Mar–1 Sep) for a 9 km × 9 km area surrounding the north and south GRAPEX vineyards and (middle),(bottom) daily ET modeled over the estimated tower footprint (black line) as well as the maximum and minimum (range; gray shading) in ET vs observed (red dots) for the north (site 1) and south (site 2) vineyards, respectively.
FUTURE OF GRAPEX.
Domain expansion—Capturing the climatic gradient in the Central Valley.
In 2017, the GRAPEX project has extended observations both north (Barrelli vineyard; 38.75°N, 122.98°W) near Cloverdale, California, and south (Ripperdan vineyard; 36.84°N, 120.21°W) near Madera, California, of the current vineyards (Borden Ranch vineyard; 38.29°N, 121.12°W) near Lodi, California (Fig. 20). This network samples a significant north–south climate gradient, with degree-day (DD) accumulations for the growing season of 2,500 DD for Barrelli, 3,700 DD for Borden Ranch, and 4,200 DD for Ripperdan. In addition, three different varieties and trellis designs are used at these sites, providing a wide range in canopy structure and vine physiology for evaluating the land surface scheme of TSEB and the data fusion ET toolkit. For 2017, IOPs were conducted from mid-July to early August (veraison period) when there was high evaporative demand.
Fig. 20.
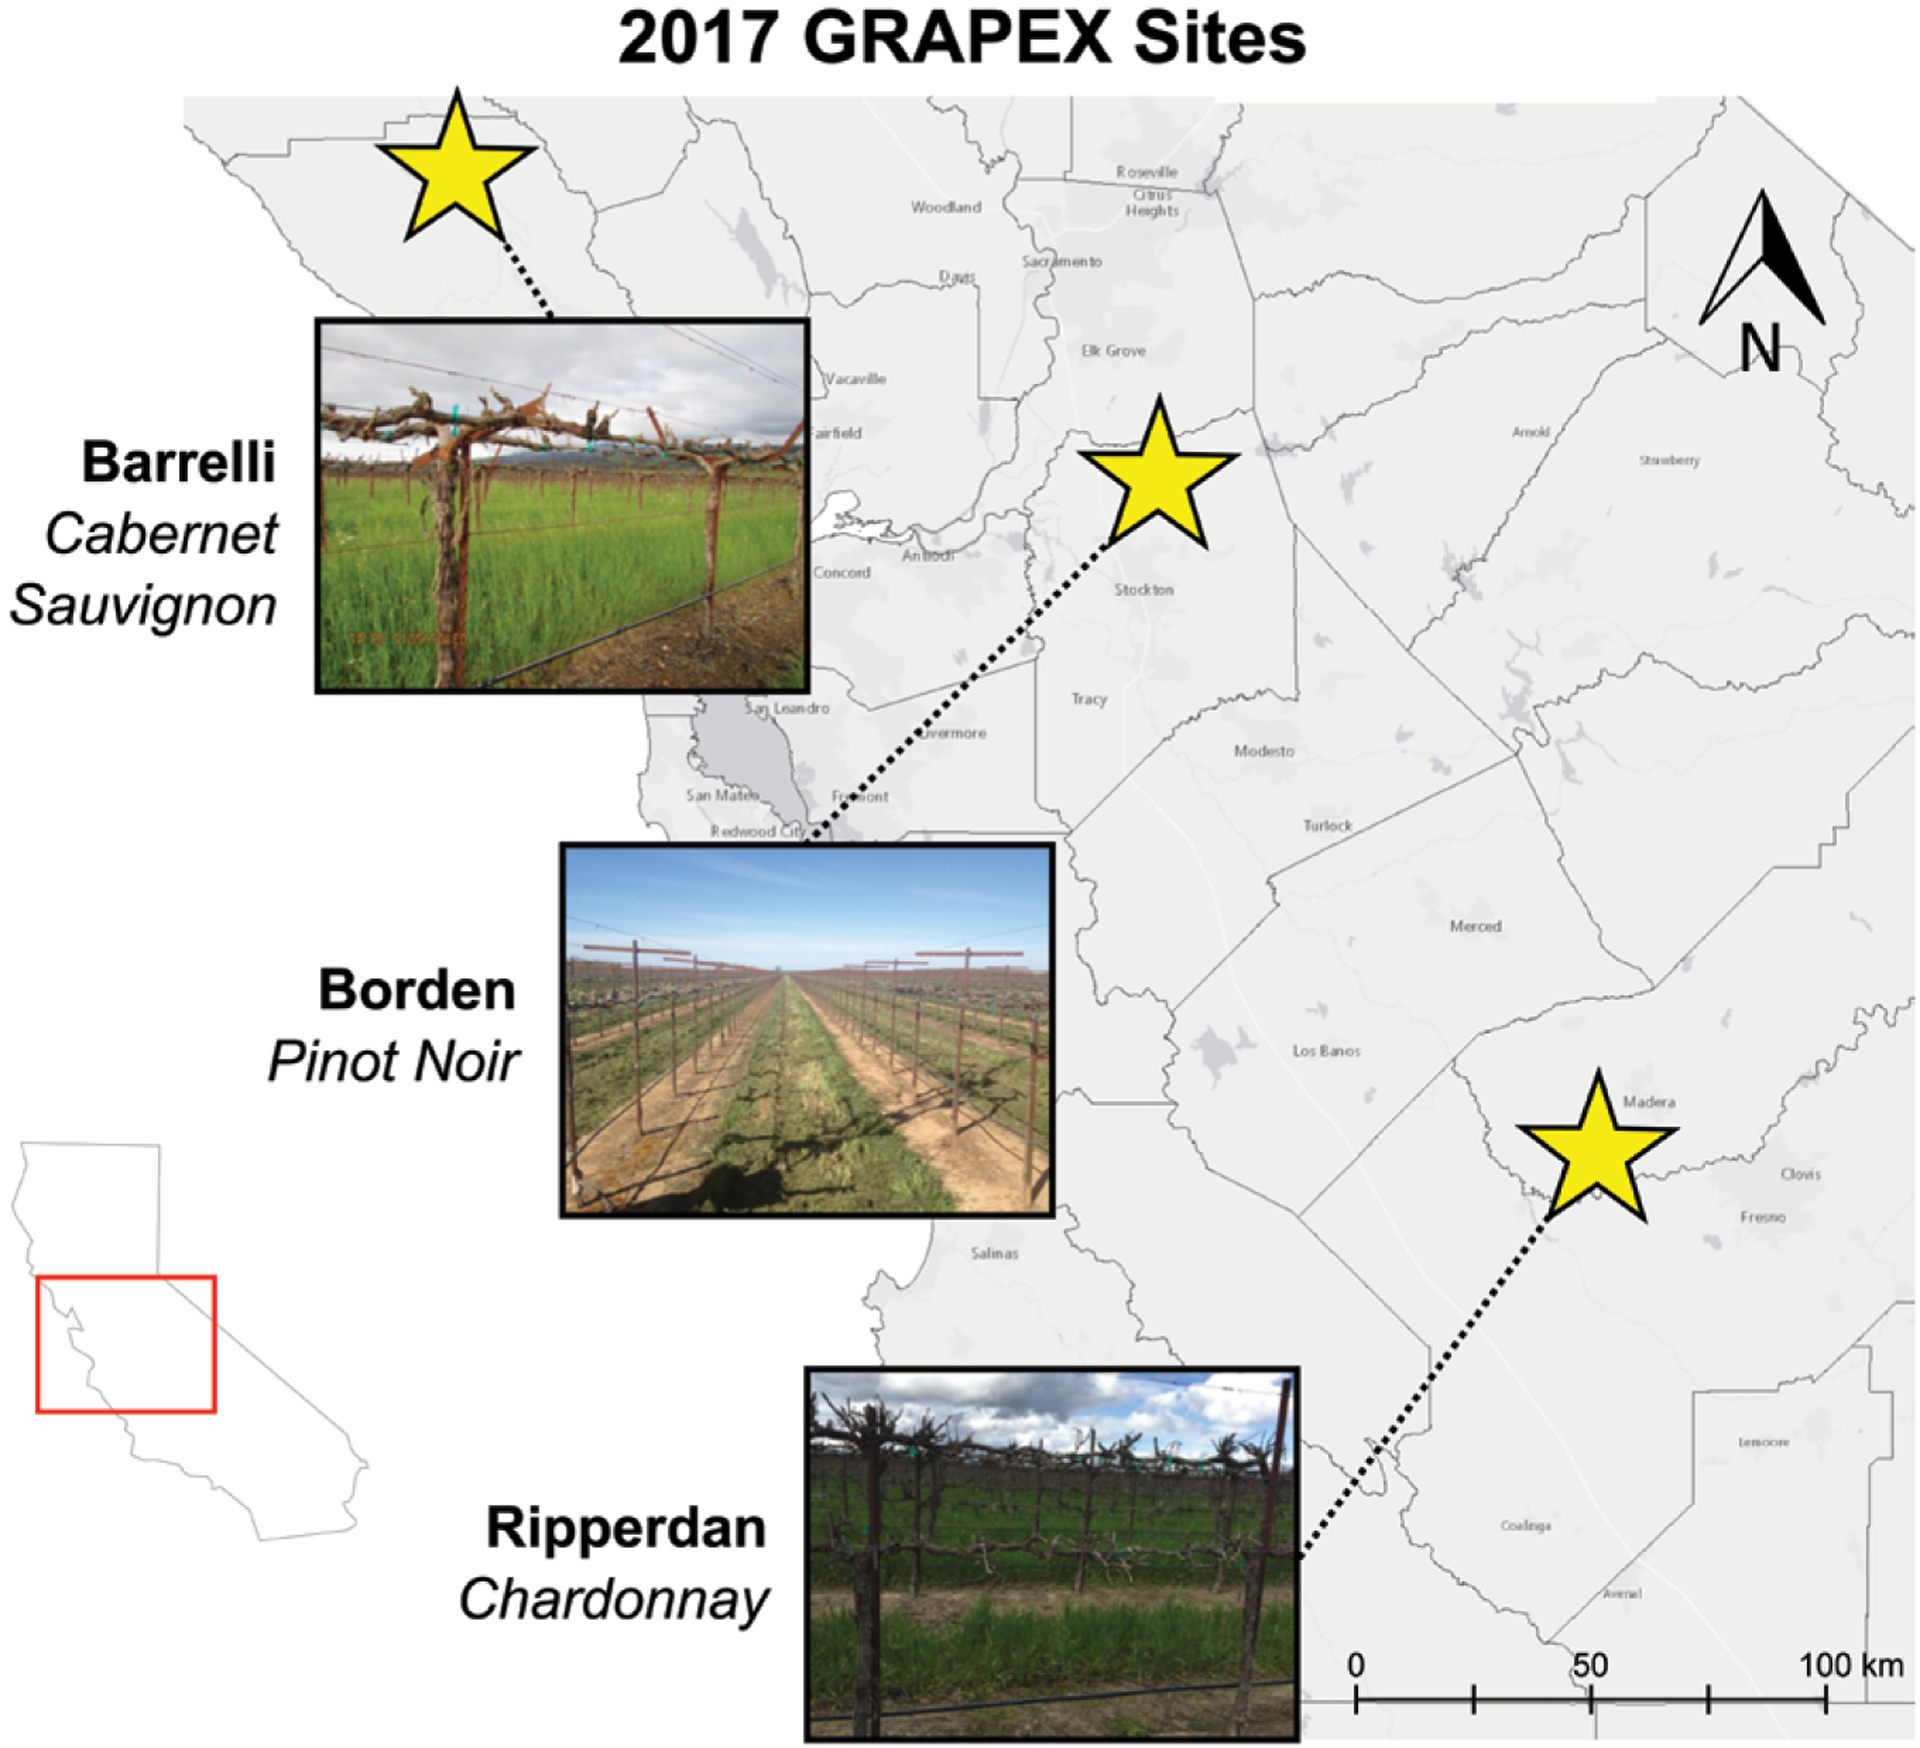
The expansion of 2017 GRAPEX experimental vineyard sites from the Borden site to the Barrelli vineyard to the north and the Ripperdan vineyard to the south, spanning a large range in degree-day accumulations (see text), vine varieties, and trellis designs.
Operational applications of technologies.
As the integrated ET toolkit matures, the GRAPEX team will be working with the E. & J. Gallo Viticulture, Chemistry and Enology and GIS teams, along with growers, to evaluate its utility and application, including modes of effective information transfer and how specific irrigation and water management decisions are to be triggered by this information. In addition, this ET toolkit will be readily available to other commodity groups, particularly high-value perennial crops such as orchards, a major water user in California.
E. & J. Gallo has estimated that if a more robust ET monitoring system resulted in a 10% reduction in water use for the vineyards in California, there would be considerable economic savings of up to $200 million based on the value of irrigated water, which in 2014 and 2015 reached $1,000 or more per acre foot in some parts of California. Pumping costs in 2017 are projected to be around $150 per acre, so a 10% savings would yield about $14 million across the entire vineyard acreage of the state.
The GRAPEX project will also help define how UAV data can be integrated into the comprehensive monitoring system, providing important information about the condition of the vines and interrow soil/cover crop, which cannot be discriminated at satellite pixel resolutions. Does having periodic UAV imagery complement the satellite data stream? What are critical times in vine phenology stages (berry formation, veraison, postveraison berry ripening) when this higher-resolution information may be most useful for vineyard management?
ACKNOWLEDGMENTS.
Funding provided by E. & J. Gallo Winery made possible the acquisition and processing of the high-resolution manned aircraft and UAV imagery collected during GRAPEX IOPs. In addition, we thank the staff of Viticulture, Chemistry and Enology Division of E. & J. Gallo Winery for the collection and processing of field data during GRAPEX IOPs. This project would not have been possible without the cooperation of Mr. Ernie Dosio of Pacific Agri Lands Management, along with the Borden vineyard staff, for logistical support of GRAPEX field and research activities. Finally, the authors would like to acknowledge financial support for this research from the NASA Applied Sciences-Water Resources Program (grant award NNH17AE39I). USDA is an equal opportunity provider and employer.
Footnotes
The mention of trade names of commercial products in this article is solely for the purpose of providing specific information and does not imply recommendation or endorsement by the U.S. Department of Agriculture.
REFERENCES
- Allen RG, Pereira LS, Raes D, and Smith M, 1998: Crop evapotranspiration: Guidelines for computing crop water requirements. FAO Irrigation and Drainage Paper 56, 300 pp. [Google Scholar]
- Anderson MC, Norman JM, Diak GR, Kustas WP, and Mecikalski JR 1997: A two-source time-integrated model for estimating surface fluxes using thermal infrared remote sensing, Remote Sens. Environ, 60, 195–216. [Google Scholar]
- Anderson MC, Norman JM, Mecikalski JR, Torn RD, Kustas WP, and Basara JB, 2004: A multi-scale remote sensing model for disaggregating regional fluxes to micrometeorological scales. J. Hydrometeor, 5, 343–363, . [DOI] [Google Scholar]
- Anderson MC, Norman JM, Mecikalski JR, Otkin J, and Kustas WP, 2007: A climatological study of evapotranspiration and moisture stress across the continental U.S. based on thermal remote sensing: I. Model formulation. J. Geophys. Res, 112, D10117, 10.1029/2006JD007506. [DOI] [Google Scholar]
- Anderson MC, Norman JM, Kustas WP, Houborg RM, Starks PJ, and Agam NA, 2008: Thermal-based remote sensing technique for routine mapping of land-surface carbon, water and energy fluxes from field to regional scales. Remote Sens. Environ, 112, 4227–4241, 10.1016/j.rse.2008.07.009. [DOI] [Google Scholar]
- Anderson MC, and Coauthors, 2011: Mapping daily evapotranspiration at field to continental scales using geostationary and polar orbiting satellite imagery. Hydrol. Earth Syst. Sci, 15, 223–239, 10.5194/hess-15-223-2011. [DOI] [Google Scholar]
- Anderson MC, Allen RG, Morse A, and Kustas WP, 2012: Use of Landsat thermal imagery in monitoring evapotranspiration and managing water resources. Remote Sens. Environ, 122, 50–65, 10.1016/j.rse.2011.08.025. [DOI] [Google Scholar]
- Arevalo V, González J, and Ambrosio G, 2008: Shadow detection in colour high-resolution satellite images. Int. J. Remote Sens, 29, 1945–1963, 10.1080/01431160701395302. [DOI] [Google Scholar]
- Bellvert J, Marsal J, Girona J, and Zarco-Tejada PJ, 2015: Seasonal evolution of crop water stress index in grapevine varieties determined with high-resolution remote sensing thermal imagery. Irrig. Sci, 33, 81–93, 10.1007/s00271-014-0456-y. [DOI] [Google Scholar]
- Bellvert J, Zarco-Tejada P, Marsal J, Girona J, Gonzalez-Dugo V, and Fereres E, 2016: Vineyard irrigation scheduling based on airborne thermal imagery and water potential thresholds. Aust. J. Grape Wine Res, 22, 307–315, 10.1111/ajgw.12173. [DOI] [Google Scholar]
- Cammalleri C, Anderson MC, Ciraolo G, D’Urso G, Kustas WP, La Loggia G, and Minacapilli M, 2010: The impact of in-canopy wind profile formulations on heat flux estimation in an open orchard canopy using the remote sensing-based two-source model. Hydrol. Earth Syst. Sci, 14, 2643–2659, 10.5194/hess-14-2643-2010. [DOI] [Google Scholar]
- Cammalleri C, Anderson MC, Gao F, Hain CR, and Kustas WP, 2013: A data fusion approach for mapping daily evapotranspiration at field scale. Water Resour. Res, 49, 4672–4686, 10.1002/wrcr.20349. [DOI] [Google Scholar]
- Cammalleri C, Anderson MC, Gao F, Hain CR, and Kustas WP, 2014: Mapping daily evapotranspiration at field scales over rainfed and irrigated agricultural areas using remote sensing data fusion. Agric. For. Meteor, 186, 1–11, 10.1016/j.agrformet.2013.11.001. [DOI] [Google Scholar]
- Campbell GS, and Norman JM, 1998: An Introduction to Environmental Biophysics. 2nd ed. Springer-Verlag, 286 pp. [Google Scholar]
- Colaizzi PD, O’Shaughnessy SA, Gowda PH, Kustas WP, Anderson MC, Evett SR, and Howell TA, 2010: Radiometer footprint model to estimate sunlit and shaded components for row crops. Agron. J, 102, 942–955, 10.2134/agronj2009.0393. [DOI] [Google Scholar]
- Colaizzi PD, Evett SR, Howell TA, Li F, Kustas WP, and Anderson MC, 2012a: Radiation model for row crops: I. Geometric view factors and parameter optimization. Agron. J, 104, 225–240, 10.2134/agronj2011.0082. [DOI] [Google Scholar]
- Colaizzi PD, and Coauthors, 2012b: Two-source energy balance model estimates of evapotranspiration using component and composite surface temperatures. Adv. Water Resour, 50, 134–151, 10.1016/j.advwatres.2012.06.004. [DOI] [Google Scholar]
- Colaizzi PD, and Coauthors, 2014: Two-source energy balance model to calculate E, T, and ET: Comparison of Priestley-Taylor and Penman-Monteith formulations and two time scaling methods. Trans. ASABE, 57, 479–498, 10.13031/trans.57.10423. [DOI] [Google Scholar]
- Colaizzi PD, and Coauthors, 2016: Advances in a two-source energy balance model: Partitioning of evaporation and transpiration for cotton using component and composite surface temperatures. Trans. ASABE, 59, 181–197, 10.13031/trans.59.11215. [DOI] [Google Scholar]
- French AN, and Coauthors, 2012: Estimation of surface energy fluxes using surface renewal and flux variance techniques over an advective irrigated agricultural site. Adv. Water Resour, 50, 91–105, 10.1016/j.advwatres.2012.07.007. [DOI] [Google Scholar]
- Gao F, Masek J, Schwaller M, and Hall FG, 2006: On the blending of the Landsat and MODIS surface reflectance: Predicting daily Landsat surface reflectance. IEEE Trans. Geosci. Remote. Sens, 44, 2207–2218, 10.1109/TGRS.2006.872081. [DOI] [Google Scholar]
- Gao F, Anderson MC, Kustas WP, and Wang Y, 2012: A simple method for retrieving leaf area index from Landsat using MODIS LAI products as reference. J. Appl. Remote Sens, 6, 063606, 10.1117/1.JRS.6.063606. [DOI] [Google Scholar]
- Gastellu-Etchegorry JP, Demarez V, Pinel V, and Zagolski F, 1996: Modeling radiative transfer in heterogeneous 3D vegetation canopies. Remote Sens. Environ, 58, 131–156, 10.1016/0034-4257(95)00253-7. [DOI] [Google Scholar]
- Goudriaan J, 1977: Crop micrometeorology: A simulation study. Center for Agricultural Publications and Documentation Tech. Rep., 247 pp. [Google Scholar]
- Hoffmann H, Nieto H, Jensen R, Guzinski R, Zarco-Tejada P, and Friborg T, 2016: Estimating evaporation with thermal UAV data and two-source energy balance models. Hydrol. Earth Syst. Sci, 20, 697–713, 10.5194/hess-20-697-2016. [DOI] [Google Scholar]
- Holland S, and Coauthors, 2013: Micro-Bowen ratio system for measuring evapotranspiration in a vineyard interrow. Agric. For. Meteor, 177, 93–100, 10.1016/j.agrformet.2013.04.009. [DOI] [Google Scholar]
- Kalma JD, McVicar TR, and McCabe MF, 2008: Estimating land surface evaporation: A review of methods using remotely sensing surface temperature data. Surv. Geophys, 29, 421–469, 10.1007/s10712-008-9037-z. [DOI] [Google Scholar]
- Kool D, Kustas WP, Ben-Gal A, Lazarovitch N, Heitman JL, Sauer TJ, and Agam N, 2016: Energy and evapotranspiration partitioning in a desert vineyard. Agric. For. Meteor, 218–219, 277–287, 10.1016/j.agrformet.2016.01.002. [DOI] [Google Scholar]
- Kustas WP, and Norman JM, 1997: A two-source approach for estimating turbulent fluxes using multiple angle thermal infrared observations. Water Resour. Res, 33, 1495–1508, 10.1029/97WR00704. [DOI] [Google Scholar]
- Kustas WP, and Norman JM, 1999: Evaluation of soil and vegetation heat flux predictions using a simple two-source model with radiometric temperatures for partial canopy cover. Agric. For. Meteor, 94, 13–29, 10.1016/S0168-1923(99)00005-2. [DOI] [Google Scholar]
- Kustas WP, and Anderson MC, 2009: Advances in thermal infrared remote sensing for land surface modeling. Agric. For. Meteor, 149, 2071–2081, 10.1016/j.agrformet.2009.05.016. [DOI] [Google Scholar]
- Li F, Jupp D, Thankappan M, Lymburner L, Mueller N, and Lewis A, 2012: A physics-based atmospheric and BRDF correction for Landsat data over mountainous terrain. Remote Sens. Environ, 124, 756–770, 10.1016/j.rse.2012.06.018. [DOI] [Google Scholar]
- Massman WJ, 1987: A comparative study of some mathematical models of the mean wind structure and aerodynamic drag of plant canopies. Bound.- Layer Meteor, 40, 179–197, 10.1007/BF00140075. [DOI] [Google Scholar]
- Massman WJ, 1997: An analytical one-dimensional model of momentum transfer by vegetation of arbitrary structure. Bound.-Layer Meteor, 83, 407–421, 10.1023/A:1000234813011. [DOI] [Google Scholar]
- Massman WJ, Forthofer JM, and Finney MA, 2017: An improved canopy wind model for predicting wind adjustment factors and wildland fire behavior. Can. J. For. Res, 47, 594–603, 10.1139/cjfr-2016-0354. [DOI] [Google Scholar]
- McElrone AJ, Shapland TM, Calderon A, Fitzmaurice L, Paw U KT, and Snyder RL, 2013: Surface renewal: An advanced micrometeorological method for measuring and processing field-scale energy flux density data. J. Vis. Exp, 82, e50666, 10.3791/50666. [DOI] [PMC free article] [PubMed] [Google Scholar]
- Myneni RBS, and Coauthors, 2002: Global products of vegetation leaf area and fraction absorbed PAR from year one of MODIS data. Remote Sens. Environ, 83, 214–231, 10.1016/S0034-4257(02)00074-3. [DOI] [Google Scholar]
- Norman JM, Kustas WP, and Humes KS, 1995: A two-source approach for estimating soil and vegetation energy fluxes from observations of directional radiometric surface temperature. Agric. For. Meteor, 77, 263–293, 10.1016/0168-1923(95)02265-Y. [DOI] [Google Scholar]
- Paw U KT, Qiu J, Su HB, Watanabe T, and Brunet Y, 1995: Surface renewal analysis: A new method to obtain scalar fluxes without velocity data. Agric. Meteor, 74, 119–137, 10.1016/0168-1923(94)02182-J. [DOI] [Google Scholar]
- Richter R, and Muller A, 2005: De-shadowing of satellite/airborne imagery. Int. J. Remote Sens, 26, 3137–3148, 10.1080/01431160500114664. [DOI] [Google Scholar]
- Scanlon TM, and Kustas WP, 2010: Partitioning carbon dioxide and water vapor fluxes using correlation analysis. Agric. For. Meteor, 150, 89–99, 10.1016/j.agrformet.2009.09.005. [DOI] [Google Scholar]
- Scanlon TM, and Kustas WP, 2012: Partitioning evapotranspiration using an eddy covariance-based technique: Improved assessment of soil moisture and land–atmosphere exchange dynamics. Vadose Zone J, 11, 10.2136/vzj2012.0025. [DOI] [Google Scholar]
- Semmens KA, and Coauthors, 2016: Monitoring daily evapotranspiration over two California vineyards using Landsat 8 in a multi-sensor data fusion approach. Remote Sens. Environ, 185, 155–170, 10.1016/j.rse.2015.10.025. [DOI] [Google Scholar]
- Shapland TM, Snyder RL, Paw U KT, and McElrone AJ, 2014: Thermocouple frequency response compensation leads to convergence of the surface renewal alpha calibration. Agric. For. Meteor, 189–190, 36–47, 10.1016/j.agrformet.2014.01.008. [DOI] [Google Scholar]
- Sun L, and Coauthors, 2017a: Daily mapping of 30 m LAI, NDVI for grape yield prediction in California vineyard. Remote Sens, 9, 317, 10.3390/rs9040317. [DOI] [Google Scholar]
- Sun L, and Coauthors, 2017b: Investigating water use over the Choptank River Watershed using a multi-satellite data fusion approach. Water Resour. Res, 53, 5298–5319, 10.1002/2017WR020700. [DOI] [Google Scholar]
- Szantoi Z, and Simonetti D, 2013: Fast and robust topographic correction method for medium resolution satellite imagery using a stratified approach. IEEE J. Sel. Top. Appl. Earth Obs. Remote Sens, 6, 13678797, 10.1109/JSTARS.2012.2229260. [DOI] [Google Scholar]
- Ting X, and Coauthors, 2016: Mapping evapotranspiration with high resolution aircraft imagery over vineyards using one and two source modeling schemes. Hydrol. Earth Syst. Sci, 20, 1523–1545, 10.5194/hess-20-1523-2016. [DOI] [Google Scholar]
- Verhoef W, Jia L, Xiao Q, and Su Z, 2007: Unified optical-thermal four-stream radiative transfer theory. IEEE Trans. Geosci. Remote Sens, 45, 1808–1822, 10.1109/TGRS.2007.895844. [DOI] [Google Scholar]
- Wang K, and Dickinson RE, 2012: A review of global terrestrial evapotranspiration: Observation, modeling, climatology, and climatic variability. Rev. Geophys, 50, RgG2005, 10.1029/2011RG000373. [DOI] [Google Scholar]
- Yang Y, and Coauthors, 2017a: Daily Landsat-scale evapotranspiration estimation over a managed pine plantation in North Carolina, USA, using multi-satellite data fusion. Hydrol. Earth Syst. Sci, 21, 1017–1037, 10.5194/hess-21-1017-2017. [DOI] [Google Scholar]
- Yang Y, and Coauthors, 2017b: Impact of tile drainage on evapotranspiration in South Dakota, USA, based on high spatiotemporal resolution ET timeseries from a multi-satellite data fusion system. IEEE J. Sel. Top. Appl. Earth Obs. Remote Sens, 10, 17030974, 10.1109/JSTARS.2017.2680411. [DOI] [Google Scholar]


