

Abstract
Gadolinium-based chelates are a mainstay of contrast agents for magnetic resonance imaging (MRI) in the clinic. However, their toxicity elicits severe side effects and the Food and Drug Administration has issued many warnings about their potential retention in patients’ bodies, which causes safety concerns. Iron oxide nanoparticles (IONPs) are a potentially attractive alternative, because of their non-toxic and biodegradable nature. Studies in developing IONPs as T1 contrast agents have generated promising results, but the complex, interrelated parameters influencing contrast enhancement make the development difficult, and IONPs suitable for T1 contrast enhancement have yet to make their way to clinical use. Here we discuss the fundamental principles of MRI contrast agents and review the current status of MRI contrast agents with a focus on the advantages and limitations of current T1 contrast agent and the potential of IONPs serving as safe and improved alternative to gadolinium-based chelates. We present the past advances and current challenges in developing IONPs as T1 contrast agent from a materials science perspective and assess how each of the key material properties and environment variables affects the performance of IONPs. Finally, we discuss some potential approaches to develop high-performance and clinically relevant T1 contrast agents.
The fundamentals of iron oxide nanoparticles (IONPs) as T1 contrast agents, the past advances and current challenges in developing IONPs are reviewed. The key material properties and environmental variables influencing T1 and T2 contrast, and their relationships are discussed. Strategies for improving T1 contrast enhancement and directions for future research are provided.
Keywords: iron oxide nanoparticles, MRI contrast agent, T1 contrast agent, nanoparticles, gadolinium
Graphical abstract
1. Introduction
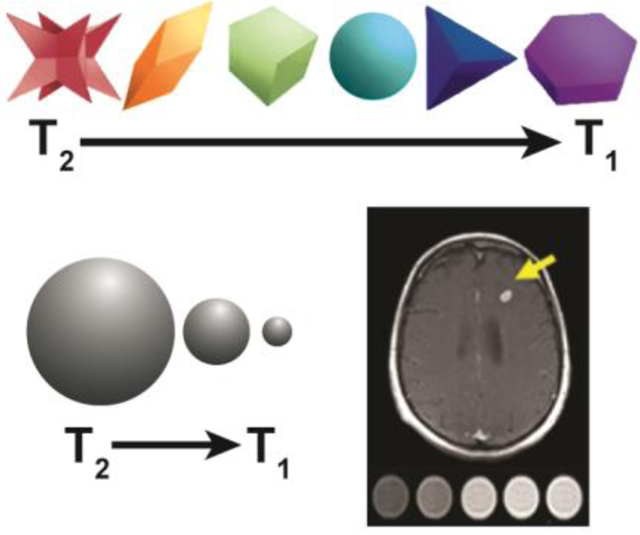
Magnetic resonance imaging (MRI) is one of most commonly used diagnostic modalities in the clinic due to its non-invasiveness, no emission of damaging ionizing radiation, and excellent penetration depth while providing better spatial resolution than other clinical imaging modalities.[1–7] Although the diagnosis of major diseases by MR imaging has achieved significant progress, the ability to differentiate diseased tissue from healthy tissue remains to be improved, especially at the early stages of the disease development.[8] The resolution of MRI for disease diagnosis can be significantly improved by use of contrast agents which enhance the contrast by shortening either the longitudinal (T1) or transverse (T2) relaxation times of water protons.[9,10] T1 contrast agents increase the T1 signal in T1-weighted imaging which results in a positive/brighter contrast enhancement while T2 contrast agents reduce the T2 signal in T2-weighted imaging which results in a negative/dark contrast enhancement (Figure 1).[9] T2 contrast agents have intrinsically high susceptibility that induces a long-range magnetic field that perturbs neighboring tissues and distorts the background image, a phenomenon known as the Blooming effect.[9] The location of T2 contrast agents can be easily misidentified due to the Blooming effect as well as presence of other hypointense areas caused by bleeding, calcification, and metal deposits.[11] Alternatively, T1 contrast agents are composed of paramagnetic ions and do not affect the magnetic homogeneity or the anatomical background, allowing for clear detection of the contrast agent.[9] Because of the limitations of T2 contrast agents, T1 contrast agents, particularly gadolinium (Gd) complexes, are used far more frequently in the clinic than T2 contrast agents.
Figure 1.

Two classes of MRI contrast agents. Pre- (a) and post- (b) GBCA T1-weighted MRI on a brain metastasis in a melanoma patient. (c) T1 contrast agents decrease the spin-lattice relaxation time, increasing signal with increasing agent concentration, and produce brighter contrast images. Pre- (d) and post- (e) IONP-based contrast agent T2-weighted MRI on inflamed mouse mammary gland tumors. (f) T2 contrast agents decrease the spin-spin relaxation time, decreasing signal with increased agent concentration, and produce darker contrast images. (Reproduced with permission from[108–110], Copyright © 2017 Serkova, Copyright © 2016 Ivyspring International Publisher, Copyright © 2018 Elsevier Ltd.)
Currently, Gd3+-based contrast agents (GBCAs) are the only T1 contrast agents used in the clinic. Despite their efficacy in enhancing MRI contrast, severe side effects of GBCAs have been identified. GBCAs have been shown to cause fatal nephrogenic systemic fibrosis, leading to fibrotic skin contractures and in extreme cases, resulting in fractured bones or even death.[12–16] Additionally, these heavy metal complexes have been reported to cause brain lesions, which are exacerbated in patients with liver or kidney problems because of their reduced ability to clear GBCAs from the body.[17,18] The Food and Drug Administration (FDA) has issued a number of warnings about the possible long-term deposition of Gd in the brain, and the potential harms of this retention are under investigation.[19–21] The issues associated with the toxicity are further compounded by the short blood half-life of GBCAs,[22–25] which may require patients to receive multiple contrast administrations to acquire necessary images. Clearly, there is an urgent need for a more biocompatible T1 contrast agent.
Iron oxide nanoparticles (IONPs) have garnered significant interest in the biomedical field for their intrinsic magnetic and biodegradable properties.[26–29] In particular, IONPs have been extensively studied as a T2 contrast agent for MRI as they efficiently shorten transverse relaxation times.[9] Significantly, IONPs have demonstrated long blood half-lives, low toxicity, and flexible surface chemistry.[29,30] IONPs have also been shown to be effectively cleared from the body, and have a natural mechanism for degradation, being metabolized into the body’s hemoglobin.[31–34] Several formulations of IONPs have already been approved by the FDA as T2 contrast agents.[9,11,26,28]
Because of the favorable physicochemical properties and in vivo behavior of iron oxide materials, development of IONPs with suitable relaxivities for T1 imaging may provide a safe alternative to GBCAs. A number of IONP systems have been investigated as potential T1 contrast agents,[35–38] but synthesis methods employed vary widely and mechanisms governing the performance of IONPs are largely unknown. In this review, we first discuss the current status of pre-clinical research of IONPs as T1 contrast agents. We then discuss the fundamentals of T1 and T2 contrast agents in MRI such as the mechanisms by which they provide contrast enhancements, their interactions with the surrounding water molecules, molecular mechanisms of magnetic relaxivities, the relation between these relaxivities and contrast enhancements, how to enable and improve T1 contrast capability of an IONP system, and set the criteria defining a good T1 contrast agent. We then examine the primary physicochemical properties of IONPs that regulate the T1 contrast enhancement, including the core size, shape, composition, chemical doping, and surface coating chemistry of IONPs. In addition to the material properties of the contrast agents, external variables, such as the applied magnetic field, also have a significant impact on the contrast enhancement by regulating the Larmor frequency. We dedicate a section to elaborate this concept. Particle clustering can also radically influence the contrast enhancement of a nanoparticle-based contrast agent. We discuss how the agglomeration of particles would regulate the relaxivities of the agent and how this phenomenon can be utilized to create a T1-T2 switchable contrast agent. Finally, we summarize the general routes to create IONP-based T1 contrast agents, the challenges faced in developing these contrast agents, potential approaches to overcoming these challenges, and the considerations that may facilitate the translation of the research development in this field to clinical use.
2. Pre-clinical research of IONPs as T1 contrast agents
IONPs have seen extensive pre-clinical application as T2 contrast agents for MRI and as theranostic agents in drug delivery, cell-based therapy, and gene therapy. Clinically, Ferumoxytol, a carbohydrate coated IONP, has received FDA approval for the treatment of iron deficiency in adults, and demonstrated a wide range of uses in MR imaging, though it has not been approved for this purpose.[39] Ferumoxytol’s long intravascular half-life allowing for repeated imaging provides utility as a blood pool contrast agent, particularly for monitoring small and slow endoleaks for which other contrast agents are insufficient.[40] It has also proved effective in imaging of lymph nodes[41], assessing aneurysm stability[42], myocardial infarction pathology[43], and pancreatic inflammation in patients with type 1 diabetes[44], and differentiating progression and pseudoprogression in glioblastomas.[45] All these investigations also demonstrated that IONPs have excellent biocompatibility with low toxicity.
There are several reasons that the potential of IONPs has yet to translate into widespread clinical use. There is a general lack of clinical knowledge in interpretation of IONP-enhanced MR images, especially compared to the more widely used GBCA-enhanced MRI. The financial incentive for pharmaceutical companies is also low; the small population of patients with renal deficiency for whom IONP-enhanced MRI is currently most useful would provide an insufficient return on the cost of IONP development. These obstacles are a matter of motivation, which is lacking, when IONPs are only suitable for T2-enhancement, the applications of which are limited. Fortunately, recent research in utilizing IONPs as T1 contrast agents has shown great promise.
In one such study, clusters of IONPs were used to delineate normal liver from hepatocellular carinomas (HCC).[46] IONPs have previously been used clinically as liver-specific T2 contrast agents, but the sensitivity was too low to detect HCC. The IONP clusters degrade in the acidic microenvironment of HCC that effectively switched the contrast agent from T2 to T1. Therefore, in the tumors, the nanoclusters remained as T2 contrast agents, while in HCC, the nanoclusters degraded into T1 contrast agents. This was successfully validated on an orthotopic HCC mouse model, demonstrating darkening of normal liver under T2 and brightening of HCC under T1. In a similar study, IONPs were crosslinked to form nanoparticle assemblies that deassembled in acidic environments.[47] These assemblies were injected intravenously in mice, and had great stability in blood circulation compared to a more typical polymer-based assembly. They successfully accumulated in the tumor, where they enhanced T1 contrast while maintaining good biocompatibility.
In another study, uniform and extremely-small IONPs were synthesized and coated with PEG that displayed minimal toxicity with longer circulation time than clinically used GBCAs.[48] The 3 nm IONPs showed T1 contrast enhancement in blood vessels in rats via dynamic time-resolved MR angiography. This study shows the feasibility of utilizing IONPs as a T1 contrast agent for clinical blood pool imaging due to their long circulation time which permits steady-state imaging.
To demonstrate IONP’s biocompatibility, a study evaluated iron oxide nanoclusters of uniform size that exhibit T1 contrast for their toxicity in large animal models including beagle dogs and macaques.[49] The iron oxide nanoclusters were successfully utilized as T1 contrast agents for high-resolution magnetic resonance angiography with minimal toxicity. Additionally, cerebral ischemia was detected using these iron oxide nanoclusters via dynamic MRI, demonstrating the great clinical potential of IONPs as T1 contrast agents.
In one study, IONPs of varying size from 1.9 to 4.9 nm were synthesized to find the optimal size for use as a T1-weighted MRI contrast agent.[50] The diameter at 3.6 nm was found to be the optimal size, and this IONP was used as a multifunctional vehicle to not only specifically target glioblastoma, but also deliver doxorubicin while allowing T1 imaging in mice. In another study, IONPs were coated with a natural protein macromolecule and an artificial macromolecule, respectively.[51] Both IONPs showed T1 contrast enhancement in liver and kidneys of mice, with the one coated with artificial macromolecule showing higher contrast than the one coated with the natural protein macromolecule. The above two studies demonstrate the importance of core size and surface coating augmentation to improve T1 contrast enhancement.
These studies demonstrate that utilizing IONPs as T1 contrast agents opens up new clinically applications previously not possible. Blood pool imaging, which finds applications in detecting renal failure, thrombosis, angiogenesis of tumor cells, and myocardial infarction, is especially appealing with T1 contrast enhancement by IONPs.[52] Utilizing IONPs as T1 contrast agents provides new ways to label tumor and monitor treatment response. However, in order for this research to advance to the clinic, a more thorough understanding of how IONPs can be engineered to be T1 contrast agents is required.
3. Fundamentals of T1 and T2 contrast agents in MRI
MRI measures the time for the magnetic moments of primarily hydrogen protons to return to their equilibrium state, a slight net alignment parallel to a strong external magnetic field (z-direction), after being rotated 90 degrees into the transverse (x-y) plane by an orthogonal radiofrequency (RF) pulse (Figure 2a). This recovery process is characterized by two relaxation times: the spin-lattice, or longitudinal relaxation (designated as T1) and the spin-spin or transverse relaxation (designated as T2).[29,53,54] T1 relaxation occurs when spins lose energy by interacting with their environment (hence, spin-lattice), thus increasingly favoring an energetically preferable alignment with the external magnetic field (Figure 2b). A contrast agent facilitates this energy loss through dipole-dipole interactions between water molecules and metal ions in the contrast agent’s core. Energy exchange happens most efficiently at the Larmor frequency (42.58 MHz/T for hydrogen protons), therefore T1 contrast agents are most effective when their rotational motion matches this frequency. The rapid tumbling time of water molecules is slowed to nearer the Larmor frequency by interaction with the contrast agent, allowing hydrogen protons to lose energy and recover their initial magnetic moment faster.
Figure 2.

Schematic representation of the basic principles of MRI. (a) When an external magnetic field B0 (orange arrow) is applied (z-direction), protons (red spheres) tend to align with B0 (note that the depiction here unrealistically shows all protons aligned with B0, but there is actually only a slight preference for this alignment). This alignment results in a net magnetization vector (M0, blue arrow). When an orthogonal RF pulse is applied, M0 tilts 90° into the transverse (x-y) plane (Mxy, green arrow). The magnetization returns to equilibrium through two processes: T1 and T2 relaxation (b) T1 relaxation: T1 is a measure of the time it takes the initial longitudinal magnetic moment (M0) to recover. (c) T2 relaxation: T2 measures the loss of the transverse magnetic moment (Mxy) due to dephasing. (Reproduced with permission from[111], Copyright © 2019 Mastrogiacomo).
T2 relaxation reflects a loss of the net magnetization in the transverse plane, where the initial net alignment with the external magnetic field becomes a net phase coherence of their precession in the transverse plane, and thus a small magnetic moment (Figure 2c). All processes causing T1 relaxation will also cause the precession of these spins to decohere, but they are not the only mechanisms affecting T2 relaxation. Contrast agents may impact T2 by creating local magnetic field inhomogeneities.[54,55] The induced fields create regions where the Larmor frequency, which depends on field strength, differs from that of the applied longitudinal field. As this characteristic precession of hydrogen protons is altered, the spins fall out of phase, reducing any net transverse magnetization.
The relaxation rates, denoted as r1 and r2 relaxivities, are the inverse of the T1 and T2 relaxation times, respectively. It is important to note that the ratio of r2/r1 is a key parameter in distinguishing T2 and T1 contrast agents. T2 contrast agents possess high r2 relaxivity, hence have large r2/r1 ratio. In comparison, T1 contrast agents should have high r1 relaxivity, with the r2/r1 ratio being smaller, ideally close to 1.[9] Therefore, creating a T1 contrast agent involves minimizing the r2/r1 ratio, which can be achieved by decreasing r2 and increasing r1.
IONPs make effective T2 contrast agents due to their high saturation magnetization, which is largely responsible for r2 relaxivity.[9] When under an external field, IONPs develop an induced magnetic field, and perturb the spin precession in the neighboring areas, causing phase decoherence and negative (dark) contrast in MR images. The magnetization of a T2 contrast agent can be altered via size, shape, and composition. Many studies reviewed in this article will pertain to IONPs being used as T2 contrast agents in order to elucidate trends and factors affecting r2, which should be minimized in order to create an effective T1 contrast agent.
The superior T1 contrast enhancement of GBCAs can be explained in terms of the interactions of their inner-sphere (IS) and outer-sphere (OS) with water molecules.[9,23] The outer-sphere component arises from the translational diffusion of water molecules near the Gd3+ ions. The overall relaxivity r1 is the sum of the inner-sphere and outer-sphere relaxivities. Gd3+ has 7 unpaired valence electrons, each of which can interact with water molecules; this along with having minimal magnetization gives GBCAs superior T1 contrast enhancement.[23] Increasing water interaction slows the tumbling rate of the water to nearer the Larmor frequency, which allows it to recover its magnetic moment more quickly.
The spatial distribution of the inner sphere, polymer coating, and outer sphere of an iron-oxide nanoparticle-based T1 contrast agent, and their interaction with water molecules are illustrated in Figure 3. The inner-sphere component is influenced by the number of fast-exchanging water molecules within the inner sphere, the characteristic rotational correction time of the agent (τR), and the mean residence lifetime (τm) of the mobile water proton within the inner-sphere. Compared to GBCAs, an IONP contrast agent has an additional second-sphere contribution due to interactions between water molecules and IONP surface coating. IONPs have the potential to be effective T1 contrast agents due to the presence of a large number of unpaired electrons. Fe3+ has 5 unpaired valence electrons that interact with water molecules and the high surface area to volume ratio of IONPs can be utilized to increase water interaction by altering the polymer coating. Further, the magnetization of IONPs can be reduced by altering the core size and shape. In the following section, we look at how iron oxide core parameters such as size, shape and composition, surface coating, and hydrophobicity, and external magnetic field strength, influence magnetic properties of the T1 contrast agent. A summary of key results from studies considering the effects of these parameters on relaxivity is provided in Table 1.
Figure 3.

A depiction of time parameters and regions contributing to relaxivity. The time parameters are rotational correlation time (τR) and water residence time (τm for direct core interaction). The inner sphere consists of water molecules (red) interacting directly with metal ions of the IONP core (black sphere). The second sphere consists of water molecules (yellow) transiently bound to the polymer (gray wavy line). The outer sphere refers to water molecules (green) indirectly affected by magnetic field fluctuations at the surface of the IONP system. The motion of water molecules through these three spheres determines relaxivity.
Table 1.
Summary of various physiochemical properties of IONP-based contrast agents. Note that core compositions are provided here as reported in the corresponding study (e.g., Fe3O4 vs IONP).
| Core composition | Core size (d, nm) | Coating | Anchoring group | MW of coating (g/mol) | Hydro-dynamic size(d, nm) | r1(mM−1 s−1) | r2(mM−1 s−1) | r2/r1 | Field strength(T) | Ref. |
|---|---|---|---|---|---|---|---|---|---|---|
| Fe3O4 sphere | 3.6 | PEG | Hydroxamate | 2000 | 12 | 4.2 | 48.72 | 11.6 | 3 | [93] |
| Fe3O4 sphere | 3.6 | PEG | Diphosphate | 2000 | 12 | 3.21 | 24.6 | 7.7 | 3 | |
| Fe3O4 sphere | 3.6 | PEG | Catechol | 2000 | 12 | 3.47 | 44.76 | 12.9 | 3 | |
| Fe3O4 sphere | 10.9 | PEG | Hydroxamate | 2000 | 18 | 4.2 | 48.72 | 11.6 | 3 | |
| Fe3O4 sphere | 10.9 | PEG | Diphosphate | 2000 | 18 | 3.21 | 24.6 | 7.7 | 3 | |
| Fe3O4 sphere | 10.9 | PEG | Catechol | 2000 | 18 | 3.47 | 44.76 | 12.9 | 3 | |
| IONP sphere | 6.34 | PEG | Siloxane | 1000 | 12.1 | 6 | 25 | 4.17 | 1.5 | [63] |
| IONP sphere | 7.58 | PEG | Siloxane | 1000 | 13.1 | 7.1 | 38.4 | 5.41 | 1.5 | |
| IONP sphere | 8.58 | PEG | Siloxane | 1000 | 15.9 | 7 | 38 | 5.43 | 1.5 | |
| IONP sphere | 9.5 | PEG | Siloxane | 1000 | 17.7 | 5.9 | 37.1 | 6.26 | 1.5 | |
| IONP sphere | 6.34 | PEG | Siloxane | 2000 | 14.2 | 5.5 | 20.3 | 3.69 | 1.5 | |
| IONP sphere | 7.58 | PEG | Siloxane | 2000 | 13.4 | 7.5 | 37.1 | 4.95 | 1.5 | |
| IONP sphere | 8.58 | PEG | Siloxane | 2000 | 16.8 | 5.2 | 36.2 | 6.96 | 1.5 | |
| IONP sphere | 9.5 | PEG | Siloxane | 2000 | 19.2 | 6 | 39.7 | 6.62 | 1.5 | |
| IONP sphere | 6.34 | PEG | Catechol | 5000 | 16.4 | 5 | 23 | 4.6 | 1.5 | |
| IONP sphere | 7.58 | PEG | Catechol | 5000 | 17.9 | 6.6 | 31.7 | 4.80 | 1.5 | |
| IONP sphere | 8.58 | PEG | Catechol | 5000 | 23.6 | 6.5 | 38 | 5.85 | 1.5 | |
| IONP sphere | 9.5 | PEG | Catechol | 5000 | 26 | 6 | 37.9 | 6.32 | 1.5 | |
| IONP sphere | 6.34 | PEG | Catechol | 20000 | 29.9 | 5.5 | 18.8 | 3.42 | 1.5 | |
| IONP sphere | 8.86 | Dextran-PEG | Carboxylic | 600 | 70 | 0.91 | 31.44 | 34.5 | 3 | [90] |
| IONP sphere | 8.69 | Dextran-PEG | Carboxylic | 600 | 82 | 0.67 | 27.76 | 41.4 | 3 | |
| IONP sphere | 10.4 | Dextran-PEG | Carboxylic | 600 | 116 | 0.58 | 18.33 | 31.6 | 3 | |
| IONP sphere | 8.86 | Dextran-PEG | Carboxylic | 300 | 74 | 0.22 | 13.12 | 59.6 | 3 | |
| IONP sphere | 8.69 | Dextran-PEG | Carboxylic | 300 | 93 | 0.19 | 11.33 | 59.6 | 3 | |
| IONP sphere | 10.4 | Dextran-PEG | Carboxylic | 300 | 100 | 0.16 | 13.12 | 82 | 3 | |
| Fe3O4 sphere | 4.5 | PAA | Carboxylic | 2000 | 56 | 23.6 | 62.3 | 2.64 | 1 | [112] |
| Fe3O4 sphere | 7.4 | PAH | Amino | 1750 | 229 | 60.8 | 232.3 | 3.82 | 1 | |
| Fe3O4 sphere | 2.8 | PVA | Hydroxylic | ~25000 | 141 | 30.9 | 224.5 | 7.27 | 1 | |
| IO sphere | 7 | Silica | Siloxane | 208.33 | * | 0.5 | 0.6 | 1.2 | 3 | [35] |
| IO sphere | 11 | Silica | Siloxane | 208.33 | * | 1.2 | 9.8 | 8.17 | 3 | |
| IO sphere | 14 | Silica | Siloxane | 208.33 | * | 3.2 | 40 | 12.5 | 3 | |
| IO cube | 7 | Silica | Siloxane | 208.33 | * | 1.1 | 3.8 | 3.45 | 3 | |
| IO cube | 11 | Silica | Siloxane | 208.33 | 18 | 3.4 | 36.8 | 10.8 | 3 | |
| IO cube | 14 | Silica | Siloxane | 208.33 | * | 4.2 | 68.8 | 16.4 | 3 | |
| Fe3O4 sphere | 3 – 4 | Tannic Acid | Catechol** | 1701 | 27 | 3.81 | 4.59 | 1.2 | 1.4 | [106] |
| Fe3O4 nanowire | 2 by ~22.5 | Tannic Acid | Catechol** | 1701 | 32 | 2.64 | 3.33 | 1.26 | 1.4 | |
| Fe3O4 sphere | 5.4 | PEG | Carboxylic | 600 | 10.1 | 19.7 | 39.4 | 2 | 1.5 | [113] |
| Fe2O3 sphere | 2.2 | PEG | Phosphate | * | * | 4.78 | 17.5 | 3.67 | 3 | [48] |
| Fe2O3 sphere | 3 | PEG | Phosphate | * | * | 4.66 | 29.2 | 6.12 | 3 | |
| Fe2O3 sphere | 12 | PEG | Phosphate | * | * | 2.37 | 58.8 | 24.8 | 3 | |
| Fe2O3 sphere | 3.5 | PEG | Phosphate | 750 | 19.8 | 12.7 | 19.7 | 1.55 | 0.5 | [114] |
| Fe2O3 sphere | 3.5 | PEG | Phosphate | 2000 | 22.2 | 7.9 | 13 | 1.65 | 0.5 | |
| Fe2O3 sphere | 3.5 | PEG | Phosphate | 750 | 19.8 | 11 | 28.1 | 2.55 | 1.5 | |
| Fe2O3 sphere | 3.5 | PEG | Phosphate | 2000 | 22.2 | 6.8 | 17.9 | 2.63 | 1.5 | |
| Fe2O3 sphere | 4.8 | TMA(OH) | Amino | 91 | 18 | 20.8 | 51.1 | 2.46 | 0.47 | [115] |
| Fe2O3 sphere | 4.8 | Citric Acid | Carboxylic | 192 | 18 | 14.6 | 66.9 | 4.61 | 1.4 | |
| IO sphere | 3.7 | PMAA | Carboxylic | 7524 | 7.5 | 5.38 | 65.7 | 12.2 | 4.7 | [116] |
| IO sphere aggregate | 3.7 | PMAA | Carboxylic | 7524 | 11.1*** | 5.57 | 68.1 | 12.2 | 4.7 | |
| IO sphere aggregate | 3.7 | PMAA | Carboxylic | 7524 | 16.1*** | 2.21 | 92.4 | 41.8 | 4.7 | |
| IO sphere aggregate | 3.7 | PMAA | Carboxylic | 7524 | 23.1*** | 1.38 | 110.5 | 80.1 | 4.7 | |
| IO sphere aggregate | 3.7 | PMAA | Carboxylic | 7524 | 45.1*** | 1.24 | 144.3 | 116.4 | 4.7 | |
| IO sphere | 15 | Citric acid | Carboxylic | 210 | * | 11.2 | 109.6 | 9.79 | 0.5 | [75] |
| Mn-IO plate | 24.6 | Citric acid | Carboxylic | 210 | 26.83 | 49 | 318.8 | 6.51 | 0.5 | |
| Mn-IO tetrahedron | 30.6 | Citric acid | Carboxylic | 210 | 29.32 | 50.3 | 366.3 | 7.28 | 0.5 | |
| Mn-IO sphere | 15 | Citric acid | Carboxylic | 210 | 16.36 | 23.5 | 201.4 | 8.57 | 0.5 | |
| Mn-IO cube | 20.4 | Citric acid | Carboxylic | 210 | 22.89 | 33.7 | 306.5 | 9.09 | 0.5 | |
| Mn-IO rhombohedron | 32.4 | Citric acid | Carboxylic | 210 | 35.51 | 39.2 | 504.9 | 12.9 | 0.5 | |
| Mn-IO octapod | 36.8 | Citric acid | Carboxylic | 210 | 38.94 | 56.4 | 573.5 | 10.2 | 0.5 | |
| IO sphere | 15 | Citric acid | Carboxylic | 210 | * | 10.1 | 152.2 | 15.1 | 1.5 | |
| Mn-IO plate | 24.6 | Citric acid | Carboxylic | 210 | 26.83 | 46.3 | 465.1 | 10 | 1.5 | |
| Mn-IO tetrahedron | 25 | Citric acid | Carboxylic | 210 | 29.32 | 45.9 | 508.9 | 11.1 | 1.5 | |
| Mn-IO sphere | 15 | Citric acid | Carboxylic | 210 | 16.36 | 21.3 | 310.5 | 14.6 | 1.5 | |
| Mn-IO cube | 12 | Citric acid | Carboxylic | 210 | 22.89 | 28.9 | 427.5 | 14.8 | 1.5 | |
| Mn-IO rhombohedron | 13.5 | Citric acid | Carboxylic | 210 | 35.51 | 44.6 | 708.8 | 15.9 | 1.5 | |
| Mn-IO octapod | 30 | Citric acid | Carboxylic | 210 | 38.94 | 46.9 | 772.6 | 16.5 | 1.5 | |
= not reported in text.
Catechol-derivative; check reference for complete structure.
Aggregate size of the cluster of IO spheres, not hydrodynamic size.
4. Iron oxide core: synthesis, size, shape, composition, dopants, crystallinity
4.1. Synthesis methods
The size, shape, and composition of the iron oxide core can all be modified to fine-tune the magnetic properties of IONPs. There are many methods to synthesize IONPs with varying levels of control over size, shape, and composition, however, a major consideration for scale-up and clinical translation is uniformity and reproducibility. Thermal decomposition has been the standard in the industry for its ability to produce uniform IONPs at a large scale with fine control over the size and morphology by altering the ratios of reagents and reaction temperature.[48,56] With this method, organometallic precursors in organic solvents with surfactant capping agents are decomposed at high temperatures to form IONPs. However, IONPs produced via thermal decomposition are not water soluble, requiring further modifications to produce aqueous IONPs. Co-precipitation, on the other hand, produces IONPs in aqueous conditions. Although methods have been developed to provide better control over the size, the monodispersity is often lacking, making co-precipitation a less desirable method to develop IONPs with precise control over the size and morphology.[57] Another approach is the classic sol-gel method, in which hydroxylation and condensation of molecular precursors is performed to form IONPs. Size and shape can be controlled by pH, concentration of reagents, temperature, and properties of the gel. Though the technique is relatively simple, the product is often weak with high permeability, hence, stability remains a challenge.[58] Microbial incubation is another interesting method, utilizing proteins, bacteria, plants and fungi to produce crystals of magnetite. Size and morphology are determined by the microbe used. Although the method can be easily scaled up, the process is slow and laborious, with challenges in making small core IONPs.[59,60] Flow injection can produce homogeneous NPs of varying morphologies by altering reactant ratios, flow rate, capillary diameter, and injection and cycle times.[61] However, as the method requires continuous flow of reactants in a capillary reactor and continuous mixing, costs associated with scale-up may be an issue.[62] Thermal decomposition has dominated the field for good reason; its ability to produce large-scale with fine control over size and morphology makes it ideal for tailoring the properties discussed in this section.
4.2. Core size
IONPs are superparamagnetic and possess high magnetization and thus great magnetic inhomogeneity, leading to high transverse relaxivity (r2). Reducing the core size of the IONP is the most straightforward way to suppress the magnetic moment of the IONP to reduce r2 relaxivity. The mechanism of this approach can be explained by the spin-canting effect: the spins on the surface of the nanoparticles become disordered as the crystal structure is interrupted. Because these surface spins do not fully align with the bulk spins of the nanoparticle, they form a magnetically dead region at the particle surface. As the core size decreases, a greater proportion of the particle’s volume is composed of the magnetically dead region (Figure 4).[9] When the iron oxide core is 5 nm, roughly half the region is magnetically dead, and this proportion increases to 78% for a 2.5 nm iron oxide core.
Figure 4.

Spin-canted proportion (The proportion of IONP volume consisting of the magnetically dead spin-canted region (blue) as a function of IONP diameter (assuming a 0.5 nm spin-canted layer[67–69,71]), with a depiction of representative IONP core cross-sections. The thickness of this region remains constant regardless of IONP size, therefore, comprises a greater proportion in smaller particles, leading to a decrease in magnetization, and thus r2, with decrease in IONP size.
The dependence of the net magnetization on core size has been well-established.[63–65] In one study, IONPs of varying core sizes (14–26 nm) were developed via a thermal decomposition method. After PEGylation, the IONPs were evaluated for their magnetic properties, which showed a clear correlation between core size and magnetization.[66] The saturation magnetization increased with core size, so did r2 relaxivity value. This trend was also observed in a study using IONPs of core sizes between 1.5–12 nm.[48] Magnetization and r2 decreased with size, with the 1.5 nm particles exhibiting almost no magnetization. The thickness of the spin-canting layer has been observed to be between 0.4 to 0.9 nm across a range of IONP sizes,[67–71] suggesting that ultrasmall IONPs, with almost their entire volume composed of disordered spins, could reach r2/r1 ratio close to 1. However, the high surface energy of ultrasmall IONPs, due to their large surface area/volume ratio, can lead to aggregation. In another study, IONPs of size ranging from 1.9 to 4.9 nm were evaluated for potential as T1 contrast agents.[50] Though the r2 decreased with decreasing core size, the optimal size (lowest r2/r1 ratio) was found to be 3.6 nm. It is possible the smaller sized IONPs suffered from high surface energy, leading to aggregation that caused the increase in r2/r1. Though smaller IONPs may have lower saturation magnetization, passivating the surface of these smaller IONPs to confer stability in biological media remains a challenge. In order to minimize r2, IONPs should have as small of a core size as possible without sacrificing stability to prevent aggregation.
4.3. Morphology
Spherical IONPs are the most commonly researched materials as T2 contrast agents, yet changes in core morphology can influence both r1 and r2 relaxivities. Morphologies with particularly high surface area to volume ratios may increase r1 by exposing a greater number of metal ions, which allows for more inner-sphere interactions with water molecules. Increasing surface area to volume ratios can also reduce r2 by increasing the proportion of the spin-canted region for a given volume, but edge effects may increase local magnetic field inhomogeneity. A suitable core morphology must balance these effects to obtain an acceptable r2/r1 ratio.
Rod-shaped IONPs are generally less suitable to serve as T1 contrast agents than spheres. In one study for nanorods of length 30–70 nm and diameter 4–12 nm, r2 values doubled in comparison to spheres of equivalent volume.[72] This is because the induced magnetic field of a sphere decreases with the inverse cube of the distance from the core, while that of a cylinder decreases with the inverse square, so the nanorod’s magnetic field remains stronger at a greater distance from the core. Because it remains relevant over a larger volume, the nanorod’s magnetic field will reach a greater number of protons, thus increasing dephasing (and increasing r2) more efficiently than the spherical IONP.
A spherical core, however, does not always have a T1 advantage over a rod. Extremely thin iron oxide nanorods can also be appropriate T1 contrast agents. Nanowhiskers of length 20 nm and exceptionally small diameter of 2 nm have been shown to have r1 and r2/r1 values of 6.13 mM−1 s−1 and 1.83, respectively comparable to commercially available GBCAs (e.g., Magnevist) which have r1 and r2/r1 values of 3.3 mM−1 s−1 and 1.18, respectively.[73,74] The small diameter of the nanowhiskers leads to a high proportion of their volume composed of the magnetically dead spin-canted layer, greatly reducing their magnetization. Moreover, the high surface area to volume ratio provides significant area for water molecules to interact directly with the core, and thus an increased inner sphere contribution to r1.
More exotic shapes affect r1 and r2 in ways that may not be immediately obvious. A framework has been proposed for understanding these effects in a study of unusually shaped Mn-IONPs.[75] Six Mn-IONP shapes of similar volume were considered: sphere, cube, hexagonal plate, tetrahedron, rhombohedron, and octapod (Figure 5). A greater effective radius (defined as half the length of the body diagonal of the particle) increased r2, as did an increase in the number and sharpness of corners. Effective radius gives an approximation of aspect ratio, and a greater aspect ratio, as in the case of the nanorods, increases r2. Additionally, sharp corners have a high density of magnetic surface charge, producing stray magnetic fields that promote rapid dephasing.
Figure 5.

TEM images of Mn-IONPs with various morphologies, listed in order of increasing r2/r1 at 1.5 T: (a) hexagonal plate, (b) tetrahedron, (c) sphere, (d) cube, (e) rhombohedron, and (f) octapod. (Reproduced with permission from[75], Copyright © American Chemical Society 2018.)
While the relationship between r1 and shape was roughly based on the surface area to volume ratio, the clearest correlation was an increase in r1 with the number of effective metal ions on the exposed faces. The number of exposed metal ions depends on surface area, but also on which facets of the crystal structure are exposed. The (100) facet, for instance, only has 2 effective Fe3+ ions, while the (110) facet has 2.83 Fe3+ and 2.83 Fe2+ (or, in this case, Mn2+). Water molecules interact with these exposed ions, resulting in inner sphere contribution to r1 relaxivity.
The most important distinction between the six shapes of Mn-IONP is their r2/r1 ratio. The octapod, with its eight sharp points, has the highest r2/r1 ratio (16.5 at 1.5 T). However, it is not the sphere, but the hexagonal plate with the lowest r2/r1 ratio (10 at 1.5 T). It has neither the highest nor the lowest value for either relaxivity, but a balance of minimal edge/corner effects and a high number of effective metal ions at its surface. The six morphologies arranged in order of increasing r2/r1 ratio at 1.5 T are shown in Figure 5. In order to minimize r2/r1, spheres and plates are preferred, and morphologies with sharp edges or corners should be avoided, making it important that the particles produced be regular and uniform in shape. As a practical consideration, the syntheses producing specific morphologies should be easily reproducible and not labor intensive.
4.4. Composition
Iron oxide nanoparticles can come in many different compositions, controlled by synthesis method and ratio of reagents. Composition plays a significant role in determining the magnetic properties of the nanoparticles. In most cases, including those synthesized by the popular thermal decomposition method, IONPs are produced in the form of Fe3O4 (magnetite) and γ-Fe2O3 (maghemite). Bulk magnetite possesses higher saturation magnetization than maghemite.[76] The Fe in magnetite is composed of 2 Fe3+ ions and 1 Fe2+ ion, whereas the Fe in maghemite is composed of 2 Fe3+ ions. As stated previously, the 7 unpaired electrons in Gd3+ allow ample interaction with water molecules, making GBCAs an effective T1 contrast agent.[23] In comparison, Fe3+ has 5 unpaired d electrons, while Fe2+ has 4 unpaired d electrons. Therefore, maghemite can reduce r2 by reducing IONP magnetization, without decreasing r1.
It has been reported that the ratio of magnetite to maghemite is dependent on the core size for IONPs synthesized by thermal decomposition.[56] Via XAS and XMCD results, the amount of maghemite was found to increase as the core sizes decrease, with maghemite being the dominant phase with 5 nm IONPs. As the core size decreases, the ratio of surface area to volume increases, increasing the proportion of oxidized maghemite at the IONP surface.
The magnetic properties of magnetite and maghemite nanoparticles have been investigated by many research groups. However, it is important to note the challenge in distinguishing magnetite from maghemite. XRD patterns of the both structures are very similar, with distinguishing peaks often marred by noise. IONPs composed of either magnetite or maghemite with core diameter of 4.8 nm were evaluated for their magnetization.[65] Magnetite vs. maghemite was confirmed via redox titration as an alternative to XRD. The IONPs composed of maghemite possessed lower net magnetization than the IONPs composed of magnetite. Due to lower magnetization, maghemite may also be the preferred composition to reduce r2 relaxivity.
In another study, 3 nm IONPs synthesized via thermal decomposition demonstrated XRD patterns consistent with maghemite as the primary crystal structure, and achieved an r2/r1 ratio of 6.12 at 3 T.[48] This idea has been further explored using IONPs synthesized via thermal decomposition, which were fully oxidized using trimethylamine N-oxide to convert all magnetite into maghemite.[25] After coating with zwitterions, an r2/r1 ratio of 2.0 was achieved at 1.5 T. Given its advantageous effects on both r1 and r2, oxidation does not need to be avoided, but rather encouraged for IONPs designed for T1 contrast. In order to maximize water interaction and minimize magnetization, IONPs should be oxidized to maghemite.
4.5. Impurity induced by doping
Doping has been a commonly used technique to develop dual-mode T1-T2 contrast agents using IONPs. Such systems often use Gd to enhance T1 while retaining the T2 properties of IONPs. However, in most situations, dual-mode T1-T2 contrast agents are less effective than a dedicated T1 or T2 contrast agent. Additionally, this does not address the issue of Gd toxicity. Similarly, IONPs have been doped with europium.[77] Eu2+ possesses 7 valence electrons, the same number as Gd3+, resulting in high relaxivity. Despite the claims of nontoxicity of Eu2+, Eu2+ is highly reactive and readily oxidizes to Eu3+, which possess low relaxivity and severe toxicity.[78]
Instead of producing a dual-mode T1-T2 contrast agent, doping IONPs with materials to diminish overall magnetization by interrupting the crystal structure of IONPs is an alternative strategy to make an effective T1 contrast agent. For example, FeOOH nanoparticles were developed that are antiferromagnetic with low r2, resulting in a low r2/r1 ratio.[79] However, challenges in monodispersity and homogeneity limit FeOOH nanoparticles from being effective on their own. An antiferromagnetic material like FeOOH doped into maghemite could potentially suppress r2 enough to produce an effective T1 contrast agent. In considering such a strategy, the benefits to r2/r1 must be weighed against the possibility of increased toxicity and the increased cost of a more complex synthesis if the goal for such IONPs is widespread clinical utility. Doping has potential in creating effective IONP-based T1 contrast agent if the dopant can reduce net magnetization. However, it is important that toxic dopants not be introduced, or IONPs lose their unique advantage over GBCAs. There is also a risk of over-engineering, rather than seeking a simpler solution that would translate more readily to widespread use.
4.6. Crystallinity
The degree of crystallinity also has an impact on suitability of IONPs for T1 contrast enhancement because it affects IONP magnetization. This is actually the same principle responsible for the effects of core size and doping: a smaller core size results a lower magnetization by the spin-canting effect, which arises from increasingly interrupted crystal structure at the particle surface, and element doping does the same by disrupting the inner crystal structure as a result of substitution of iron ions in the crystal lattice. There is also a magnetization reduction mechanism in ultrasmall particles (<5 nm), in addition to the reduction from the spin-canting effect.[80] This is the result of vacancy disorder due to oxidation, a disorder in the internal spins of the NP analogous to the spin-canting effect on the surface.
In addition to these size-dependent effects, any reduction in crystallinity reduces magnetization, and thus the value of r2. In larger core sizes (>100 nm), a lower degree of crystallinity reduces saturation magnetization, as demonstrated on a similar superparamagnetic CoFe2O4 nanocrystal, for which a linear relationship was found between crystallite size and saturation magnetization.[81] The effect of crystallinity on magnetization, independent of size or doping, has also been confirmed at more relevant, smaller particle sizes. In one study of zinc-substituted maghemite NPs, an increase in crystallinity as a result of heating, increased saturation magnetization.[82] In another study, ultrasmall IONPs (<5 nm) were intentionally recrystallized, which increased their saturation magnetization by 40%.[83] Another study of maghemite NPs confirm a reduction in magnetization due to crystal defects.[84] From these studies, strategies to lower the degree of crystallinity should be utilized to lower the saturation magnetization of IONPs and promote T1 contrast.
5. Surface coating of IONPs
Surface coatings of IONP systems can be tailored to improve T1 contrast, primarily by affecting the time parameters that contribute to r1. These are τ1e (electron relaxation time), τR (rotational correlation time), and τm (water residence time). Each of these affects r1 relaxation by altering the efficiency of energy exchange between the IONP system and the hydrogen protons of bulk water, but different parameters will dominate depending on conditions. τ1e increases with the square of the magnetic field strength, so it is only short enough to be relevant in weak fields, and has no significant impact on r1 at clinical field strengths of 1.5 T or more.[85] The dominant parameters affecting relaxivity, τR and τm, can be visualized in Figure 3.
The rotational correlation time (τR) is the time for the IONP system to rotate one radian. The magnetic field fluctuations produced by this rotation induce relaxation most efficiently near the proton Larmor frequency (42.58 MHz/T), at which the maximum energy exchange occurs. Traditional gadolinium chelate contrast agents, for instance, tumble quickly because of their small size, but their rotation can be slowed, and r1 increased, with the addition of ligands that bind to human serum albumin or other large proteins in vivo. For large, flexible systems, it should be noted that τR comprises both the IONP system’s rotation and the motion of the metal or metal oxide core in relation to the system as a whole. It has been shown in GBCAs that r1 can be increased if this relative motion is inhibited by using coatings with rigid ring structures or secondary bonds.[86]
The final time parameter is water residence time, which is divided into τm, the amount of time a water molecule is in direct contact with the iron ions in the core (typically 0.1 ns to tens of μs), and τ’m, the residence time in the secondary or outer sphere (generally a few ps).[85] Increasing either of these time parameters will generally increase r1, because they are usually shorter than the time required for water molecules to relax. This, of course, depends on the value of τR: as τR increases to near the Larmor frequency, relaxation happens more efficiently, and a shorter τm may be preferred so that relaxed water molecules return to the bulk water more quickly.[87] For instance, typical values of τm to maximize r1 are between 10–30 ns for GBCAs, but may be less than 10 ns for those systems with longer τR.[85] There is no universal ideal value for τm or τ’m; they must be optimized for the specific circumstances of the IONP system, such as τR, magnetic field strength, and the magnetic moment of the core.
The time parameters τR, τm, and τ’m, as well as associated r2 values, are influenced by the chemical and physical properties of the coating of the iron oxide core. Unfortunately, these parameters are not independent of each other, nor are the physical and chemical properties of the coating. A clearer understanding of the effects of surface coatings can provide guidance in improving IONP contrast agent design.
5.1. Molecular weight
Altering the molecular weight (MW) or chain length of the polymer coating would seem to be the most straightforward method to tailor r1, however, the reality is not so simple. The tumbling time, τR, depends on the mass of the complex, but also on factors such as the viscosity of the solvent, the density of the system, and the hydration radius of the coated IONP.[88] Additionally, the hydrated volume of the IONP complex will affect the number of water molecules interacting with it, and the density of the polymer coating will alter τm or τ’m as the diffusivity within this hydrated layer changes. All of these interrelated factors play a role in determining r1.
Studies of the effect of molecular weight of the coating polymer on relaxivity found little direct correlation between them. In one such study, IONPs synthesized via thermal decomposition were coated with PEGs with MW ranging from 1–20 kDa.[63] In all the samples the hydrodynamic size increased linearly with increase in chain length, as expected. However, no correlation was found between chain length and r2, r1, or r2/r1. No noticeable trends were observed, likely because the chain length of the PEG impacts the coating density: higher MW PEG has more steric hindrance than lower MW PEG. Coating density also changes hydrophilicity, which impacts the diffusivity of water molecules through the system.
In a similar study, IONPs were coated with PEG with MW ranging from 550–5000 Da.[89] In this study, there was no linear correlation between PEG chain length and hydrodynamic size. IONPs coated with PEG550 had a hydrodynamic size larger than those coated with PEG1000. This is likely because such low MW PEGs are not able to stabilize IONPs. Similar to this study, no firm correlation was established between relaxivity values and chain length. Some distinction could be made between larger MW PEGs (1000, 2000, 3000 Da) and smaller PEGs (550, 750 Da), with the former having higher r1 and lower r2 values. This could be attributed to the increase of hydrodynamic volume with chain length, resulting in a greater number of water molecules exchanging energy with the nanoparticle complex. It may also be the effect of the greater mass of the IONP system on τR. Similar experiments have been performed by many other groups, with similarly inconclusive correlations.[64,90,91]
Monte Carlo simulations may shed some light on the mechanisms behind these seemingly inconsistent results.[89] The model consists of three portions: an IONP core, an inner layer that excludes water from direct interaction with the core, and an outer layer treated as either bulk water or an area of slower diffusion. This model allowed for investigation of second- and outer-sphere effects independent of any inner-sphere contribution to relaxivity. When the outer layer was treated as an area of fast diffusion, like bulk water, increasing its thickness was effective at increasing r1. However, when treated more realistically as an area of slower diffusion, a thicker outer layer also caused an increase in r2. Water molecules diffusing more slowly through the IONP coating were relaxed more completely as they had more time to interact with the complex (increasing r1), but they also remained in proximity to the core’s magnetic field for longer (increasing r2) (Figure 6). While this IONP model is fairly unique, the balancing act of promoting water molecule interaction with the complex but avoiding the influence of the magnetic field, is a fundamental difficulty for designing any IONP system suitable for T1 contrast.
Figure 6.

Modeling and computer simulation of IONP relaxivity. R2 (normalized r2) is plotted as a function of both exclusion radius (hydrophobic region around the core that excludes water molecules from direction interaction) and slow compartment radius (region where water molecule diffusion is slowed by the polymer coating), with high values of R2 represented by lighter shading. Note that a larger slow compartment radius can increase r1 but it also increases r2 as water molecules reside longer at the strongest region of the core’s magnetic field. (Reproduced with permission from[89], Copyright © Wiley-Liss, Inc. 2007.)
In addition to the challenge in minimizing r2/r1, there are practical challenges in maximizing r1. There are many interrelated factors influencing longitudinal relaxation, and the way they affect water diffusion through the IONP system is not always controllable or well understood. Clearly a simple consideration of polymer chain length is not enough; polymer packing will change water mobility in the IONP system, and its effect undermines any clear relationship between r1 and molecular weight. Polymer chain length, ligand density, hydrophilicity, and other chemical properties of the polymer coating are all proxies for the time parameters that cannot be directly altered: τR, τm, and τ’m.
While it is not possible to directly alter these parameters individually, it is possible to measure them, at least approximately. τR can be estimated using several techniques, including NMR and EPR spectroscopy, and fluorometry, and τm can be determined by 17O NMR at high field strength.[86,92] Measuring these parameters in addition to r1 and r2 may improve our understanding of how IONP-based systems can be designed to maximize r1.
5.2. Chemical composition of surface coating: anchoring groups
Altering the anchoring groups that bind the ligand to the IONP core may be a promising approach to reducing r2. Anchoring groups are thought to alter IONP magnetization by changing the oxidation and spin-canting of the IONP surface. Determining the exact mechanism of this effect is challenging, however, several studies provide a framework for rational selection of anchoring groups.
In one study, PEG 2000 was conjugated to Fe3O4 NPs using three different groups: diphosphate, hydroxamate, and catechol.[93] All three coatings reduced the magnetization of the IONP, with diphosphate causing the most significant reduction, followed by catechol, then hydroxamate. This is likely due to the decreased binding affinity, but how this reduces the magnetization is not entirely clear. A similar experiment was conducted, where IONPs were coated with PEG using four anchoring groups: dopamide, 2,3-dihydroxybenzamide (DHB), carboxylate, and phosphonate.[94] Both dopamide and DHB largely maintained the magnetization of the IONP, while phosphonate and carboxylate groups were able to reduce the magnetization. In other studies, citric acid and meso-2,3-dimercaptosuccinic acid (DMSA) have been found to reduce IONP magnetization compared to oleic acid.[95] 3-aminopropyltriethoxysilane (APTS) reduces IONP magnetization by 50% compared to no coatings.[96]
The mechanism by which anchoring groups alter magnetization is not established, but direct analysis of the degree of spin-canting may provide insight in optimizing r2 values for IONPs designed as T1 contrast agents by isolating the effect of the anchoring group from other factors that affect magnetization and r2. The thickness of the spin-canting layer can be determined using 57Fe Mössbauer spectrometry, and NMR.[69] When the spin-canting layer is present, it is typically found to be about 0.5 nm, corresponding to two atomic layers with broken symmetry, across various particle sizes.[67–69,71]
Several studies have taken advantage of spin-canting analysis of IONPs with various anchoring groups in an effort to improve T2 contrast by minimizing spin-canting. It was found that carboxylate groups decreased the magnetization of IONPs, but phosphonate did not.[68] Both anchoring groups created an oxidized layer of about 2.8 nm, but only the IONP coated with carboxylates exhibited a spin-canting layer of 0.5 nm. They speculated that phosphonate groups replace missing oxygen atoms at the IONP surface, thus reducing spin-disorder by bolstering the crystal structure at the edges of the IONP where it has been interrupted. It was found that carboxylate and phosphonate both increased magnetization by lessening the degree of spin-canting, but, consistent with Daou, found that phosphonate decreased spin-canting more than carboxylate.[68,97] They suggest that this is due to phosphonate’s double-monodentate or bidentate bonds increasing IONP surface order compared to carboxylate’s single bond.[97] Similarly, it was reported that dopamine coating increases magnetization over oleic acid coating, confirming a smaller magnetic radius for the oleic acid-coated IONP despite TEM showing a comparable core size for both coatings.[98] It is possible that the catechol group from dopamine acts analogously to phosphonate in this situation, filling in the crystal structure of iron oxide at its surface and promoting higher magnetization. Anchoring groups that maintain or increase spin-canting at the IONP surface could be applied to reduce magnetization, and therefore r2, and would be advantageous in the development of T1 contrast agents. There are relatively few studies investigating the effects on magnetization of only anchoring groups, as opposed to the whole polymer coating, but key findings with pertinent chemical structures are summarized in Table 2.
Table 2.
Chemical structure of various anchoring groups and their effects on magnetization.
| Anchoring group | Structure | Notes | Reference |
|---|---|---|---|
| Diphosphate | 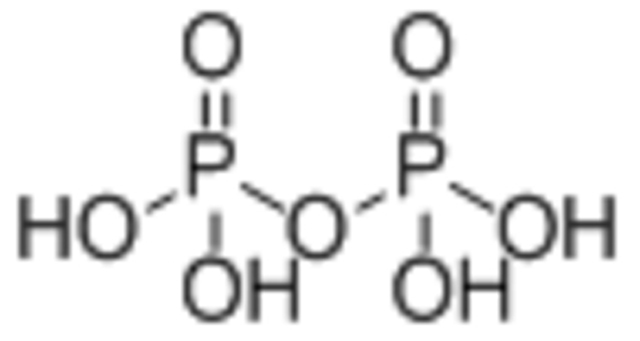 |
||
| Catechol | 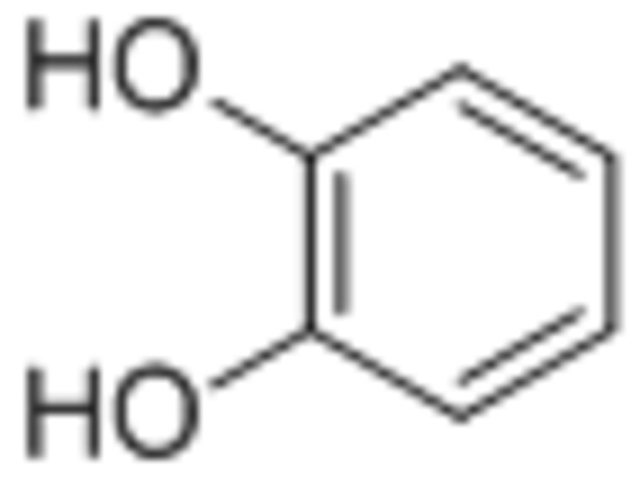 |
In order of most significant magnetization decrease: Diphosphate > Catechol > Hydroxamate | [93] |
| Hydroxamate | 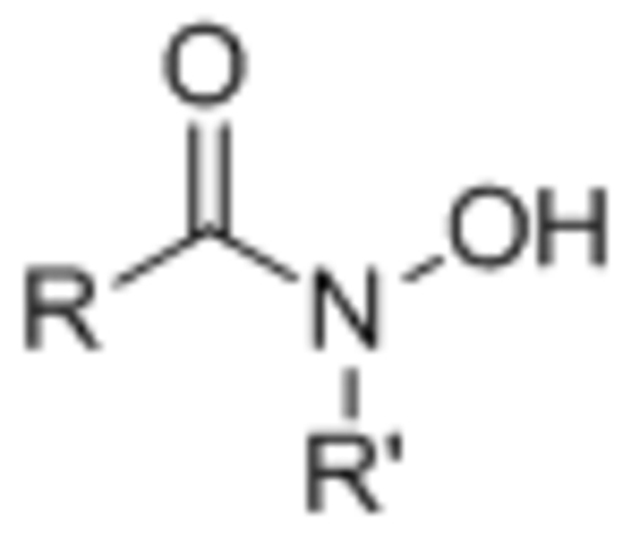 |
||
| Carboxylate | 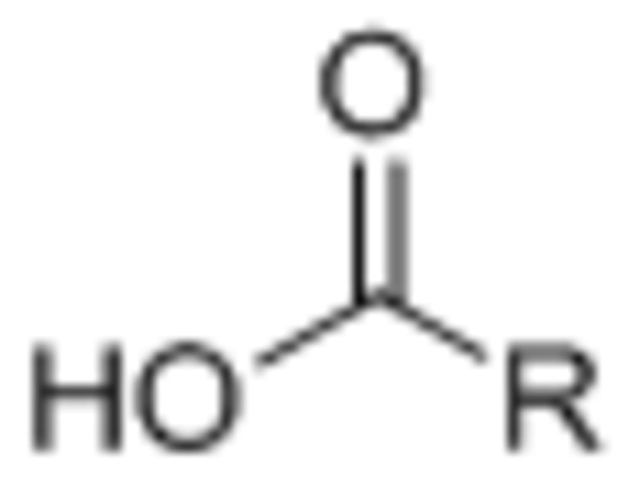 |
||
| Phosphonate | 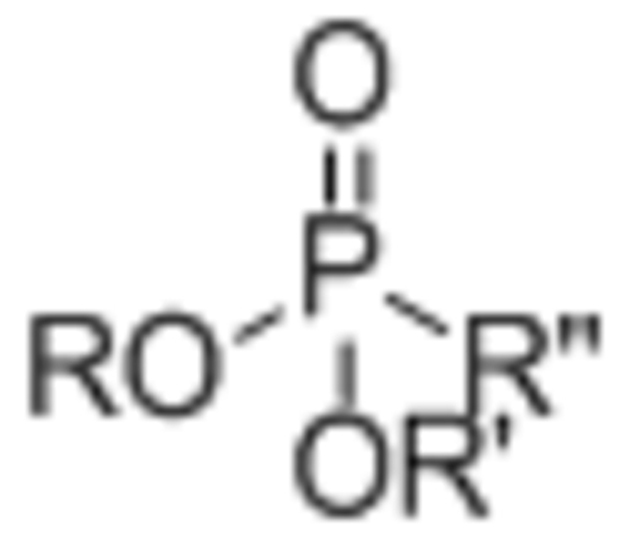 |
||
| Dopamide | 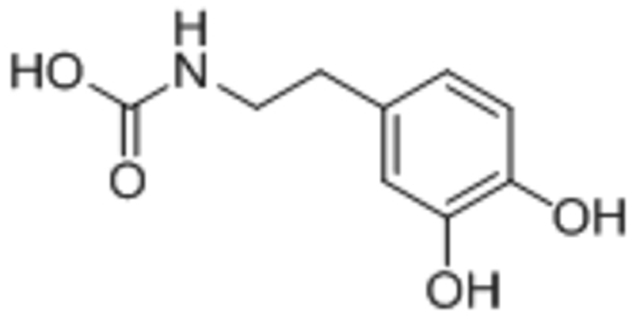 |
Phosphonate and carboxylate groups reduced IONP magnetization Dopamide and DHB had little effect on magnetization | [94] |
| 2,3-dihydroxybenzamide (DHB) | 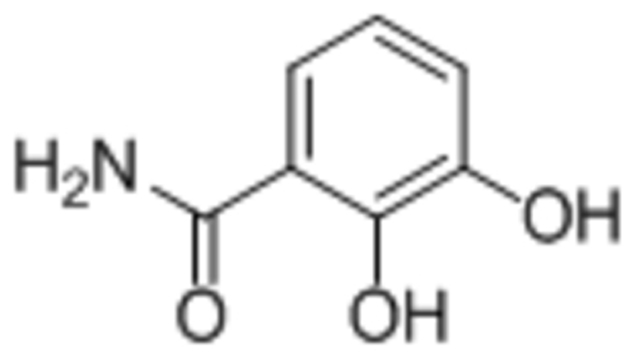 |
||
| Citric acid | 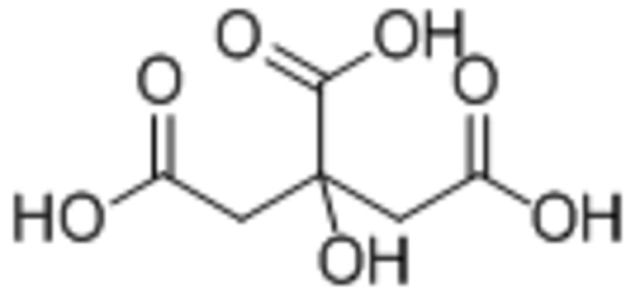 |
||
| meso-2,3-dimercaptosuccinic acid (DMSA) | 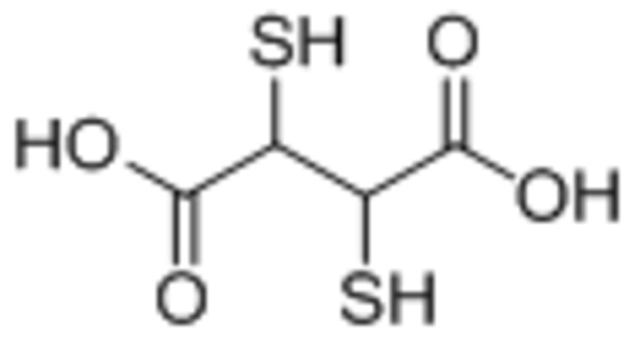 |
Both citric acid and DMSA reduced IONP magnetization compared to oleic acid | [95] |
| Oleic acid | 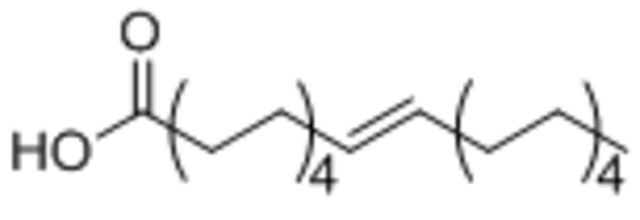 |
||
| 3-aminopropyltriethoxysilane (APTS) | 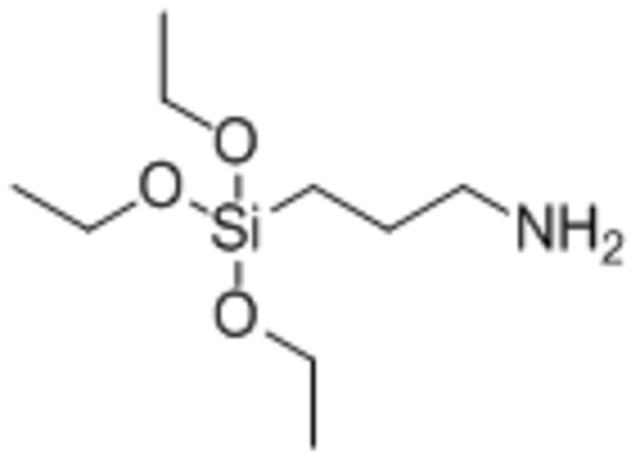 |
Reduced IONP magnetization by 50% compared to no coating | [96] |
In addition to the effects of anchoring groups on oxidation and spin-canting, there is evidence that π-electrons in the anchoring group may increase r2 by creating a small magnetic field in opposition to the induced magnetic field of the whole IONP core, and this additional magnetic field homogeneity may increase the rate of dephasing. It was found that the r2/r1 ratio of the IONP system was greatest with the π-π conjugation of a catechol group, lower for the p-π conjugation of a hydroxamate group, and lowest for the non-conjugation of diphosphate.[93] The r2/r1 ratio is an imperfect way to measure this effect, but it does suggest that avoiding π-π interaction could improve an IONP system’s suitability as a T1 contrast agent.
5.3. Chemical composition of surface coating: terminal groups
Despite the diversity of coatings used for IONPs in the literature, there is little data isolating the effects of their terminal groups on longitudinal relaxivity independent of the effects of the anchoring group or molecular weight. The mechanism by which terminal groups alter T1 contrast performance is similar to that of molecular weight: altering r2 and r1 by mediating how water moves through the system. The impact of the chemical composition of this outer region on inner sphere water residence time has been clearly demonstrated in Gd-based systems. In one such study, altering terminal groups resulted in a nearly 1000-fold increase in τm, from 0.7 to 612 ns where terminal groups are ordered from fastest to slowest τm: phosphonate ~ phenolate < alpha-substituted acetate < hydroxamate ~ sulfonamide < amide ~ pyridyl ~ imidazole. [92] Maximizing r1 was not as simple as minimizing or maximizing τm. Amide, pyridyl, and imidazole groups had residence times too long to exchange efficiently with bulk water, while the short residence times of phosphonate and phenolate meant that the exchange was too fast for efficient relaxation. Measuring τm directly, however, helped determine which terminal group was suitable for the specific GBCAs. While this study only dealt with the effect of terminal groups in Gd-based systems, a near 1000-fold increase in water residence time suggests a relationship between terminal group and T1 contrast performance that has yet to be elucidated for IONPs, and demonstrates a clear need for further research in this area.
6. Hydrophobicity of IONP system
The interaction between the IONP complex and surrounding water molecules can be further manipulated by controlling the hydrophobicity of the system. Altering hydrophobicity of the IONP core or its surface coating can be a way to control inner and outer sphere interactions with water molecules that can increase r1, and reduce r2 by preventing water from penetrating to the strongest part of the induced magnetic field of the IONP core. As IONPs are often conjugated with targeting agents and/or even therapeutics that could be hydrophobic, the effects of hydrophobicity need to be accounted for. Having hydrophobic molecules bound to the core could prevent water from accessing to the core (region with the strongest magnetic field), reducing r2, as depicted in Figure 7.
Figure 7.

Illustration of the effect of the addition of hydrophobic drugs to the IONP system (black sphere: core, gray wavy lines: polymer). If bound near the core, hydrophobic drugs block water molecules (blue) from accessing the strongest regions of the IONP’s magnetic field, thus reducing r2. However, this also prevents inner-sphere effects from contributing to r1.
In one study, two thermo-sensitive IONPs coated with ethylene oxide or propylene oxide were developed.[99] The two IONP systems convert from hydrophilic at temperatures below the lower critical solution temperature (LCST) to hydrophobic above the LCST. The IONPs showed a reduction in both r1 and r2 relaxivities with increasing temperature at field strengths ranging from 0.2–7 T. Therefore, as hydrophobicity is increased (with increasing temperature), both relaxivities have been shown to decrease due to a reduction of the interaction of water molecules with the nanoparticle.
In another study, 10 nm IONPs coated with polyvinyl alcohol were loaded with doxorubicin (DOX).[100] DOX molecules were assumed to be held on the IONP surface via hydrogen bonding. Saturation magnetization (Ms) was measured before DOX loading to be 54.42 emu, and a sharp decrease to 30.20 emu was found after DOX loading. As DOX has poor water solubility, it is likely that the DOX molecules are creating a hydrophobic layer around the IONP system. This hydrophobicity prohibits water molecules from interacting with the IONP system lowering the saturation magnetization. Although the relaxivities were not measured, both relaxivities are likely to decrease with DOX loading.
A similar system was explored with a theoretical model. In this model, the nanoparticle system was composed of an iron oxide core, a hydrophobic inner layer that prevents water access to the core, and a hydrophilic outer layer.[89] The Monte Carlo simulation showed that a thicker hydrophobic layer decreased water access to the core, decreasing r2. This could be a promising strategy to reduce r2, provided that sufficient T1 signal can be maintained from interactions in the second and outer spheres. Such a design (with both hydrophobic and hydrophilic coatings) may not be feasible with ultrasmall IONP cores due to the high surface energy involved. However, hydrophobic drugs bound to the core of hydrophilic IONPs may provide an analogous system that can suppress r2. This theoretical model suggests that having a hydrophobic core and a hydrophilic coating may be a way to decrease r2/r1, as the hydrophobic core will restrict water access to the region of highest magnetic field strength. As IONPs are frequently used to carry hydrophobic drugs, the impact of hydrophobicity warrants further investigation past the theoretical simulation, particularly into the potential of fine-tuning hydrophobicity to direct how water moves through the IONP system.
7. Magnetic field strength
To achieve T1 contrast enhancement, optimizing a balance between τR and τm is necessary, and this balance is dependent on the Larmor frequency. As the Larmor frequency (42.58 MHz/T for hydrogen protons) is dictated by field strength, the field strength has a large impact on r2/r1.
A variety of commercially available MRI contrast agents have been evaluated for their relaxivities at magnetic field strengths ranging from 0.47 T to 4.7 T.[74] The calculated r2/r1 ratios for selected MRI contrast agents at various field strengths are shown in Table 3. For both Feridex and Resovist (commercially available IONP-based MRI contrast agents), the r2/r1 ratios decreased with decreasing field strength, and were up to 15× lower at 0.47 T than at 4.7 T. This is because with greater field strength, the magnetization of IONPs is increased, leading to higher r2 relaxivity. However, for Gadovist and Magnevist (commercially available GBCAs), field strength seemed to have minimal impact on r2/r1.
Table 3.
Effects of magnetic field strength on r2/r1 of MRI contrast agents in water at 37°C.[74]
| Material | 0.47 T | 1.5 T | 3.0 T | 4.7 T | |
|---|---|---|---|---|---|
| Feridex | IONP | 5.63 | 8.72 | 22.7 | 45.7 |
| Resovist | IONP | 4.17 | 7.0 | 31.1 | 62.9 |
| Gadovist | GBCA | 1.38 | 1.18 | 1.22 | 1.22 |
| Magnevist | GBCA | 1.18 | 1.18 | 1.19 | 1.25 |
In another study, IONPs with core size of 11–22 nm demonstrated superior T2 imaging capabilities under high magnetic fields (1.5 and 3 T), yet these IONPs behaved like T1 contrast agents when under an ultra-low field strength at 0.13 mT.[101] At 0.13 mT, the 11 nm IOSPM possessed an r2/r1 ratio of 1.2, close to the theoretical minimum value of 1. Despite 0.13 mT MRI having little clinical relevance, this experiment demonstrates the importance of magnetic field strength when evaluating contrast agents.
MR imaging in research settings may be performed at field strengths much higher than clinical MRIs (typically 1.5 or 3 T). It is important to keep in mind that r2/r1 values determined using a 14 T magnet, for example, may not reflect r2/r1 values for the same contrast agent in more realistic clinical conditions. In order to properly evaluate IONPs as T1 contrast agents, IONPs must be tested at clinically relevant low field strength. As IONPs inherently possess high r2, the r2/r1 ratio inflates at higher field strengths, hence lower field strength should be used.
8. Clustering
In physiological conditions, IONP systems that undergo agglomeration may be more accurately described as clusters than as free IONPs. Clustering alters the IONPs’ magnetic properties and interaction with surrounding water molecules, which can affect their ability to enhance T1 contrast.
The effect of IONP agglomeration on r2 is demonstrated by inducing IONP clustering in pseudo-biological conditions using NaCl and bovine serum which resulted in an increase in r2 from 65 to 133 mM−1 s−1 as cluster size increased from 7 to 45 nm.[75] A similar effect is found in the case of intentionally designed clusters of multiple IONPs. Ultrasmall IONPs with 5 nm cores exhibit significantly increased r2 values when enmeshed in mesoporous silicon or polymer structures (approximately 2× and 8× the r2 value of the free IONP, respectively).[102] Chains of similarly sized IONPs linked together into a worm-like structure with hyper-branched polyglycerols show a 3.5× increase in r2.[103] Indeed, a linear correlation was found between r2 and the number of nanoparticles comprising a cluster (Figure 8).[104] This increase in transverse relaxivity is caused by the interaction between the induced magnetic fields of the iron oxide cores in the cluster. These fields interfere with each other constructively or destructively, increasing the inhomogeneity of the magnetic landscape and thus increasing the rate of dephasing.
Figure 8.

Effects of IONP clustering on transverse relaxivity. As the number of IONPs in a cluster grows larger, an increase in r2 is observed at both (a) 0.47 T and (b) 7 T, caused by the interaction of the induced magnetic fields of the iron oxide cores in the cluster. As these fields interact constructively or destructively, the inhomogeneity of the magnetic landscape is increased, increasing the rate of dephasing. (Reproduced from[104], Copyright © Wiley Periodicals, Inc., 2014.)
Given the effects of agglomeration on transverse relaxivity, it should generally be avoided in developing IONP T1 contrast agents, but there are exceptions. In a study conducted by Lu et al., a cluster of 2 nm IONPs was developed with an r2/r1 of 1.49.[49] This is likely due to the extremely small core size, resulting in reduced magnetization as compared to larger IONPs, offsetting the r2 increase of clustering. Agglomeration has also been used to create a T1-T2 switchable contrast agent, taking advantage of the properties of both the free IONPs and the cluster. Ultrasmall IONPs (3.5 nm core), initially used for T1 contrast, facilitated extravasation into tumor tissue where they self-assembled into an agglomerate suitable for T2 contrast.[105] A nanocluster was developed that improved T1 contrast over free IONPs.[106] Tannic acid-coated IONPs (4 nm core) suspended in a network of bovine serum albumin created a 200 nm system with increased circulation time compared to free IONPs. While this clustering did increase r2, the value of r1 more than doubled, so that the r2/r1 ratio decreased from 2.34 for the free IONPs to 1.92 for the cluster. This effect is attributed to high hydrophilicity around the IONP, the decreased mobility of the IONP in the cluster, and the “bulky” structure of the tannic acid coating, which allows increased water access to the IONP core by preventing ligand packing at the IONP surface.
Clustering also influences r1 by changing where and how water molecules move through the system. While the larger size of the cluster may promote T1 relaxation by slowing IONP rotation (τR) nearer the Larmor frequency, the reduced mobility of water within the cluster may reduce r1 by increasing τm and τ’m out of their ideal range. Additionally, as cluster size increases and more IONPs reside in the less accessible inner volume of the cluster, the inner-sphere contribution to r1 is reduced.
This reduction in r1 was corroborated by a study where the effects of agglomeration were investigated using Mn-Zn-ferrites coated with anionic polyacrylate and inducing controlled agglomeration using Ca2+ ions.[107] Larger agglomerates were shown to have significantly lower values of r1, which decreased by a factor of 2 as the radius of the clusters increased from 50 to 100 nm. This was compared with a theoretical model for r1:
| (1) |
where T1b is the relaxation time in the bulk fraction, r1g is the individual particle relaxivity, Cg is the iron molar concentration within the aggregate, τm is the residence time on site m, and pm is the relative population of a virtual water fraction leaving site m, dependent on the radius of and distance between agglomerates.
This model agreed reasonably well with experimental data, predicting a 1.6× decrease in r1, with the difference between the model and experiment likely due to Ca2+ allowing concentration of IONPs within the agglomerates to increase as the agglomerates grew, rather than remaining at a static Cg. Even if reasonable values for the parameters in Eq. 1 are not determined, it can still serve as a framework for considering the effects of clustering on r1 qualitatively. Unless great care is taken to promote exchange between the cluster and the bulk water, r1 will decrease with agglomeration. This, coupled with an increase in r2, indicates that clustering is likely going to reduce an IONP system’s efficacy as a T1 contrast agent.
9. Conclusions and outlooks
Iron oxide-based nanoparticle systems, though more commonly used as T2 MRI contrast agents, have shown promise as a non-toxic alternative to GBCAs as T1 contrast agents. However, despite numerous studies of proof of concept establishing this potential, a suitable IONP T1 contrast agent has yet to be developed for clinical use. Minimizing r2 and maximizing r1 for such a system involves optimizing a host of intertwining parameters. Each factor contributing to improving the relaxivity comes with drawbacks and caveats. Some are relatively clear: oxidation reduces r2, so does decreasing core size and degree of crystallinity. Clustering increases r2, and, with the exception of a few carefully designed systems, should be avoided to minimize r2/r1.
The effects of the polymer coating are more complex, and may depend on factors such as polymer packing that are difficult to control or even observe. Much of the research into how polymer coating impacts r1 has been performed on GBCAs and has been underutilized in developing IONP contrast agents. Longitudinal relaxivity depends on the rotational correlation time of the system and the residence time of water within the polymer coating. Both time parameters can be measured, and a more thorough investigation of how they are influenced by physical and chemical properties of the polymer coating may be a key to maximizing r1. This is especially important in systems where a hydrophobic layer is employed to reduce r2 by excluding water molecules from the core, preventing an inner sphere contribution to r1.
Given the complex relationship between these parameters, the properties included in Table 1 represent the minimum that should be reported in such studies. More complete reporting (especially of hydrodynamic size and composition which is often neglected) may provide greater insight into how relaxivity can be tailored. Additionally, fundamental studies that focus on the factors affecting relaxivity in isolation would strengthen the foundation of IONP-based T1 contrast agent design.
Clinical success of IONP-based T1 contrast agents is not a matter of simply minimizing r2/r1. Translation to clinical use comes with practical consideration including long-term storage, biological interactions, circulation time in the body, large-scale synthesis, and cost. This will limit feasible strategies to reduce r2/r1. Small core diameters, for instance, are effective at reducing r2, but their high surface energy can cause aggregation, and thus, providing sufficient steric stabilization could be challenging. Exotic morphologies may have similar issues, as sharp corners and kinks possess high surface energy due to their large surface area/volume ratios. If IONP systems are difficult or time-consuming to synthesize, these complications and associated costs will only increase as production is scaled up. IONPs doped with other metals can produce low r2/r1 ratios, but such systems are not an attractive alternative to GBCAs if dopants are toxic or retained in the body. Careful attention must be paid to all relevant parameters for IONP-based T1 contrast agents to advance beyond proof of concept studies.
Acknowledgement
This work is supported by NIH grant R01EB026890 and Kyocera Professor Endowment to M. Z.
Biography
Mike Jeon earned his Ph.D. in materials science and engineering at the University of Washington and his B.A. in chemistry and chemical biology from Cornell University. His current research interests include synthesis and characterization of nanoparticle systems for targeted drug delivery and molecular imaging.

Miqin Zhang is Kyocera Chair Professor of Materials Science & Engineering and Neurological Surgery, and adjunct professor in the Departments of Bioengineering, Radiology, and Orthopaedics & Sports Medicine at the University of Washington (UW). She joined the faculty of the UW in 1999 after receiving her Ph.D. from University of California at Berkley. Her research focuses on nanomedicine for cancer diagnosis and treatment, biomaterials for tissue engineering, and biosensors for detection of chemical and biological agents.

References
- [1].Blasiak B, van Veggel FCJM, Tomanek B, Journal of Nanomaterials 2013, 2013, 12. [Google Scholar]
- [2].Estelrich J, Sanchez-Martin MJ, Busquets MA, International journal of nanomedicine 2015, 10, 1727. [DOI] [PMC free article] [PubMed] [Google Scholar]
- [3].Kim J, Piao Y, Hyeon T, Chemical Society reviews 2009, 38, 372. [DOI] [PubMed] [Google Scholar]
- [4].Lee SH, Kim BH, Na HB, Hyeon T, Wiley interdisciplinary reviews. Nanomedicine and nanobiotechnology 2014, 6, 196. [DOI] [PubMed] [Google Scholar]
- [5].Terreno E, Castelli DD, Viale A, Aime S, Chemical reviews 2010, 110, 3019. [DOI] [PubMed] [Google Scholar]
- [6].Kim D, Kim J, Park YI, Lee N, Hyeon T, ACS central science 2018, 4, 324. [DOI] [PMC free article] [PubMed] [Google Scholar]
- [7].Kim J, Lee N, Hyeon T, Philosophical transactions. Series A, Mathematical, physical, and engineering sciences 2017, 375. [DOI] [PMC free article] [PubMed] [Google Scholar]
- [8].Koikkalainen J, Rhodius-Meester H, Tolonen A, Barkhof F, Tijms B, Lemstra AW, Tong T, Guerrero R, Schuh A, Ledig C, Rueckert D, Soininen H, Remes AM, Waldemar G, Hasselbalch S, Mecocci P, van der Flier W, Lötjönen J, NeuroImage Clinic. 2016, 11, 435. [DOI] [PMC free article] [PubMed] [Google Scholar]
- [9].Peng YK, Tsang SCE, Chou PT, Materials today 2016, 19, 336. [Google Scholar]
- [10].Legacz M, Roepke K, Giersig M and Pison U, Advances in Nanoparticles 2014, 3, 41. [Google Scholar]
- [11].Bao Y, Sherwood JA, Sun Z, Journal of Materials Chemistry C 2018, 6, 1280. [Google Scholar]
- [12].Rogosnitzky M, Branch S, BioMetals 2016, 29, 365. [DOI] [PMC free article] [PubMed] [Google Scholar]
- [13].Malikova H, Holesta M, The Journal of Vascular Access 2017, 18, S1. [DOI] [PubMed] [Google Scholar]
- [14].Todd DJ, Kay J, Annual Review of Medicine 2016, 67, 273. [DOI] [PubMed] [Google Scholar]
- [15].Hasebroock KM, Serkova NJ, Expert opinion on drug metabolism & toxicology 2009, 5, 403. [DOI] [PubMed] [Google Scholar]
- [16].Wang H, Revia R, Wang K, Kant RJ, Mu Q, Gai Z, Hong K, Zhang M, Advanced Materials 2017, 29, 1605416. [DOI] [PMC free article] [PubMed] [Google Scholar]
- [17].Kanda T, Ishii K, Kawaguchi H, Kitajima K, Takenaka D, Radiology 2014, 270, 834. [DOI] [PubMed] [Google Scholar]
- [18].Ramalho J, Semelka RC, Ramalho M, Nunes RH, AlObaidy M, Castillo M, American Journal of Neuroradiology 2016, 37, 1192. [DOI] [PMC free article] [PubMed] [Google Scholar]
- [19].F. D. S. Communication, 2015.
- [20].F. D. S. Communication, 2017.
- [21].F. D. S. Communication, 2018.
- [22].Aime S, Caravan P, J Magn Reson Imaging 2009, 30, 1259. [DOI] [PMC free article] [PubMed] [Google Scholar]
- [23].Lauffer RB, Chemical reviews 1987, 87, 901. [Google Scholar]
- [24].Taheri S, Shah NJ, Rosenberg GA, Magnetic resonance imaging 2016, 34, 1034. [DOI] [PMC free article] [PubMed] [Google Scholar]
- [25].Wei H, Bruns OT, Kaul MG, Hansen EC, Barch M, Wiśniowska A, Chen O, Chen Y, Li N, Okada S, Cordero JM, Heine M, Farrar CT, Montana DM, Adam G, Ittrich H, Jasanoff A, Nielsen P, Bawendi MG, Proc Natl Acad Sci U S A 2017, 114, 2325. [DOI] [PMC free article] [PubMed] [Google Scholar]
- [26].Fang C, Bhattarai N, Sun C, Zhang M, Small 2009, 5, 1637. [DOI] [PMC free article] [PubMed] [Google Scholar]
- [27].Lee N, Yoo D, Ling D, Cho MH, Hyeon T, Cheon J, Chemical reviews 2015, 115, 10637. [DOI] [PubMed] [Google Scholar]
- [28].Revia RA, Zhang M, Mater Today (Kidlington) 2016, 19, 157. [DOI] [PMC free article] [PubMed] [Google Scholar]
- [29].Stephen ZR, Kievit FM, Zhang M, Materials today 2011, 14, 330. [DOI] [PMC free article] [PubMed] [Google Scholar]
- [30].Chiarelli PA, Revia RA, Stephen ZR, Wang K, Jeon M, Nelson V, Kievit FM, Sham J, Ellenbogen RG, Kiem H-P, Zhang M, ACS nano 2017, 11, 9514. [DOI] [PMC free article] [PubMed] [Google Scholar]
- [31].Briley-Saebo K, Bjørnerud A, Grant D, Ahlstrom H, Berg T, Kindberg GM, Cell and Tissue Research 2004, 316, 315. [DOI] [PubMed] [Google Scholar]
- [32].Gu L, Fang RH, Sailor MJ, Park J-H, ACS nano 2012, 6, 4947. [DOI] [PMC free article] [PubMed] [Google Scholar]
- [33].Pouliquen D, Le Jeune JJ, Perdrisot R, Ermias A, Jallet P, Magnetic Resonance Imaging 1991, 9, 275. [DOI] [PubMed] [Google Scholar]
- [34].Weissleder R, Stark DD, Engelstad BL, Bacon BR, Compton CC, White DL, Jacobs P, Lewis J, American Journal of Roentgenology 1989, 152, 167. [DOI] [PubMed] [Google Scholar]
- [35].Alipour A, Soran-Erdem Z, Utkur M, Sharma VK, Algin O, Saritas EU, Demir HV, Magnetic Resonance Imaging 2018, 49, 16. [DOI] [PubMed] [Google Scholar]
- [36].Jung H, Park B, Lee C, Cho J, Suh J, Park J, Kim Y, Kim J, Cho G, Cho H, Nanomedicine: Nanotechnology, Biology and Medicine 2014, 10, 1679. [DOI] [PubMed] [Google Scholar]
- [37].Tao C, Zheng Q, An L, He M, Lin J, Tian Q, Yang S, Nanomaterials 2019, 9, 170. [DOI] [PMC free article] [PubMed] [Google Scholar]
- [38].Wei H, Bruns OT, Kaul MG, Hansen EC, Barch M, Wiśniowska A, Chen O, Chen Y, Li N, Okada S, Cordero JM, Heine M, Farrar CT, Montana DM, Adam G, Ittrich H, Jasanoff A, Nielsen P, Bawendi MG, Proceedings of the National Academy of Sciences 2017, 114, 2325. [DOI] [PMC free article] [PubMed] [Google Scholar]
- [39].Bashir MR, Bhatti L, Marin D, Nelson RC, Journal of Magnetic Resonance Imaging 2015, 41, 884. [DOI] [PubMed] [Google Scholar]
- [40].Ersoy H, Jacobs P, Kent CK, Prince MR, American Journal of Roentgenology 2004, 182, 1181. [DOI] [PubMed] [Google Scholar]
- [41].Motomura K, Ishitobi M, Komoike Y, Koyama H, Noguchi A, Sumino H, Kumatani Y, Inaji H, Horinouchi T, Nakanishi K, Annals of Surgical Oncology 2011, 18, 3422. [DOI] [PubMed] [Google Scholar]
- [42].McBride OMB, Joshi NV, Robson JMJ, MacGillivray TJ, Gray CD, Fletcher AM, Dweck MR, van Beek EJR, Rudd JHF, Newby DE, Semple SI, Eur J Vasc Endovasc Surg 2016, 51, 518. [DOI] [PMC free article] [PubMed] [Google Scholar]
- [43].Yilmaz A, Dengler MA, van der Kuip H, Yildiz H, Rösch S, Klumpp S, Klingel K, Kandolf R, Helluy X, Hiller K-H, Jakob PM, Sechtem U, European Heart Journal 2012, 34, 462. [DOI] [PubMed] [Google Scholar]
- [44].Gaglia JL, Harisinghani M, Aganj I, Wojtkiewicz GR, Hedgire S, Benoist C, Mathis D, Weissleder R, Proceedings of the National Academy of Sciences 2015, 112, 2139. [DOI] [PMC free article] [PubMed] [Google Scholar]
- [45].Nasseri M, Gahramanov S, Netto JP, Fu R, Muldoon LL, Varallyay C, Hamilton BE, Neuwelt EA, Neuro Oncol 2014, 16, 1146. [DOI] [PMC free article] [PubMed] [Google Scholar]
- [46].Lu J, Sun J, Li F, Wang J, Liu J, Kim D, Fan C, Hyeon T, Ling D, Journal of the American Chemical Society 2018, 140, 10071. [DOI] [PubMed] [Google Scholar]
- [47].Li F, Liang Z, Liu J, Sun J, Hu X, Zhao M, Liu J, Bai R, Kim D, Sun X, Hyeon T, Ling D, Nano Letters 2019, 19, 4213. [DOI] [PubMed] [Google Scholar]
- [48].Kim BH, Lee N, Kim H, An K, Park YI, Choi Y, Shin K, Lee Y, Kwon SG, Na HB, Park J-G, Ahn T-Y, Kim Y-W, Moon WK, Choi SH, Hyeon T, Journal of the American Chemical Society 2011, 133, 12624. [DOI] [PubMed] [Google Scholar]
- [49].Lu Y, Xu Y-J, Zhang G.-b., Ling D, Wang M.-q., Zhou Y, Wu Y-D, Wu T, Hackett MJ, Hyo Kim B, Chang H, Kim J, Hu X-T, Dong L, Lee N, Li F, He J-C, Zhang L, Wen H-Q, Yang B, Hong Choi S, Hyeon T, Zou D-H, Nature Biomedical Engineering 2017, 1, 637. [DOI] [PubMed] [Google Scholar]
- [50].Shen Z, Chen T, Ma X, Ren W, Zhou Z, Zhu G, Zhang A, Liu Y, Song J, Li Z, Ruan H, Fan W, Lin L, Munasinghe J, Chen X, Wu A, ACS Nano 2017, 11, 10992. [DOI] [PubMed] [Google Scholar]
- [51].Tao C, Zheng Q, An L, He M, Lin J, Tian Q, Yang S, Nanomaterials (Basel) 2019, 9, 170. [DOI] [PMC free article] [PubMed] [Google Scholar]
- [52].Hope MD, Hope TA, Zhu C, Faraji F, Haraldsson H, Ordovas KG, Saloner D, AJR Am J Roentgenol 2015, 205, W366. [DOI] [PMC free article] [PubMed] [Google Scholar]
- [53].E. Berry, A. J. Bulpitt, 2009.
- [54].Hanson LG, Concepts in Magnetic Resonance Part A 2008, 32A, 329. [Google Scholar]
- [55].Goldman M, Journal of Magnetic Resonance 2001, 149, 160. [DOI] [PubMed] [Google Scholar]
- [56].Park J, An K, Hwang Y, Park J-G, Noh H-J, Kim J-Y, Park J-H, Hwang N-M, Hyeon T, Nature Materials 2004, 3, 891. [DOI] [PubMed] [Google Scholar]
- [57].Mascolo MC, Pei Y, Ring TA, Materials (Basel) 2013, 6, 5549. [DOI] [PMC free article] [PubMed] [Google Scholar]
- [58].Kayani ZN, Arshad S, Riaz S, Naseem S, IEEE Transactions on Magnetics 2014, 50, 1. [Google Scholar]
- [59].Narayanan KB, Sakthivel N, Advances in Colloid and Interface Science 2011, 169, 59. [DOI] [PubMed] [Google Scholar]
- [60].Abhilash, Revati K, Pandey BD, Bulletin of Materials Science 2011, 34, 191. [Google Scholar]
- [61].Salazar-Alvarez G, Muhammed M, Zagorodni AA, Chemical Engineering Science 2006, 61, 4625. [Google Scholar]
- [62].Jiao M, Zeng J, Jing L, Liu C, Gao M, Chemistry of Materials 2015, 27, 1299. [Google Scholar]
- [63].A. Khandhar P, Wilson GJ, Kaul MG, Salamon J, Jung C, Krishnan KM, Journal of Biomedical Materials Research Part A 2018, 106, 2440. [DOI] [PubMed] [Google Scholar]
- [64].Tromsdorf UI, Bruns OT, Salmen SC, Beisiegel U, Weller H, Nano Letters 2009, 9, 4434. [DOI] [PubMed] [Google Scholar]
- [65].Kucheryavy P, He J, John VT, Maharjan P, Spinu L, Goloverda GZ, Kolesnichenko VL, Langmuir 2013, 29, 710. [DOI] [PMC free article] [PubMed] [Google Scholar]
- [66].Chen L, Xie J, Wu H, Li J, Wang Z, Song L, Zang F, Ma M, Gu N, Zhang Y, Journal of Nanomaterials 2018, 2018, 9. [Google Scholar]
- [67].Baaziz W, Pichon BP, Fleutot S, Liu Y, Lefevre C, Greneche J-M, Toumi M, Mhiri T, Begin-Colin S, The Journal of Physical Chemistry C 2014, 118, 3795. [Google Scholar]
- [68].Daou TJ, Grenèche JM, Pourroy G, Buathong S, Derory A, Ulhaq-Bouillet C, Donnio B, Guillon D, Begin-Colin S, Chemistry of Materials 2008, 20, 5869. [Google Scholar]
- [69].Daou TJ, Greneche J-M, Lee S-J, Lee S, Lefevre C, Bégin-Colin S, Pourroy G, The Journal of Physical Chemistry C 2010, 114, 8794. [Google Scholar]
- [70].Linderoth S, Hendriksen PV, Bo/dker F, Wells S, Davies K, Charles SW, Morup S, Journal of Applied Physics 1994, 75, 6583. [Google Scholar]
- [71].Pereira AM, Pereira C, Silva AS, Schmool DS, Freire C, Grenèche J-M, Araújo JP, Journal of Applied Physics 2011, 109, 114319. [Google Scholar]
- [72].Mohapatra J, Mitra A, Tyagi H, Bahadur D, Aslam M, Nanoscale 2015, 7, 9174. [DOI] [PubMed] [Google Scholar]
- [73].Macher T, Totenhagen J, Sherwood J, Qin Y, Gurler D, Bolding MS, Bao Y, Advanced Functional Materials 2015, 25, 490. [Google Scholar]
- [74].Rohrer M, Bauer H, Mintorovitch J, Requardt M, Weinmann H-J, Invest Radiol 2005, 40, 715. [DOI] [PubMed] [Google Scholar]
- [75].Yang L, Wang Z, Ma L, Li A, Xin J, Wei R, Lin H, Wang R, Chen Z, Gao J, ACS Nano 2018, 12, 4605. [DOI] [PubMed] [Google Scholar]
- [76].Dar MI, Shivashankar SA, RSC Advances 2014, 4, 4105. [Google Scholar]
- [77].Park JC, Lee GT, Kim H-K, Sung B, Lee Y, Kim M, Chang Y, Seo JH, ACS Applied Materials & Interfaces 2018, 10, 25080. [DOI] [PubMed] [Google Scholar]
- [78].Han G, Deng Y, Sun J, Ling J, Shen Z, Exp Ther Med 2015, 9, 1561. [DOI] [PMC free article] [PubMed] [Google Scholar]
- [79].Peng Y-K, Liu C-L, Chen H-C, Chou S-W, Tseng W-H, Tseng Y-J, Kang C-C, Hsiao J-K, Chou P-T, Journal of the American Chemical Society 2013, 135, 18621. [DOI] [PubMed] [Google Scholar]
- [80].Morales MP, Veintemillas-Verdaguer S, Montero MI, Serna CJ, Roig A, Casas L, Martínez B, Sandiumenge F, Chemistry of Materials 1999, 11, 3058. [Google Scholar]
- [81].Chia CH, Zakaria S, Yusoff M, Goh SC, Haw CY, Ahmadi S, Huang NM, Lim HN, Ceramics International 2010, 36, 605. [Google Scholar]
- [82].Shatooti S, Mozaffari M, Journal of Materials Science: Materials in Electronics 2019. [Google Scholar]
- [83].Costo R, Bello V, Robic C, Port M, Marco JF, Puerto Morales M, Veintemillas-Verdaguer S, Langmuir 2012, 28, 178. [DOI] [PubMed] [Google Scholar]
- [84].Li D, Teoh WY, Selomulya C, Woodward RC, Munroe P, Amal R, Journal of Materials Chemistry 2007, 17, 4876. [Google Scholar]
- [85].Chen F, Gao W, Qiu X, Zhang H, Liu L, Liao P, Fu W, Luo Y, Graphene quantum dots in biomedical applications: Recent advances and future challenges, 2018. [Google Scholar]
- [86].Caravan P, Chemical Society reviews 2006, 35, 512. [DOI] [PubMed] [Google Scholar]
- [87].Caravan P, Farrar CT, Frullano L, Uppal R, Contrast Media Mol Imaging 2009, 4, 89. [DOI] [PMC free article] [PubMed] [Google Scholar]
- [88].Lavalette D, Tétreau C, Tourbez M, Blouquit Y, Biophys J 1999, 76, 2744. [DOI] [PMC free article] [PubMed] [Google Scholar]
- [89].LaConte LEW, Nitin N, Zurkiya O, Caruntu D, O’Connor CJ, Hu X, Bao G, Journal of Magnetic Resonance Imaging 2007, 26, 1634. [DOI] [PubMed] [Google Scholar]
- [90].Hajesmaeelzadeh F, Shanehsazzadeh S, Grüttner C, Daha FJ, Oghabian MA, Iran J Basic Med Sci 2016, 19, 166. [PMC free article] [PubMed] [Google Scholar]
- [91].Tong S, Hou S, Zheng Z, Zhou J, Bao G, Nano Letters 2010, 10, 4607. [DOI] [PMC free article] [PubMed] [Google Scholar]
- [92].Dumas S, Jacques V, Sun W-C, Troughton JS, Welch JT, Chasse JM, Schmitt-Willich H, Caravan P, Invest Radiol 2010, 45, 600. [DOI] [PMC free article] [PubMed] [Google Scholar]
- [93].Zeng J, Jing L, Hou Y, Jiao M, Qiao R, Jia Q, Liu C, Fang F, Lei H, Gao M, Advanced Materials 2014, 26, 2694. [DOI] [PubMed] [Google Scholar]
- [94].Smolensky ED, Park H-YE, Berquó TS, Pierre VC, Contrast Media Mol Imaging 2011, 6, 189. [DOI] [PMC free article] [PubMed] [Google Scholar]
- [95].Palma SICJ, Marciello M, Carvalho A, Veintemillas-Verdaguer S, Morales M. d. P., Roque ACA, Journal of Colloid and Interface Science 2015, 437, 147. [DOI] [PubMed] [Google Scholar]
- [96].Herea DD, Chiriac H, One-step preparation and surface activation of magnetic iron oxide nanoparticles for bio-medical applications, Vol. 2, 2008. [Google Scholar]
- [97].Costo R, Morales MP, Veintemillas-Verdaguer S, Journal of Applied Physics 2015, 117, 064311. [Google Scholar]
- [98].Nagesha DK, Plouffe BD, Phan M, Lewis LH, Sridhar S, Murthy SK, Journal of Applied Physics 2009, 105, 07B317. [Google Scholar]
- [99].Hannecart A, Stanicki D, Vander Elst L, Muller RN, Lecommandoux S, Thévenot J, Bonduelle C, Trotier A, Massot P, Miraux S, Sandre O, Laurent S, Nanoscale 2015, 7, 3754. [DOI] [PubMed] [Google Scholar]
- [100].Nadeem M, Ahmad M, Akhtar MS, Shaari A, Riaz S, Naseem S, Masood M, Saeed MA, PLoS One 2016, 11, e0158084. [DOI] [PMC free article] [PubMed] [Google Scholar] [Retracted]
- [101].Yin X, Russek SE, Zabow G, Sun F, Mohapatra J, Keenan KE, Boss MA, Zeng H, Liu JP, Viert A, Liou S-H, Moreland J, Sci Rep 2018, 8, 11863. [DOI] [PMC free article] [PubMed] [Google Scholar]
- [102].Gizzatov A, Key J, Aryal S, Ananta J, Cervadoro A, Palange AL, Fasano M, Stigliano C, Zhong M, Di Mascolo D, Guven A, Chiavazzo E, Asinari P, Liu X, Ferrari M, Wilson LJ, Decuzzi P, Advanced functional materials 2014, 24, 4584. [DOI] [PMC free article] [PubMed] [Google Scholar]
- [103].Smith CE, Lee J, Seo Y, Clay N, Park J, Shkumatov A, Ernenwein D, Lai M-H, Misra S, Sing CE, Andrade B, Zimmerman SC, Kong H, ACS Applied Materials & Interfaces 2017, 9, 1219. [DOI] [PMC free article] [PubMed] [Google Scholar]
- [104].Hak S, Goa PE, Stenmark S, Bjerkholt FF, Haraldseth O, Magnetic Resonance in Medicine 2015, 74, 858. [DOI] [PubMed] [Google Scholar]
- [105].Wang L, Huang J, Chen H, Wu H, Xu Y, Li Y, Yi H, Wang YA, Yang L, Mao H, ACS Nano 2017, 11, 4582. [DOI] [PMC free article] [PubMed] [Google Scholar]
- [106].Sherwood J, Rich M, Lovas K, Warram J, Bolding MS, Bao Y, Nanoscale 2017, 9, 11785. [DOI] [PubMed] [Google Scholar]
- [107].Roch A, Gossuin Y, Muller RN, Gillis P, Journal of Magnetism and Magnetic Materials 2005, 293, 532. [Google Scholar]
- [108].Serkova NJ, Frontiers in Immunology 2017, 8. [DOI] [PMC free article] [PubMed] [Google Scholar]
- [109].Bai J, Wang JTW, Rubio N, Protti A, Heidari H, Elgogary R, Southern P, Al-Jamal WT, Sosabowski J, Shah AM, Bals S, Pankhurst QA, Al-Jamal KT, Theranostics 2016, 6, 342. [DOI] [PMC free article] [PubMed] [Google Scholar]
- [110].Wan F, Wang L, Xu W, Li C, Li Y, Zhang C, Jiang L, Polyhedron 2018, 145, 141. [Google Scholar]
- [111].Mastrogiacomo S, Dou W, Jansen JA, Walboomers XF, Molecular Imaging and Biology 2019. [DOI] [PubMed] [Google Scholar]
- [112].Tao C, Chen Y, Wang D, Cai Y, Zheng Q, An L, Lin J, Tian Q, Yang S, Nanomaterials (Basel) 2019, 9, 699. [DOI] [PMC free article] [PubMed] [Google Scholar]
- [113].Hu F, Jia Q, Li Y, Gao M, Nanotechnology 2011, 22, 245604. [DOI] [PubMed] [Google Scholar]
- [114].Vangijzegem T, Stanicki D, Boutry S, Paternoster Q, Vander Elst L, Muller RN, Laurent S, Nanotechnology 2018, 29, 265103. [DOI] [PubMed] [Google Scholar]
- [115].Taboada E, Rodríguez E, Roig A, Oró J, Roch A, Muller RN, Langmuir 2007, 23, 4583. [DOI] [PubMed] [Google Scholar]
- [116].Ta HT, Li Z, Wu Y, Cowin G, Zhang S, Yago A, Whittaker AK, Xu ZP, Materials Research Express 2017, 4, 116105. [Google Scholar]