Abstract
We characterize a new water soluble fluorescent probe sensitive to changes in pH. The new probe shows spectral shifts and intensity changes in different pH media, in a wavelength ratiometric and colorimetric manner. Subsequently, changes in pH can readily be determined around the physiological level. The new probe’s response is based on the ability of the boronic acid group to interact with strong bases like OH−, changing from the neutral form of the boronic acid group [R-B(OH)2] to the anionic R-B−(OH)3 form, which is an electron donating group. The presence of an electron deficient quaternary heterocyclic nitrogen center and a strong electron donating amino group in the 6-position, on the quinolinium backbone, provides for the spectral changes observed upon OH− complexation. In addition, the presence of the amino group in the 6-position of the quinolinium backbone, suppresses the response of the boronic acid containing probe towards mono saccharides such as glucose and fructose, which are present in many biological fluids, allowing for the predominant pH sensitivity. Finally we compare our findings to those of a control compound that does not contain the boronic acid group.
Keywords: Ratiometric pH sensor, Suppressed sugar response, Boronic acid
1. Introduction
It is widely accepted that ratiometric or lifetime based methods offer intrinsic advantages for both chemical and biomedical fluorescence sensing [1,2]. Fluorescence intensity measurements are typically unreliable outside the laboratory and can require frequent calibration/s due to a variety of chemical, optical or other instrumental related factors. Unfortunately, while fluorescent probes are known to be useful for many applications such as in fluorescence microscopy, fluorescing sensing and DNA technology, most sensing fluorophores only display changes in intensity in response to analytes and hence relatively few wavelength ratiometric probes are available today [1,2]. Some useful wavelength ratiometric probes are available for pH, Ca2+ and Mg2+ [3,4], but the probes for Na+ and K+ generally display small spectral shifts and negligible lifetime changes and are subsequently inadequate for quantitive sensing measurements [2].
The requirements of pH sensing have driven the development of several notable dyes in the past such as fluorescein [5–8], HPTS (1-hydroxypyrene-3,6,8-trisulfonate) [9–12], SNAFL (seminaphthofluoresceins) [1,13] and the SNARF (seminaphthorhodafluors) [1,13] pH probes. While these four probes are widely used and amongst the main pH probes today, they were historically developed due to the requirement for visible wavelength excitation, noting the expense and complexity of past UV excitation sources [1]. However, blue and UV, laser diode and light emitting diode sources are now readily available, allowing the possibility of using ratiometric probes at shorter wavelengths, which was previously not considered practical [1].
In this paper we characterize a new boronic acid containing quinolinium pH probe, which shows spectral shifts and intensity changes as a function of pH, in both a ratiometric and colorimetric manner, enabling pH to be sensed at near-physiological levels. The new probe BAQBA (Fig. 1), is readily water soluble, has a high quantum yield, is simple to synthesize, and works in both an excitation and fluorescence ratiometric manner. It is worth noting that both fluorescein and HPTS can only be used in an excitation wavelength ratiometric manner, with only one emission band observed at ≈510 nm [1]. With an isobestic point at 358 nm this new probe can be readily used in a fluorescence ratiometric manner using a simple UV LED for excitation.
Fig. 1.
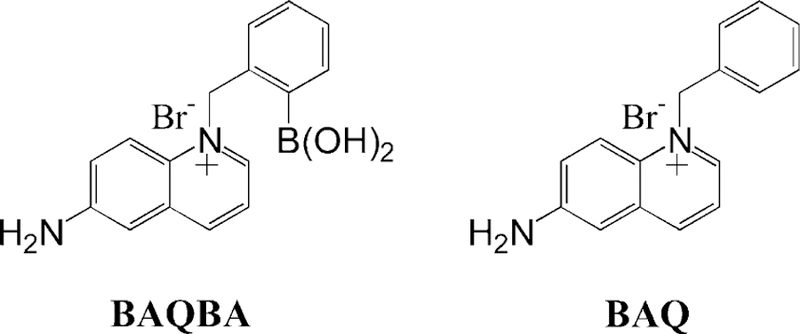
Molecular structure of BAQBA (N-(2-boronobenzyl)-6-aminoquinolinium bromide) (left) and the control compound without the boronic acid moiety N-(benzyl)-6-aminoquinolinium bromide (right).
One important additional feature of this probe is that the affinity of the boronic acid group for monosachharides, such as for glucose and fructose, is similar to that of common boronic acid containing fluorophores, BAFs [14–16], but substantially less than for the BAFs produced by the addition of weaker electron donating groups, or indeed electron withdrawing groups in the 6-position on the quinolinium backbone [17]. Hence, the use of an amino group in the 6-position here is unique and suppresses the sugar response of this probe, enabling it to be of practical use for pH sensing in physiological fluids. Further details of the sugar affinity of BAQBA can be found elsewhere [17].
2. Experimental
2.1. Materials
All chemicals were purchased from Sigma at the highest purity available. The preparation of BAQBA and BAQ (Fig. 1) has recently been reported by us [17].
2.2. Methods
All solution absorption measurements were performed in a 4*1*1 cm quartz cuvette (Starna), using a Cary 50 Spectrophotometer from Varian. Fluorescence spectra were similarly collected on a Varian Eclipse spectrofluorometer with solution optical densities less than 0.2 and λex=358 nm.
Stability (KS/units mM−1) and Dissociation constants (KD) were obtained by fitting the titration curves with sugar to the relation:
| (1) |
where Imin and Imax are the initial (no sugar) and final (plateau) fluorescence intensities of the titration curves, where KD=(1/KS).
Time-resolved intensity decays were measured using reverse start-stop time-correlated single-photon counting (TCSPC) with a Becker and Hickl gmbh 630 SPC PC card and a un-amplifed MCP-PMT. Vertically polarized excitation at ≈372 nm was obtained using a pulsed LED source (1 MHz repetition rate) and a dichroic sheet polarizer. The instrumental response function was ≈1.1 ns fwhm. The emission was collected at the magic angle (54.7°), using a long pass filter (Edmund Scientific), which cut off wavelengths below 380 nm. The use of a pulsed 372 nm LED provided for excitation near-to the isobestic point at 358 nm (Fig. 2).
Fig. 2.
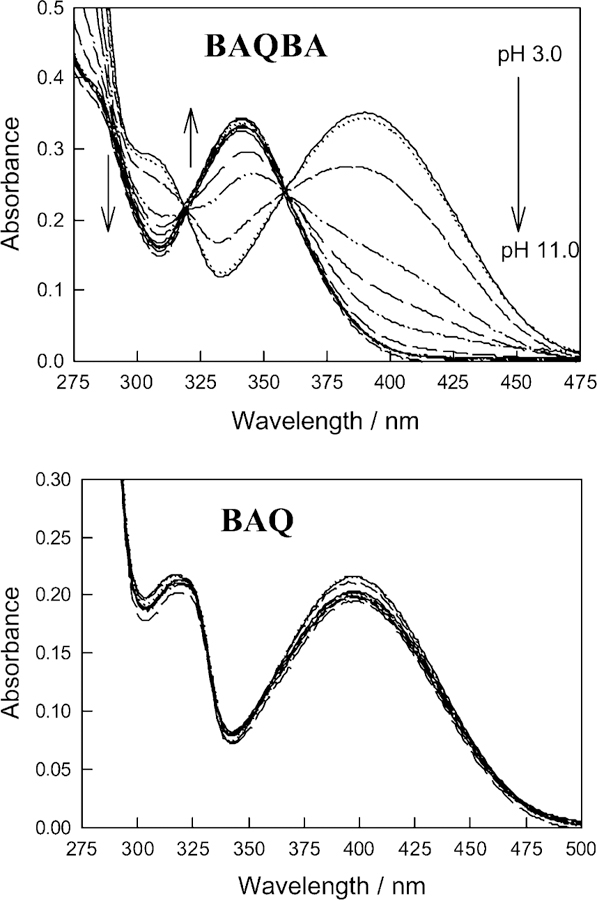
Absorption spectrum of both BAQBA and BAQ with increasing pH, top and bottom respectively.
The intensity decays were analyzed in terms of the multi-exponential model:
| (2) |
where αi are the amplitudes and τi the decay times, Σαi=1.0. The fractional contribution of each component to the steady-state intensity is given by:
| (3) |
The mean lifetime of the excited state is given by:
| (4) |
and the amplitude-weighted lifetime is given by:
| (5) |
The values of αi and τi were determined by non-linear least squares impulse reconvolution with a goodness-of-fit criterion.
3. Results and discussion
Fig. 2 shows the change in absorbance for both BAQBA (top) and BAQ (bottom) as a function of pH. As the pH increases the absorption band at 388 nm decreases (for BAQBA), while the band at 340 increases. We can see significant changes in both the bands as the pH is altered. In contrast, BAQ shows a slight decrease in absorption as the pH is increased, which is attributed to the lack of a boronic acid group (Fig. 1) which is well known to complex strong bases such as the hydroxyl ion [18]. Subsequently, Fig. 3 shows the absorbance wavelength ratiometric plots for both BAQBA and BAQ based on the A340/A388 nm bands. We were able to determine the pKa for BAQBA to be ≈6.3, which is appropriate for near-physiological pH measurements. In contrast, BAQ, shows no or little response to changes in pH, where the small changes observed are attributed to the known quenching of the quinolinium nucleus by the hydroxyl ion at high pH [19].
Fig. 3.
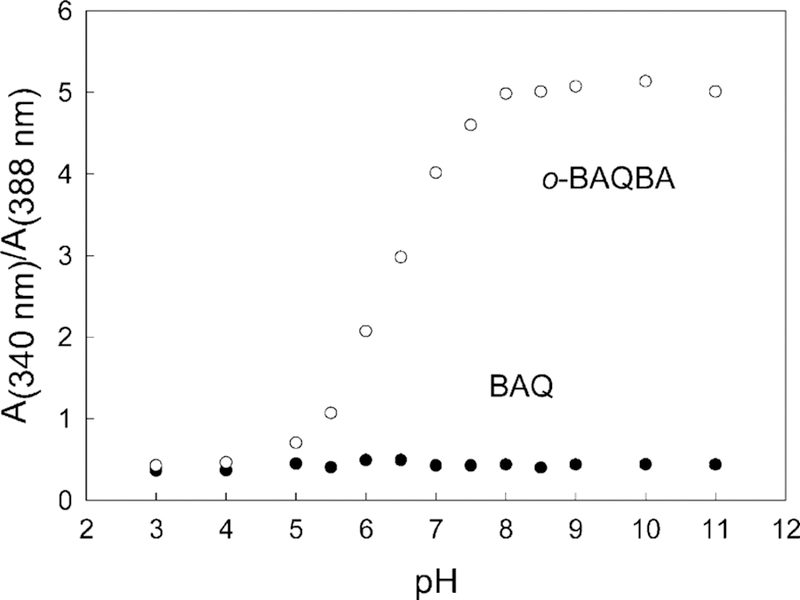
Wavelength ratiometric plots for both BAQBA and BAQ based on the A340/A388 nm bands in Fig. 2.
The fluorescence emission of BAQBA shows similar wavelength ratiometric behavior (Fig. 4 top), where λex=358 nm, i.e. at the isobestic point and the pKa≈5.85. As the pH increases we typically see a decrease in fluorescence intensity of the 546 nm band, which is the uncomplexed form, while the band at 450 nm increases (complexed form). In contrast, BAQ shows a simple decrease in fluorescence intensity as the pH is increased (Fig. 4 bottom).
Fig. 4.
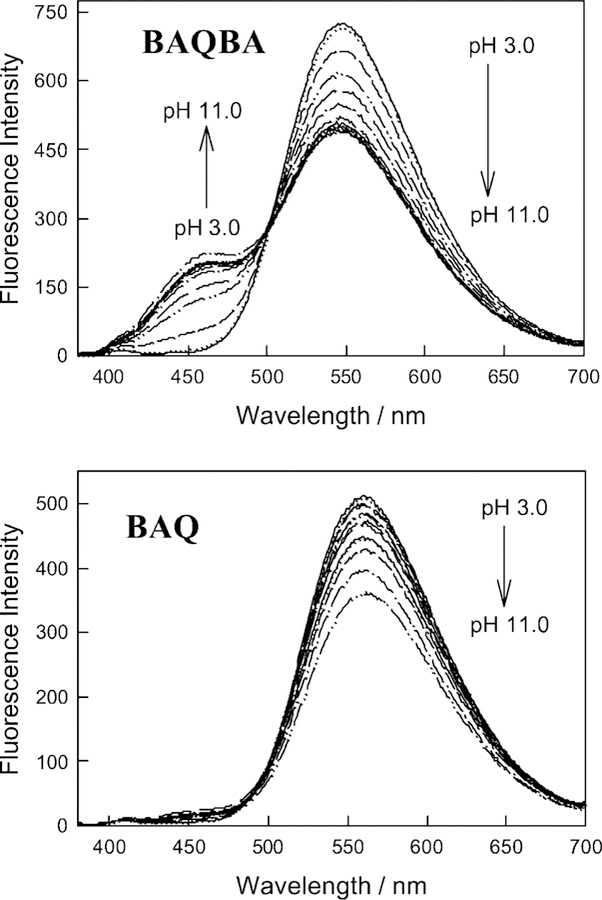
Fluorescence emission spectra of BAQBA and BAQ with increasing pH, top and bottom respectively.
For the data shown in Fig. 4 we constructed the fluorescence emission ratiometric response (Fig. 5). It is interesting to compare the dynamic sensing range towards pH shown in both Figs. 3 and 5. Clearly a greater change is observed for the ratiometric absorption measurements, reflecting the differences in extinction coefficients and quantum yields of the OH− unbound and bound forms respectively.
Fig. 5.
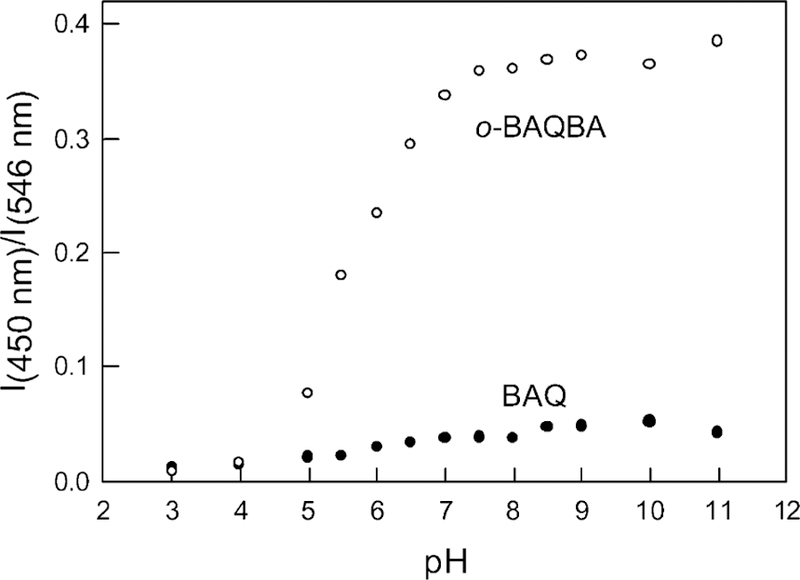
Fluorescence emission wavelength ratiometric plots for both BAQBA and BAQ based on the I450/I546 nm bands in Fig. 4.
We additionally measured the lifetime/s for both BAQBA and BAQ as a function of pH (Fig. 6 and Table 1), using the time-correlated single-photon timing technique and the multiexponential model [1] [Eqs (2)–(5)]. Our analysis shows that both the mean and amplitude weighted lifetime of BAQ are typically reduced as the pH increases (Fig. 6 top and bottom respectively), while BAQBA shows an increase in the mean lifetime as the pH increases. Table 1 also shows that the BAQBA data is well described by a triple exponential decay function above pH 5.5. Intuitively, this suggests that the additional ≈0.3 ns component is the lifetime of the complexed OH− form, evident by the emission band at 450 nm, above pH 5.5, in Fig. 4. A comparison of both the BAQ and BAQBA data in Table 1, reveals that this short lived component is not present for BAQ as the pH increases, which is expected as BAQ doesn’t form a boronate complex with hydroxyl ions.
Fig. 6.
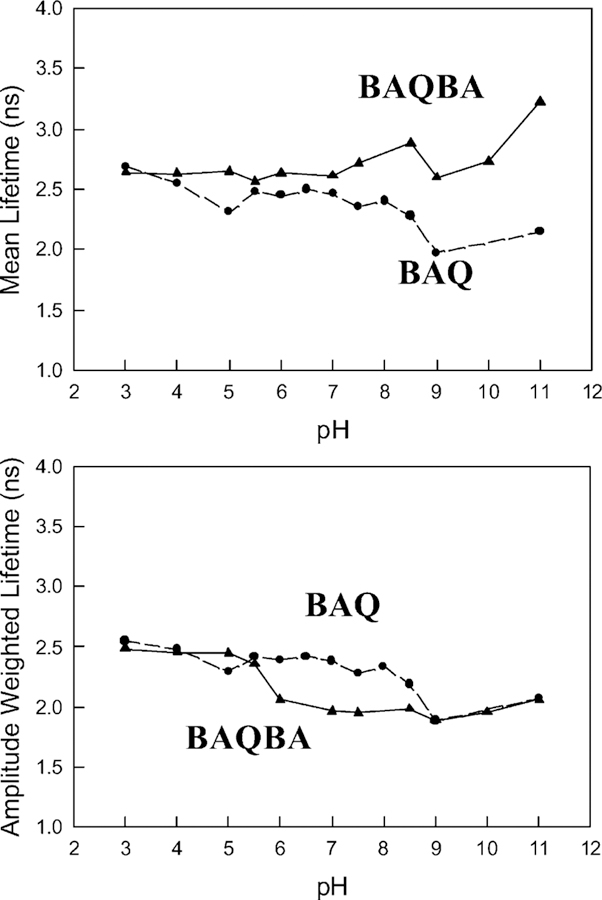
Mean fluorescence lifetime for BAQBA (▲) and BAQ (●) with increasing pH (top) and the amplitude weighted life-time/s (bottom).
Table 1.
Multiexponential Intensity decay of BAQ and BAQBA
| pH | τ1 (ns) | α1 | τ2 (ns) | α2 | τ3 (ns) | α3 | χ2 |
|---|---|---|---|---|---|---|---|
| BAQ | |||||||
| 3a | 2.47 | 0.98 | 6.99 | 0.02 | – | – | 1.15 |
| 4a | 2.33 | 0.89 | 3.66 | 0.11 | – | – | 1.06 |
| 5b | 2.16 | 0.63 | 2.53 | 0.37 | – | – | 1.03 |
| 5.5b | 2.15 | 0.69 | 3.01 | 0.31 | – | – | 1.02 |
| 6b | 2.22 | 0.81 | 3.13 | 0.19 | – | – | 1.10 |
| 6.5b | 2.24 | 0.85 | 3.44 | 0.15 | – | – | 1.08 |
| 7b | 2.17 | 0.81 | 3.30 | 0.19 | – | – | 1.03 |
| 7.5b | 2.05 | 0.76 | 2.99 | 0.24 | – | – | 1.03 |
| 8b | 2.13 | 0.79 | 3.12 | 0.21 | – | – | 1.07 |
| 8.5b | 1.99 | 0.83 | 3.16 | 0.17 | – | – | 1.14 |
| 9b | 1.71 | 0.84 | 2.83 | 0.16 | – | – | 1.03 |
| 11c | 1.79 | 0.66 | 2.62 | 0.34 | – | – | 1.16 |
| BAQBA | |||||||
| 3a | 2.06 | 0.68 | 3.40 | 0.32 | – | – | 1.06 |
| 4a | 2.03 | 0.69 | 3.44 | 0.31 | – | – | 1.02 |
| 5b | 1.97 | 0.69 | 3.52 | 0.31 | – | – | 1.18 |
| 5.5b | 1.24 | 0.28 | 2.79 | 0.72 | – | – | 1.52d |
| 6b | 1.79 | 0.51 | 0.18 | 0.16 | 3.38 | 0.33 | 0.99 |
| 7b | 1.73 | 0.49 | 0.22 | 0.19 | 3.41 | 0.32 | 1.03 |
| 7.5b | 1.93 | 0.61 | 0.29 | 0.22 | 4.25 | 0.17 | 1.10 |
| 8.5b | 1.94 | 0.61 | 0.29 | 0.23 | 4.63 | 0.16 | 1.15 |
| 9b | 1.76 | 0.52 | 0.27 | 0.25 | 3.59 | 0.23 | 1.22 |
| 10c | 1.89 | 0.51 | 0.27 | 0.25 | 3.77 | 0.24 | 1.03 |
| 11c | 1.97 | 0.59 | 0.27 | 0.25 | 5.22 | 0.16 | 1.13 |
Acetate buffer.
Phosphate buffer.
Carbonate buffer.
A triple exponential function could not describe this data set well.
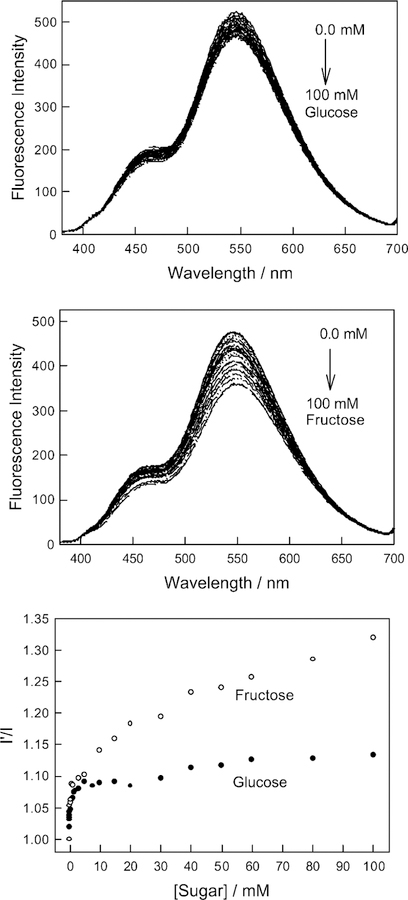
The affinity of boronic acid for diols is well-known [14–16]. Subsequently, we tested the response of BAQBA towards both glucose and fructose. No response was observed, as expected, for BAQ (data not shown). A comparison of Fig. 7 top and middle, shows a similar affinity of BAQBA for both fructose and glucose. While the emission spectra of BAQBA show similar bands, as in the presence of OH−, i.e. at 450 and 546 nm, the bands do not show increasing and decreasing intensities in the presence of sugar, but instead simply show an overall decrease as sugar concentration increases. Subsequently, Fig. 7 bottom shows the response curves to sugars normalized by the response of BAQBA in the absence of sugar, I′. Using Eq. (1), we were able to determine the binding (stability) constants to be ≈1.04 and ≈0.06 mM−1 for glucose and fructose respectively. In contrast these binding constants can be tuned much higher by replacing the 6-amino group to a less efficient electron donating group, or indeed, electron withdrawing groups as mentioned earlier [17].
Fig. 7.
Response of BAQBA to both glucose (top), fructose (middle) and the ratio plot in the absence of sugar, I′, and in the presence of sugar, I (bottom).
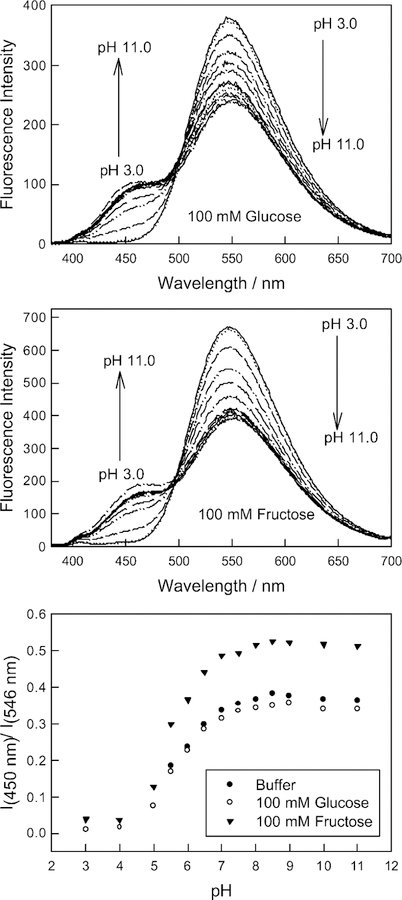
With a slight sugar response evident, (relevant to similar structures but with different substituents [17]), we tested the ability of BAQBA to sense pH in the presence of 50 mM glucose and 50 mM fructose (Fig. 8 top and middle respectively). As we can see the boronic acid containing quinolinium type fluorophore responds well towards pH in the presence of the sugar interferents (Fig. 8 bottom shows the respective ratiometric plot from the 546 and 450 nm bands, where we can see that 50 mM glucose has little effect on the probe’s overall response to pH, by comparing with the buffer (no sugar) titration curve. While a 50 mM fructose background has an effect, as shown in Fig. 8 bottom, it should be noted that fructose levels in blood are typically 10→100 fold lower for a healthy person than used here, hence BAQBA is likely to be suitable for physiological pH measurements.
Fig. 8.
Fluorescence emission spectra for BAQBA with increasing pH in the presence of 100 mM glucose (top), 100 mM fructose (middle) and the fluorescence emission wavelength ratiometric plots based on the I450/I546 nm bands (bottom).
4. Conclusions
We have characterized a new water-soluble probe, BAQBA, with regard to pH. This new probe responds well to pH changes around 7. In addition we have shown that the pH can readily be determined in a background of 50 mM sugar allowing its potential use in physiological measurements in both an excitation and emission ratiometric manner.
Acknowledgements
This work was supported by the National Center for Research Resources, RR-08119. Partial salary support to J.R.L. from UMBI is also gratefully acknowledged.
Nomenclature
- BA
boronic acid
- BAF and BAFs
boronic acid containing fluorophore/s
- BAQ
N-benzyl-6-aminoquinolinium
- BAQBA
N-(2-boronobenzyl)-6-aminoquinolinium bromide
- HPTS
1-hydroxypyrene-3,6,8-trisulfonate
- LED
light emitting diode
- SNAFL
seminaphthofluoresceins
- SNARF
seminaphthorhodafluors
- TCSPC
time-correlated single photon counting
References
- [1].Lakowicz JR. Principles of fluorescence spectroscopy. 2nd ed. New York: Kluwer/Academic Plenum Publishers; 1997. [Google Scholar]
- [2].Gryczynski Z, Gryczynski I, Lakowicz JR. Fluorescence sensing methods. Methods in Enzymology 2002;360:44–75. [DOI] [PubMed] [Google Scholar]
- [3].Tsien RY, Rink TJ, Poenie M. Cell Calcium 1985;6:145. [DOI] [PubMed] [Google Scholar]
- [4].Kao JPY. Methods Cell Biol 1994;40:155. [DOI] [PubMed] [Google Scholar]
- [5].Ohkuma S, Poole B. Fluorescence probe measurement of the intralysosomal pH in living cells and the perturbation of pH by vaious agents. Proc Nat Acad Sci USA 1978;5: 3327–31. [DOI] [PMC free article] [PubMed] [Google Scholar]
- [6].Thomas JA, Buchsbaum RN, Zimmiak A, Racker E. Intracellular pH measurements in Ehrlich asciles tumor cells utilizing spectroscopic probes generated in situ. Biochemistry 1979;18:2210–8. [DOI] [PubMed] [Google Scholar]
- [7].Munkholm C, Walt DR, Milanovich FP. A fiber-optic sensor for CO2 measurement. Talanta 1988;35(2):109–12. [DOI] [PubMed] [Google Scholar]
- [8].Kawabata Y, Kamichika T, Imasaka T, Ishibashi N. Fiber-optic sensor for carbon dioxide with a pH indicator dispersed in a poly(ethyleneglycol) membrane. Anal Chem Acta 1989;219:223–9. [Google Scholar]
- [9].Clement NR, Gould JM. Pyranine (8-hydroxy-1,3,6-pyrenetrisulfonate) as a probe of internal aqueous hydrogen ion concentration in phospholipids vesicles. Biochemistry 1981;20:1534–8. [DOI] [PubMed] [Google Scholar]
- [10].Wolfbeis OS, Furlinger E, Kroneis H, Marsoner M. Fluorimetric analysis 1. A study of fluorescent indicators for measuring near neutral, physiological, pH values. Fresenius Z Anal Chem 1983;314:119–24. [Google Scholar]
- [11].Schulman SG, Chen S, Bai F, Leiner MJP, Weis L, Wolfbeis OS. Dependence of the fluorescence of immobilized 1-hydroxypyrene-3,6,8-trisulfonate on sodium pH: extension of the range of applicability of a pH fluorosensor. Anal Chim, Acta 1995;304:165–70. [Google Scholar]
- [12].Zhujun H, Seitz WR. A fluorescence sensor for quantifying pH in the range from 6.5 to 8.5. Anal Chem Acta 1984;160:47–55. [Google Scholar]
- [13].Whitaker JE, Haugland RP, Prendergast FG. Spectral and photophysical studies of benzo[e]xanthene dyes: dual emission pH sensors. Anal Biochem 1991;194:330–44. [DOI] [PubMed] [Google Scholar]
- [14].Dicesare N, Lakowicz JR. Spectral properties of fluorophores combining the boronic acid group with electron donor or withdrawing groups, Implication in the development of fluorescence probes for saccharides. J Phys Chem A 2001;105:6834–40. [DOI] [PMC free article] [PubMed] [Google Scholar]
- [15].Dicesare N, Lakowicz JR. Charge transfer fluorescent probes using boronic acids for monosaccharide signalling. J Biomed Optics 2002;7(4):538–45. [DOI] [PMC free article] [PubMed] [Google Scholar]
- [16].Dicesare N, Lakowicz JR. Wavelength-ratiometric probes for saccharides based on donor–acceptor diphenylpolyenes. J Photochem Photobiol A: Chem 2001;143: 39–47. [DOI] [PMC free article] [PubMed] [Google Scholar]
- [17].Badugu R, Lakowicz JR, Geddes CD. High affinity, charge stabilized glucose probes. Org Lett [in preparation].
- [18].DiCesare N, Lakowicz JR. New sensitive and selective fluorescent probes for fluoride using boronic acids. Anal Biochem 2002;301:111–8. [DOI] [PMC free article] [PubMed] [Google Scholar]
- [19].Schulman SG, Threatte RM, Capamacchia AC. J Pharm Sci 1974;63(6):876. [DOI] [PubMed] [Google Scholar]


