Abstract
MicroRNAs (miRNAs) are small nonccoding RNA molecules (sncRNAs) involved in gene expression regulation. Having been widely studied during last two decades, they have been associated with several diseases, including cancer. Recent improvements in high throughput sequencing technologies have revealed a more complex miRNAome, due to miRNA sequence modification phenomena, such as RNA editing and isomiRs. As a result, a new class of tools is necessary in order to appropriately investigate this emerging complexity. To address such need, we developed isoTar, a high-performance Web-based containerized application designed for miRNA consensus targeting prediction and functional enrichment analyses. In the present chapter, we provide an overview of isoTar (https://ncrnaome.osumc.edu/isotar/), as well as benchmarks and a guide to its usage.
Keywords: A-to-I RNA editing, Editome, IsomiRs, ADAR
1. Introduction
MicroRNAs (miRNAs) are single-stranded, small noncoding RNA (sncRNA) molecules ~21 nucleotides in length, present in eukaryotes [1]. MiRNA biogenesis is characterized by a multistep process, from the transcribed primary miRNA (pri-miRNA) to the final mature miRNA. The process begins in the nucleus. Pri-miRNA is initially transcribed by RNA polymerase II, recognized by DGCR8 and then cleaved by Drosha [2], an Rnase III-type enzyme, originating a double-stranded hairpin-like loop of ~70 nucleotides, termed pre-miRNA. Subsequently, this precursor molecule is exported to the cytoplasm by Exportin 5 [3, 4] and further cleaved by Dicer, another RNase III-type enzyme. Dicer cleavage produces a duplex of ~21 nucleotides [5]. Finally, the duplex is securely anchored to an Argonaute (AGO) protein, in which the miRNA passenger strand (miRNA*) is dismissed and later degraded. The retained miRNA strand will then be integrated into the mature RNA-induced silencing complex (RISC), which is actively involved in gene expression regulation. RISC targets (messenger RNA molecules) are targeted through complementary base-pairing with the mature miRNA. Base pairing canonically occurs in the 3′ untranslated region (UTR) [1] of the mRNA molecule. The miRNA seed region, a 6–8 nucleotides-long segment located at the 5′ end of the molecule, between nucleotide positions 2 and 7, plays a key role in gene expression regulation and target recognition. Indeed, modifications occurring within this region can heavily alter the miRNA targetome, giving way to novel miRNA-gene interactions. MiRNA modifications can occur both at the DNA level, such as with Single Nucleotide Polymorphisms (SNPs), and at the RNA level, such as with RNA Editing [6, 7] and miRNA isoforms (sequence shifting), named isomiRs [8, 9]. Post-transcriptional and co-transcriptional phenomena, such as RNA editing events, are frequently present in coding and noncoding transcripts. Adenosine-to-Inosine (A-to-I, where inosine is recognized as guanosine by the translational machinery) RNA editing, mediated by ADARs (enzymes of the adenosine deaminase that act on RNA family), is the most common form of RNA editing in mammals [6, 7]. RNA editing events occurring in mature miRNAs, especially in miRNA seed regions, can drastically change the miRNA targetome [10–12], thus influencing miRNA-mediated gene regulation [6]. Similarly to mature miRNA editing events, isomiRs characterized by variations in sequence length, particularly those with extension/reduction in 5′ end, can assume different functions, when compared to its “canonical” form (as defined in miRBase [13]), due to their miRNA targetome shifting [14].
To investigate the putative functional of such modified miRNAs, we developed isoTar, a Web-based tool for miRNA consensus targeting prediction and functional enrichment analyses. isoTar is a containerized easy-to-use application, which requires neither advanced technical skills nor a complicated and time-consuming installation process. Results are efficiently organized and provided through graphical user-friendly interfaces (GUIs). In this work, we describe the isoTar tool, illustrating execution steps and benchmarks on a specific case study.
2. Materials
Results reported in this work are based on the analysis of mature miRNA miR-589–3p (mature sequence: UCAGAACAAAUGCC GGUUCCCAGA; pre-miRNA: mir-589) in Human, paired with two of its isoforms and another affected by a single RNA editing modification, as summarized below:
isomiR1, characterized by one nucleotide acquired at the 5′ end (+1) and one nucleotide lost at the 3′ end (−1).
isomiR2, characterized by one nucleotide acquired at the 5′ end (+1) and no changes at the 3′ end (0).
An A-to-I RNA editing modification at position 6.
IsoTar is freely available as a containerized image (.tar extension) and downloadable at the following address: https://ncrnaome.osumc.edu/isotar.
Leveraging Docker [15], a virtual environment manager independent from the user Operating System (OS), isoTar can be installed on all main OSs, such as Windows 10 Pro, Mac OS 10.12+, and Ubuntu Linux 16.04+. As a result, isoTar installation does not require any technical competence, library, or additional adjustments. IsoTar gathers under a single umbrella biological resources, prediction tools, libraries, packages, and user-friendly Web-based interfaces, rendering the execution of miRNA consensus targeting prediction and functional enrichment analyses seam-less and simple to the user. The application has been designed to both maximize user experience and minimize the number of steps needed to accomplish each task. Contrary to other tools, isoTar takes full advantage of all user system CPU cores available (adopting a multiprocessing design), executing high performance computations as efficiently as possible.
Both inputs and analysis results can be fully customized and downloaded, respectively, through the Web interface. As a stand-alone Web-based application, isoTar provides fast responsiveness, keeping all data and results securely stored locally. The use of Web resources, such as via Web Services, is minimal and is associated only to a single specific component of the enrichment analysis process.
2.1. Required Software and Hardware Resources
In order to run isoTar, a computing system with at least 4 GB of RAM and ~10 GB of free space for the Docker image is necessary, including the latest version of Docker, a stable Internet connection, and an updated Web browser, such as Google Chrome, Mozilla Firefox, Microsoft Edge, or Apple Safari.
3. Methods
IsoTar is designed to incorporate in-house developed scripts along with open source packages, libraries, biological datasets, and tools to accomplish each specific task.
The isoTar application is written in the Python programming language on top of Flask (http://flask.pocoo.org), a lightweight Web framework employed for high-performance and secure Web applications. Web interfaces leverage state-of-the-art Web technologies, such as HTML5, Twitter Bootstrap [16], and JQuery [17], for a higher responsiveness and user experience. Moreover, to further increase user experience, as well as result readability, isoTar integrates different graphical libraries written in the JavaScript language, such as Highcharts.js (http://www.highcharts.com) and jvenn.js [18], employed throughout the application. Charts can be downloaded in different formats, such as PNG, SVG, and PDF.
Two distinct tasks can be accomplished using isoTar. The miRNA Consensus Target Prediction Analysis task aims at identifying potential miRNA targets, leveraging state-of-the-art prediction tools. Employed tools span across different approaches, from thermodynamic stability-based (RNAhybrid, miRanda, PITA, and miRmap), to sequence-based (TargetScan, miRmap, and miRanda), as well as tools based on evolutionary conservation (TargetScan). Supported versions are miRmap (v1.1) [19], TargetScan (v7.0) [20], PITA (v6) [21], RNAhybrid (v2.1.2) [22], and miRanda (v3.3a) [23]. Only those predictions with a seed region of 7–8 nucleotides in length (7mer-(A1 and m8), 8mer), without any mismatch or G:U base pairs (wobbles), are taken into consideration. miRanda, RNAhybrid, and PITA parameters have been set to increase their precision [24]. In particular, PITA uses a ΔΔG ≤ −10 kcal/mol; miRanda uses an energy cutoff ≤−20 kcal/mol, a gap opening equal to −9, and a gap extension penalty equal to −4; RNAhybrid uses a ΔG ≤−20 kcal/mol (free energy).
Finally, the input customization process relies on (1) miRBase v21 (34) for the list of canonical mature miRNAs and their corresponding pre-miRNAs, and (2) two datasets of DNA and RNA modifications in mature miRNAs. Regarding the latter two, the first is a dataset (dbSNP v150 [25]) of single nucleotide DNA variants which contains 89 modifications within the seed region and 189 outside of it. The second dataset reports known A-to-I RNA editing sites containing 69 inside and 69 outside the seed region.
The functional enrichment analysis task, instead, aims at expanding information on predicted targets by providing additional details, such as their biological function, along with biological processes in which they are involved. Functional analyses can be performed by including one or more of the following resources: (1) the GO terms dataset from NCBI Gene Ontology [26] (release 12/20/2017); (2) the pathway datasets from Reactome [27–29] and KEGG [30] (both released in 2016).
Regarding the implementation, the Functional Analysis based on Gene Ontologies was developed by leveraging the Python library GOATOOLS (v0.7.11) [31], and the R package RamiGO (v1.22.0) [32] included in Bioconductor (v3.5) [33].
3.1. isoTar in Action
IsoTar functionalities can be accessed through interactive Web-based interfaces, using any recent Web browser. Henceforth, the following sections describe guidelines for each task, such as isoTar installation, input customization (for both prediction and functional analyses), analyses execution, along with downloading of data, as well as reloading results of previous analyses.
3.2. isoTar Installation and Execution
IsoTar is a containerized application leveraging Docker, which is required to be installed on the user’s system. Docker installation may vary depending on which OS is used. For more information refer to the Docker documentation available at https://docs.docker.com/install.
Once Docker is installed on the system, the user can proceed downloading the latest isoTar image available at https://ncrnaome.osumc.edu/isotar. The isoTar installation process follows a few simple steps.
Linux/Mac users use the Terminal console. Windows users use the Powershell console. Inside the console, the following command allows to install isoTar:
docker load -i /PATH_TO_ISOTAR_IMAGES/isotar.tar
The previous command will install the latest isoTar image on your system. The installation process will generate an output similar to the one reported below:
34394faab172: Loading layer [==================================================>] 17.92kB/17.92kB
fbf57c7a838c: Loading layer [==================================================>] 11.78kB/11.78kB
2d63176664ff: Loading layer [==================================================>] 5.632kB/5.632kB
5ab785ed50da: Loading layer [==================================================>] 3.072kB/3.072kB
097adadfb283: Loading layer [==================================================>] 7.429GB/7.429GB
86c87be6face: Loading layer [==================================================>] 108.6MB/108.6MB
2dcd42fb11cf: Loading layer [==================================================>] 720.3MB/720.3MB
a64e27523e49: Loading layer [==================================================>] 103.6MB/103.6MB
1975cd33bc84: Loading layer [==================================================>] 1.536kB/1.536kB
e518cf78e956: Loading layer [==================================================>] 77.04MB/77.04MB
890769017077: Loading layer [==================================================>] 817.8MB/817.8MB
8085b1d466a4: Loading layer [==================================================>] 84.26MB/84.26MB
42d84f02a1ed: Loading layer [==================================================>] 1.778MB/1.778MB
c01029da65f8: Loading layer [==================================================>] 26.83MB/26.83MB
e6aaf08a8d15: Loading layer [==================================================>] 238.7MB/238.7MB
7ec2c40ad70d: Loading layer [==================================================>] 3.402MB/3.402MB
2890d18c1855: Loading layer [==================================================>] 784.9kB/784.9kB
fff38d1ba0f3: Loading layer [==================================================>] 6.212MB/6.212MB
e854dde956f4: Loading layer [==================================================>] 4.008MB/4.008MB
0dc1195a50cd: Loading layer [==================================================>] 156.6MB/156.6MB
17f94a00c15c: Loading layer [==================================================>] 337.4MB/337.4MB
f1699f58bd58: Loading layer [==================================================>] 2.048kB/2.048kB
dcc74bbe2463: Loading layer [==================================================>] 3.072kB/3.072kB
9eb14f476dd0: Loading layer [==================================================>] 3.584kB/3.584kB
30ff6d340466: Loading layer [==================================================>] 3.072kB/3.072kB
aa61ab025cdc: Loading layer [==================================================>] 4.096kB/4.096kB
8494dd294d5f: Loading layer [==================================================>] 4.096kB/4.096kB
0dc19cc08570: Loading layer [==================================================>] 3.584kB/3.584kB
90acf0e9a3a3: Loading layer [==================================================>] 2.56kB/2.56kB
416dc1488da0: Loading layer [==================================================>] 2.56kB/2.56kB
ec4f7b5e60cb: Loading layer [==================================================>] 2.56kB/2.56kB
21adbf10d522: Loading layer [==================================================>] 2.56kB/2.56kB
46acdfccfc0a: Loading layer [==================================================>] 4.096kB/4.096kB
Loaded image: isotar:v1
Subsequently, to verify if the installation process has been executed correctly, users can run the following command:
docker images
It will show all Docker images currently installed on the system, with an output similar to the one below:
| REPOSITORY | TAG | IMAGE ID | CREATED | SIZE |
| isotar | v1 | 15e0f7fa60fe | 2 minutes ago | 10.2GB |
For the sake of clarity, the IMAGE ID showed here represents an example, considering that the user may see a different one on their system.
The last step involves the “execution” of the isoTar application, which is performed by using the following command:
docker run -d -p 80:8080 isotar:v1
This command will create a temporary, novel instance of the isoTar application based on the installed image (isotar:v1). The instance will be kept alive until the machine is shut down. Consequently, this command above needs to be executed every time the user desires to use the isoTar application.
Diving into the command, we instruct Docker to run the instance in background mode (option -d), binding (option -p 80:8080) the 80 user-system port (at host level) to the 8080 instance port (the one created from the isotar:v1 image). Again, users can check whether or not the instance has been correctly generated, by running the following command:
docker ps
obtaining as response an output similar to the one shown below:
| CONTAINER ID | IMAGE | COMMAND | CREATED | STATUS | PORTS |
| NAMES | |||||
| 019f68c97531 isotar:v1 “/usr/bin/supervisord” 5minutesago Up5minutes 0.0.0.0:80->8080/tcp | |||||
| hopeful_brown | |||||
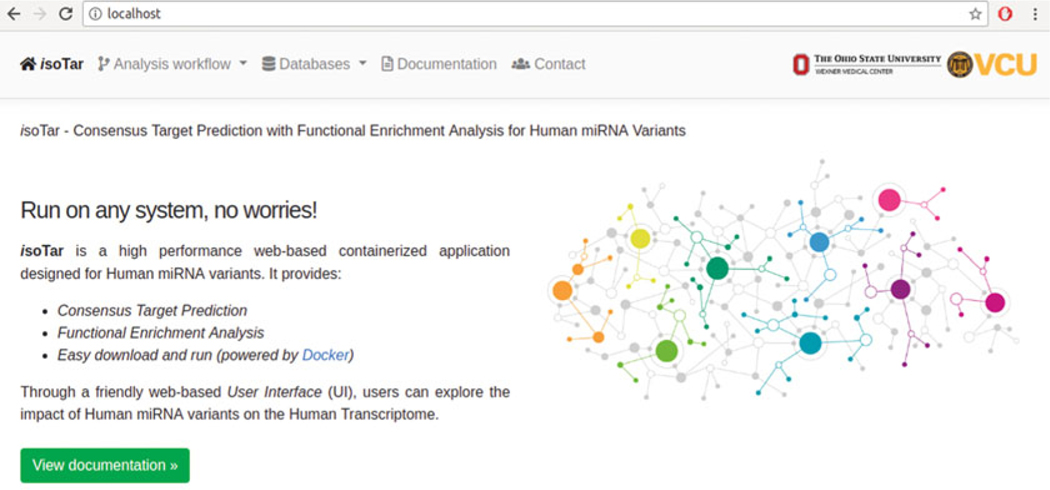
Once the isoTar installation is correctly concluded, the application can be accessed by typing localhost into the URL bar of the Web browser (see Fig. 1):
Fig. 1.
IsoTar application interface
These steps are fully described at the following link: https://ncrnaome.osumc.edu/isotar.
3.3. Input
As introduced in Subheading 2, both prediction and functional analyses examples are performed in association with mature miRNA hsa-miR-589–3p. For the sake of clarity, we summarize below all the information we will employ, compliant to the isoTar input format (FASTA-like):
>hsa-miR-589–3p hsa-mir-589 +1|−1;+1|0;6:A|G UCAGAACAAAUGCCGGUUCCCAGA
3.4. Consensus Prediction - Input setup
The Consensus Prediction Analysis module allows users to specify miRNA information and their variations (see Fig. 2).
Fig. 2.
IsoTar Consensus Prediction module
There are essentially three ways to load a list of miRNAs and their variations:
Using the “Search and customize a miRNA” form. This option provides users with a wide variety of options to fully provide information on miRNAs and their variations.
Using the “Known Variations Databases” button. This option provides two datasets, namely known Single Nucleotide Polymorphism and A-to-I RNA Editing modifications, all occurring in mature miRNAs.
Pasting them directly into the text area at the bottom of the module, according to the isoTar input format (as illustrated in the previous section).
For more details, please refer to the isoTar documentation at https://ncrnaome.osumc.edu/isotar. Below, we will explain how to use the most advanced option, the “Search and customize a miRNA” form, providing all necessary information on the miRNA prior to the prediction analysis.
In the first step, users need to search for a specific miRNA— pre-miRNA pair (see Fig. 3). In the example below, we will look for mature miRNA hsa-miR-589–3p, associated with pre-miRNA hsa--mir-589.
Fig. 3.
Search and customize a miRNA form. Example of miRNA searching
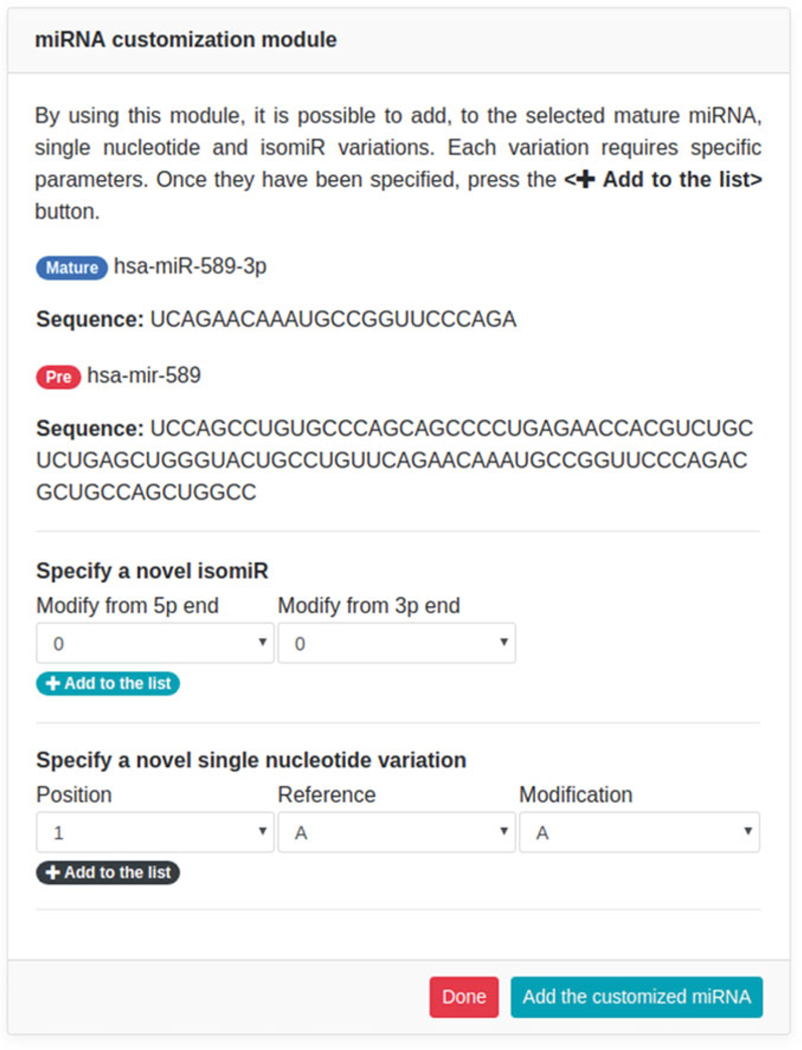
By clicking on the “Search” button, the system will show, on the right side, a temporary form designed for variations customization (see Fig. 4).
Through the customization form, users can specify each variation, grouped per type/color (isomiRs in cyan, single nucleotide modifications in black). As an example, we will specify two isomiRs of hsa-miR-589–3p (+1| 1 and +1|0) and one A-to-I RNA editing modification (6:A|G), by adding them using the corresponding “+ Add to the list” button. Added variations (see Fig. 5) will be shown at the bottom of the form (above “Done” and “Add the customized miRNA” buttons). Once all variations have been specified, users can add the customized information to the textarea (see Fig. 6) by clicking on the “Add the customized miRNA” button.
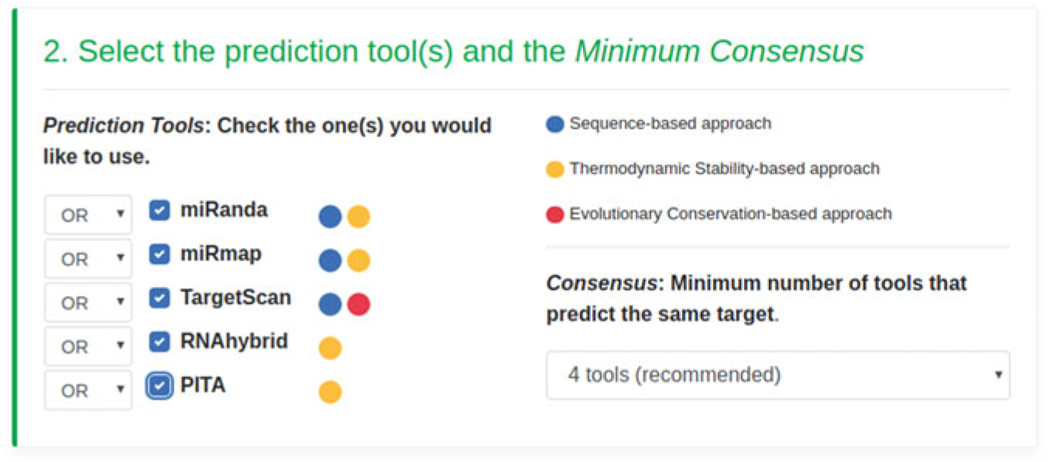
In the second step, users will be required to select prediction tools, along with the minimum Consensus (minimum number of tools that must identify the same target). In the current example, we will select all prediction tools with a minimum Consensus of four tools (see Fig. 7), out of the total number available. Users can combine tools by specifying the AND/ OR option (if one or more tools must/can identify the same predicted targets).
In the third step, users can specify the number of CPU cores to be employed for the analysis (see Fig. 8).
Finally, users can confirm all input data by clicking on the “Submit” button. This will tell isoTar to proceed with the input verification. In this phase, the input is inspected to verify format correctness, prior to the prediction analysis. Identified errors will be properly displayed. As a result of input verification, isoTar will summarize (see Fig. 9) the specified miRNAs and their variations, displayed in a tabular fashion, according to each variation type (i.e., isomiRs and Single Nucleotide modifications).
Fig. 4.
Variations customization form
Fig. 5.
The figure shows the two isomiRs added to the list of variations (at the bottom), as well as the selection of the guanosine for the A-to-I RNA editing site at position 6
Fig. 6.
The figure shows the miRNA and its variations generated through the customization form
Fig. 7.
Prediction tools and minimum Consensus selection form
Fig. 8.
CPU cores selection form
Fig. 9.
Input summary
3.5. Functional Analysis - Input setup
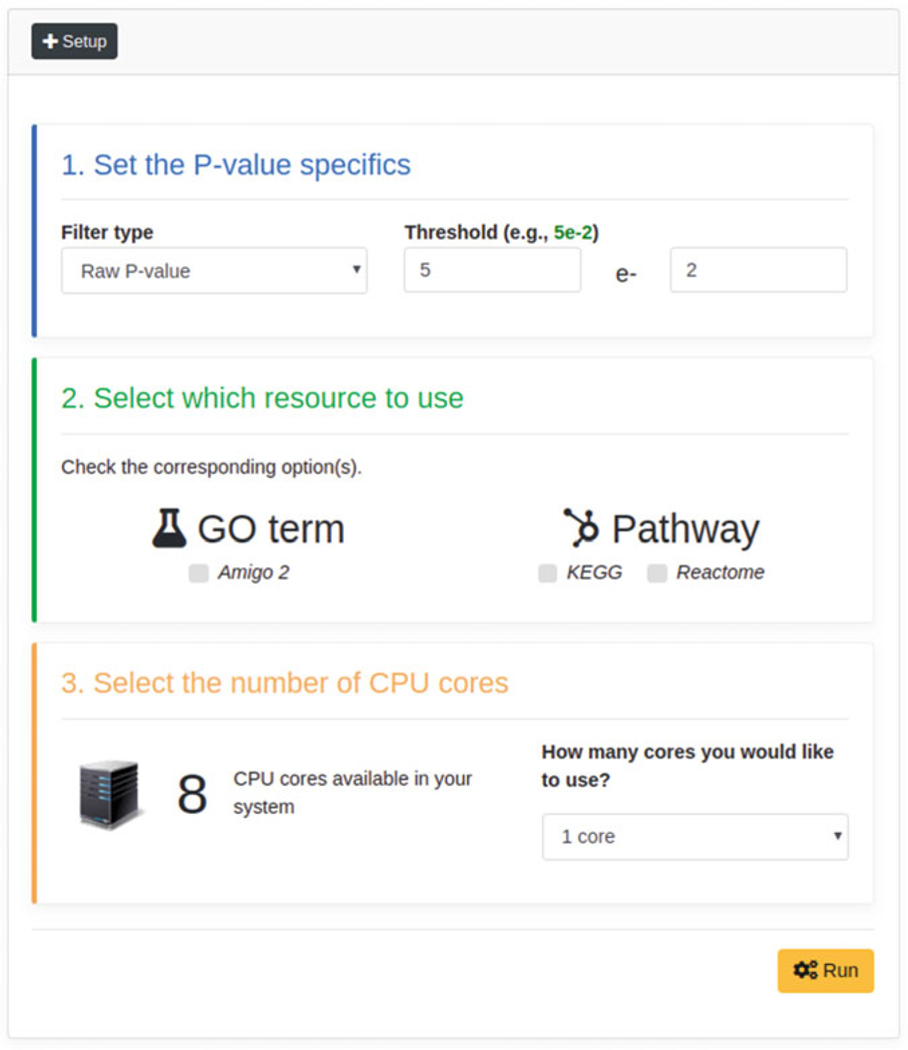
The Functional Analysis module (see Fig. 10) allows users to enrich predicted targets (previously generated through the Prediction Analysis) with additional information retrieved from datasets of GO terms (Gene Ontology) and pathways (KEGG and Reactome).
Fig. 10.
Functional Analysis module
For more details refer to the isoTar documentation at https://ncrnaome.osumc.edu/isotar.
Below is a step-by-step tutorial on how to enrich predicted targets by leveraging on all integrated datasets, describing all necessary details to perform the functional analysis.
First, users must specify the P-value type (default: Raw P-value), along with the P-value threshold (default: <0.05), to be considered for data filtering purposes (see Fig. 11). In our case, we will use the “Raw P-value” and a threshold <0.01.
Subsequently, user may specify which dataset to consider for the functional analysis (see Fig. 12). In this example, we will select all datasets.
Thirdly, users may specify the number of CPU cores to be employed for the analysis (see Fig. 13).
Finally, users can execute the analysis by clicking on the “Run” button (see Fig. 14).
Fig. 11.
P-value settings form
Fig. 12.
Datasets selection form
Fig. 13.
CPU cores selection form
Fig. 14.
Prediction Analysis execution button
3.6. Prediction Analysis - Results
3.6.1. Execution
After having initiated the analysis, the time of execution will depend on the number of miRNAs and variations considered in input, the number of selected prediction tools, as well as the number of CPU cores employed for the analysis. Da eliminare, non riportiamo nessun test a cui riferirci.
3.6.2. Results
Results are shown in a new tab panel labeled Results (see Fig. 15). Prediction results are grouped by variation type and prediction tool. For each variation, isoTar provides:
Variation details, such as its type (i.e., substitution or isomiR) and position (substitution);
The number of predicted targets identified through the minimum Consensus (the column labeled “Targets”);
The number of predicted targets for each selected prediction tool;
A Venn diagram reporting the predicted targets interaction across all selected prediction tools.
Fig. 15.
Prediction Analysis results grouped per variation type
Users may click on the number of targets in order to view additional information shown through a modal box (see Fig. 16), such as Gene Symbol and Gene ID. Such information points to online resources, such as NCBI Gene (https://www.ncbi.nlm.nih.gov/gene/) and GeneCards (https://www.genecards.org/).
Fig. 16.
The modal box reports additional information on predicted targets identified by miRanda, according to isomiR +1 (one nucleotide added at 5′ end) and 0 (no changes at 3′ end). The predicted targets list can be downloaded in different formats, such as PDF and Excel.
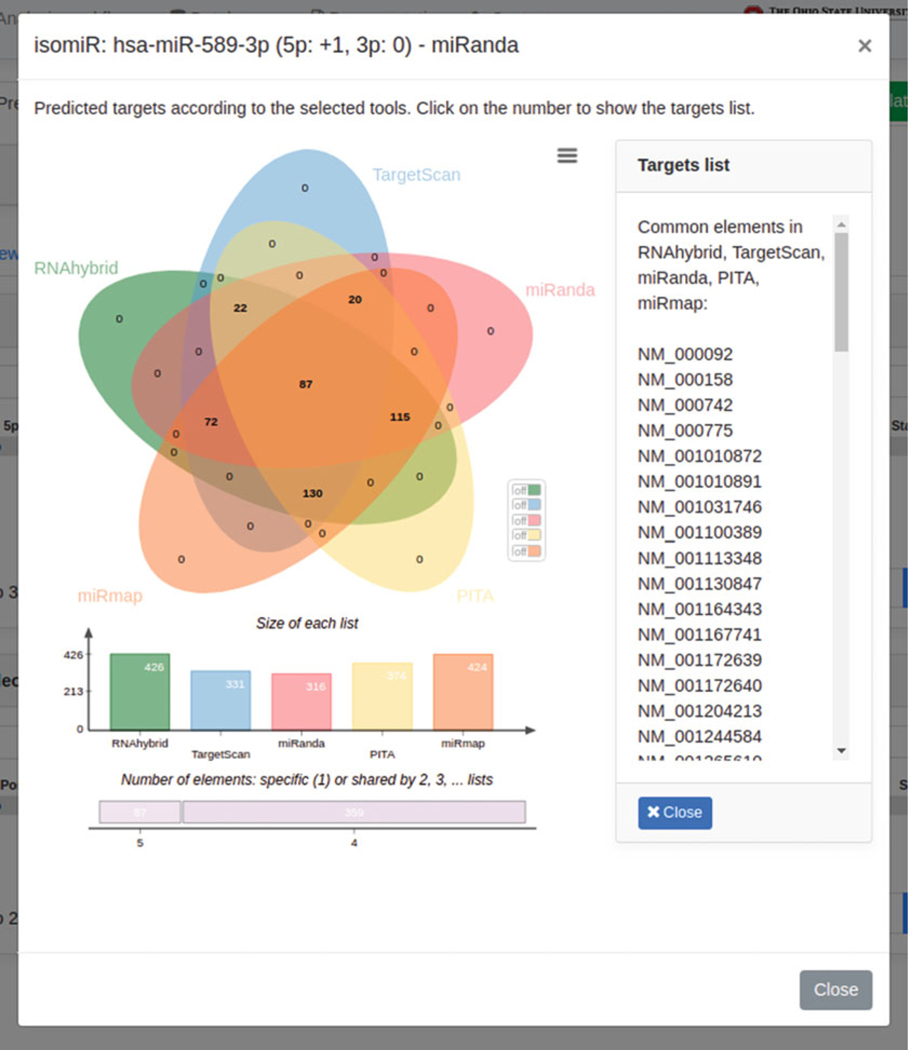
Finally, by clicking on the chart icons displayed into the “Statistics” column (to the extreme right), users can visualize the Venn diagram (see Fig. 17) depicting the intersection of predicted targets across selected prediction tools, supplied with a histogram representing the targets distribution among such tools. Users can click on any single number displayed within the Venn diagram areas to display the corresponding targets (on the right side of the Venn diagram).
Fig. 17.
The modal box reports the Venn diagram of predicted targets identified by miRanda, according to isomiR +1 (one nucleotide added at 5′ end) and 0 (no changes at 3′ end). The diagram, as well as the list of targets, can be downloaded, respectively, in SVG/PNG and CSV format
3.7. Functional Analysis - Results
3.7.1. Execution
In general, the Functional Analysis will take a few minutes to be concluded, depending on the number of CPU cores employed for the analysis, as well as the level of congestion of the Amigo Web Service (used within the RamiGO package). This Web Service is used to create the GO terms tree for each Gene Ontology category: Biological Process (BP), Cellular Component (CC), and Molecular Function (MF).
3.7.2. Results
Results are displayed via tab panels (see Fig. 18), each one dedicated to a specific selected resource (GO term, KEGG, and Reactome). For each resource, results are grouped per variation type. For more information refer to the isoTar main page.
Fig. 18.
Functional Analysis results, according to each selected resource (GO term, KEGG, and Reactome)
GO Term
The GO term-based Functional Analysis is performed for each Wild Type–Variation miRNA pair, as provided in input for the Prediction Analysis. Additionally, results are grouped per Gene Ontology category:
Biological Process (BP).
Cellular Component (CC).
- Molecular Function (MF).
- A typical analysis provides information according to:
Wild Type or Variation: A GO term list for BP, CC, and MF, respectively, is supplied with additional details, based on all the consensus predicted targets associated to the wild-type miRNA or Variation, respectively;
- Wild Type vs. Variation: A GO term list for each Gene Ontology category (BP, CC, and MF) is supplied with additional details, based on those consensus predicted targets that are associated with each of the following:
- Wild type only (cyan color).
- Variation only (red color).
- Wild Type–Variation intersection (green color).
- For each Variation, isoTar provides:
Variation details, such as its type (i.e., Substitution or isomiR) and position (Substitution).
The number of identified GO terms (filtered per P-value type and threshold) for each Gene Ontology category, supplied with GO term trees and histograms.
The number of GO terms (filtered per P-value type and threshold), per Gene Ontology category, considering only those predicted targets associated to the wild type (cyan color), Variation (red color), and their intersection (green color), respectively. GO term trees and histograms are provided as well.
Users can click on GO terms to view additional information via a modal box (see Fig. 19), such as Go term and GO name. Such information points to online resources, such as Amigo Gene Ontology.
Fig. 19.
The modal box reports additional information on GO terms according to the wild type only (green color), for the isomiR +1 (one nucleotide added at 5′ end) and 0 (no changes at 3′ end), and the Gene Ontology category BP. Go terms list can be downloaded in different formats, such as Excel, PDF, and TSV
Among the results, isoTar provides also histograms and hierarchical trees of significant (according to the user specified P-value) GO terms. For example, the histogram (see Fig. 20) referring to the comparison between a miRNA wild type and its isomiR +1 (one nucleotide added at 5′ end) and 0 (no changes at 3′ end) according to the Gene Ontology category CC, displays only those GO terms filtered by P-value type and threshold. It can be downloaded in different formats, such as PNG, SVG, PDF, and JPEG.
Fig. 20.
Wild type vs. isomiR +1 (one nucleotide added at 5′ end) and 0 (no changes at 3′ end) histogram according to the Gene Ontology category CC
GO term trees are provided for each Gene Ontology category, as well. For example, the Go term tree referring to the comparison between a miRNA wild type and its isomiR +1 (one nucleotide added at 5′ end) and 0 (no changes at 3′ end) according to the Gene Ontology category CC, is depicted in Fig. 21.
Fig. 21.
Wild type vs. isomiR +1 (one nucleotide added at 5′ end) and 0 (no changes at 3′ end) GO term tree according to Gene Ontology category CC. Colors indicate all possible combinations across all potential intersection subsets. A table legend reporting colors and subsets combinations is provided as well (see Fig. 22). GO term trees can be downloaded in PDF format
KEGG and Reactome
The Pathway-based Functional Analysis is performed for each Wild Type–Variation pair, as described for the GO term feature. A standard analysis provides information according to:
Wild Type: A pathways list is supplied with additional details, based on all consensus predicted targets associated to the wild-type miRNA.
Variation: A pathways list is supplied with additional details, based on all consensus predicted targets associated to the Variation-specified miRNA.
- Wild Type vs. Variation: A pathways list is supplied with additional details, based on those consensus predicted targets that are respectively associated only to:
- Wild type miRNA (cyan color).
- Variation-specified miRNA (red color).
- Wild Type-Variation intersection (green color).
- For each Variation-specified miRNA, isoTar provides:
Variation details, such as its type (i.e., substitution or isomiR) and position (substitution).
The number of identified pathways (filtered per P-value type and threshold), supplied with histograms.
The number of pathways (filtered per P-value type and threshold) considering only those predicted targets associated to the wild-type miRNA (cyan color), Variation-specified miRNA (red color), and their intersection (green color), respectively. Histograms are provided as well.
Users can click on single pathway names to view additional information via a modal box (see Fig. 23), such as Pathway ID and Pathway name. Such information refers to online resources, such as KEGG or Reactome (depending on the dataset in use).
Fig. 23.
The modal box reports additional information on pathways according to the wild type miRNA only (green color), for the isomiR +1 (one nucleotide added at 5′ end) and 0 (no changes at 3′ end), and the KEGG resource. The list of pathways can be downloaded in different formats, such as Excel, PDF, and TSV
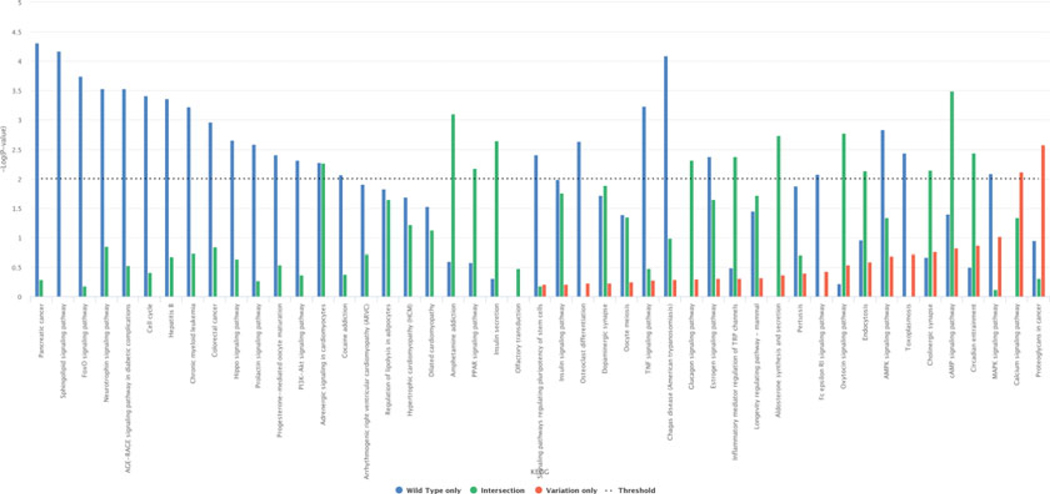
As an example, Fig. 24 reports the histogram in which the miRNA wild type is compared with its isomiR +1 (one nucleotide added at 5′ end) and 0 (no changes at 3′ end) in association to KEGG, while Fig. 25 illustrates the histogram for the subsets comparison (wild type only, variation only, wild type–variation intersection). Histograms generally display only those pathways filtered per P-value type and threshold. Such graphics can be downloaded in different formats, such as PNG, SVG, PDF, and JPEG.
Fig. 24.
Wild type vs. isomiR +1 (one nucleotide added at 5′ end) and 0 (no changes at 3′ end) histogram in association to KEGG
Fig. 25.
Wild type vs. isomiR +1 (one nucleotide added at 5′ end) and 0 (no changes at 3′ end) histogram subsets comparison in association to KEGG
The information described above for the KEGG resource is also valid for the Reactome results.
3.8. Results Downloading and Restoring
IsoTar allows to download all current results generated during analyses via Web interface, by clicking on the “Download the current results” button (see Fig. 26). The button triggers an internal procedure that compresses all current results into a single ZIP file, named output.zip.
Fig. 26.
Upload previous results, Download current results, and Reload latest results buttons
It should be noted that any new analysis would replace current results (stored into the current instance). A new prediction analysis will erase both prediction and functional results, if performed. A new functional analysis will erase only the previous one, if performed.
With this in mind, users can reload previous analyses by loading the corresponding output.zip file, by clicking on the “Upload previous results” button (see Fig. 26). This triggers a guided procedure to help the user in this task.
At last, if users close accidentally the isoTar Web page, they can reload current results (within the current instance) by clicking on the “Reload latest results” button (see Fig. 26). This feature is particularly useful for users when they do not wish to keep the isoTar Web page open during long analysis sessions.
Fig. 22.
GO terms tree node colors legend
References
- 1.Ha M, Kim VN (2014) Regulation of microRNA biogenesis. Nat Rev Mol Cell Biol 15:509–524. 10.1038/nrm3838 [DOI] [PubMed] [Google Scholar]
- 2.Han J, Lee Y, Yeom K-H et al. (2004) The Drosha-DGCR8 complex in primary microRNA processing. Genes Dev 18:3016–3027. 10.1101/gad.1262504 [DOI] [PMC free article] [PubMed] [Google Scholar]
- 3.Yi R, Qin Y, Macara IG, Cullen BR (2003) Exportin-5 mediates the nuclear export of pre-microRNAs and short hairpin RNAs. Genes Dev 17:3011–3016. 10.1101/gad.1158803 [DOI] [PMC free article] [PubMed] [Google Scholar]
- 4.Bohnsack MT, Czaplinski K, Gorlich D (2004) Exportin 5 is a RanGTP-dependent dsRNA-binding protein that mediates nuclear export of pre-miRNAs. RNA 10:185–191. 10.1261/rna.5167604 [DOI] [PMC free article] [PubMed] [Google Scholar]
- 5.Macrae IJ, Zhou K, Li F et al. (2006) Structural basis for double-stranded RNA processing by Dicer. Science 311:195–198. 10.1126/science.1121638 [DOI] [PubMed] [Google Scholar]
- 6.Nishikura K (2016) A-to-I editing of coding and non-coding RNAs by ADARs. Nat Rev Mol Cell Biol 17:83–96. 10.1038/nrm.2015.4 [DOI] [PMC free article] [PubMed] [Google Scholar]
- 7.Nigita G, Veneziano D, Ferro A (2015) A-to-I RNA editing: current knowledge sources and computational approaches with special emphasis on non-coding RNA molecules. Front Bioeng Biotechnol 3:37. 10.3389/fbioe.2015.00037 [DOI] [PMC free article] [PubMed] [Google Scholar]
- 8.Zhou H, Arcila ML, Li Z et al. (2012) Deep annotation of mouse iso-miR and iso-moR variation. Nucleic Acids Res 40:5864–5875. 10.1093/nar/gks247 [DOI] [PMC free article] [PubMed] [Google Scholar]
- 9.Neilsen CT, Goodall GJ, Bracken CP (2012) IsomiRs – the overlooked repertoire in the dynamic microRNAome. Trends Genet 28:544–549. 10.1016/j.tig.2012.07.005 [DOI] [PubMed] [Google Scholar]
- 10.Yang W, Chendrimada TP, Wang Q et al. (2006) Modulation of microRNA processing and expression through RNA editing by ADAR deaminases. Nat Struct Mol Biol 13:13–21. 10.1038/nsmb1041 [DOI] [PMC free article] [PubMed] [Google Scholar]
- 11.Kawahara Y, Zinshteyn B, Sethupathy P et al. (2007) Redirection of silencing targets by adenosine-to-inosine editing of miRNAs. Science 315:1137–1140. 10.1126/science.1138050 [DOI] [PMC free article] [PubMed] [Google Scholar]
- 12.Nigita G, Acunzo M, Romano G et al. (2016) microRNA editing in seed region aligns with cellular changes in hypoxic conditions. Nucleic Acids Res 44:6298–6308. 10.1093/nar/gkw532 [DOI] [PMC free article] [PubMed] [Google Scholar]
- 13.Kozomara A, Griffiths-Jones S (2014) miR-Base: annotating high confidence microRNAs using deep sequencing data. Nucleic Acids Res 42:D68–D73. 10.1093/nar/gkt1181 [DOI] [PMC free article] [PubMed] [Google Scholar]
- 14.Magee RG, Telonis AG, Loher P et al. (2018) Profiles of miRNA isoforms and tRNA fragments in prostate cancer. Sci Rep 8:5314. 10.1038/s41598-018-22488-2 [DOI] [PMC free article] [PubMed] [Google Scholar]
- 15.Merkel D (2014) Docker: lightweight Linux containers for consistent development and deployment. Linux J 2014:2 [Google Scholar]
- 16.Spurlock J (2013) Bootstrap: responsive web development. O’Reilly Media, Inc, Newton, MA [Google Scholar]
- 17.De Volder K (2006) JQuery: a generic code browser with a declarative configuration language. In: Practical aspects of declarative languages. Springer, Berlin, Heidelberg, Berlin, Heidelberg, pp 88–102 [Google Scholar]
- 18.Bardou P, Mariette J, Escudié F et al. (2014) jvenn: an interactive Venn diagram viewer. BMC Bioinformatics 15:293. 10.1186/1471-2105-15-293 [DOI] [PMC free article] [PubMed] [Google Scholar]
- 19.Vejnar CE, Zdobnov EM (2012) MiRmap: comprehensive prediction of microRNA target repression strength. Nucleic Acids Res 40:11673–11683. 10.1093/nar/gks901 [DOI] [PMC free article] [PubMed] [Google Scholar]
- 20.Lewis BP, Burge CB, Bartel DP (2005) Conserved seed pairing, often flanked by adenosines, indicates that thousands of human genes are microRNA targets. Cell 120:15–20. 10.1016/j.cell.2004.12.035 [DOI] [PubMed] [Google Scholar]
- 21.Kertesz M, Iovino N, Unnerstall U et al. (2007) The role of site accessibility in microRNA target recognition. Nat Genet 39:1278–1284. 10.1038/ng2135 [DOI] [PubMed] [Google Scholar]
- 22.Heyne S, Costa F, Rose D, Backofen R (2012) GraphClust: alignment-free structural clustering of local RNA secondary structures. Bioinformatics 28:i224–i232. 10.1093/bioinformatics/bts224 [DOI] [PMC free article] [PubMed] [Google Scholar]
- 23.John B, Enright AJ, Aravin A et al. (2004) Human microRNA targets. PLoS Biol 2:e363. 10.1371/journal.pbio.0020363 [DOI] [PMC free article] [PubMed] [Google Scholar]
- 24.Marín RM, Vanícek J (2011) Efficient use of accessibility in microRNA target prediction. Nucleic Acids Res 39:19–29. 10.1093/nar/gkq768 [DOI] [PMC free article] [PubMed] [Google Scholar]
- 25.Sherry ST, Ward MH, Kholodov M et al. (2001) dbSNP: the NCBI database of genetic variation. Nucleic Acids Res 29:308–311 [DOI] [PMC free article] [PubMed] [Google Scholar]
- 26.Harris MA, Clark J, Ireland A et al. (2004) The Gene Ontology (GO) database and informatics resource. Nucleic Acids Res 32:D258–D261. 10.1093/nar/gkh036 [DOI] [PMC free article] [PubMed] [Google Scholar]
- 27.Croft D, Mundo AF, Haw R et al. (2014) The Reactome pathway knowledgebase. Nucleic Acids Res 42:D472–D477. 10.1093/nar/gkt1102 [DOI] [PMC free article] [PubMed] [Google Scholar]
- 28.Fabregat A, Sidiropoulos K, Garapati P et al. (2016) The reactome pathway knowledgebase. Nucleic Acids Res 44:D481–D487. 10.1093/nar/gkv1351 [DOI] [PMC free article] [PubMed] [Google Scholar]
- 29.Fabregat A, Jupe S, Matthews L et al. (2018) The reactome pathway knowledgebase. Nucleic Acids Res 46:D649–D655. 10.1093/nar/gkx1132 [DOI] [PMC free article] [PubMed] [Google Scholar]
- 30.Kanehisa M, Goto S (2000) KEGG: Kyoto encyclopedia of genes and genomes. Nucleic Acids Res 28:27–30 [DOI] [PMC free article] [PubMed] [Google Scholar]
- 31.Haibao T, Klopfenstein D, Pedersen B, et al. (2015) GOATOOLS: tools for gene ontology. doi: 10.5281/zenodo.31628 [DOI]
- 32.Schröder MS, Gusenleitner D, Quackenbush J et al. (2013) RamiGO - an R/Bioconductor package providing an AmiGO Visualize interface. Bioinformatics 29:666–668. 10.1093/bioinformatics/bts708 [DOI] [PMC free article] [PubMed] [Google Scholar]
- 33.Gentleman RC, Carey VJ, Bates DM et al. (2004) Bioconductor: open software development for computational biology and bioinformatics. Genome Biol 5:R80. 10.1186/gb-2004-5-10-r80 [DOI] [PMC free article] [PubMed] [Google Scholar]


