

Abstract
Heparan sulfate (HS) is a heterogeneous, extracellular glycan that interacts with proteins and other molecules affecting many biological processes. The specific binding motifs of HS interactions are of interest, but have not been extensively characterized. Glycan microarrays are valuable tools that can be used to probe the interactions between glycans and their ligands while relying on relatively small amounts of samples. Recently, chemoenzymatic synthesis of HS has been employed to produce specific HS structures that can otherwise be difficult to produce. In this study, a microarray of diverse chemoenzymatically synthesized HS structures was developed and HS interactions were characterized. Fluorescently labeled antithrombin III (AT) and fibroblast growth factor-2 (FGF2) were screened against 95 different HS structures under three different printing concentrations to confirm the utility of this microarray. Specific sulfation patterns were found to be important for binding to these proteins and results are consistent with previous specificity studies. Furthermore, the binding affinities (KD,surf) of AT and FGF2 to multiple HS structures were determined using a microarray technique and is consistent with previous reports. Lastly, the 95-compound HS microarray was used to determine the distinct binding profiles for interleukin 12 and platelet factor 4. This technique is ideal for rapid expansion and will be pivotal to the high-throughput characterization of biologically important structure/function relationships.
Keywords: carbohydrates, chemoenzymatic synthesis, heparan sulfate, microarray, oligosaccharides
Introduction
Glycans are biologically important components of cells. A wide variety of sugar-type molecules can be attached to proteins and lipids that are involved in recognition, adhesion and signaling (Varki 2017). However, glycans have proven to be difficult to isolate and study due to their structural heterogeneity. Additionally, the presence of multiple reactive hydroxy groups and lack of ultraviolet (UV) absorbable functional groups makes glycans difficult to chemically synthesize and purify in suitable yields. Heparan sulfate (HS) is a naturally occurring, heterogenous glycan that is located on the exterior of cells and in the extracellular matrix (Whitelock and Iozzo 2005). HS contains disaccharide repeating units consisting of glucosamine (GlcN) and uronic acid residues. The GlcN residue can be modified at the N-position with an acetyl (N-acetylated glucosamine) or a sulfate [N-sulfated glucosamine (GlcNS)] group and the 3-O and 6-O positions can be sulfated. The uronic acid subunit can be either a glucuronic acid or epimerized to an iduronic acid (IdoA) residue and both can be sulfated at the 2-O position, although the IdoA is more likely to be 2-O-sulfated [2-O-sulfated iduronic acid (IdoA2S)]. These complex structures are involved in many biological processes including coagulation, inflammation, neurogenesis, infection and cancer (Bishop et al. 2007).
There is an increasing interest in understanding HS–protein interactions in the development of HS-based, disease-modifying therapeutics (Coombe and Kett 2005). Having a high-throughput method with sufficient diversity, which is able to determine structures that bind and also determines how strongly they bind, will be of great value to academia and industry. A glycan microarray allows for high-throughput screening to improve our understanding of the interactions between glycans and their binding partners while requiring very small amounts of ligand (Hyun et al. 2017). Since the sulfation pattern of HS can affect binding to proteins, HS glycan microarrays have been utilized for the screening of HS structures. Due to the difficulty of chemically synthesizing specific HS structures, only limited sets of HS structures have been studied. Thus far, only HS microarrays that include octasaccharide or shorter oligosaccharides have been developed (Noti et al. 2006; De Paz, Spillmann et al. 2006b; De Paz, Noti et al. 2006a; de Paz et al. 2007; Shipp and Hsieh-Wilson 2007; Park et al. 2008; Maza et al. 2012; Dulaney et al. 2015; Yang et al. 2017; Zong et al. 2017; Liu et al. 2019). However, longer HS oligosaccharides are often required for biological activity (Sarrazin et al. 2011). Therefore, it is important to develop a microarray containing a greater diversity of glycan structure to avoid a lengthy chemical synthesis and quickly identify HS structures that are likely to be valuable in answering biological questions.
Recently, chemoenzymatic synthesis has facilitated for the efficient preparation of HS glycans of specific lengths and sulfation patterns (Xu et al. 2011). Our laboratory has previously prepared a 14-compound, heptasaccharide HS microarray (Yang et al. 2017). This research has combined the efficiency of chemoenzymatic synthesis with the rapid analysis of a microarray to characterize protein–HS interactions. In this study, we have expanded the array from 14 compounds to 94 unique compounds plus heterogenous unfractionated heparin (UFH). The array contains compounds from tetrasaccharide to 18-mer and nonsulfated compounds to those containing N-, 6-O-, 2-O- and 3-O-sulfation modifications. Moreover, each compound is printed at three concentrations (50, 25 and 12.5 μM) that allows for the simultaneous assessment of different printing densities. In addition, we adapted a method developed by the Injae Shin group (Park and Shin 2007) to determine the binding affinity of multiple oligosaccharides simultaneously.
We were able to validate our 95-compound array by showing that antithrombin (AT) binds only to compounds that contain the known 3-O-sulfated pentasaccharide sequence (Atha et al. 1985) and display anti-factor Xa activity. Also, we confirmed the requirement of IdoA2S for the binding of fibroblast growth factor-2 (FGF2) (Guimond et al. 1993). We were able to determine binding affinities of AT and FGF2 utilizing a microarray technique, and results are similar to previous binding studies. After confirmation of the utility of the array, we also screened fluorescently labeled proteins, interleukin 12 (IL-12) and platelet factor 4 (PF4). A unique binding profile was determined for all proteins studied. Overall, these studies demonstrate the value in combining chemoenzymatic synthesis with a microarray technique to advance the understanding of HS-binding specificity.
Results
Compound preparation
The initial step of preparing the HS microarray was to modify chemoenzymatically synthesized compounds with an N-(6-aminohexanamidyl) p-aminophenyl linker for attachment to an N-hydroxysuccinimide (NHS)-modified glass slide (Figure 1). In total, 94 chemoenzymatically synthesized oligosaccharides with azide tags were modified through hydrogenation to glycans having primary amine groups. The reduction step is in high yield and was typically complete within 4 h. The 94 specific compounds on the array could be subdivided into the following six groups based on sulfation pattern (Figure 2 and Supplementary Table SI):
Fig. 1.
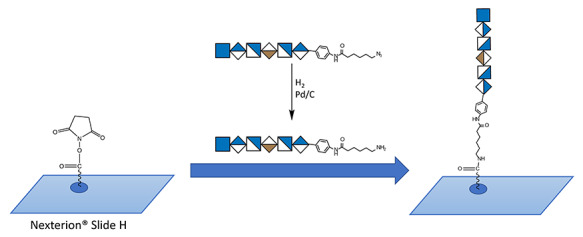
Preparation of HS microarray using NHS-modified Nexterion Slide H. An amino-tagged oligosaccharide was spatially arrayed using a S11 robotic arrayer (Scienion). This resulted in a covalent and site-specific attachment of the oligosaccharide to the array chip.
Fig. 2.
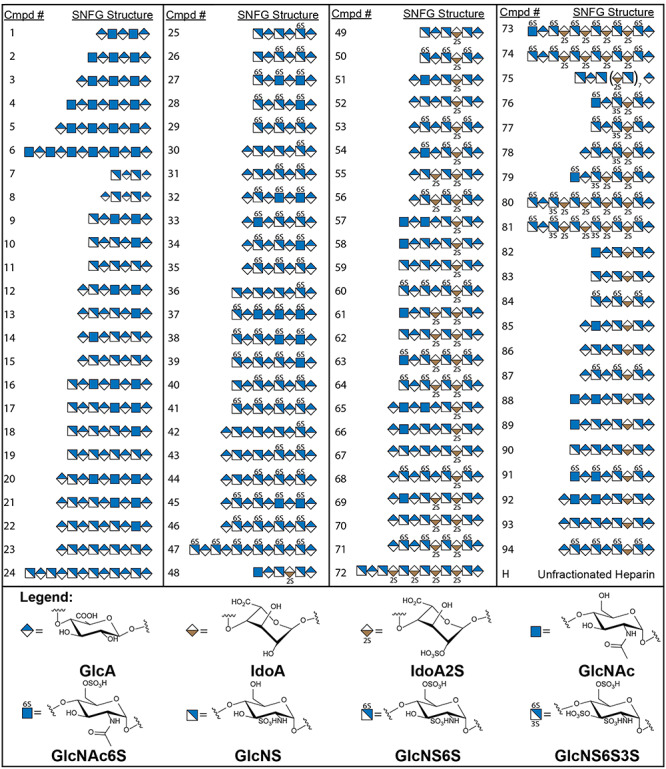
Compound numbering (Cmpd #) and symbol nomenclature for glycans (SNFG) structures on the microarray. Cmpds 1–94 are modified at the reducing end to contain an amine linker for adherence to the microarray chip.
Six nonsulfated (N-acetylated) glycans ranging in length from pentasaccharide to dodecasaccharide (Cmpds 1–6).
Eighteen oligosaccharides without O-sulfation, which contain varying levels of N-sulfation ranging from tetrasaccharide to dodecasaccharide (Cmpds 7–24).
-
Twenty-three compounds all of which contain varying levels of 6-O-sulfation (Cmpds 25–47).
Of note, these compounds also contain varying levels of N-sulfation; however, they do not contain IdoA(±2S) or 3-O-sulfation.
-
Twenty-eight IdoA2S containing oligosaccharides ranging from hexasaccharide to 18-mer (Cmpds 28–75).
These compounds are also N-sulfated and 6-O-sulfated to varying extents, but all compounds in this group contain at least one IdoA2S.
-
Six 3-O-sulfated compounds ranging in length from hexasaccharide to dodecasaccharide (Cmpds 76–81).
This group of compounds is highly sulfated due to enzyme substrate specificity and all compounds contain varying levels of N-sulfation, full 6-O-sulfation, at least one IdoA2S and at least one 3-O-sulfation.
-
Thirteen IdoA containing oligosaccharides ranging in length from hexasaccharide to nonasaccharide (Cmpds 82–94).
These compounds specifically contain an IdoA that is not 2-O-sulfated and contain varying levels of N-sulfation(±6-O-sulfation).
The 95th compound in the array is unmodified heparin (H). All oligosaccharides were attached covalently on the surface of the array chip via the reducing end as depicted in Figure 1. Although H is not specifically affixed on the NHS-coated glass slide, we are able to see several proteins recognize and show significant binding signal to the immobilized H spots; however, in some cases the protein binding to heparin on the chip is different from that observed in solutions.
The amount of each oligosaccharide was determined based on the primary amino group in its linker. Due to the small amount of glycans used, an accurate final yield was difficult to determine by standard methods. We utilized a fluorescent ninhydrin assay (Supplementary Figure S4) to determine the concentration of our final reduced glycans (Samejima et al. 1971). This method requires small amounts of sample and also corrects for any incomplete reduction. Typically, UV absorbance can be used to estimate the concentration of tagged oligosaccharides. However, an incomplete reduction would result in an inaccurate calculation due to the amino and azide tags having similar UV absorbances. Previous studies showed that azide-tagged compounds do not bind significantly to the NHS-modified glass slide; therefore, a small level of impurity would not affect the microarray (Yang et al. 2017). Concentrations were determined in triplicate, and the ninhydrin assay results were consistent and comparable to expected yields.
Binding of AT to the array chips
One benefit of having longer oligosaccharides on an array is the ability to determine the specific structures that can have a significant biological effect. On screening 10 μg/mL of fluorescently labeled AT, only Cmpds 76–81 exhibited a significant fluorescent signal corresponding to binding. The specific order of fluorescent intensities at 50 μM printing concentration was 78 > 81 = 80 = 77 > 79 > 76 > H (Figure 3A). In addition, there was a decrease in fluorescence signal for each compound at decreasing printing densities (50 > 25 > 12.5 μM). All of these oligosaccharides contain 3-O-sulfate, consistent with known structural requirement for AT binding, demonstrating specificity of this microarray technique.
Fig. 3.
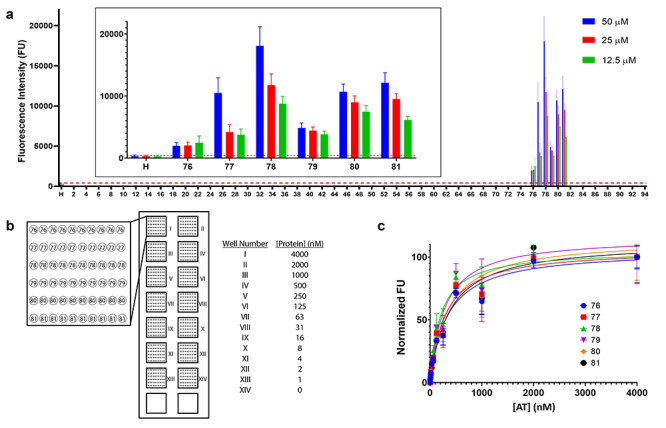
Binding of HS oligosaccharides to AT. (A) A total of 10 μg/mL fluorescently labeled AT screened against 95 compounds printed at 50 μM (blue), 25 μM (red) and 12.5 μM (green). Each compound was printed 12 times at each concentration for a total of 36 spots per compound. Results are represented as mean ± SD for each printing density. The inset is compounds that bind AT (Cmpds 76–81) and UFH (H). The binding threshold for this experiment was 440 FU and is depicted by a red dashed line. (B) Schematic representation of the microarray binding affinity assay. Compounds are arrayed into wells I–XIV in the same layout for each well and hybridized with different concentrations of protein. (C) Microarray binding affinity results for Cmpds 76–81. Results are presented as a normalized fluorescence intensity vs. concentration of AT. Compounds were printed 10 times each at 50 μM printing concentration and each point is normalized mean fluorescence intensity ± SD.
We next determined the binding affinity of six compounds simultaneously using the microarray technique to further characterize the interaction with 3-O-sulfated Cmpds 76–81. After the initial screen, new array chips were prepared that contained only Cmpds 76–81 and H. These compounds were spatially arrayed for use with a 16-well incubation chamber. The slides were incubated using 14 different concentrations (0–4 μM) of fluorescently labeled AT in wells containing identical oligosaccharide arrays (Figure 3B). After normalization, the binding affinities of the six modified compounds ranged from 199.0 to 367.9 nM (Table I). Notably, H did not show significant fluorescent signals in either the initial screen or in the binding affinity studies. We suggest that this is because H was not affixed on the surface of the array chip through its reducing end. This alternate orientation may result in an inaccessible binding site. Next, an isothermal titration calorimetry (ITC) binding measurement of two representative oligosaccharides, Cmpds 77 and 80 was conducted. AT afforded binding at 252 ± 11 and 807 ± 28 nM, respectively (Supplementary Figure S1). These data are generally consistent with the results found using our microarray technique. The HS microarray determines the binding affinity of multiple HS structures with accuracy and in high throughput.
Table I.
AT microarray binding affinity (KD,surf) and anti-Xa activity (IC50)
| Cmpd # | KD,surf ± SE (nM)a | Coefficient of determination (R2) | Anti Xa activity (IC50,nM)b |
|---|---|---|---|
| 76 | 333 ± 12 | 0.92 | 13 ± 3 |
| 77 | 289 ± 22 | 0.96 | 10 ± 1 |
| 78 | 199 ± 15 | 0.85 | 8 ± 1 |
| 79 | 273 ± 33 | 0.99 | 16 ± 7 |
| 80 | 347 ± 33 | 0.97 | 32 ± 3 |
| 81 | 368 ± 31 | 0.96 | 21 ± 3 |
| H | ND | ND | 2.5 ± 1 |
aMicroarray binding affinities are represented as KD,surf ± SE.
bAnti-Xa activity is represented as mean ± SD (n = 3).
SE, standard error.
We analyzed the anti-Xa activity of Cmpds 76–81 to demonstrate that these AT-binding oligosaccharides show anticoagulant activity. The six compounds that showed significant signal upon initial screening all showed similar anti-Xa activity ranging from 10.7 to 44.4 nM (Table I), consistent with previous reports (Wang et al. 2017). In summary, we were able to demonstrate the utility of our HS microarray by screening a well-characterized protein, determining the binding affinity of positive hits, confirming the binding affinity by ITC and showing the biological relevance by testing the anti-Xa activity of the compounds.
We did not observe the binding of H to AT in the microarray format. This is likely attributed to the orientation of H on the chip. In our view, having an in depth understanding of how the orientation of H affects the AT binding deviates from the purpose of this project. The major utility of the microarray analysis is to narrow down the oligosaccharide hits. The binding properties of the oligosaccharides should not be overinterpreted without additional biological analysis. As a research tool, whether H behaves similarly or dissimilarly to their oligosaccharide counterparts in the microarray analysis is not the limit for the technology. The binding of heparin to a target protein in solution can be carried out separately without using microarray analysis.
The binding of FGF-2 to HS microarray
FGF2, a well-characterized heparin-binding protein, was next screened to further confirm the utility of our microarray technique. The results showed that only glycans containing IdoA2S (Cmpds 48–81) residues displayed fluorescent signal when screening with 10 μg/mL FGF2 (Figure 4). These results are consistent with previous characterizations of the binding requirements of FGF2 (Rusnati et al. 1994). In addition, the structure activity relationships (SAR) can be shown using the microarray technique. For example, Cmpds 46 and 94, both 9-mers containing four N-sulfo groups and four 6-O-sulfo groups but do not contain the required IdoA2S, do not show significant fluorescence signal. However, Cmpds 68 and 71, contain one and two IdoA2S residues, respectively, and display significant signal indicating a binding event.
Fig. 4.
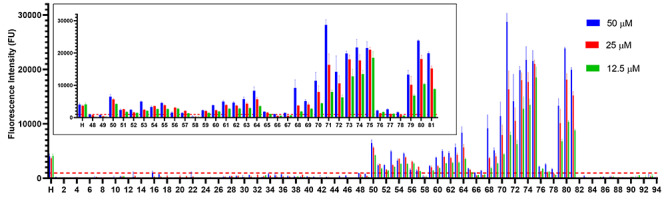
Binding of HS oligosaccharides to FGF2. Fluorescently labeled FGF2 (10 μg/mL) screened against 95 compounds printed at 50 μM (blue), 25 μM (red) and 12.5 μM (green). Each compound was printed 12 times at each concentration for a total of 36 spots per compound. Results are represented as mean ± SD for each printing density (n = 12). The inset is IdoA2S containing compounds (Cmpds 48–81) and UFH (H). The binding threshold for this experiment was 970 FU and is depicted by a red dashed line.
In addition to screening FGF2 at a single protein concentration, we also sought to determine the binding affinity of the glycans that showed significant signal. We selected 29 glycans for analysis and simultaneously screened these against 0–4 μM FGF2. The measured binding affinities varied from 4 nM for Cmpd 75 to 3 μM for Cmpd 65 (Table II and Supplementary Figure S6). The KD,surf values were comparable to previously reported values obtained by a similar technique with chemically synthesized HS oligosaccharides in a microtiter plate (Maza et al. 2012). Based on these results, it was clear that FGF2 shows a difference in affinity depending on the sulfation pattern. As an example, the 8-mer series shows that the relative binding affinity of Cmpds 58 > > 61 > 63 > 79. This trend is consistent with previous literature stating that FGF2 requires GlcNS and IdoA2S for binding and although 6-O- and 3-O-sulfation can enhance binding, they are not required for binding (Guimond et al. 1993).
Table II.
FGF2 microarray binding affinity (KD,surf) and maximum fluorescence (Fmax) determinations
| Cmpd | KD (nM) | F max (FU) | R2 | Cmpd | KD (nM) | F max (FU) | R2 | Cmpd | KD (nM) | F max (FU) | R2 |
|---|---|---|---|---|---|---|---|---|---|---|---|
| H | 102 | 798 | 0.79 | 60 | 206 | 3152 | 0.79 | 70 | 94 | 7217 | 0.95 |
| 50 | 968 | 6658 | 0.91 | 61 | 152 | 5284 | 0.90 | 71 | 112 | 6305 | 0.90 |
| 52 | 1605 | 2719 | 0.96 | 62 | 103 | 6820 | 0.96 | 72 | 25 | 13050 | 0.95 |
| 53 | 377 | 6286 | 0.96 | 63 | 37 | 3780 | 0.80 | 73 | 49 | 14460 | 0.94 |
| 54 | 556 | 5450 | 0.97 | 64 | 64 | 4750 | 0.81 | 74 | 69 | 15402 | 0.96 |
| 55 | 105 | 1350 | 0.68 | 65 | 3157 | 4334 | 0.53 | 75 | 4 | 8187 | 0.74 |
| 56 | 97 | 3423 | 0.85 | 66 | 2691 | 4747 | 1.00 | 79 | 23 | 4336 | 0.81 |
| 57 | 1345 | 2738 | 0.98 | 67 | 1434 | 3273 | 0.97 | 80 | 26 | 9706 | 0.85 |
| 58 | 2996 | 4601 | 1.00 | 68 | 355 | 3549 | 0.89 | 81 | 43 | 24169 | 0.97 |
| 59 | 1614 | 3287 | 0.97 | 69 | 126 | 5462 | 0.95 |
Other proteins
After the array was validated with AT and FGF2, it was used to screen other proteins with less characterized binding profiles. IL-12 is a central regulator of human immunity and is a heparin-binding protein (Hasan et al. 1999). A previous collaboration with our laboratory published data of IL-12 with a 52-compound microarray, which showed longer, more highly sulfated compounds displaying the highest signal (Nguyen et al. 2019). Similar results were determined with the 95-compound array (Figures 5A and 6C). Of note, four new compounds were identified that were not present on the previous array. These newly identified Cmpds 56, 63, 64 and 79 are highly sulfated with more than two sulfate groups per disaccharide unit and therefore are consistent with the previous results.
Fig. 5.
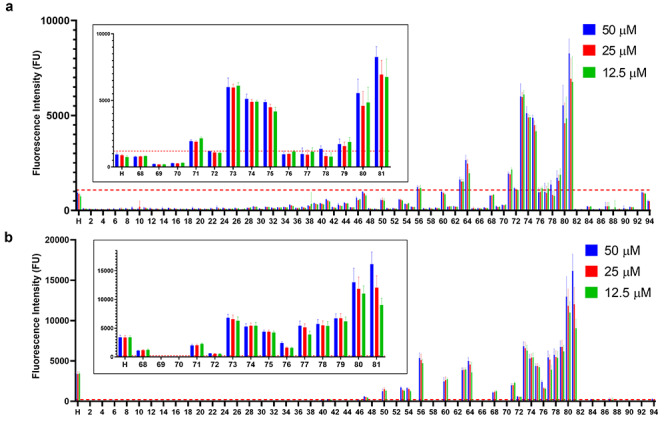
Binding of HS oligosaccharides to IL-12 and PF4. (A) A total of 10 μg/mL fluorescently labeled IL-12 screened against 95 compounds printed at 50 μM (blue), 25 μM (red) and 12.5 μM (green). The binding threshold for this experiment was 1190 FU and is depicted by a red dashed line. (B) 10 μg/mL fluorescently labeled PF4 screened against 95 compounds printed at 50 μM (blue), 25 μM (red) and 12.5 μM (green). The binding threshold for this experiment was 230 FU and is depicted by a red dashed line. For bar graphs A and B, each compound was printed 12 times at each concentration for a total of 36 spots per compound. Results are represented as mean ± SD for each printing density (n = 12). The insets are Cmpds 68–81 and H.
Fig. 6.
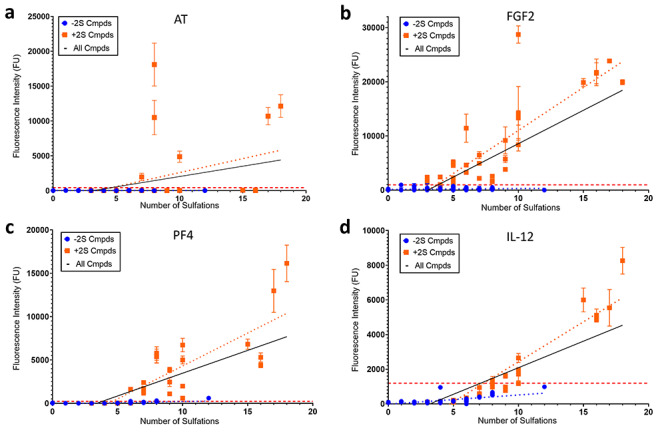
Scatter plots of the 50 μM printing density observed fluorescence intensity (FU) vs. number of sulfations per compound for (A) 10 μg/mL AT, (B) 10 μg/mL FGF-2, (C) 10 μg/mL PF-4 and (D) 10 μg/mL IL-12. Each plot contains a best-fit line computed by linear regression for Cmpds 1–47 and 82–94, which do not contain IdoA2S (blue dotted line) and Cmpds 48–81, which do contain IdoA2S (orange dotted line). The solid black line is the best-fit line for linear regression of all compounds (1–94). The binding threshold is portrayed by a horizontal dashed red line. Linear regression was performed by GraphPad Prism 8.0. Each point is the mean ± SD (n = 12).
PF4 is a cationic protein involved in an adverse effect of heparin therapy known as heparin-induced thrombocytopenia (HIT) (Amiral et al. 1992). On screening with 10 μg/mL PF4, an electrostatic interaction was observed. Compounds with various sulfation patterns were able to bind, but longer, more highly charged compounds showed the highest fluorescent signals (Figures 5B and 6D). The significance of the combination of 2-O-sulfation with 6-O-sulfation is displayed by the 12-mer series: Cmpds 24 < 47 = 72 < 74 < 81. Compounds containing NS6S or NS2S (Cmpds 47 and 72, respectively) display similar fluorescence intensities. However, with NS6S2S (Cmpd 74), the signal increases ~8-fold and the signal is further increased upon addition of 3-O-sulfation (Cmpd 81).
Lastly, we attempted to determine the correlation between number sulfations and fluorescence intensity for different proteins (Figure 6 and Table III). PF4 and IL-12 behave similarly in that they have a mediocre R2 values (0.43 and 0.44, respectively) for compounds not containing IdoA2S and 0.68 and 0.87, respectively, for compounds containing IdoA2S. Data suggest that there is a correlation between sulfation and binding, whereas the binding correlation appears to be stronger when IdoA2S residues are present in the oligosaccharides. FGF2 on the other hand has a low R2 value (0.01) for compounds that do not contain IdoA2S, but an R2 value of 0.69 for compounds containing IdoA2S, indicating a preference of IdoA2S for binding. The data suggest that the correlation exits when the IdoA2S residue is present. AT has a highly specific interaction represented by a low R2 value (0.00–0.16) including when controlling for the presence of IdoA2S, suggesting that the sulfation and binding are not correlated.
Table III.
Linear regression results for fluorescence intensity vs. sulfation level of AT, FGF2, PF4 and IL-12
| Protein | Cmpds 1–47 and 82–94 (−IdoA2S) | Cmpds 48–81 (+IdoA2S) | All compounds (±IdoA2S) | Comments | |||||||||
|---|---|---|---|---|---|---|---|---|---|---|---|---|---|
| Slope | Intercept | P-value | R2 | Slope | Intercept | P-value | R2 | Slope | Intercept | P-value | R2 | ||
| AT | 0.3 | 14.4 | 0.45 | 0.00 | 401.7 | -1428 | <0.0001 | 0.14 | 295.8 | -926.9 | <0.0001 | 0.16 | Requires 3-O-sulfation |
| FGF2 | 16.8 | 117.4 | 0.0045 | 0.01 | 1590.0 | -4886 | <0.0001 | 0.69 | 1234.0 | -3766 | <0.0001 | 0.58 | Requires IdoA2S |
| PF4 | 26.3 | -55.8 | <0.0001 | 0.43 | 759.1 | -3283 | <0.0001 | 0.68 | 525.7 | -1779 | <0.0001 | 0.55 | Electrostatic interaction, Cmpd 47 > binding threshold |
| IL-12 | 53 | -16.4 | <0.0001 | 0.44 | 461.6 | -2186 | <0.0001 | 0.87 | 306.6 | -979.3 | <0.0001 | 0.68 | Electrostatic interaction, Cmpd 47 < binding threshold |
Discussion
Determining the specific HS sequence required for binding to a protein is an important aim in HS and heparin-related research. Combining chemoenzymatic synthesis and microarray techniques facilitate the rapid progression toward this goal. Herein we have developed a method for screening a diverse array of specific HS glycans against several proteins. We have also simultaneously characterized the binding affinity of 29 HS structures, and the results are consistent with previous literature. We believe that this will be a valuable tool for characterizing the biological significance of HS binding interactions in future studies.
The microarray presented in this paper contains large structural diversity in terms of the chain length, sulfation patterns and printing densities. We have shown that the array is sufficiently diverse to demonstrate SAR down to the presence of a single sulfo group drastically changing the recognition and binding to a heparin-binding protein. This level of detail should produce valuable information for those interested in substrate recognition and other biological questions. One proposed method of value is the determination of positive and negative controls that are very similar in structure, differing in a single sulfo group. In addition, we were able to show increased utility of the microarray technique by determining the binding affinity of compounds and have shown that this technique will be valuable in not only determining compounds that bind, but also how strongly they bind. As seen in Tables I and II, the previously held notion that a higher fluorescent signal at a single concentration is indicative of increased binding affinity (Noti et al. 2006; Liu et al. 2019) may not always be true. Supplementary Figure S2A and B plot the calculated maximum fluorescence intensity (Fmax) observed in the microarray binding studies vs. the calculated surface dissociation constant (KD,surf), and there is no observed correlation between these measurements. We also have evidence to suggest that all proteins will not behave the same in microarray binding affinity studies, which may be indicative of protein function (Supplementary Figure S2C and D). For example, it is unclear why the binding of PF4 to HS on the array is different from those observed for FGF2 and AT.
Compounds were printed at different spot densities to add to the diversity and complexity of the array. In most cases, a decrease in fluorescence signal was observed with a decrease in printing density. One of the main advantages of using a microarray approach is the relatively small amount of ligand required for screening. A top printing density of 50 μM was selected to provide sufficient signal (>10× background). Concentrations >50 μM begin to plateau and do not produce more fluorescence signal (Yang et al. 2017). A 4-fold reduction (50–12.5 μM) in printing concentration is sufficient to produce a significant decrease in fluorescence signal, therefore demonstrating that a binding event is real.
AT is one of the most well-characterized heparin-binding proteins. Heparin binds to AT, catalyzing the inactivation of Factor Xa. When Factor Xa is inactivated, the result is a decreased production of thrombin and decreased coagulation (Jin et al. 1997). The compounds on the array that bind to AT (Cmpds 76–81) all contained the required pentasaccharide sequence containing a 3-O-sulfated glucosamine residue. It can clearly be seen that there is no correlation between the binding fluorescence intensity and sulfation density (number of sulfo groups per saccharide). For example, Cmpd 78 has significant fluorescence signal while its sulfation density is only 1.14. Cmpd 74 has a higher sulfation density of 1.33, but it merely has a background fluorescence signal (Supplementary Table SII). These results show the importance of understanding the structural determinants of HS binding because one sulfo group at a specific site on a specific residue is responsible for the recognition and action of a naturally occurring anticoagulant.
In addition, the binding affinities of AT were determined using a microarray technique. Similar submicromolar binding affinities for Cmpds 76–81 in a range of 199 to 368 nM were determined (Table I). ITC was used to compare the surface AT binding affinity determinations for 77 and 80 to a solution phase study. The equilibrium dissociation constant (KD) for 77 and 80 measured by ITC was 0.3 and 0.8 μM, respectively, consistent with the KD,surf determination. This technique is beneficial in further characterizing HS-binding interactions and can be simultaneously determined for multiple oligosaccharides.
FGF2 is a high-affinity heparin-binding protein that has been characterized to bind specifically to IdoA2S-containing HS and this result was confirmed by our microarray. Although 6-O-sulfation and 3-O-sulfation are not required for binding to FGF2, they can enhance the interaction as shown by an increase in fluorescence. The array contains several IdoA compounds that are epimerized, but not 2-O-sulfated (Cmpds 82–94). However, even though the analogous IdoA2S compound (i.e., Cmpd 53) shows fluorescent signal, the IdoA compound (i.e., Cmpd 87) is unable to bind, once again showing that a specific modification on a specific residue can influence the interaction. The 29 IdoA2S-containing compounds showed a fluorescence signal above background. Binding affinities (KD,surf) were determined to further characterize the interaction between FGF2 and the 29 compounds. Turnbull et al. isolated a high-affinity binding HS oligosaccharide and determined that N-sulfate groups and IdoA2S were essential for binding to FGF2 (Turnbull et al. 1992). This finding is consistent with our results as Cmpd 75, an 18-mer with repeating IdoA2S–GlcNS, displays the highest binding affinity in our binding affinity studies (4 nM).
A full listing of FGF2 binding affinity results can be found in Table II, but here, we will discuss a series of 8-mers that show an increasing binding affinity with the addition of sulfo groups at specific positions. Cmpd 58 contains a single IdoA2S unit and no 6-O-sulfation. This compound shows a low binding affinity for FGF2 of about 3 μM. As mentioned earlier, a similar 8-mer with an unsulfated IdoA is on the array (89), but does not show a fluorescence signal, indicating no significant binding. With the addition of another IdoA2S, Cmpd 61 improved its binding affinity 20-fold without significantly changing the maximum fluorescence intensity (Fmax = 4600 and 5200 FU, respectively). Adding 6-O-sulfation (63) improves the binding affinity about 2-fold, and adding 3-O-sulfation (79) further improves the binding affinity 2-fold with a final KD,surf determination of 23 nM. The addition of 6-O-sulfation does not always increase the binding affinity. For example, the analogous 12-mers show a lower binding affinity for 6-O-sulfated Cmpd 74 compared with 72 (69 vs. 25 nM, respectively). Previous studies on a similar chemoenzymatically synthesized heptasaccharide containing the same sulfation pattern as 56 but with a different tag, afforded a KD of 200 ± 4 nM using affinity coelectrophoresis (Xu et al. 2012). Surface plasmon resonance studies show the binding affinity of HS to FGF2 is 35 nM (Chen et al. 2005). The resulting KD,surf determined by the microarray technique was within this range for 14 out of 29 compounds tested, including 56. These results demonstrate the reliability and consistency of the microarray binding affinity determination.
Other proteins were screened against the 95-glycan microarray at a single concentration (10 μg/mL). A recent publication screened IL-12 against a 52-glycan microarray (Nguyen et al. 2019). The results indicated that longer, more highly sulfated oligosaccharides were the best binding partners of IL-12. The same protein was screened using our 95-glycan microarray and resulted in similar binding results. The 52-glycan microarray previously studied contains all of the 12-mers and one 18-mer that are on the 95-glycan microarray; so, no improved binding partners were detected. However, four shorter, highly sulfated glycans (Cmpds 56, 63, 64 and 79) were able to be detected by expanding the array from 52 to 95 glycans.
PF4, a positively charged, tetrameric protein was also screened using the microarray technique. The microarray shows that the binding between HS and PF4 is an electrostatic interaction and is dependent on overall charge. Figure 6 and Table III describe the fluorescence intensity vs. number of sulfations and show a significant positive correlation for all proteins tested (P < 0.0001) when including all compounds. Longer, more highly sulfated glycans showed the highest fluorescence activity. However, when the background threshold (10× background) was considered, PF4 is the only protein in this study to bind Cmpd 47, a NS6S 12-mer with 12 sulfations. Alternatively, the 3-O-sulfated AT binding oligosaccharides (Cmpds 76–81) are highly sulfated and bind to both AT and PF4. We would hope to find a compound that binds AT and not PF4 to potentially reduce the risk of HIT, but this array did not produce such a compound. Lastly, PF4 shows a distinct profile for the microarray binding affinity experiment (Supplementary Figure S2C and D). We expected to see a sigmoidal-shaped curve with the fluorescence intensity reaching a maximum and remaining constant. However, what we observe is an increase, followed by a decrease in observed fluorescence intensity as concentration increases. We are not certain if this is due to a decrease in binding due to electrostatic repulsion at higher concentrations or perhaps due to a change in fluorescence observed (Suvarna et al. 2007). Further studies will need to be done in order to understand this serendipitous result.
In the future, we plan to expand the complexity of the array to include more HS diversity in terms of length and sulfation. In addition, we will expand beyond HS structures and include other glycosaminoglycans (GAGs), specifically chemoenzymatically synthesized chondroitin sulfate glycans (Li et al. 2017). We also plan to expand our capabilities to detect binding of complex targets beyond individual proteins and screen bacteria and viruses. We specifically chose to deal with fluorescently labeled proteins in this study. However, using unlabeled proteins with primary or secondary labeled antibodies can be used as an alternate method of detection, if necessary (Hyun et al. 2017). Utilizing these techniques, our microarray can be rapidly expanded to include more structures that will detect the specific binding motifs of many more GAG-binding structures.
In conclusion, we have developed a high-throughput HS microarray that is able to screen heparin-binding proteins. The results determined by the array are consistent with previous literature but we were also able to detect previously unreported binding structures. We also adapted our glycan microarray to determine HS binding affinity in a high-throughput format. This technique will be highly valuable to academia and industry to rapidly advance our understanding of GAG–macromolecule interactions. Since GAG’s are ubiquitously expressed on mammalian cells, GAG mimetics are of increasing interest in drug development (Paderi et al. 2018). Development and utilization of high-throughput tools will allow for increased characterization and more rapid development of useful therapeutics in a wide variety of disease states.
Materials and methods
Compounds
The compounds on the array are chemoenzymatically synthesized (Xu et al. 2011) and commercially available via Glycan Therapeutics (www.GlycanTherapeutics.com). Azide-tagged oligosaccharides were reduced with palladium on carbon (Pd/C) catalyzed hydrogenation to produce the amino-modified glycans. Each azide-modified oligosaccharide (200 μg) was dissolved in 200 μL of water in a flask. Approximately 0.25 mg of Pd/C was added to the solution and the reaction vessel was vacuumed and refilled with H2 three times. The solution was stirred under hydrogen balloon pressure for 4 h. The reduction was monitored by mass spectrometry (Supplementary Table SI, Supplementary Figure S3). If the reaction was incomplete at 4 h, it was allowed to continue until completion as determined by electrospray ionization–mass spectrometry. The final solution was filtered with a 0.2-μm syringe filter, lyophilized and diluted with 50 mM phosphate buffer (pH = 8.5). Final stock solutions were stored at −20°C.
Determination of concentration
A fluorescent ninhydrin assay was utilized to determine the concentration of amino-modified sugar in each stock solution (Supplementary Figure S4B). Stock solution (5–10 μL) of amino-tagged HS was diluted to 100 μL with 50 mM phosphate buffer (pH = 8.5). In a 96-well plate, the sample was mixed with 75 μL of ninhydrin dissolved in dimethyl sulfoxide/phosphate buffer and 75 μL of phenylacetylaldehyde dissolved in ethanol. The mixture was shaken at 60°C for 30 min, allowed to cool and fluorescence intensity was measured (excitation 390 nm, emission 490 nm). The resulting concentrations were extrapolated from a standard curve of β-alanine (Supplementary Figure S4A).
Microarray printing
HS oligosaccharides were spatially arrayed by a S11 robotic arrayer (Scienion Aldrich, St. Louis, MO, USA) onto a dry NHS-functionalized glass slide (Nexterion Slide H). Each compound was printed with 36 spots in a 6 × 6 square. Each square contains 3 sets of 12 spots, with each set consisting of a different printing density (12.5, 25 and 50 μM). After printing, slides were incubated overnight at room temperature (RT) in a saturated (NH4)2SO4 humidity chamber (relative humidity = 81%). Unreacted oligosaccharides were removed by washing with water and unreacted NHS sites were blocked by ethanolamine (Aldrich). Slides were stored at RT.
Preparation of fluorescently labeled proteins
Fluorescently labeled protein was prepared by direct labeling with Alexa Fluor 488 NHS Ester (Thermo Scientific, Waltham, MA, USA). Protein (100 μg) was mixed with three equivalents of heparin and 100 mM NaHCO3. The mixture was allowed to equilibrate for 15 min at RT followed by the addition of 3–10 equivalents of Alexa Fluor 488 NHS Ester. The reaction was left to proceed at RT for 1 h. The reaction mixture was purified by heparin column and buffer exchanged [phosphate-buffered saline (PBS)] using a centrifugal filter. The efficiency of labeling was visualized by fluorescence Sodium dodecyl sulfate-polyacrylamide gel electrophoresis gel (Supplementary Figure S5). Final concentration and degree of labeling was confirmed by the absorbance spectrum obtained by NanoDrop OneC Spectrophotometer (Thermo Scientific).
Microarray slide hybridization
A 10 μg/mL solution of fluorescently labeled protein was prepared by diluting the protein in a phosphate-buffered saline with Tween 20 (PBST)/Tris/bovine serum albumin (BSA) solution (PBS, 0.05% Tween 20, 20 mM Tris, 10% BSA, pH = 7.5). The mixture (100 μL) was placed between the arrayed glass slide and a coverslip. The hybridization was carried out for 1 h in a humidity chamber. The slide was washed by shaking in a PBST solution containing 1% BSA and 20 mM Tris. Lastly, the slide was rinsed with water and dried by centrifugation.
Scanning microarray slides
Hybridized slides were scanned by a GenePix Pro 4300A scanner (Molecular Devices). Slides were scanned using a 488-nm laser and analyzed by GenePix Pro software.
Microarray binding affinity
Positive hits as determined by the initial screen were spatially arrayed in a format compatible with a 16-well–FAST slide incubation chamber (GVS Filter Technology, Morecambe, UK). 50 μM of oligosaccharides (7 compounds for AT and 29 compounds for FGF2) were printed 14 times per slide in the same layout. The inactive areas of the slide were blocked with ethanolamine as before. 100 μL of fluorescently labeled protein (0–4 μM, 2-fold serial dilutions, i.e., 4, 2, 1... 4, 2, 1, 0 nM) was pipetted into individual wells and allowed to incubate for 1 h. The protein solution was gently washed with water, then PBST containing 1% BSA, then rinsed with water again and dried by centrifugation. The plate was read as before, and the average fluorescence intensity was plotted against the concentration of the fluorescently labeled protein. The binding affinity was determined using GraphPad Prism 8 version 8.2.0. The resulting curves were analyzed as Langmuir isotherms (Liang et al. 2007) using equation 1:
 |
(1) |
Where F is the fluorescence intensity, Fmax is the maximum fluorescence, [P] is the concentration of protein and KD,surf is the binding affinity.
Anti-Xa activity
The Anti-Xa assay is a chromogenic assay based on a previously reported method (Duncan et al. 2004). Human Factor Xa (Enzyme Research Laboratories) was diluted to 2 μg/mL in PBS. S-2765 (Chromogenix, Bedford, MA, USA), a chromogenic substrate, was diluted to 1 mg/mL. Oligosaccharides were diluted to concentrations of 0–10 μM. An average molecular weight of 16 000 D was used for heparin (Mulloy et al. 2014). Lastly, an AT solution was made consisting of 0.03 mg/mL AT and 1 mg/mL BSA in PBS. Oligosaccharide solution (5 μL) was mixed with 60 μL of the AT/BSA solution and shaken in a 95-well plate for 2 min. Then, the Factor Xa solution (100 μL) was added and shaken for 4 min. Lastly, S-2765 (30 μL) solution was added and the absorbance was immediately measured at 405 nm continuously for 2 min. The maximum slope was plotted against the concentration of oligosaccharide to determine the IC50 values.
ITC
The KD of 77 and 80 vs. AT was determined by ITC. The oligosaccharide was dialyzed in 100 mM sodium phosphate buffer. The protein was concentrated using the same buffer in a centrifugal filter. The instrument used was a MicroCal Auto-ITC200 and the software was Micro Analyzer ITC 200. For the experiment, 200 μL of 10 μM AT (unlabeled) was added to a sample cell and titrated with 40 μL of oligosaccharide (100 μM) in 2-μL increments over 1 h. The titration curve of kcal/mol vs. molar ratio (oligo/protein) was obtained by measuring the heat generated after injection of 2 μL oligosaccharide, integrating with respect to time and normalizing for concentration. The KD values were determined by fitting the thermodynamic data for the binding enthalpy (ΔH) during titration. Results are presented as the mean ± standard deviation (SD) (n = 2).
Supplementary Material
Funding
National Institutes of Health (R01HL094463, R01 HL144970, R41 GM123792, R42 GM128484).
Conflict of Interest
Y.X. and J.L. are founders for Glycan Therapeutics. V.P. is an employee and hold equity of Glycan Therapeutics. Y.X. and J.L. is the principle scientist for National Institutes of Health STTR grants R42 GM128484 and R41 GM123792, respectively. V.P. is the principle scientist for National Institutes of Health SBIR grant R44 HL139187 and R44GM134738. Other authors declare no competing interest.
Abbreviations
AT, antithrombin; BSA, bovine serum albumin; Cmpd(s), compound(s); FGF2, fibroblast growth factor 2; GAG, glycosaminoglycan; GlcN, glucosamine; GlcNS, N-sulfated glucosamine; H, heparin; HIT, heparin-induced thrombocytopenia; HS, heparan sulfate; IL-12, interleukin 12; IdoA, iduronic acid; IdoA2S, 2-O-sulfated iduronic acid; ITC, isothermal titration calorimetry; KD, equilibrium dissociation constant; NHS,N-hydroxysuccinimide; PBS, phosphate-buffered saline; PBST, phosphate-buffered saline with Tween 20; PF4, platelet factor 4; Pd/C, palladium on carbon; PO4, phosphate; SAR, structure activity relationship; RT, room temperature; SD, standard deviation; SE, standard error; UFH, unfractionated heparin; UV, ultraviolet.
References
- Amiral J, Bridey E, Dreyfus M, Vissac AM, Fressinaud E, Wolf M, Meyer D. 1992. Platelet factor 4 complexed to heparin is the target for antibodies generated in heparin-induced thrombocytopenia. Thromb Haemost. 68(1):95–96. doi: 10.1055/s-0038-1656329. [DOI] [PubMed] [Google Scholar]
- Atha DH, Lormeau JC, Petitou M, Choay J, Rosenberg RD. 1985. Contribution of monosaccharide residues in heparin binding to antithrombin III. Biochemistry. 24(23):6723–6729. doi: 10.1021/bi00344a063. [DOI] [PubMed] [Google Scholar]
- Bishop JR, Schuksz M, Esko JD. 2007. Heparan sulphate proteoglycans fine-tune mammalian physiology. Nature. 446(7139):1030–1037. doi: 10.1038/nature05817. [DOI] [PubMed] [Google Scholar]
- Chen J, Avci FY, Muñoz EM, McDowell LM, Chen M, Pedersen LC, Zhang L, Linhardt RJ, Liu J. 2005. Enzymatic redesigning of biologically active heparan sulfate. J Biol Chem. 280(52):42817–42825. doi: 10.1074/jbc.M504338200. [DOI] [PMC free article] [PubMed] [Google Scholar]
- Coombe DR, Kett WC. 2005. Heparan sulfate-protein interactions: Therapeutic potential through structure-function insights. Cell Mol Life Sci. 62(4):410–424. doi: 10.1007/s00018-004-4293-7. [DOI] [PMC free article] [PubMed] [Google Scholar]
- Dulaney SB, Xu Y, Wang P, Tiruchinapally G, Wang Z, Kathawa J, El-Dakdouki MH, Yang B, Liu J, Huang X. 2015. Divergent synthesis of Heparan sulfate oligosaccharides. J Org Chem. 80(24):12265–12279. doi: 10.1021/acs.joc.5b02172. [DOI] [PMC free article] [PubMed] [Google Scholar]
- Duncan MB, Chen J, Krise JP, Liu J. 2004. The biosynthesis of anticoagulant heparan sulfate by the heparan sulfate 3-O-sulfotransferase isoform 5. Biochim Biophys Acta - Gen Subj. 1671(1–3):34–43. doi: 10.1016/j.bbagen.2003.12.010. [DOI] [PubMed] [Google Scholar]
- Guimond S, Maccarana M, Olwin BB, Lindahl U, Rapraeger AC. 1993. Activating and inhibitory heparin sequences for FGF-2 (basic FGF). Distinct requirements for FGF-1, FGF-2, and FGF-4. J Biol Chem. 268(32):23906–23914. Accessed October 17, 2019. http://www.ncbi.nlm.nih.gov/pubmed/7693696. [PubMed] [Google Scholar]
- Hasan M, Najjam S, Gordon MY, Gibbs RV, Rider CC. 1999. IL-12 is a heparin-binding cytokine. J Immunol. 162(2):1064–1070. Accessed October 21, 2019. http://www.ncbi.nlm.nih.gov/pubmed/9916734. [PubMed] [Google Scholar]
- Hyun JY, Pai J, Shin I. 2017. The glycan microarray story from construction to applications. Acc Chem Res. 50(4):1069–1078. doi: 10.1021/acs.accounts.7b00043. [DOI] [PubMed] [Google Scholar]
- Jin L, Abrahams JP, Skinner R, Petitou M, Pike RN, Carrell RW. 1997. The anticoagulant activation of antithrombin by heparin. Proc Natl Acad Sci U S A. 94(26):14683–14688. doi: 10.1073/pnas.94.26.14683. [DOI] [PMC free article] [PubMed] [Google Scholar]
- de Paz JL, Moseman EA, Noti C, Polito L, von Andrian UH, Seeberger PH. 2007. Profiling heparin-chemokine interactions using synthetic tools. ACS Chem Biol. 2(11):735–744. [DOI] [PMC free article] [PubMed] [Google Scholar]
- Li J, Su G, Liu J. 2017. Enzymatic synthesis of homogeneous chondroitin sulfate oligosaccharides. Angew Chem Int Ed. 56(39):11784–11787. doi: 10.1002/anie.201705638. [DOI] [PMC free article] [PubMed] [Google Scholar]
- Liang PH, Wang SK, Wong CH. 2007. Quantitative analysis of carbohydrate-protein interactions using glycan microarrays: Determination of surface and solution dissociation constants. J Am Chem Soc. 129(36):11177–11184. doi: 10.1021/ja072931h. [DOI] [PubMed] [Google Scholar]
- Liu H, Joshi A, Chopra P, Liu L, Boons G-J, Sharp JS. 2019. Salt-free fractionation of complex isomeric mixtures of glycosaminoglycan oligosaccharides compatible with ESI-MS and microarray analysis. Sci Rep. 9(1):16566. doi: 10.1038/s41598-019-53070-z. Accessed November 19, 2019. http://www.nature.com/articles/s41598-019-53070-z. [DOI] [PMC free article] [PubMed] [Google Scholar]
- Maza S, MacChione G, Ojeda R, López-Prados J, Angulo J, De Paz JL, Nieto PM. 2012. Synthesis of amine-functionalized heparin oligosaccharides for the investigation of carbohydrate-protein interactions in microtiter plates. Org Biomol Chem. 10(10):2146–2163. doi: 10.1039/c2ob06607f. [DOI] [PubMed] [Google Scholar]
- Mulloy B, Heath A, Shriver Z, Jameison F, Al Hakim A, Morris TS, Szajek AY. 2014. USP compendial methods for analysis of heparin: Chromatographic determination of molecular weight distributions for heparin sodium. Anal Bioanal Chem. 406(20):4815–4823. doi: 10.1007/s00216-014-7940-3. [DOI] [PubMed] [Google Scholar]
- Nguyen KG, Gillam FB, Hopkins JJ, Jayanthi S, Gundampati RK, Su G, Bear J, Pilkington GR, Jalah R, Felber BK et al. 2019. Molecular mechanisms of heparin-induced modulation of human interleukin 12 bioactivity. J Biol Chem. 294(12):4412–4424. doi: 10.1074/jbc.RA118.006193. Accessed October 16, 2019. http://www.jbc.org/cgi/doi/10.1074/jbc.RA118.006193. [DOI] [PMC free article] [PubMed] [Google Scholar]
- Noti C, De Paz JL, Polito L, Seeberger PH. 2006. Preparation and use of microarrays containing synthetic heparin oligosaccharides for the rapid analysis of heparin-protein interactions. Chem - A Eur J. 12(34):8664–8686. doi: 10.1002/chem.200601103. [DOI] [PubMed] [Google Scholar]
- Paderi J, Prestwich GD, Panitch A, Boone T, Stuart K. 2018. Glycan therapeutics: Resurrecting an almost Pharma-forgotten drug class. Adv Ther. 1(8):1800082. doi: 10.1002/adtp.201800082. Accessed October 15, 2019. www.advancedsciencenews.com. [DOI] [Google Scholar]
- Park S, Shin I. 2007. Carbohydrate microarrays for assaying galactosyltransferase activity. Org Lett. 9(9):1675–1678. doi: 10.1021/ol070250l. [DOI] [PubMed] [Google Scholar]
- Park TJ, Lee MY, Dordick JS, Linhardt RJ. 2008. Signal amplification of target protein on heparin glycan microarray. Anal Biochem. 383(1):116–121. doi: 10.1016/j.ab.2008.07.037. 10.1016/j.ab.2008.07.037. [DOI] [PMC free article] [PubMed] [Google Scholar]
- De Paz JL, Noti C, Seeberger PH. 2006a. Microarrays of synthetic heparin oligosaccharides. J Am Chem Soc. 128(9):2766–2767. doi: 10.1021/ja057584v. [DOI] [PubMed] [Google Scholar]
- De Paz JL, Spillmann D, Seeberger PH. 2006b. Microarrays of heparin oligosaccharides obtained by nitrous acid depolymerization of isolated heparin. Chem Commun. (29):3116–3118. doi: 10.1039/b605318a. [DOI] [PubMed] [Google Scholar]
- Rusnati M, Coltrini D, Caccia P, Dell’era P, Zoppetti G, Oreste P, Valsasina B, Presta M. 1994. Distinct role of 2-O-, N-, and 6-O-sulfate groups of heparin in the formation of the ternary complex with basic fibroblast growth factor and soluble FGF receptor-1. Biochem Biophys Res Commun. 203(1):450–458. doi: 10.1006/bbrc.1994.2203. [DOI] [PubMed] [Google Scholar]
- Samejima K, Dairman W, Stone J, Udenfriend S. 1971. Condensation of ninhydrin with aldehydes and primary amines to yield highly fluorescent ternary products. II. Application to the detection and assay of peptides, amino acids, amines, and amino sugars. Anal Biochem. 42(1):237–247. doi: 10.1016/0003-2697(71)90031-5. [DOI] [PubMed] [Google Scholar]
- Sarrazin S, Lamanna WC, Esko JD. 2011. Heparan sulfate proteoglycans. Cold Spring Harb Perspect Biol. 3(7):1–33. doi: 10.1101/cshperspect.a004952. [DOI] [PMC free article] [PubMed] [Google Scholar]
- Shipp EL, Hsieh-Wilson LC. 2007. Profiling the Sulfation specificities of glycosaminoglycan interactions with growth factors and chemotactic proteins using microarrays. Chem Biol. 14(2):195–208. doi: 10.1016/j.chembiol.2006.12.009. [DOI] [PubMed] [Google Scholar]
- Suvarna S, Espinasse B, Qi R, Lubica R, Poncz M, Cines DB, Wiesner MR, Arepally GM. 2007. Determinants of PF4/heparin immunogenicity. Blood. 110(13):4253–4260. doi: 10.1182/blood-2007-08-105098. Accessed June 6, 2020. https://ashpublications.org/blood/article/110/13/4253/103211/Determinants-of-PF4heparin-immunogenicity. [DOI] [PMC free article] [PubMed] [Google Scholar]
- Turnbull JE, Fernig DG, Ke Y, Wilkinson MC, Gallagher JG. 1992. Identification of the basic fibroblast growth factor binding sequence in fibroblast heparan sulfate. J Biol Chem. 267(15):10337–10341. doi: 10.1042/BJ20042129. Accessed June 6, 2020. https://www.jbc.org/content/267/15/10337. [DOI] [PubMed] [Google Scholar]
- Varki A. 2017. Biological roles of glycans. Glycobiology. 27(1):3–49. doi: 10.1093/glycob/cww086. [DOI] [PMC free article] [PubMed] [Google Scholar]
- Wang Z, Hsieh PH, Xu Y, Thieker D, Chai EJE, Xie S, Cooley B, Woods RJ, Chi L, Liu J. 2017. Synthesis of 3-O-sulfated oligosaccharides to understand the relationship between structures and functions of Heparan sulfate. J Am Chem Soc. 139(14):5249–5256. doi: 10.1021/jacs.7b01923. [DOI] [PMC free article] [PubMed] [Google Scholar]
- Whitelock JM, Iozzo RV. 2005. Heparan sulfate: A complex polymer charged with biological activity. Chem Rev. 105(7):2745–2764. doi: 10.1021/cr010213m. [DOI] [PubMed] [Google Scholar]
- Xu Y, Masuko S, Takieddin M, Xu H, Liu R, Jing J, Mousa SA, Linhardt RJ, Liu J. 2011. Chemoenzymatic synthesis of homogeneous ultralow molecular weight heparins. Science (80- ). 334(6055):498–501. doi: 10.1126/science.1207478. [DOI] [PMC free article] [PubMed] [Google Scholar]
- Xu Y, Wang Z, Liu R, Bridges AS, Huang X, Liu J. 2012. Directing the biological activities of heparan sulfate oligosaccharides using a chemoenzymatic approach. Glycobiology. 22(1):96–106. doi: 10.1093/glycob/cwr109. [DOI] [PMC free article] [PubMed] [Google Scholar]
- Yang J, Hsieh PH, Liu X, Zhou W, Zhang X, Zhao J, Xu Y, Zhang F, Linhardt RJ, Liu J. 2017. Construction and characterisation of a heparan sulphate heptasaccharide microarray. Chem Commun. 53(10):1743–1746. doi: 10.1039/c6cc08204a. [DOI] [PMC free article] [PubMed] [Google Scholar]
- Zong C, Venot A, Li X, Lu W, Xiao W, Wilkes JSL, Salanga CL, Handel TM, Wang L, Wolfert MA et al. 2017. Heparan sulfate microarray reveals that Heparan sulfate-protein binding exhibits different ligand requirements. J Am Chem Soc. 139(28):9534–9543. doi: 10.1021/jacs.7b01399. [DOI] [PMC free article] [PubMed] [Google Scholar]
Associated Data
This section collects any data citations, data availability statements, or supplementary materials included in this article.