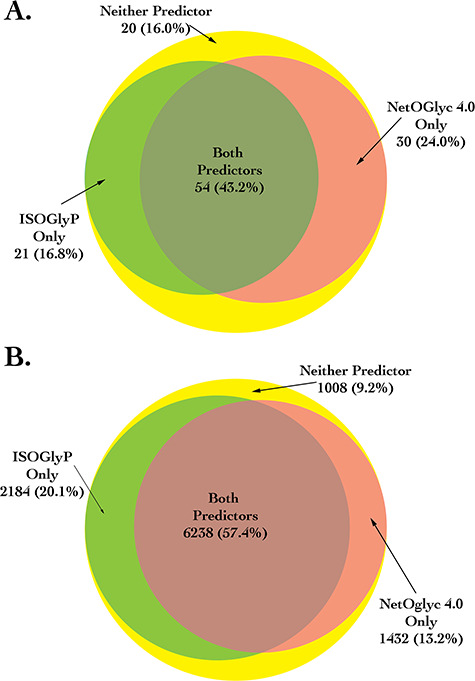
Fig. 2.

Venn diagram of the comparison of ISOGlyP and NetOGlyc 4.0. The top panel shows the number of positive sites that were correctly predicted by ISOGlyP, NetOGlyc or both using the unbiased dataset of experimentally determined glycosylated sites within platelet data from King et al. (2017). Likewise, the bottom panel shows those numbers for the sites that were not identified as being glycosylated.
