

Abstract
Corals of the family Acroporidae are key structural components of reefs that support the most diverse marine ecosystems. Due to increasing anthropogenic stresses, coral reefs are in decline. Along the coast of Okinawa, Japan, three different color morphs of Acropora tenuis have been recognized for decades. These include brown (N morph), yellow green (G), and purple (P) forms. The tips of axial polyps of each morph exhibit specific fluorescence spectra. This attribute is inherited asexually, and color morphs do not change seasonally. In Okinawa Prefecture, during the summer of 2017, N and P morphs experienced bleaching, in which many N morphs died. Dinoflagellates (Symbiodiniaceae) are essential partners of scleractinian corals, and photosynthetic activity of symbionts was reduced in N and P morphs. In contrast, G morphs successfully withstood the stress. Examination of the clade and type of Symbiodiniaceae indicated that the three color-morphs host similar sets of Clade-C symbionts, suggesting that beaching of N and P morphs is unlikely attributable to differences in the clade of Symbiodiniaceae the color morphs hosted. Fluorescent proteins play pivotal roles in physiological regulation of corals. Since the A. tenuis genome has been decoded, we identified five genes for green fluorescent proteins (GFPs), two for cyan fluorescent proteins (CFPs), three for red fluorescent proteins (RFPs), and seven genes for chromoprotein (ChrP). A summer survey of gene expression profiles under outdoor aquarium conditions demonstrated that (a) expression of CFP and REP was quite low during the summer in all three morphs, (b) P morphs expressed higher levels of ChrP than N and G morphs, (c) both N and G morphs expressed GFP more highly than P morphs, and (d) GFP expression in N morphs was reduced during summer whereas G morphs maintained high levels of GFP expression throughout the summer. Although further studies are required to understand the biological significance of these color morphs of A. tenuis, our results suggest that thermal stress resistance is modified by genetic mechanisms that coincidentally lead to diversification of color morphs of this coral.
Keywords: Acropora tenuis, Okinawa coast, color morphs, thermal stress response, coral symbionts, fluorescent protein gene expression
Introduction
One of the most critical issues facing the human race is warming of our planet. Anthropogenic activities have harmed the environment in various ways, and coral reefs have been especially impacted (Hoegh-Guldberg et al. 2007; Hughes et al. 2017). In spite of the fact that coral reefs occupy only 0.2% of the ocean area, they are estimated to harbor about one-third of all described marine species (Knowlton et al. 2010; Fisher et al. 2015), suggesting that coral reefs are the most diverse marine ecosystems on Earth (Wilkinson 2008). Scleractinian corals, a keystone component of calcium-carbonate based reefs, form obligate endosymbioses with photosynthetic dinoflagellates of the family Symbiodiniaceae, which supply the vast majority of their photosynthetic products to the host corals (Yellowlees et al. 2008). However, corals now face a variety of environmental stresses, including increasing surface seawater temperatures, decimation by outbreaks of crown-of-thorns starfish, and acidification and pollution ofoceans (Hoegh-Guldberg et al. 2007; Uthicke et al. 2009; Burke et al. 2011; Uthicke et al. 2015; Hughes et al. 2017).
Vivid coloration of corals has been attributed to the emission of a family of fluorescent proteins (FPs), green fluorescent proteins (GFPs), red fluorescent proteins (RFPs), cyan fluorescent proteins (CFPs), and nonfluorescent blue/purple chromoprotein (ChrP) (Dove et al. 2001; Kelmanson and Matz 2003; Salih et al. 2000; Smith et al. 2013). Corals exhibit FP-mediated color polymorphism. FPs and ChrP are thought to contribute to their acclimatization potential for the following reasons (Kelmanson and Matz 2003; Dove 2004; Paley 2014; Gittins et al. 2015; Jarett et al. 2017; Takahashi-Kariyazono et al. 2018). First, expression of FP genes is modified in relation to environmental changes. For example, FP gene expression in adult Acropora individuals is influenced by external stimuli, such as light, heat, and injury (Takahashi-Kariyazono et al. 2018). Expression levels of CFP, GFP, RFP, and ChrP increase according to light intensity (D’Angelo et al. 2008; Roth et al. 2010). CFP expression is down-regulated in dark stress (DeSalvo et al. 2012) as well as heat stress (Roth and Deheyn 2013), although it is up-regulated in response to injury (D’Angelo et al. 2012). Second, roles of FPs in acclimatization have been suggested. For example, FPs protect corals and their symbionts by absorbing high-energy ultraviolet radiation and re-emitting it as lower energy visible light (Bollati et al. 2020). FPs also reduce oxidative stress to corals as well as to their dinoflagellate symbionts (Salih et al. 2000). To survive corals must somehow adapt to increasingly stressful environments (Skelly et al. 2007).
Acropora tenuis is one of the major scleractinian corals along the coast of Okinawa, Japan (Omori et al. 2016). Most A. tenuis appear brownish (Figure 1, A–D), reflecting the color of Symbiodiniaceae that they host. Acropora tenuis exhibits faster growth than other Acropora species, forming colonies approximately 30 cm in diameter within 3–5 years (Figure 1, A and B; Iwao et al. 2010). In 1998, along the Okinawa coast, various Acropora species suffered extensive bleaching and many died extensive bleaching and many died. After several years, they gradually recovered (Kimura et al. 2014). While color morphs of A. tenuis have been described (Nishihira and Veron 1995), divers in Okinawa noticed the re-appearance of yellowish green (Figure 1, E and F) and purple A. tenuis morphs (Figure 1G) in addition to brownish ones. We thought that the color polymorphism of A. tenuis might be associated with its potential to resist to stress.
Figure 1.

Color morphs of A. tenuis along the Okinawa coast. (A and B) Colonies with different color morphs are growing in shallow water along the coast of Okinawa. (A) Healthy condition of corals and (B) bleaching of some colonies during summer season. (C and D) Two “wild-type” morphs, NO (C) and NB (D). Both appear generally brownish while the tips of axial polyps are orange in NO (Cʹ) and blue in NB (Dʹ). (E and F) Two greenish morphs, GO (E) and GB (F). Tips of axial polyps are orange in GO (Eʹ) and blue in GB (Fʹ). (G) A purple colony (P) and tips of its axial polyps (Gʹ).
As mentioned above, there are many studies on the expression and function of FP genes in response to environmental changes. However, few studies have addressed this question comprehensively at the genomic level. This is partly because decoding of coral genomes has only occurred recently, first in Acropora digitifera in Shinzato et al. (2011), followed by several other species (e.g., Cunning et al. 2018; Ying et al. 2019). A genome-wide survey of FP members in corals has been reported only in the A. digitifera genome (Shinzazo et al. 2012; Takahashi-Kariyazono et al. 2018).
The genome of A. tenuis has just been decoded (Shinzato et al. 2021). Therefore, we attempted to determine the relationships of color morphs with their potential for environmental stress response by characterizing all FP genes present in the A. tenuis genome. We first examined whether the three-color morphs show different bleaching response to stresses, including higher seawater temperature. Then, we examined whether differences in the clade of Symbiodiniaceae are associated with differences in bleaching grade of the three-color morphs. Finally, we surveyed all candidate genes for FPs in the A. tenuis genome, and examined their expression profiles in the three-color morphs in response to rising summer surface seawater temperatures.
Materials and methods
Biological materials
Various color morphs of A. tenuis have been observed along the Okinawa coast (Figure 1). The “wild-type” morph (N) is brownish, presumably reflecting the color of its symbionts (Figure 1, C and D). Depending upon the color of axial polyp tips, they are further subdivided into NO (the morph is brownish overall, but the tips of axial polyps are orange) (Figure 1, C and Cʹ) and NB (a brownish morph with bluish axial polyp tips) (Figure 1, D and Dʹ). The color morph that looks greenish (G) is also subdivided into GO (axial polyp tips look orange) (Figure 1, E and Eʹ) and GB (axial polyp tips look bluish) (Figure 1, F and Fʹ). Yet another color morph is purple (Figure 1, G and Gʹ).
Wild colonies of the five morphs were collected in 2005/2006 and have been maintained in the “Umino-Tane Aquarium” (a nongovernmental organization founded by K. Kinjo) at Yomitan, Okinawa, Japan. Branches of these wild specimens were broken off and raised for several years in the Unino-Tane Aquarium. In 2008–2010, nursery-raised corals more than 3 cm in diameter were then transplanted back into the ocean by attaching them to rocks along the shallow coast (2–4 m in depth) in the South China Sea. After several years, they became mature colonies more than 20 cm in diameter (Figure 1, A and B). In 2016 and 2017, at two field survey sites, 5 × 5 m quadrats each, were selected. An ortho-image of the sites was constructed with Agisoft Metashape (Supplementary Figure S1). These sites included 169 colonies, 125 NOs, 35 NBs, 3 GOs, 3 GBs, and 3 Ps. The number of colonies with five color-morphs differed among sites, with more N and fewer G and P. These skewed frequencies of the different color morphs are normal throughout Okinawa Prefecture. These 169 colonies were monitored for bleaching in 2016 and 2017.
We selected three NOs (NO1, 2, and 3), four NBs (NB1, 2, 3, and 4), three GOs (GO1, 2, and 3), three GBs (GB2, 3, and 4), and two Ps (P1 and 2) at these sites for examination of photosynthetic activity (Supplementary Figure S1). However, colonies of two GBs (GB3 and 4) and a P (P1) were too small for examination of photosynthetic activity. Therefore, we added a large GB (GB1 in Supplementary Figure S1) and a large P (P3 in Supplementary Figure S1) from other sites to bolster sample sizes.
Branches, approximately 10 cm in length, of two NOs (NO1 and 3), three NBs (NB1, 2, and 3), three GOs (GO1, 2, and 3), two GBs (GB1 and 2), and two Ps (P2 and 3), were cut in early 2017 and translocated from the field into outdoor pools at the Sea Seed Aquarium, where they were cultured under continuous natural seawater supply. Temperature changes of the outdoor pools were recorded with a HOBO Pendant Temperature logger (Onset) from July 27th to September 27th. Seawater temperatures of the pools were 1–3°C lower than those at the field sites where bleaching observations were conducted.
Previously, we developed a microsatellite genotyping method that can identify individual colonies by assessing specific heterogeneity, a method widely applicable to Acropora species, including A. tenuis (Shinzato et al. 2014). This method was employed to determine genetic relationships among the 12 colonies mentioned above. Each colony had an independent genotype (data not shown), indicating that they originated from different parents. In other words, it is unlikely that color polymorphism examined in this study arose from a single founder or a small group of founders.
Field observations
Bleaching
Field observations were conducted during the summers of 2016 and 2017. Surface seawater temperatures at approximately 2 m depth at the sites were automatically recorded with Compact CTs (JFE Advantech Co., LTD, Nishinomiya, Japan) (Supplementary Figure S2A). Photosynthetic photon flux density (PPFD) was also recoded automatically using DEFI2-Ls (JFE Advantech Co., LTD) (Supplementary Figure S2B). In 2017, changes in temperature and insolation were observed for 171 days from June 11 to November 28.
Bleaching status was determined for the 169 colonies by direct observation by divers. To avoid the effect of differences in the number of color morphs on the results, the degree of bleaching was not quantified as the number of bleached colonies per total number of colonies. Instead, it was quantified as the bleached projected surface-area relative to the projected total surface-area of each morph. The projected area was estimated from the ortho-image. Bleaching outcome (death or recovery) was also recorded in September and November.
Analyses of photosynthetic activity
Photosynthetic activity of Symbiodiniaceae hosted by 14 colonies of different color morphs was continuously monitored at the field sites. Photosynthetic activity was measured in each of colonies. After 10-min dark adaptation using a custom-made black box, chlorophyll fluorescence measurements were performed with a pulse amplitude-modulated fluorometer, Diving-PAM (Heinz Walz Company, Germany). Photosynthetic activity was measured by maximum quantum yield of PSII, determined as Fv/Fm. Fv was obtained as Fm–Fo, where Fo is the minimum fluorescence obtained under the measuring beam of PAM (weak pulsed light <1 μmol photons m−2 s−1) in dark-adapted conditions, and Fm is the maximum fluorescence detected using a short, saturating pulse. Data were analyzed with ANOVA using R software. Statistical significance of differences between colonies was tested between color morphs.
Examination of fluorescent emissions
NB1, GB1, and P2, maintained in the outdoor pools, were selected for this examination as representative of the three-color morphs. Fluorescence spectra of axial polyp tips of A. tenuis color morphs were examined using a Carl Zeiss LSM780 inverted confocal microscope with a 5x Fluar lens. Live branches of NB, GB, and P colonies were embedded in a 1% agarose gel in a glass-bottomed dish. Lasers of four wavelengths (405, 488, 561, and 633 nm) were employed. Z-stack images, including spectral information from 410 to 694 nm were acquired using 32-channel detectors. Spectra data were displayed with wavelength color codes. Three-dimensional images were constructed with ImageJ (http://imagej.nih.gov/ij/).
Identification of the clade of Symbiodiniaceae in the five different color morphs
The clade and type of Symbiodiniaceae can be identified by sequence difference in the internal-transcribed spacer region (ITS-2) of rDNA (Franklin et al. 2012). According to the method employed by Shinzato et al. (2018), we determined the Symbiodiniaceae clade hosted by the 12 colonies with different color morphs that were maintained in outdoor pools. Small pieces, approximately 2 cm in length, were broken from branches on June 9, July 26, August 15, and September 14 of 2017. DNA was extracted using SepaGene kits (Sanko Junyaku, Tokyo, Japan) and quantified, and then used for qPCR. To amplify ∼600–700 bp of Symbiodiniaceae ITS-2, Sym28Sr primer (5′-CTTGTRTGACTTCATGCTA-3′) was used. Genomic DNA isolated from clade C culture strain CCMP2466 (clade C, type C1; purchased from the Provasoli–Guillard National Center for Culture of Marine Algae and Microbiota, East Boothbay, Maine, USA) was used as a positive PCR control (expected amplicon size: 676 bp). PCR cycling conditions were 35 cycles of 45 s at 94°C, 45 s at 51°C, and 60 s at 72°C. All PCR products were cleaned with a QIAquick PCR Purification Kit (Qiagen).
Sequencing libraries of cleaned PCR products were prepared using a KAPA Hyper Prep Kit (NIPPON Genetics Co, Ltd), and 300-bp paired-end reads were sequenced on a MiSeq (Illumina) with PhiX control (Illumina). Low-quality bases (Phred quality score <30) were trimmed using SolexaQA and high-quality sequences longer than 200 bp were retained for subsequent analyses. These reads were aligned to the modified version of the Symbiodiniaceae ITS-2 gene sequence database GeoSymbio (Franklin et al. 2012) as reported in Shinzato et al. (2018) with an e-value cutoff of 1e−20. The number of reads that ensured the BLASTN bit score of the best alignment was counted. Scores were averaged for each of the five-color morphs, namely averages of two NOs, three NBs, three GOs, two GBs, and two Ps. The data were visualized with a heatmap constructed using pheatmap R package (Kolde 2015).
Identification of genes for FPs in the A. tenuis genome
A draft genome of A. tenuis was sequenced using Illumina technology by Shinzato et al. (2021). The approximately 407-Mbp A. tenuis genome is estimated to contain 23,119 protein-coding genes with a BUSCO score of 97.4% (92.2% completeness). Acropora tenuis genes for GFP, CFP, and RFP FPs, and nonfluorescent blue/purple chromoprotein (ChrP) were identified by BLAST searching of the genome using A. digitifera GFP, CFP, RFP, and ChrP genes (Shinzato et al. 2012) as queries, respectively. Orthologous relationships of FP genes of Acropora species were confirmed by molecular phylogenetic analysis, which was carried out using RAxML 8 (Stamatakis 2014).
Expression dynamics of genes for GFP, CRP, RFP, and ChrP
Another two or three small pieces of branches approximately 2 cm in length were cut from the five different color-morphs on the same days as specimen collection for Symbiodiniaceae clade identification. Pieces were immediately fixed in RNAlater in 50-mL Falcon tubes and were maintained at −80°C until use. Total RNA was extracted from all 12 specimens using an RNA plant mini Kit (Qiagen). cDNA libraries were produced using a TruSeq Standard mRNA Library Prep Kit for NeoPrep (Illumina) quantified by Real-Time PCR (StepOnePlus; Applied Biosystems) and quality controlled using capillary electrophoresis on a Bioanalyzer. Library sequencing was carried out on a Hi-seq4000 (Illumina) according to the method described by Pertea et al. (2015). Sequencing adapters and low-quality (<Q30) sequences of Illumina reads were trimmed with Trimmomatic 0.33 (Bolger et al. 2014) and PCR duplicate sequences were removed with prinseq 0.20.3 (Schmieder and Edwards 2011).
Trimmed sequence data were mapped onto the A. tenuis gene models with HISAT2 2.1.0 (Pertea et al. 2016) and numbers of mapped reads were counted with featureCounts 1.6.5 (Liao et al. 2014). Expression degree analysis was performed using edgeR 3.28.1 (McCarthy et al. 2012) and DESeq2 1.26.0 (Love et al. 2014) by standardization of data by rRNA read counts. That is, the grade of gene expression was measured by fragments per kilobase of exons per million (FPKM) reads mapped to A. tenuis gene models.
Data availability
Genes for A. tenuis FPs are accessible under DDBJ accession number, LC519766-LC519782. Raw sequence data for examination of Symbiodiniaceae clades in different color morphs and those for RNA-seq analyses of FP gene expression were submitted to DDBJ DRA under accession number BioProject PRJDB10722 (DRA011026). Supplemental material is available at figshare: https://doi.org/10.25387/g3.13557797.
Results
Responses of color morphs to summer environmental stress
Bleaching
In field observations, we first examined whether the five-color morphs show different responses to environmental changes, especially the rise of surface seawater temperatures. We followed bleaching profiles of the five morphs during the summers of 2016 and 2017. A similar pattern of bleaching was observed in both years. Since the seawater temperature rise was higher and coral bleaching was more severe in 2017 than 2016, we describe here results from 2017. In 2017, surface seawater temperatures rose to over 30°C in early July, a temperature that continued until early September (Supplementary Figure S2A). Forty-six of 171 days exceeded 30°C, with a maximum of 34.2°C on July 27 (Supplementary Figure S2A). PPFD also increased toward mid-July, and a high level of PPFD continued until late September, although daily variations occurred (Supplementary Figure S2B). The highest was 4187 µmolm−2 s−1 on August 25. Bleaching status was observed by diving on July 26, August 30, September 29, and November 29.
Bleaching occurred in NO, NB and P, and the degree of bleaching was highest in NO and NB (Figure 2). More than half the total surface of 125 NO colonies became bleached in July and August (Figure 2A). Although 20–30% of the bleached surface recovered their color morphs in September and November, 10–15% of them died after bleaching (Figure 2A). The percentage of bleached surface of 35 NB colonies in July and August was less than that of NOs, but many of the bleached NBs did not recover and died (Figure 2B). Nearly 30% of NBs died by late November (Figure 2B). In addition, bleaching occurred in 30% of the total surface of three P morphs in late August (Figure 2E). Most of them recovered in late September (Figure 2E), though nearly 20% of the P morph surface area appeared dead (Figure 2E). In contrast, G morphs, especially the three GB colonies did not bleach at all (Figure 2D), although several percent of total surface areas of GO colonies died for unknown reasons (Figure 2C). It appears that G morphs of Okinawa A. tenuis have higher resistance than N morphs to increasing summer surface seawater temperatures.
Figure 2.

Bleaching and subsequent death of A. tenuis color morphs in the summer of 2017 along the Yomitan, Okinawa coast. The projected surface area of color morphs that exhibit bleaching appears white, with that of healthy areas is green. Dead areas after bleaching are red. Colonies that disappeared due to wave action or unknown causes are shown in gray. Note that because the numbers of each color morph examined differ, areas have very different values on the y-axis (m2). It is evident that GO (C) and GB (D)were little affected by environmental stresses, compared to NO (A) and NB (B). (E) Purple.
Photosynthetic activity of symbiotic dinoflagellates
It was expected that photosynthetic activity of Symbiodiniaceae, which can be measured by chlorophyll fluorescence (Fv/Fm), might change in response to summer increases in seawater temperature. Thus, in relation to different modes of bleaching in the five-color morphs, we examined whether the color-morphs show different Fv/Fm profiles using three NOs, four NBs, three GOs, two GBs, and two Ps (Figure 3). Photosynthetic activity was measured in four different branches of each colony (data are shown in Supplementary Figure S3). The observed Fv/Fm value was nearly the same in all five-color morphs in June, August, September, and November (Figure 3A), but in July, it was reduced in N and P morphs, and lowest in NB and P (Figure 3A). On the other hand, GB and GO maintained photosynthetic activity even in July at a level similar to June (Figure 3A). The decrease in Fv/Fm of NB and P in July was statistically significant, when compared between NB and GO, NB and GB, and BG and P (P < 0.05) (Figure 3B). While the activity in July was reduced in P and NB, both recovered their photosynthetic rates in August to the same level as in GB and GO (Figure 3A).
Figure 3.

Photosynthetic activity (Fv/Fm) of five-color morphs of A. tenuis during the summer of 2017. (A) Activity profiles in June, July, August, September, and November (data for all observation points are shown in Supplementary Figure S3). Differences in activity were evident in July among the five-color morphs. (B) Comparison of activities in July among the five-color morphs. Bold bars indicate mean values and error bars indicate one standard deviation. *Denotes statistically significant differences (P < 0.05) between NB and GO, NB and GB, and BG and P, examined using the Steel-Dwass method.
Characterization of fluorescence spectrum of color morphs
We characterized the color morphs by fluorescence spectral imaging, measured by laser irradiation of the tips of axial polyps of NB, GB, and P morphs. Polyps of the three-color morphs fluoresced green on the outer rim of axial corallites when excited at 488 nm (Figure 4, G–I). In addition, the response to 405-nm excitation differed among color morphs. The lateral walls of axial corallites of NB and P morphs fluoresced blue (Figure 4, D and F). In contrast, the lateral walls of axial corallites of GB morphs fluoresced green (Figure 4E). This indicates different modes of fluorescence emission in the three-color morphs. On the other hand, fewer differences in red and deep red fluorescent emissions were detected among the three-color morphs when excited at 561 and 633 nm (Figure 4, J–O).
Figure 4.

Spectral imaging of fluorescent emission at the tips of axial bodies of NB, GB, and P morphs in A. tenuis. Morphology of tip regions of axial bodies of NB (A), GB (B), and P (C) color morphs. Lasers of four different wavelengths, 405 nm (D–F), 488 nm (G–I), 561 nm (J–L), and 633 nm (M–O), were used for excitation. Spectra data are displayed with wavelength color codes. Three-dimensional images were constructed with ImageJ.
Clade distribution of symbiotic dinoflagellates among color morphs
PCR analyses of the internal transcribed spacer 2 (ITS2) sequence showed that all color morphs hosted only clade C (Cladocopium) Symbiodiniaceae (Figure 5). No other clades were detected. Among them, group C1 was most abundant, and C50 was next, with smaller numbers of various other Clade-C subgroups (Figure 5). NB and GB morphs hosted more C3k, whereas P morphs hosted more C1i compared with other color morphs, although these differences were not discrete. These symbiont profiles did not change during the study period from late June to early September 2017. Acropora tenuis appeared to incorporate higher numbers of C1 and C50 Symbiodiniaceae in August and September than in June and July, and this tendency was pronounced in GO color morphs. Nonetheless, it is unlikely that shifts in symbiont clades are the main cause of color differences and/or thermal-resistance of the color morphs.
Figure 5.

Symbiotic zooxanthellae or Symbiodiniaceae hosted by five-color morphs of A. tenuis. Symbiodiniaceae clades were identified based upon ITS-2 sequences of rDNA. Numbers of sequencing reads are shown by color density (right upper column) as log2 (number of valid alignments +1). All five-color morphs hosted only clade C Symbiodiniaceae (Cladocopium), numbers of which were largely maintained during the summer examined.
Genes for FPs
Using amino-acid sequences of A. digitifera GFP, RFP, and CFP FPs, and nonfluorescent blue/purple chromoprotein (ChrP) as queries (Shinzato et al. 2012), using BLAST, we searched the approximately 407-Mbp genome of A. tenuis and identified five genes for GFP (Gene ID: s0077.g62, s0297.g27, s0297.g28, s0297.g29, and s0366.g7) (Figure 6A), two genes for CFP (s0010.g7 and s0025.g63) (Figure 6B), three genes for RFP (s0024.g131, s0024g134, and s0217.g35) (Figure 6C), and seven genes for ChrP (s0096.g1, s0096.g3, s0096.g4, s0152.g9, s0152.g11, s0152.g15, and s0182.g24) (Figure 6D), respectively. Accession numbers of the genes are DDBJ LC519766-LC519782. Molecular phylogeny supports orthologous relationships of these A. tenuis genes with genes of FPs and nonfluorescent chromoproteins of other corals (Supplementary Figure S3).
Figure 6.
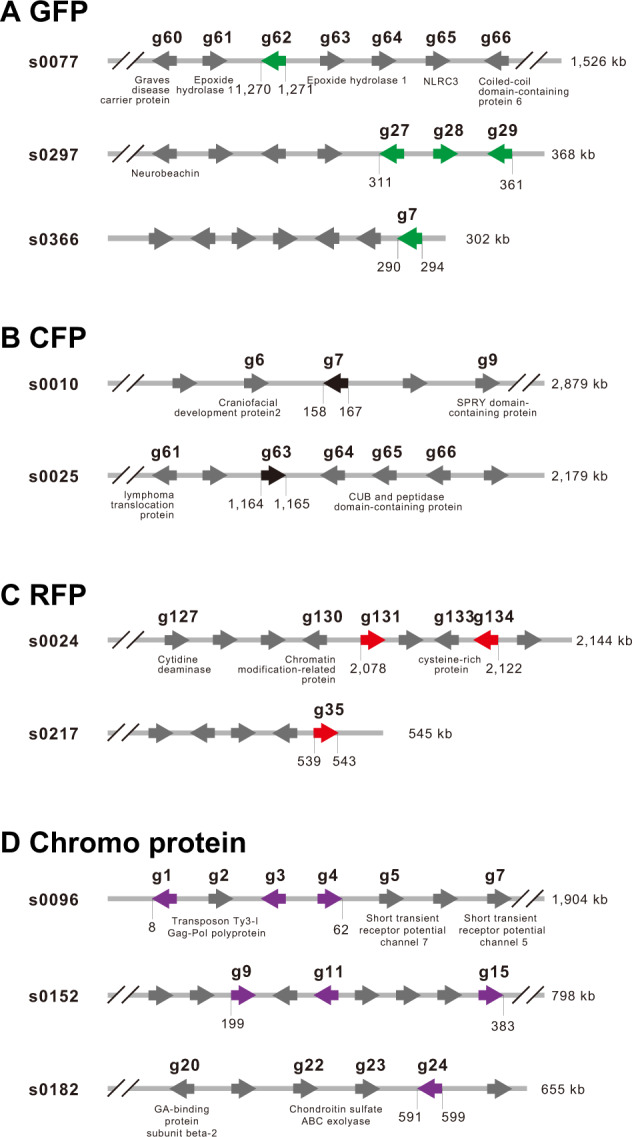
Genes for FPs in the A. tenuis genome. The A. tenuis genome contains 13 FP-related genes. (A) Three scaffolds, s0077, s0297, and s0366, contain one, three, and one gene for GFP (shown in green). Other genes (gray) in scaffolds are named if the gene was annotated. Arrowheads indicate the transcription direction. (B) Two scaffolds, s0010 and s0025, contain one gene each for CFP (shown in black). (C) Two scaffolds, s0024 and s0217, contain two and one gene, respectively, for RFP (shown in red). (D) Three scaffolds, s0096, s0152, and s0182, contain three, three, and one gene for chromoproteins (shown in purple). Molecular phylogeny of these genes is shown in Supplementary Figure S3.
Expression profiles of FP genes
The grade of gene expression measured by FPKM reads is shown in Supplementary Table S1. Three-color morphs (N, G, and P) that showed different expression profiles of FP-related genes during the summer (Figure 7).
Figure 7.

Expression profiles of genes for FPs in five A. tenuis color morphs during the summer of 2017. Expression levels of five GFP genes (green), two CFP genes (black), three RFP (red), and seven chromoprotein genes (purple) are shown with their densities (right upper column) as log2 (number of valid alignments +1). Gene IDs are identical to those in Figure 6. NO1 and 2 are two genotypes of the NO morph, NB1, 2, and 3 are three genotypes of the NB morph, GB1 and 2 are two genotypes of the GB morph, GO1, 2, and 3 are three genotypes of the GO morph, and P2 and 3 are two genotypes of the P morph.
First, in all five-color morphs, the two CFP genes (s0010.g7 and s0025.g63) and three RFP genes (s0024.g131, s0024g134, and s0217.g35) showed very low expression levels with almost no detectable changes during the summer (Figure 7). This indicates that in A. tenuis, genes for the four fluorescence-related proteins do not necessarily show similar responses to summer environmental changes and that expression of CFP and RFP are less associated with environmental responses than GFP and Chrp. On the other hand, GFP and ChrP genes showed detectable changes in expression profiles.
Two GFP genes (s0297.g27 and s0297.g29) showed distinctive changes in expression profiles, while expression levels of the other three genes (s0077.g62, s0297.g28, and s0366.g7) remained low, with little change (Figure 7). This indicates that even among genes that encode the same FP and that are located in close proximity on the same chromosome (Figure 6), their responses to summer environmental changes are not always the same, suggesting complicated individual gene regulation in response to environmental stresses. In addition, s0297.g27 and s0297.g29 exhibited an interesting shared expression profile during the study period. First, the expression level of s0297.g29 was distinctively higher in GB and GO than in NO, NB, and P (Figure 7). In NB1, NB2, and NB3, s0297.g29 showed moderate levels of expression in June, but the expression level decreased in August and September. A similar expression profile of s0297.g29 was detected in P2 and P3. In contrast, a higher level of s0297.g27 and s0297.g29 expression, especially the latter, was noticed in all three GOs and two GBs (Figure 7). Differences in the level of s0297.g29 expression between G and N or P were statistically significant (P < 0.004) (Supplementary Table S2). In addition, a higher level of s0297.g29 expression in GO1, GO2, GO3, and GB2 was maintained throughout the summer (Figure 7). Although less obvious, a similar expression profile was observed in s0297.g27 (Figure 7).
Purple morphs exhibited another expression profile of these genes, especially in relation to genes for ChrP (Figure 7). Of seven ChrP genes, expression levels of s0096.g1, s0096.g3, s0152.g9, s0152.g11, and s0152.g15, the latter three being localized on the same scaffold, were comparatively low (Figure 7). In contrast, s0096.g4 and s0182.g24 were expressed at high levels (Figure 7). In addition, s0096.g1, s0096.g3, s0096.g4, and s0182.g24 were expressed at higher levels in P2 and P3 than in NO, NB, GB, and GO (Figure 7). Although expression level differed among the four genes, this pattern was shared by all four color-morphs and relative levels of the four genes were maintained during the summer. s0096.g4 showed significantly higher expression in both P2 and P3 than the other color-morphs during the summer. This difference was also supported significantly (P < 6E−36) (Supplementary Table S2). These results indicate that ChrP is likely involved in physiological regulation in P morphs.
Discussion
There are three major color morphs of A. tenuis along the Okinawa coast, brown, green, and purple (Nishihira and Veron 1995; Figure 1). They exhibit different profiles of fluorescence in the axial polyps when excited at 405 nm (Figure 4). We expect that differences in fluorescence are associated with coloration of this coral, although detailed molecular, biochemical, and biophysical mechanisms underlying these differences should be addressed in future studies. Based on observations for a decade, these color morphs are stable, since color polymorphism is asexually heritable and color morphs show no seasonal variation, although the brightness of color changes. These characters have also been shown in Acropora millepora (Paley 2014). Although it remains to be determined whether it is also sexually heritable, color polymorphism is likely caused by genetic variation.
Field studies in 2017 showed that N morphs underwent extensive bleaching (Figure 2, A and B), and 10–15% of NB morphs eventually died (Figure 2B). In contrast, G morphs did not show bleaching (Figure 2, C and D). These results indicate that sensitivity to summer environmental stress differs among the three-color morphs and that N is the most sensitive while G is resistant. Along the Okinawa coast, the N color morph is most abundant (Figure 1 and Supplementary Figure S1), while G and P are not as common. This suggests that the N morph is probably the ancestral or wild type, while G and P color morphs are more recent. If this feature is heritable, it is tempting to speculate that in Okinawa, A. tenuis has acquired the capacity to resist summer environmental stresses by developing new color morphs. In other words, polyp color polymorphism may be a strategy to survive severe summer environmental stresses, provided that the current rate of temperature change does not overwhelm the coral’s capacity to adapt.
Bleaching responses are complicated, varying among colonies, taxa, and events (van Woesik et al. 2011). Scleractinian corals form obligate endosymbioses with photosynthetic dinoflagellates of the family Symbiodiniaceae, and host-symbiont interactions contribute to differential bleaching susceptibility (Enriquez et al. 2005; Hawkins et al. 2014; Wooldridge 2014). Acropora corals lost a gene for cystathionine ß-synthase, an essential enzyme for cysteine biosynthesis, and they depend upon symbionts to produce cysteine (Shinzato et al. 2011, 2021), partially explaining the higher sensitivity of Acropora to bleaching than other coral taxa. Because bleaching is usually caused by escape and/or death of symbionts, declining photosynthetic activity of Symbiodiniaceae may portend bleaching, as shown by previous studies (Smith et al. 2013; Gittins et al. 2015). Indeed, decreased photosynthetic activity was detected in July in NB and P morphs (Figure 3). In contrast, GO and GB morphs maintained photosynthetic activity comparable to that in other months. Since this suggests that G color morphs provide a more suitable physiological environment for symbionts than N and P morphs during times of high thermal stress. Genetic and molecular mechanisms involved in this relationship are intriguing and should be addressed in future studies.
The family Symbiodiniaceae has recently been reorganized into nine clades or genera (A–I), according to new analyses of combinatorial data (LaJeunesse et al. 2018). It has been suggested that in general, corals hosting clade D (Durusdinium) are more heat-resistant than those hosting clade C (Cladocopium) or that specific Symbiodinium phylotypes, such as D1, D1–4, C15, and A3 are exceptionally thermotolerant, while others (e.g., C3, C7, B17, and A13) are thermosensitive (Silverstein et al. 2011; Tonk et al. 2014). Therefore, it seemed possible that differing capacities of A. tenuis color morphs to resist higher summer seawater temperatures might be due to different zooxanthella hosted by the three-color morphs. However, this is not the case in Okinawa A. tenuis, because all three host a very similar repertoires of clade C Symbiodinium, especially C1 and C5 types (Figure 5).
Acropora tenuis is useful as an experimental system because its approximately 400-Mb genome has been decoded and is thought to contain 22,802 protein-coding genes (Shinzato et al. 2021). Moreover, approximately 95% of the gene models are confirmed with corresponding mRNAs. Therefore, we were able to investigate not only genes for GFP, CFP and RFP, and ChrP, but also their expression profiles in colonies with different color morphs during the summer of 2017. We found that all three morphs possess an identical array of fluorescence-related genes and that expression of these genes was confirmed in all morphs using RNA-seq. This indicates that color polymorphism is not caused by mutations in the genes themselves. Instead, molecular and genic mechanisms that control transcriptional activity or quantitative regulation of gene products probably produce the three-color morphs. Genetic and genic mechanisms underlying FP-mediated color polymorphisms and adaptation potential to variable environmental conditions have been studied in Acropora millepora (D’Angelo et al. 2008; Smith et al. 2013; Gittins et al. 2015). In this species, an RFP gene, amiFP597, is essential for color polymorphism. amiFP597 exists in multiple copies with a particular promoter type in the genome, and the number of gene copies is strongly correlated with the level of gene expression. Higher levels of gene expression are found in more intensely red morphs, which show higher resistance to strong insolation (Gittins et al. 2015). This suggests the presence of variable genetic mechanisms in color polymorphism, depending on coral species.
Interestingly, the P morph of A. tenuis exhibits a gene expression profile different from those of the N and G morphs. Specifically, the P morph shows higher ChrP gene expression, especially s0096.g4 (Figure 7). In addition, the N and G morphs differ in expression levels of GFP genes, especially s0297.g29 and s02897.g27 (Figure 7). Higher gene expression was evident in the G morph compared to the N morph (Figure 7). Because the G morph is the most resistant to summer environmental stress, it is likely that stress resistance varies with expression levels of GFP genes. We expect that different control mechanisms of GFP gene expression in N and G morphs explain their different thermal tolerance. We will address this question in future studies.
Coral bleaching is caused by multiple, complex environmental stresses. Except for outbreaks of crown-of-thorns starfish, typhoons, and diseases, the most deleterious influence is surface seawater temperature warming. Strong solar radiation also likely contributes to environmental stress. Seawater in Okinawa Prefecture is very transparent; thus, UV irradiation acts in concert with higher sea temperatures to cause bleaching. FPs and chromoproteins absorb UV radiation, rendering corals and their symbionts more resistant to solar stress (Dove et al. 2001; Dove 2004; Banaszak and Lesser 2009; Salih et al. 2010). We need to better understand the relationship between solar stress and different expression profiles of genes for GFP and ChrP.
Divers and marine researchers have noticed that some corals, sometimes called “super corals” and/or “super coral reefs” (Dance 2019), are able to survive severe environmental stresses. Nonetheless, almost nothing is known about how such super corals have appeared in the reefs. Our present results regarding different stress tolerances of three A. tenuis color morphs may help to explain the resilience of these super corals.
Acknowledgments
This work was supported by Okinawa Prefecture Project of Coral Preservation to K.S., D.K., H.I., A.Y., K.H., and N.S. The DNA Sequencing Section, Imaging Section and Computing and Data Analysis Section of OIST are gratefully acknowledged. We thank Dr. Steven D. Aird for editing the manuscript.
Funding
This work was funded by the Sumiko Imano Memorial Foundation (Sumio Imano, Haruo Imano and Hiromichi Imano) to N.S. Y.Z. and C.S. are supported by JSPS grants (17K15179 and 19K15902 to Y.Z., and 17K07949, 17KT0027, and 20H03235 to C.S.).
Conflicts of interest: The authors declare that they have no competing interests.
Literature cited
- Banaszak AT, Lesser MP.. 2009. Effects of solar ultraviolet radiation on coral reef organisms. Photochem Photobiol Sci. 8:1276–1294. [DOI] [PubMed] [Google Scholar]
- Bolger AM, Lohse M, Usadel B.. 2014. Trimmomatic: a flexible trimmer for Illumina sequence data. Bioinformatics. 30:2114–2120. [DOI] [PMC free article] [PubMed] [Google Scholar]
- Bollati E, D’Angelo C, Alderdice R, Pratchett M, Ziegler M, et al. 2020. Optical feedback loop involving dinoflagellate symbiont and scleractinian host drives colorful coral bleaching. Curr Biol. 30:2433–2445. [DOI] [PubMed] [Google Scholar]
- Burke L, Reytar K, Spalding M, Perry A.. 2011. Reefs at Risk Revisited. World Resources Institute. Washington, USA. [Google Scholar]
- Cunning R, Bay RA, Gillette P, Baker AC, Traylor-Knowles N.. 2018. Comparative analysis of the Pocillopora damicornis genome highlights role of immune system in coral evolution. Sci Rep. 8: 16134.[10.1038/s41598-018-34459-8] [DOI] [PMC free article] [PubMed] [Google Scholar]
- Dance A. 2019. Hope for coral reefs. Nature. 575:580–582.31776507 [Google Scholar]
- D’Angelo C, Denzel A, Vogt A, Matz MV, Oswald F, et al. 2008. Blue light regulation of host pigment in reef building corals. Mar Ecol Prog Ser. 364:97–106. [Google Scholar]
- D’Angelo C, Smith EG, Oswald F, Burt J, Tchernov D, et al. 2012. Locally accelerated growth is part of the innate immune response and repair mechanisms in reef-building corals as detected by green fluorescent protein (GFP)-like pigments. Coral Reefs. 31:1045–1056. [Google Scholar]
- DeSalvo MK, Estrada A, Sunagawa S, Medina M.. 2012. Transcriptomic responses to darkness stress point to common coral bleaching mechanisms. Coral Reefs. 31:215–228. [Google Scholar]
- Dove SG. 2004. Scleractinian corals with photoprotective host pigments are hypersensitive to thermal bleaching. Mar Ecol Prog Ser. 272:99–116. [Google Scholar]
- Dove SG, Hoegh-Guldberg O, Ranganathan S.. 2001. Major colour patterns of reef-building corals are due to a family of GFP-like proteins. Coral Reefs. 19:197–204. [10.1007/PL00006956] [Google Scholar]
- Enriquez S, Mendez ER, Iglesias-Prieto R.. 2005. Multiple scattering on coral skeletons enhances light absorption by symbiotic algae. Limnol Oceanogr. 50:1025–1032. [Google Scholar]
- Fisher R, O’Leary RA, Low-Choy S, Mengersen K, Knowton N, et al. 2015. Species richness on coral reefs and the pursuit of convergent global estimates. Curr Biol. 25:500–505. [DOI] [PubMed] [Google Scholar]
- Franklin EC, Stat M, Pochon X, Putnam HM, Gates RD.. 2012. GeoSymbio: a hybrid, cloud-based web application of global geospatial bioinformatics and ecoinformatics for Symbiodinium-host symbioses. Mol Ecol Res. 12:369–373. [DOI] [PubMed] [Google Scholar]
- Gittins JR, D'Angelo C, Oswald F, Edwards RJ, Wiedenmann J.. 2015. Fluorescent protein-mediated color polymorphism in reef corals: multiple genes extend the adaptation/acclimination potential to variable light environment. Mol Ecol. 24:453–465. [DOI] [PMC free article] [PubMed] [Google Scholar]
- Hawkins TD, Krueger T, Becker S, Fisher PL, Davy SK.. 2014. Differential nitric oxide synthesis and host apoptotic events correlate with bleaching susceptibility in reef corals. Coral Reefs. 33:141–153. [Google Scholar]
- Hoegh-Guldberg O, Mumby PJ, Hooten AJ, Steneck RS, Greenfield P, et al. 2007. Coral reefs under rapid climate changes and ocean acidification. Science. 318:1737–1742. [DOI] [PubMed] [Google Scholar]
- Hughes TP, Kerry JT, Álvarez-Noriega M, Álvarez-Romero JG, Anderson KD, et al. 2017. Global warming and recurrent mass bleaching of corals. Nature. 543:373–377. [DOI] [PubMed] [Google Scholar]
- Iwao K, Omori M, Taniguchi H, Tamura M.. 2010. Transplanted Acropora tenuis (Dana) spawned first in their life 4 years after culture from eggs Galaxea . J Coral Reef Stud. 12:47. [Google Scholar]
- LaJeunesse TC, Parkinson JE, Gabrielson PW, Jeong HJ, Reimer JD, et al. 2018. Systematic revision of Symbiodiniacea highlights the antiquity and diversity of coral endosymbionts. Curr Biol. 28:2570–2580. [DOI] [PubMed] [Google Scholar]
- Jarett JK, MacManes MD, Morrow KM, Pankey MS, Lesser MP.. 2017. Comparative genomics of color morphs in the coral Montestraea cavernosa. Sci Rep. 7:16039. [DOI] [PMC free article] [PubMed] [Google Scholar]
- Kimura T, Dewa N, Iwao K, Kajiwara K, Kiyomoto M, et al. 2014. Status of coral reefs in East and North Asia – Japan. In: Kimura T, Karenne T, Chou LM, editors.. Status of Coral Reefs in East Asian Seas Region: 2014. Tokyo: Ministry of the Environment. p. 79–98. [Google Scholar]
- Knowlton N, Brainard RE, Fisher R, Moews M, Plaisance L, et al. 2010. Coral reef biodiversity. In: McIntyre AD, editor. Life in the World’s Oceans: Diversity, Distribution, and Abundance. Chichester: Wiley-Blackwell. p. 65–79. [Google Scholar]
- Kelmanson IV, Matz MV.. 2003. Molecular basis and evolutionary origins of color diversity in great star coral Montastraea cavernosa (Scleractinia: Faviida). Mol Biol Evol. 20:1125–1133. [DOI] [PubMed] [Google Scholar]
- Kolde R. 2015. pheatmap: pretty Heatmaps. R package version 1.0.8. https://cran.r-project.org/web/packages/pheatmap/index.html.
- Liao Y, Smyth GK, Shi W.. 2014. featureCounts: an efficient general purpose program for assigning sequence reads to genomic features. Bioinformatics. 30:923–930. [DOI] [PubMed] [Google Scholar]
- Love MI, Huber W, Anders S.. 2014. Moderated estimation of fold change and dispersion for RNA‐seq data with DESeq2. Genome Biol. 15:550. [DOI] [PMC free article] [PubMed] [Google Scholar]
- McCarthy DJ, Chen Y, Smyth GK.. 2012. Differential expression analysis of multifactor RNA‐Seq experiments with respect to biological variation. Nucl Acids Res. 40:4288–4297. [DOI] [PMC free article] [PubMed] [Google Scholar]
- Nishihira M, Veron JEN.. 1995. Hermatypic Corals of Japan, Kaiyusha Publ. Co., Ltd. Tokyo. [Google Scholar]
- Omori M, Higa Y, Shinzato C, Zayasu Y, Nagata T, et al. 2016. Development of active restoration methodologies for coral reefs using asexual reproduction in Okinawa, Japan. Proceedings of the 13th International Coral Reef Symposium Honolulu, Hawaii, USA. p. 369–387. [Google Scholar]
- Paley AS. 2014. Colour polymorphism and its role in stress tolerance in the coral Acropora millepora in the Great Barrier Reef. The Degree of Doctor of Philosophy. James Cook University. Townsville, Australia. [Google Scholar]
- Pertea M, Kim D, Pertea G, Leek JT, Salzberg SL.. 2016. Transcript-level expression analysis of RNA-seq experiments with HISAT, StringTie and Ballgown. Nat Protoc. 11:1650–1667. [DOI] [PMC free article] [PubMed] [Google Scholar]
- Pertea M, Pertea GM, Antonescu CM, Chang T-C, Mendell JT, et al. 2015. StringTie enables improved reconstruction of a transcriptome from RNA-seq reads. Nat Biotechnol. 33:290–295. [DOI] [PMC free article] [PubMed] [Google Scholar]
- Reef Conservation Committee of Japanese Coral Reef Society. 2014. Coral Bleaching in the Summer of 2013.
- Roth MS, Deheyn DD.. 2013. Effects of cold stress and heat stress on coral fluorescence in reef-building corals. Sci Rep. 3, 1421. [10.1038/srep01421]. [DOI] [PMC free article] [PubMed] [Google Scholar]
- Roth MS, Latz MI, Goericke R, Dehey DD.. 2010. Green fluorescent protein regulation in the coral Acropora yongei during photoacclimation. J Exp Biol. 213:3644–3655. [DOI] [PubMed] [Google Scholar]
- Salih A, Larkum A, Cox G, Kühl M, Hoegh-Guldberg O.. 2000. Fluorescent pigments in corals are photoprotective. Nature. 408:850–853. [DOI] [PubMed] [Google Scholar]
- Schmieder R, Edwards R.. 2011. Quality control and preprocessing of metagenomic datasets. Bioinformatics. 27:863–864. [DOI] [PMC free article] [PubMed] [Google Scholar]
- Shinzato C, Khalturin K, Inoue J, Zayasu Y, Kanda M, et al. 2021. Eighteen coral genomes reveal the evolutionary origin of Acropora strategies to accommodate environmental changes. Mol Biol Evol.38: 16–30. [DOI] [PMC free article] [PubMed]
- Shinzato C, Shoguchi E, Kawashima T, Hamada M, Hisata K, et al. 2011. Using the Acropora digitifera genome to understand coral responses to environmental change. Nature. 476:320–323. [DOI] [PubMed] [Google Scholar]
- Shinzato C, Shoguchi E, Tanaka M, Satoh N.. 2012. Fluorescent protein candidate genes in the coral Acropora digitifera genome. Zool Sci. 29:260–264. [DOI] [PubMed] [Google Scholar]
- Shinzato C, Yasuoka Y, Mungpakdee S, Arakaki N, Fujie M, et al. 2014. Development of novel, cross-species microsatellite markers for Acropora corals using next-generation sequencing technology. Front Mar Sci. 1:11. [Google Scholar]
- Shinzato C, Zayasu Y, Kanda K, Kawamitsu M, Satoh N, et al. 2018. Using seawater to document coral-zooxanthella diversity: a new approach to coral reef monitoring using environmental DNA. Front Mar Sci. 5:28. [Google Scholar]
- Silverstein RN, Correa AMS, Lajeunesse TC, Baker AC.. 2011. Novel algal symbiont (Symbiodinium spp.) diversity in reef corals of Western Australia. Mar Ecol Prog Ser. 422:63–75. [Google Scholar]
- Skelly DK, Joseph LN, Possingham HP, Freidenburg LK, Farrugia TJ, et al. 2007. Evolutionary responses to climate change. Conserv Biol. 21:1353–1355. [DOI] [PubMed] [Google Scholar]
- Smith EG, D’Angelo C, Salih A, Wiedenmann J.. 2013. Screening by coral green fluorescent protein (GFP)-like chromoproteins supports a role in photoprotection of zooxanthellae. Coral Reefs 32:463–474. [Google Scholar]
- Stamatakis A. 2014. Bioinformatics. 30:1312–1313. [DOI] [PMC free article] [PubMed]
- Takahashi-Kariyazono S, Sakai K, Terai Y.. 2018. Presence–absence polymorphisms of highly expressed FP sequences contribute to fluorescent polymorphisms in Acropora digitifera. Genome Biol Evol. 10:1715–1729. [DOI] [PMC free article] [PubMed] [Google Scholar]
- Tonk L, Sampayo EM, Lajeunesse TC, Schrameyer V, Hoegh-Guldberg O.. 2014. Symbiodinium (Dinophyceae) diversity in reef-invertebrates along an offshore to inshore reef gradient near Lizard Island, Great Barrier Reef. J Phycol. 50:552–563. [DOI] [PubMed] [Google Scholar]
- Uthicke S, Logan M, Liddy M, Francis D, Hardy N, et al. 2015. Climate change as an unexpected co-factor promoting coral eating seastar (Acanthaster planci) outbreaks. Sci Rep. 5:8402. [DOI] [PMC free article] [PubMed] [Google Scholar]
- Uthicke S, Schaffelke B, Byrne M.. 2009. A boom-bust phylum? Ecological and evolutionary consequences of density variations in echinoderms. Ecol Monographs. 79:3–24. [Google Scholar]
- van Woesik R, Sakai K, Ganase A, Loya Y.. 2011. Revisiting the winners and the losers a decade after coral bleaching. Mar Ecol Prog Ser. 434:67–76. [Google Scholar]
- Wilkinson C. 2008. Status of Coral Reefs of the World. Townsville: Global Coral Reef Monitoring Network and Reef and Rainforest Research Centre. [Google Scholar]
- Wooldridge SA. 2014. Differential thermal bleaching susceptibilities amongst coral taxa: re-posing the role of the host. Coral Reefs. 33:15–27. [Google Scholar]
- Yellowlees D, Rees TA, Leggat W.. 2008. Metabolic interactions between algal symbionts and invertebrate hosts. Plant Cell Environ. 31:679–694. [DOI] [PubMed] [Google Scholar]
- Ying H, Hayward DC, Cooke I, Wang W, Moya A, et al. 2019. The whole-genome sequence of the coral Acropora millepora. Genome Biol Evol. 11:1374–1379. [DOI] [PMC free article] [PubMed] [Google Scholar]
Associated Data
This section collects any data citations, data availability statements, or supplementary materials included in this article.
Data Availability Statement
Genes for A. tenuis FPs are accessible under DDBJ accession number, LC519766-LC519782. Raw sequence data for examination of Symbiodiniaceae clades in different color morphs and those for RNA-seq analyses of FP gene expression were submitted to DDBJ DRA under accession number BioProject PRJDB10722 (DRA011026). Supplemental material is available at figshare: https://doi.org/10.25387/g3.13557797.