

Abstract
We analyzed the spread of the COVID-19 epidemic in 9 metropolitan regions of the world with similar socio-demographic characteristics, daytime commuting population and business activities: the New York State, Bruxelles-Capital, the Community of Madrid, Catalonia, the Île-de-France Region, the Greater London county, Stockholms län, Hovedstaden (Copenhagen) and the Lombardy Region. The Lombardy region reported the highest COVID-19 crude mortality rate (141.0 x 100,000) 70-days after the onset of the epidemic, followed by the Community of Madrid (132.8 x 100,000) New York State (120.7 x 100,000). The large variation in COVID-19 mortality and case-fatality rates for COVID-19 in different age strata suggested a more accurate analysis and interpretation of the epidemic dynamics after standardization of the rates by age. The share of elder populations (>70 years) over total population varies widely in the considered study settings, ranging from 6.9% in Catalonia to 17.0% in Lombardy. When taking age distribution into consideration the highest standardized mortality rate was observed in the State of New York (257.9 x 100,000); with figures in most of the European regions concentrated between 123.3 x 100,000 in Greater London and 177.7 x 100,000 in Bruxelles-Capital, lower in French and Danish regions. We also report and critical appraise, when available, COVID-19 mortality figures in capital cities, nursing homes, as well as excess mortality at country level. Our data raise awareness on the need for a more in-depth epidemiological analysis of the current COVID-19 public health emergency that further explores COVID-19 mortality determinants associated with health services delivery, community-level healthcare, testing approaches and characteristics of surveillance systems, including classification of COVID-19 deaths. (www.actabiomedica.it)
Keywords: COVID-19, Mortality, Metropolitan regions, Elderly population
Introduction
The COVID-19 pandemic had major impacts in urban settings, (1), including in London, Paris, New York, Madrid, Bruxelles and Milan, among others. All these metropolitan areas share similar characteristics and well-established commercial exchanges with China, where SARS-CoV-2 transmission started between the end of year 2019 and the beginning of 2020.
Containment measures have evolved over time: in addition to quarantine, health authorities have undertaken limitations of mobility (2), lockdown measures (3), have established “red zones” (4), contact tracing (1), home fiduciary isolation (5), supported by advances in technology (6), and better risk communication (7-9). These non-pharmacological preventive measures have played a crucial role, also considering the current lack of effective drugs and vaccines for COVID-19 (10, 11).
In a previous preliminary analysis (4) we compared crude COVID-19 mortality rates 30 days after the onset of the epidemic, exploring different epidemic dynamics, health systems’ response and healthcare delivery management in different settings. The current study, developed around the same theoretical framework(12), builds on previous findings and analyzes nine metropolitan areas, with the aim of further assessing the spread of COVID-19 and its mortality, taking into consideration several characteristics, including age distribution. We also explore and expand on the impact of implemented containment measures and healthcare systems response (12). Specifically, we take into consideration COVID-19 mortality rates (crude and age-standardized) up to 70 days (10 weeks) after the onset of the epidemic period during which the COVID-19 epidemic curve slowed down in all considered settings.
Methods
We considered COVID-19 mortality instead of notification rates, acknowledging the highest reliability of such indicator. Study settings have been chosen considering geographical, societal, and economic characteristics, and considering the availability and comparability of official COVID-19 mortality data.
For each of the nine regions, we built a profile which included administrative, demographic, and social characteristics (the latter was estimated in terms of population age distribution and number of nursing homes). With respect to COVID-19, we analyzed the number of deaths and draw mortality curves, starting on the day during which the first 3 deaths were reported by surveillance systems in each area. Furthermore, we analyzed mortality rate at the regional and metropolitan level to evaluate centripetal trend of the epidemic. Finally, we analyzed in detail the case of Lombardy and with its the metropolitan area of Milan, the European region hit first and whose mortality rates has been considered to be abnormal (13).
Due to the wide differences in age distribution across study settings (proportion of people older than 70 years ranging from 6.9% Catalonia to 17.0% Lombardy), in addition to crude mortality rates, we calculated mortality rates standardized by age using the indirect method and the age-specific mortality rates of Lombardy Region as reference population.
Results
First, we describe the characteristics of the nine metropolitan areas in terms of demographic data, population age distribution, and nursing homes:
NEW YORK STATE – New York State has a population of 19,378,102 inhabitants and a population density of 159 inhabitants/km2 (14). The capital region is New York City with a population of 8,388,748 inhabitants and a population density of 10,715 inhabitants/km2 (14). Considering the population age distribution of the region (Table 1), only 7.7% of the whole population is older than 70 years (Figure 1). In the region there are 450 nursing homes, where 3,405 confirmed death and 2,522 probable death for COVID-19 occurred until the 30th of May 2020 (representing the 20% of the total COVID-19 death recorded in the area) (15). For the period 1st February- 30th May 2020, the excess mortality rate not attributed to COVID-19 is 21.5% (8,077/36,644) higher compared to the same period of 2019 (16, 17). Crude and age-standardized cumulative mortality rate of the Region are shown in Figure 2. Crude cumulative mortality rate of the capital is shown in Table 2, data starting from the beginning of the epidemic (15th March 2020) (18). Crude and age-standardized weekly mortality rate are shown in Figure 3.
Table 1.
Population age distribution stratified in four age groups, in the nine Regions
| Age (in years) | New York State | Bruxelles | Com. Madrid | Catalonia | Ile de France | Greater London | Stockholms län | Hovedtsnden | Lombardy |
| 0-59 | 82.8% | 82.3% | 76.7% | 87.7% | 79.5% | 84.7% | 79.0% | 77.8% | 71.3% |
| 60-69 | 8.7% | 8.2% | 10.3% | 5.4% | 9.6% | 7.3% | 9.3% | 9.7% | 11.8% |
| 70-79 | 5.0% | 5.4% | 7.5% | 3.9% | 6.5% | 4.8% | 7.8% | 8.4% | 9.9% |
| 80+ | 3.5% | 4.1% | 5.5% | 3.0% | 4.4% | 3.1% | 4.0% | 4.0% | 7.1% |
Figure 1.
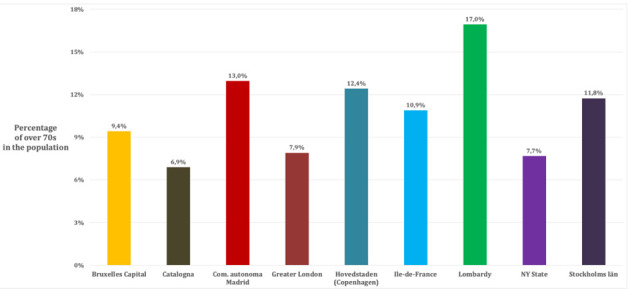
Population age distribution older than 70 years, in the nine Regions
Figure 2.
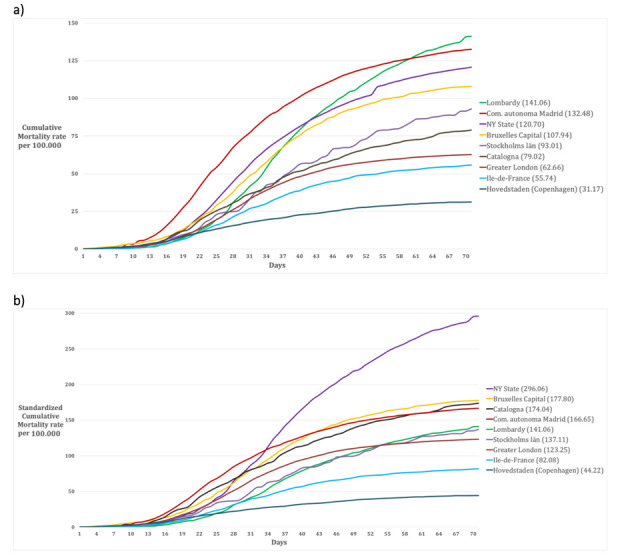
70 days-Cumulative mortality rate in the nine Regions (a) crude, and (b) age-standardized
Table 2.
Summary of demographic characteristics of the nine considered areas; proportion of deaths in nursing homes and other epidemiological characteristics
| Area | Population x 100,000 | Population density inh./km2 | Beginning of the epidemic *, week of the peak | Deaths in nursing homes (%)§ | Crude cumulative mortality rate° | Definition of COVID-19 death |
| New York State | 8,623 | 159 | 15th March; 4th week | 20 | 120.7 | People who tested positive and who did not have a positive COVID-19 laboratory test, but their death certificate lists as the cause of death “COVID-19” or an equivalent (18) |
| New York city | 8,388 | 10,715 | 191.3 | |||
| Bruxelles-Capital | 1,209 | 7,489 | 11th March; 5th week | 49.2 | 107.9 | Both confirmed and probable deaths (64) |
| Bruxelles | 181 | 5,570 | n.a. | |||
| Community of Madrid | 6,662 | 829 | 6th March; 4th week | 68.8 | 132.8 | Before April, the 17th only people who tested positive in hospital. After, independent of the place of death. |
| Madrid | 3,266 | 5,265 | n.a. | |||
| Catalonia | 7,619 | 235 | 10th March; 4th week | 73.0 | 79.0 | Before April, the 17th only people confirmed and probable cases. After, same as the rest of Spain. |
| Barcellona | 1,636 | 15,999 | n.a. | |||
| Ile-de-France | 12,278 | 1,022 | 11th March; 4th week | 50.0 | 55.7 | Only hospitalized patients who test positive for SARS-CoV-2 (excluding death occurred in community or in nursing homes) (65) |
| Paris | 2,148 | 20,382 | 76.39 | |||
| Greater London | 9,304 | 5,671 | 8th March; 5th week | 14.0 | 62.7 | Only hospitalized patients who test positive for SARS-CoV-2 (included post-mortem test)(66) |
| Inner London | 3,000 | 9,404 | 56.6 | |||
| Stockholms län | 2,119 | 325 | 6th March; 5th week | 32.0 | 93.0 | Patients who test positive for SARS-CoV-2, independently of the cause of death (67) |
| Stockholms | 960 | 5,129 | 96.9^ | |||
| Hovedstaden | 1,846 | 718 | 16th March; 4th week | n.a. | 31.2 | Patients who test positive for SARS-CoV-2, independently of the cause of death (68) |
| Hillerød | 33 | 155 | n.a. | |||
| Lombardy | 10,088 | 422 | 23rd February; 5th week | 50.0 | 141.0 | Patients who test positive for SARS-CoV-2, independently of the cause of death (69) |
| Milan | 3,250 | 2,603 | 72.8+ |
*Considered as the day during which the first 3 deaths were recorded; °Considered the 30th day since the beginning of the epidemic; § based on total COVID-19 deaths; ^ until 15th June 2020; + until 17th April; n.a. not available
Figure 3.
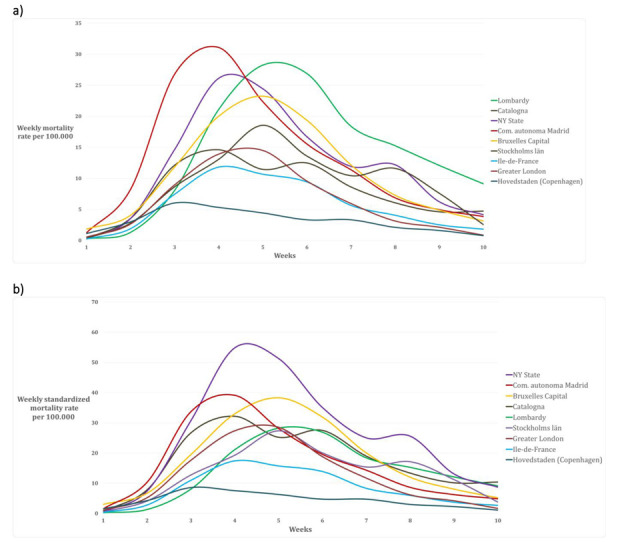
Cumulative weekly mortality rate in the nine Regions (a) crude, and (b) age-standardized
BRUXELLES-CAPITAL – The Bruxelles-Capital Region has a population of 1,208,542 inhabitants and a population density of 7,489 inhabitants/km2 (19). The central area includes the city of Bruxelles (181,726 inhabitants, and population density of 5,570 inhabitants/km2) (20). Considering the population age distribution of the region (Table 1), only 9.4% of the whole population is older than 70 years (Figure 1). In the region there are 146 nursing homes, where 643 confirmed death for COVID-19 occurred until the 7th of June 2020 (representing the 49.2% of the total COVID-19 death recorded in the region) (21). For the period 24th February-24th May 2020, the excess mortality rate not attributed to COVID-19 is 9.2% (134/1,455) higher compared to the same period of 2019 (22). Crude and age-standardized cumulative mortality rate of the Region are shown in Figure 2. Crude cumulative mortality rate of the capital region is shown in Table 2, data starting from the beginning of the epidemic (11th March 2020) (23). Crude and age-ad weekly mortality rate are shown in Figure 3.
COMMUNITY OF MADRID – The Community of Madrid has 6,661,949 inhabitants and a population density of 829.84 inhabitants/km2 (24, 25). The capital region is Madrid with 3,266,126 inhabitants and a population density of 5,265 inhabitants/km2(25). Considering the population age distribution of the region (Table 1), only 13.0% of the whole population is older than 70 years (Figure 1). In the region there are 700 nursing homes, where 1,251 confirmed death and 4,728 probably death for COVID-19 occurred (representing the 68.8% of the total COVID-19 death recorded in the region) (26). For the period 1st January-24th May 2020, the excess mortality rate not attributed to COVID-19 is 42.1% (6,325/15,011) higher compared to the same period of 2019 (27, 28). Crude and age-standardized cumulative mortality rate of the Region are shown in Figure 2. Crude cumulative mortality rate of the capital region is shown in Table 2, data starting from the beginning of the epidemic (6th March 2020) (29). Crude and age-standardized weekly mortality rate are shown in Figure 3.
CATALONIA – Catalonia has 7,619,494 inhabitants and a population density of 235.63 inhabitants/km2 (25). The capital region is Barcelona with 1,636,762 inhabitants and a population density of 15,992.21 inhabitants/km2 (25). Considering the population age distribution of the region (Table 1), only 6.9% of the whole population is older than 70 years (Figure 1). In the region there are 1,073 nursing homes, where 4,084 confirmed death for COVID-19 occurred (representing the 73.1% of the total COVID-19 death recorded in the region) (26). For the period 1st January-24th May 2020, the excess mortality rate not attributed to COVID-19 is 51.5% (5,919/11,494) higher compared to the same period of 2019(27, 28). Crude and age-standardized cumulative mortality rate of the Region are shown in Figure 2. Crude cumulative mortality rate of the capital region is shown in Table 2, data starting from the beginning of the epidemic (10th March 2020) (29). Crude and age-standardized weekly mortality rate are shown in Figure 3.
ÎLE-DE-FRANCE (Paris region) – We analyzed the region of Île-de-France, with 8 Département, a total population of 12,278,210 inhabitants (18% of metropolitan France population) and a population density of 1,022.25 inhabitants /km2 (30). The capital region is Paris, divided into 20 arrondissement, with 2,148,271 inhabitants and a population density of 20,382 inhabitants /km2 (31).
Considering the population age distribution of the region (Table 1), only 10.9% of the whole population is older than 70 years (Figure 1). In the region there are 760 nursing homes (32), where 5,621 confirmed death for COVID-19 occurred until 28th May 2020 (representing approximately the 50% of the total COVID-19 death recorded in the country) (33). For the period 11th March-20th May 2020, the excess mortality rate not attributed to COVID-19 is 37.5% (4,102 /10,952) higher compared to the same period of 2019 (34). Crude and age-standardized cumulative mortality rate of the Region are shown in Figure 2. Crude cumulative mortality rate of the capital region is shown in Table 2, data starting from the beginning of the epidemic 11th March 2020) (35). Crude and age-standardized weekly mortality rate are shown in Figure 3.
GREATER LONDON – The county of Greater London has 8,899,375 inhabitants and a population density of 5,671 inhabitants /km2. Inner London forms the central part of Greater London with 12 boroughs and the City of London; it has 3 million inhabitants (36) and a density of population of 9,404 inhabitants/km2). Considering the population age distribution of the region (Table 1), only 7.9% of the whole population is older than 70 years (Figure 1). In the region there are 426 nursing homes (37), where 803 confirmed death for COVID-19 occurred in the period 10th April – 16th May 2020 (representing the 14% of the total COVID-19 death recorded in the region) (38). For the period 9th March-16th May 2020, the excess mortality rate not attributed to COVID-19 is 51,5% (5,919/11,494) higher compared to the mean value of the previous five years (39). Crude and age-standardized cumulative mortality rate of the Region are shown in Figure 2. Crude cumulative mortality rate of the capital region is shown in Table 2, data starting from the beginning of the epidemic (8th March 2020) (40). Crude and age-standardized weekly mortality rate are shown in Figure 3.
STOCKHOLMS LÄN – Stockholms län has 2.1 million inhabitants and a density of 325.17 inhabitants/km2. The capital region is Stockholm city with 960 thousand inhabitants and a population density of 5,129.47 inhabitants /km2) (41). Considering the population age distribution of the region (Table 1), only 11.8% of the whole population is older than 70 years (Figure 1). In the region there are 400 nursing homes (42), where 630 confirmed death for COVID-19 occurred in the period 10th April – 16th May 2020 (representing the 32% of the total COVID-19 death recorded in the region) (42). For the period 9th March-16th May 2020, the excess mortality rate not attributed to COVID-19 is 13.1% (298/2,275) higher compared to the same period of 2019 (43). Crude and age-standardized cumulative mortality rate of the Region are shown in Figure 2. Crude cumulative mortality rate of the capital region is shown in Table 2, data starting from the beginning of the epidemic (6th March 2020). Crude and age-standardized weekly mortality rate are shown in Figure 3.
HOVEDTSNDEN (Copenhagen region) – Hovedtsnden has 1,846,023 inhabitants and a population density of 718.57 inhabitants /km2. The capital region is Hillerød with 33,088 inhabitants and a population density of 155.34 inhabitants /km2) (44). Considering the population age distribution of the region (Table 1), only 12.4% of the whole population is older than 70 years (Figure 1). In the region there are 229 nursing homes (45), data on confirmed deaths occurred in nursing home is not available. For the period 15th March-26th May 2020, the excess mortality rate not attributed to COVID-19 is -1.9% (-206/10,741) higher compared to the same period of 2019 (43). Crude and age-standardized cumulative mortality rate of the Region are shown in Figure 2. Crude cumulative mortality rate of the capital region is shown in Table 2, data starting from the beginning of the epidemic (16th March 2020). Crude and age-standardized weekly mortality rate are shown in Figure 3.
LOMBARDY (Milan Region) – The Lombardy Region, with a population of 10,060,574 people and a population density of 422 inhabitants per km2. The capital region is the metropolitan area of Milan, which consists of the city of Milan and other 133 municipalities, with a total of 3,250,315 inhabitants and a population density of 2,063 inhabitants/km2 (46). Considering the population age distribution of the region (Table 1), 17% of the whole population is older than 70 years (Figure 1). In the region there are 717 nursing homes (47), where approximately 50% of the total COVID-19 death recorded in the region has been occurred (data not published). For the period 23rd February-2nd May 2020, the excess mortality rate not attributed to COVID-19 is 66.5% (27,334/41,083) higher compared to the same period of 2019 (48). Crude and age-standardized cumulative mortality rate of the Region are shown in Figure 2. Crude cumulative mortality rate of the capital region is shown in Table 2, data starting from the beginning of the epidemic (23rd February 2020) (49). Crude and age-standardized weekly mortality rate are shown in Figure 3.
Figure 2 and 3 represent the epidemic spread in the nine metropolitan regions with the cumulative daily mortality rate, the standardized mortality rate, the crude weekly mortality rate and the weekly age-standardized mortality rate. We decided to conclude the analytic comparison after 10 weeks (day 70) from the onset of the outbreak (Table 2).
Since the first reports of the COVID-19 pandemic, in China (50), data showed a higher hospitalization rate among elderly (older than 65 years) (51), and a sever clinical manifestation among patients with comorbidities (52). According to TESSy data, deaths are approximately 40% among people aged 65-79 years, and approximately 50% among people older than 80 years (52). As emerges from this data, COVID-19 serious clinical cases impacted the most on elder populations.
Figure 1 shows how Lombardy is the region with the highest proportion of elder populations, with a proportion of over 70-year-olds 70% higher when compared with the other Regions studied (17% vs. 10%). Considering this important difference in population distribution, the age-standardized mortality rates were calculated. Although Lombardy was the first European region to be affected by the epidemic (53), the cumulative age-standardized mortality rates of Lombardy are in the average and lower than the community of Madrid, Catalonia, Brussels-Capital, and New York State. For the latter, the estimated cumulative age-standardized mortality is approximately double compared to Lombardy (Figure 2 b).
Considering that high-risk subjects are frequently guests of nursing homes, and also accounting for the numerous outbreaks reported in these settings across European countries (42), we report on COVID-19 burden in our study settings. The proportion of COVID-19 deaths recorded in the nursing homes is, according to available data, between 14% and 73% of total COVID-19 deaths, in almost all the regions analyzed, but in the two Spanish regions the proportion exceeded 60% (54). However, it is necessary to take into account that different diagnostic test strategies, as well as different definitions of COVID-19 deaths, have been adopted in the various countries, potentially reducing the identification of cases. Moreover, especially at the beginning of the epidemic, there was a global shortage of reagents – useful for carrying out the molecular test – as well as health personnel (both in laboratory and for clinical assistance) (55). These factors must be taken into account in the interpretation of the total and not attributed to COVID-19 excesses mortality rates, which however are almost homogeneous in the 9 Regions except one (New York).
Although the Lombardy case was the first to be described by the media, it is of great scientific interest as well (56), since even the alleged excess of deaths compared to the other regions (57), this is not confirmed by our results. Given that the crude mortality rate (number of deaths for COVID-19 / reference population per unit of time) is largely affected by the age distribution of the population; and considering that COVID-19 has a greater disease burden among the elderly, it is appropriate to estimate age-standardized mortality. The standardized age mortality rate allows to increase the level of comparability and expresses the mortality rate that the population would have if the age distribution would be the same as the reference population (standard).
Possible bias
The nine areas analyzed have similar economic characteristics, healthcare standards and COVID-19 surveillance data collection procedures, which allowed us to make a reliable data comparison. The choice of these areas followed administrative borders and the availability of the disaggregated mortality data.
Our analysis considered daily COVID-19 mortality rates derived by national surveillance statistics, which are more reliable than infection notifications (laboratory confirmed cases). Indeed, notified cases data are largely lower as compared to true disease and infection burden, and highly variable depending on different testing strategies and criteria adopted in different regions (58, 59), although it cannot be ruled out that a portion of the deaths caused by COVID-19 went undiagnosed. In Table 2 we reported the definition of COVID-19 death adopted in each considered region. It should be noted that in surveillance systems in Ile de France and Greater London region only deaths occurred in hospital settings have been included. This could explain, at least partially, the lower value of the recorded mortality rate in these regions. However, we believe that this possible bias does not affect much our comparative estimates. Actually, mortality is more reliable than other types of data. Finally, we explored excess mortality rates, because this measure allows to also estimate the indirect impact of the COVID-19 epidemic. Excess mortality also takes into account deaths potentially occurring due to lack of access to treatment, due to indirect effect of lockdown measures, of other non-COVID patients.
Conclusions
We analyzed the COVID-19 epidemic trend in nine regions and areas comparable from an economic, social, and healthcare perspective, using reliable indicators, such as the cause of death. In all considered areas the epidemic curve began to decrease around the 4th and 5th week, slowing down at 10 weeks since epideminc onset, with a mortality peak during the 4th week in all study settings but in Lombardy, Stockholms län and Bruxelles-Capital during the 5th week. However, in all cases the curves showed the classic model of logistic growth (60). This postponement of the peak of deaths could be attributed to the different type of adopted response approach. For instance, in Lombardy COVID-19 clinical management was more hospital-based, and then had a mixed approach (hospital and home) (61). This may have influenced the total number of confirmed deaths, as all hospitalized patients were tested for COVID-19. Of note that this region is the one with the highest number of elder populations. The age distribution in the 9 regions shows significant differences and, in this context, it appears particularly important, being the mortality rate for COVID-19 highly variable at different ages (about 100 times higher in the ≥80 group compared to the group <60 years). This aspect deserves further investigation to assess whether age itself is a risk factor, independently from the presence of comorbidities, as suggested in some studies (62). Having said that, it seems more logical to consider age-standardized mortality, because it reduces differences among regions, with the only exception of New York State (excess mortality), Hovedstaden (Copenhagen) and, in part, of Il-de-France (apparently lower mortality). The latter could find explanation, at least partially, in the different testing strategies of testing and definitions adopted by surveillance systems, including definition of COVID-19 death. However, these aspects cannot completely explain all the differences, also taking into consideration different epidemic dynamics and clinical evolution.
Lombardy remained the only region in which the capital-region (Milan) was not significantly affected by the epidemic wave, the city having mortality rates lower than the rest of the region. We have already expanded on potential explanation of this phenomenon (4). However, it should be noted that COVID-19 mortality rate in Lombardy, which was one of the lowest at 30 days since outbreak onset, grew more than in other regions starting form 5th week onwards, with a slower drop compared to other areas. A similar trend was recorded in Stockholms län. New York (both the entire State and the metropolitan area) largely exceed all the other considered regions in terms of COVID-19 mortality. This area is characterized by a younger population, a greater metropolitan population density, presence of many neighborhoods with foreign populations, a medium-low economic level, and a private health system. These elements might have played a role in excess mortality from COVID-19.
However, these data deserve further investigation, considering the different management approaches of phase 1 of the epidemic (mainly hospital with containment measures) compared to phase 2 (when efficient action at the community level is highly required and when nursing homes outbreaks could have played a significant role, particularly among the elderly and fragile patients).
In conclusion, it can be said that the impact of the COVID-19 epidemic has been significant in terms of mortality in at least 7 of the 9 metropolitan areas considered. Furthermore, COVID-19 mortality trends were relatively homogeneous even slightly shifted in time (onset of the epidemics). In addition, the Lombardy region reported the highest crude COVID-19 mortality (especially in the second phase of the epidemic) although then similar to the other European regions after standardization by age, having Lombardy elder populations with consequently high prevalence of chronic conditions. Future research on overall mortality over a longer period of time will allow to better assess the overall impact of the COVID-19 epidemic on population health. At the same time, the harvesting effect that anticipated death in patients with chronic diseases, the possible excess of non-COVID-19 mortality during the epidemic peak due to non-use of health services, and the reasons behind lower reported mortality in some geographical areas need to be further investigated. Having reliable data to inform and support future outbreak response strategies will not only help reducing mortality but will also support public health action at the population level (63).
Funding: This paper is a preliminary activity of the EU Project n. 101003562 “Three Rapid Diagnostic tests (Point-of-Care) for COVID-19 Coronavirus, improving epidemic preparedness, and foster public health and socio-economic benefits - CORONADX” (Task 7.1) supported by the European Commission (Horizon 2020, H2020-SC1-PHE-CORONAVIRUS-2020).
Conflict of interest:
Each author declares that he or she has no commercial associations (e.g. consultancies, stock ownership, equity interest, patent/licensing arrangement etc.) that might pose a conflict of interest in connection with the submitted article
References
- 1.Wilder-Smith A, Chiew CJ, Lee VJ. Can we contain the COVID-19 outbreak with the same measures as for SARS? Lancet Infect Dis. 2020 doi: 10.1016/S1473-3099(20)30129-8. [DOI] [PMC free article] [PubMed] [Google Scholar]
- 2.Kraemer MUG, Yang CH, Gutierrez B, Wu CH, Klein B, Pigott DM, et al. The effect of human mobility and control measures on the COVID-19 epidemic in China. Science. 2020 doi: 10.1126/science.abb4218. in press. [DOI] [PMC free article] [PubMed] [Google Scholar]
- 3.Amerio A, Bianchi D, Santi F, Costantini L, Odone A, Signorelli C, et al. Covid-19 pandemic impact on mental health: a web-based cross-sectional survey on a sample of Italian general practitioners. Acta Biomed. 2020;91(2):83–8. doi: 10.23750/abm.v91i2.9619. [DOI] [PMC free article] [PubMed] [Google Scholar]
- 4.Signorelli C, Scognamiglio T, Odone A. COVID-19 in Italy: impact of containment measures and prevalence estimates of infection in the general population. Acta Biomed. 2020;91(3-S):175–9. doi: 10.23750/abm.v91i3-S.9511. [DOI] [PMC free article] [PubMed] [Google Scholar]
- 5.Tang B, Wang X, Li Q, Bragazzi NL, Tang S, Xiao Y, et al. Estimation of the Transmission Risk of the 2019-nCoV and Its Implication for Public Health Interventions. J Clin Med. 2020;9(2) doi: 10.3390/jcm9020462. [DOI] [PMC free article] [PubMed] [Google Scholar]
- 6.Mayor S. Covid-19: Researchers launch app to track spread of symptoms in the UK. BMJ. 2020;368:m1263. doi: 10.1136/bmj.m1263. [DOI] [PubMed] [Google Scholar]
- 7.Gianfredi V, Odone A, Fiacchini D, Rosselli R, Battista T, Signorelli C. Trust and reputation management, branding, social media management nelle organizzazioni sanitarie: sfide e opportunità per la comunità igienistica italiana. J Prev Med Hyg. 2019;60(3):E108–E9. [Google Scholar]
- 8.Gianfredi V, Grisci C, Nucci D, Parisi V, Moretti M. Communication in health. Recenti Prog Med. 2018;109(7):374–83. doi: 10.1701/2955.29706. [DOI] [PubMed] [Google Scholar]
- 9.Moro M, Vigezzi GP, Capraro M, Biancardi A, Nizzero P, Signorelli C, et al. 2019-novel coronavirus survey: knowledge and attitudes of hospital staff of a large Italian teaching hospital. Acta Biomed. 2020;91(3-s):29–34. doi: 10.23750/abm.v91i3-S.9419. [DOI] [PMC free article] [PubMed] [Google Scholar]
- 10.Signorelli C, Fara GM. COVID-19: Hygiene and Public Health to the front. Acta Biomed. 2020;91(3-S):7–8. doi: 10.23750/abm.v91i3-S.9507. [DOI] [PMC free article] [PubMed] [Google Scholar]
- 11.Capolongo S, Rebecchi A, Buffoli M, Appolloni L, Signorelli C, Fara GM, et al. COVID-19 and Cities: from Urban Health strategies to the pandemic challenge. A Decalogue of Public Health opportunities. Acta Biomed. 2020;91(2):13–22. doi: 10.23750/abm.v91i2.9515. [DOI] [PMC free article] [PubMed] [Google Scholar]
- 12.Signorelli C, Odone A, Gianfredi V, Bossi E, Bucci D, Oradini-Alacreu A, et al. The spread of COVID-19 in six western metropolitan regions: a false myth on the excess of mortality in Lombardy and the defense of the city of Milan. Acta Biomed. 2020;91(2):23–30. doi: 10.23750/abm.v91i2.9600. [DOI] [PMC free article] [PubMed] [Google Scholar]
- 13.Russo P. Coronavirus, le stime dei ricercatori: “In Italia almeno 2800 morti non dichiarati” 2020 [Access date 13 April 2020. Available from: https://www.lastampa.it/topnews/primo-piano/2020/03/30/news/le-stime-dei-ricercatori-almeno-2800-morti-non-dichiarati-1.38653880 . [Google Scholar]
- 14.United States Census Explore Census Data 2020. [Access date 13 April 2020 Available from: https://data.census.gov/cedsci/ [Google Scholar]
- 15.Department of Health-New York State. Nursing Home and ACF COVID Related Deaths Statewide 2020. [Access date 17 June 2020 Available from: https://www.health.ny.gov/statistics/diseases/covid-19/fatalities_nursing_home_acf.pdf . [Google Scholar]
- 16.Centers for Disease Control and Prevention. Excess Deaths Associated with COVID-19 2020. [Access date 17 June 2020 Available from: https://www.cdc.gov/nchs/nvss/vsrr/covid19/excess_deaths.htm . [Google Scholar]
- 17.Centers for Disease Control and Prevention. CDC COVID Data Tracker 2020. [Access date 17 June 2020 Available from: https://www.cdc.gov/covid-data-tracker/#cases . [Google Scholar]
- 18.NYC Health COVID-19: Data 2020. [Access date 17 June 2020 Available from: https://www1.nyc.gov/site/doh/covid/covid-19-data.page . [Google Scholar]
- 19.European Commission. Population: Demographic situation, languages and religions 2019. [Access date 13 April 2020 Available from: https://eacea.ec.europa.eu/national-policies/eurydice/content/population-demographic-situation-languages-and-religions-7_en . [Google Scholar]
- 20.City population. Bruxelles Municipality 2019. [Access date 13 April 2020 Available from: https://www.citypopulation.de/en/belgium/bruxelles/_/21004__bruxelles/ [Google Scholar]
- 21.The Brussels Times. Nursing home residents make up nearly half of Belgium’s coronavirus deaths 2020. [Access date 13 April 2020 Available from: https://www.brusselstimes.com/all-news/belgium-all-news/105848/nearly-half-of-belgiums-coronavirus-deaths-are-nursing-home-residents/ [Google Scholar]
- 22.Statista. Observed and expected weekly death tolls in the Brussels-Capital Region (Belgium) from February to April 2020 2020. [Access date 15 June 2020 Available from: https://www.statista.com/statistics/1114383/excess-deaths-in-brussels-by-coronavirus/ [Google Scholar]
- 23.Sciensano. COVID-19 - Situation épidémiologique 2020. [Access date 15 April 2020 Available from: https://epistat.wiv-isp.be/covid/ [Google Scholar]
- 24.Portal del Ayuntamiento de Madrid Portal web del Ayuntamiento de Madrid 2019. [Access date 13 April 2020 Available from: https://www.madrid.es/portal/site/munimadrid# . [Google Scholar]
- 25.Instituto Nacional de Estadistica. Demografía y población 2019. [Access date 13 April 2020 Available from: https://www.ine.es/ [Google Scholar]
- 26.Ministerio de Sanidad de España. Radiografía del coronavirus en residencias de ancianos: más de 19.500 muertos con Covid-19 o síntomas compatibles 2020. [Access date 17 June 2020 Available from: https://www.rtve.es/noticias/20200614/radiografia-del-coronavirus-residencias-ancianos-espana/2011609.shtml . [Google Scholar]
- 27.EuroMOMO. EuroMOMO Bulletin, Week 23, 2020 2020. [Access date 17 June 2020 Available from: https://www.euromomo.eu/ [Google Scholar]
- 28.Istituto Nacional de Estadistica. Estimación del número de defunciones semanales durante el brote de covid-19 2020. [Access date 17 June 2020 Available from: https://www.ine.es/experimental/defunciones/experimental_defunciones.htm#tablas_resultados . [Google Scholar]
- 29.Ministerio de Sanidad de España. Situación de COVID-19 en España 2020. [Access date 13 June 2020 Available from: https://covid19.isciii.es/ [Google Scholar]
- 30.Institut National de la statistique et des études éeconomiquesk. The National Institute of Statistics and Economic Studies collects, analyses and disseminates information on the French economy and society 2019. [Access date 13 April 2020 Available from: https://www.insee.fr/en/accueil . [Google Scholar]
- 31.Institut National de la statistique et des études éeconomiques. The National Institute of Statistics and Economic Studies collects, analyses and disseminates information on the French economy and society 2019. [Access date 17 June 2020 Available from: https://www.insee.fr/en/accueil . [Google Scholar]
- 32.Caisse nationale de solidarieté pour l’autonomie. Annuaire des EHPAD et maisons de retraite 2020. [Access date 18 June 2020 Available from: https://www.pour-les-personnes-agees.gouv.fr/annuaire-ehpad-et-maisons-de-retraite?departement=PARIS%20(75)#container-result-query . [Google Scholar]
- 33.Santè Publique France. COVID-19: point épidémiologique en Ile-de-France du 11 juin 2020 2020. [Access date 18 June 2020 Available from: https://www.santepubliquefrance.fr/regions/ile-de-france/documents/bulletin-regional/2020/covid-19-point-epidemiologique-en-ile-de-france-du-11-juin-2020 . [Google Scholar]
- 34.Istitut National de la statistique et des ètudes èconomiques. Info coronavirus 2020. [Access date 18 June 2020 Available from: https://www.insee.fr/fr/statistiques/4487861?sommaire=4487854 . [Google Scholar]
- 35.Gouvernement France. COVID-19 en France 2020. [Access date 13 April 2020 Available from: https://www.gouvernement.fr/info-coronavirus/carte-et-donnees . [Google Scholar]
- 36.World Population Review. London Population 2020 2020. [Access date 15 April 2020 Available from: https://worldpopulationreview.com/world-cities/london-population/ [Google Scholar]
- 37.United States Census. New York County (Manhattan Borough), New York 2020. [Access date 18 June 2020 Available from: https://www.census.gov/quickfacts/newyorkcountymanhattanboroughnewyork . [Google Scholar]
- 38.Office for National Statistics. Number of deaths in care homes notified to the Care Quality Commission, England. 2020. [Access date 18 June 2020 Available from: https://www.ons.gov.uk/peoplepopulationandcommunity/birthsdeathsandmarriages/deaths/datasets/numberofdeathsincarehomesnotifiedtothecarequalitycommissionengland . [Google Scholar]
- 39.Office for National Statistics. Deaths registered weekly in England and Wales, provisional: week ending 22 May 2020. 2020. [Access date 18 June 2020 Available from: https://www.ons.gov.uk/peoplepopulationandcommunity/birthsdeathsandmarriages/deaths/bulletins/deathsregisteredweeklyinenglandandwalesprovisional/latest .] [Google Scholar]
- 40.NHS England. COVID-19 Daily Deaths 2020. Access date 15 April 2020 Available from: https://www.england.nhs.uk/statistics/statistical-work-areas/covid-19-daily-deaths/ [Google Scholar]
- 41.World Population Review. Stockholm Population 2019 2020. Access date 15 June 2020 Available from: https://worldpopulationreview.com/world-cities/stockholm-population/ [Google Scholar]
- 42.European Centre for Disease Prevention and Control. Surveillance of COVID-19 at longterm care facilities in the EU/EEA. Stockholm; 2020 [Google Scholar]
- 43.Socialstyrelsen. Statistik relaterad till covid-19 2020. [Access date 15 June 2020 Available from: https://www.socialstyrelsen.se/statistik-och-data/statistik/statistik-om-covid-19/statistik-relaterad-till-covid-19/ .] [Google Scholar]
- 44.Statistics Denmark. Population 2019 2020. [Access date 15 June 2020 Available from: https://www.dst.dk/en/Statistik/emner/befolkning-og-valg .] [Google Scholar]
- 45.Dun and Bradstreet Coronavirus Resources. Nursing Homes & Long-Term Care Facilities Companies In Hovedstaden, Denmark 2020. [Access date 17 June 2020 Available from: https://www.dnb.com/business-directory/company-information.nursing-homes-long-term-care-facilities.dk.hovedstaden.html?page=5 .] [Google Scholar]
- 46.Istituto Nazionale di Statistica (ISTAT) Popolazione residente al 1° gennaio 2019. [Access date 13 April 2020 Available from: http://dati.istat.it/Index.aspx?DataSetCode=DCIS_POPRES1 .] [Google Scholar]
- 47.Regione Lombardia-ATS Milano Città Metropolitana. RSA Flusso Covid 19. 2020. [Access date 17 June 2020 Available from: https://www.ats-milano.it/portale/Portals/0/emergenza%20coronavirus/Report%2013_05_20_Flusso%20Covid%20RSA.pdf. ] [Google Scholar]
- 48.Istituto Nazionale di Statistica (ISTAT) Decessi e cause di morte: cosa produce l’ISTAT 2020. [Access date 18 June 2020 Available from: https://www.istat.it/it/archivio/240401 .] [Google Scholar]
- 49.Dipartimento della Protezione Civile. COVID-19 Italia-Monitoraggio della situazione 2020. [Access date 18 June 2020 Available from: http://www.protezionecivile.gov.it/attivita-rischi/rischio-sanitario/emergenze/coronavirus . [Google Scholar]
- 50.Zhu N, Zhang D, Wang W, Li X, Yang B, Song J, et al. A Novel Coronavirus from Patients with Pneumonia in China, 2019. The New England journal of medicine. 2020;382(8):727–33. doi: 10.1056/NEJMoa2001017. [DOI] [PMC free article] [PubMed] [Google Scholar]
- 51.Li X, Xu S, Yu M, Wang K, Tao Y, Zhou Y, et al. Risk factors for severity and mortality in adult COVID-19 inpatients in Wuhan. J Allergy Clin Immunol. 2020 doi: 10.1016/j.jaci.2020.04.006. [DOI] [PMC free article] [PubMed] [Google Scholar]
- 52.European Centre for Disease Prevention and Control. Rapid Risk Assessment: Coronavirus disease 2019 (COVID-19) in the EU/EEA and the UK-ninth update. Stockholm. 2020 [Google Scholar]
- 53.Ministero della Salute. Covid-19 - Situazione in Italia 2020. [Access date 13 April 2020 Available from: http://www.salute.gov.it/portale/nuovocoronavirus/dettaglioContenutiNuovoCoronavirus.jsp?area=nuovoCoronavirus&id=5351&lingua=italiano&menu=vuoto .] [Google Scholar]
- 54.Associazione gestione servizi socio-sanitari e cure post intensive. Documento di chiarificazione presentato da AGeSPI Lombardia alla Commissione RSA Lombardia. Milano: AGeSI Lombardia. 2020 [Google Scholar]
- 55.Scott A. Is a reagents shortage delaying European COVID-19 testing? Chemical and Engineering news. 2020;98(13) [Google Scholar]
- 56.Sechi GM, Migliori M, Dassi G, Pagliosa A, Bonora R, Oradini-Alacreu A, et al. Business Intelligence applied to Emergency Medical Services in the Lombardy region during SARS-CoV-2 epidemic. Acta Biomed. 2020;91(2):39–44. doi: 10.23750/abm.v91i2.9557. [DOI] [PMC free article] [PubMed] [Google Scholar]
- 57.Lazzerini M, Putoto G. COVID-19 in Italy: momentous decisions and many uncertainties. Lancet Glob Health. 2020 doi: 10.1016/S2214-109X(20)30110-8. [DOI] [PMC free article] [PubMed] [Google Scholar]
- 58.Romanò L, Pariani E, Biganzoli E, Castaldi S. The end of lockdown what next? Acta Biomedica. 2020;91(2) doi: 10.23750/abm.v91i2.9605. [DOI] [PMC free article] [PubMed] [Google Scholar]
- 59.Odone A, Delmonte D, Scognamiglio T, Signorelli C. COVID-19 deaths in Lombardy, Italy: data in context. The Lancet Public health. 2020;5(6):e310. doi: 10.1016/S2468-2667(20)30099-2. [DOI] [PMC free article] [PubMed] [Google Scholar]
- 60.Tátrai D, Várallyay Z. COVID-19 epidemic outcome predictions based on logistic fitting and estimation of its reliability. arXiv preprint. 2020 [Google Scholar]
- 61.Pecoraro F, Luzi D, Clemente F. Analysis of the different approaches adopted in the Italian regions to care for patients affected by COVID-19. Heliyon. 2020 doi: 10.3390/ijerph18030848. in press. [DOI] [PMC free article] [PubMed] [Google Scholar]
- 62.Banerjee A, Pasea L, Harris S, Gonzalez-Izquierdo A, Torralbo A, Shallcross L, et al. Estimating excess 1-year mortality associated with the COVID-19 pandemic according to underlying conditions and age: a population-based cohort study. Lancet (London, England) 2020;395(10238):1715–25. doi: 10.1016/S0140-6736(20)30854-0. [DOI] [PMC free article] [PubMed] [Google Scholar]
- 63.Gianfredi V, Balzarini F, Gola M, Mangano S, Carpagnano LF, Colucci ME, et al. Leadership in Public Health: Opportunities for Young Generations Within Scientific Associations and the Experience of the “Academy of Young Leaders”. Front Public Health. 2019;7:378. doi: 10.3389/fpubh.2019.00378. [DOI] [PMC free article] [PubMed] [Google Scholar]
- 64.Sciensano. COVID19 BE open data codebook. 2020. [Access date 13 June 2020 Available from: https://epistat.sciensano.be/COVID19BE_codebook.pdf. ] [Google Scholar]
- 65.Gouvernement France. COVID-19 2020. [Access date 13 June 2020 Available from: https://www.gouvernement.fr/info-coronavirus/carte-et-donnees .] [Google Scholar]
- 66.NHS england. COVID-19 Daily Deaths 2020. [Access date 13 June 2020 Available from: https://www.england.nhs.uk/statistics/statistical-work-areas/covid-19-daily-deaths/ .] [Google Scholar]
- 67.Folkhalsomyndig. Totalt antal laboratoriebekräftade 2020. [Access date 13 June 2020 Available from: https://experience.arcgis.com/experience/09f821667ce64bf7be6f9f87457ed9aa .] [Google Scholar]
- 68.Statens Serum Institut COVID-19 i Danmark. 2020. [Access date 13 June 2020 Available from: https://www.ssi.dk/aktuelt/sygdomsudbrud/coronavirus/covid-19-i-danmark-epidemiologisk-overvaagningsrapport. ] [Google Scholar]
- 69.Istituto Superiore di Sanità. Characteristics of SARS-CoV-2 patients dying in Italy Report based on available data on April 20th, 2020. [Access date 13 June 2020 Available from: https://www.epicentro.iss.it/en/coronavirus/bollettino/Report-COVID-2019_20_april_2020.pdf .] [Google Scholar]