

Abstract
Background
Uremic toxins are associated with various chronic kidney disease-related comorbidities. Indoxyl sulfate (IS), a protein-bound uremic toxin, reacts with vasculature, accelerating atherosclerosis and/or vascular calcification in animal models. Few studies have examined the relationship of IS with clinical outcomes in a large cohort of hemodialysis (HD) patients.
Methods
We included 1170 HD patients from the Japan Dialysis Outcomes and Practice Patterns Study Phase 5 (2012–15). We evaluated the associations of serum total IS (tIS) levels with all-cause mortality and clinical outcomes including cardiovascular (CV)-, infectious- and malignancy-caused events using Cox regressions.
Results
The median (interquartile range) serum tIS level at baseline was 31.6 μg/mL (22.6–42.0). Serum tIS level was positively associated with dialysis vintage. Median follow-up was 2.8 years (range: 0.01–2.9). We observed 174 deaths (14.9%; crude rate, 0.06/year). Serum tIS level was positively associated with all-cause mortality [adjusted hazard ratio per 10 μg/mL higher, 1.16; 95% confidence interval (CI) 1.04–1.28]. Association with cause-specific death or hospitalization events, per 10 μg/mL higher serum tIS level, was 1.18 (95% CI 1.04–1.34) for infectious events, 1.08 (95% CI 0.97–1.20) for CV events and 1.02 (95% CI 0.87–1.21) for malignancy events after adjusting for covariates including several nutritional markers.
Conclusions
In a large cohort study of HD patients, serum tIS level was positively associated with all-cause mortality and infectious events.
Keywords: hemodialysis, indoxyl sulfate, infection, J-DOPPS, mortality
INTRODUCTION
Advanced chronic kidney disease (CKD) patients have high risk for the development of various systemic disorders including cardiovascular disease (CVD) and infections, as well as poorer survival [1]. The incidence and severity are enhanced with the progression of CKD, especially in end-stage kidney disease patients requiring dialysis treatment. The US Renal Data System (USRDS) reported that arrhythmia/cardiac arrest, withdrawal, septicemia, malignancy and myocardial infarction were the main causes of death in dialysis patients in the USA (USRDS 2017 Annual Data Report). The Japanese Society of Dialysis Therapy also showed that the main causes of death in Japanese dialysis patients consisted of heart failure, infection, malignancy, cerebrovascular disease and myocardial infarction [2]. There are several traditional and nontraditional risk factors for CKD-related disease and unknown risk factors for worse clinical outcomes still exist in dialysis patients. An accumulation of uremic toxins is one of the major CKD-specific risk factors [3]. Uremic toxins consist of three types, including water-soluble small-sized molecules, middle-sized molecules and protein-bound uremic toxins (PBUTs) [4]. Recent progress of dialysis treatments has improved removal of water-soluble small and middle molecular weight uremic toxins; however, removal of PBUTs with standard hemodialysis (HD) sessions is insufficient owing to their high protein-bound properties. For example, indoxyl sulfate (IS), a representative PBUT, is formed from indole that is produced in the intestine. The protein-bound fraction in blood is 98%, and clearance with one conventional HD session is only 32% [5]. Basic studies showed that IS induces acceleration of various systemic disorders, such as atherosclerosis and abnormal bone metabolism, in kidney-damaged animal models [6, 7]. Thus, the accumulation of IS may be an important factor associated with mortality and clinical outcomes in HD patients. However, few large cohort studies have examined the association between IS and clinical outcomes in HD patients, and the results are controversial. Among CKD Stages 2–5 D patients, high serum level of IS was associated with higher cardiovascular (CV) and all-cause mortality [8]. On the other hand, the Hemodialysis (HEMO) study found no significant associations of several PBUTs including IS with cardiovascular disease (CVD) and all-cause mortality in HD patients [9].
Using data from the Japan Dialysis Outcomes and Practice Patterns Study (J-DOPPS), we examined associations of IS with mortality and clinical events including CVD, infection and malignancy in HD patients.
MATERIALS AND METHODS
The DOPPS is an international prospective cohort study of HD practices ongoing since 1996. Details on study design and methods have been published [10]. The protocol of DOPPS is compliant to the Helsinki Declaration of 1975, as revised in 2013. We used Japanese data from DOPPS Phase 5 (J-DOPPS; 2012–15) in this analysis. Demographic and baseline clinical status variables were collected at study entry. Laboratory test values and renal medications were collected at study entry and monthly thereafter. An ancillary study to J-DOPPS 5 collected biosamples from study patients annually to ascertain laboratory values not commonly collected in dialysis practice, including IS. Total IS (tIS, combination of protein-bound and free fraction) was measured from serum samples using high-performance liquid chromatography [11]. The first round of ancillary biosample data was collected between 6 August 2012 and 25 September 2012 and was merged with contemporary baseline and monthly J-DOPPS 5 data records dated no more than 120 days prior to the biosample collection date. We excluded 30 patients with missing mortality data and/or insufficient facility-level reporting of clinical events.
We evaluated the association between tIS levels and clinical outcomes by performing Cox proportional hazards regression models. We analyzed four clinical outcomes: all-cause mortality, and composite events for CV-, infectious- or malignancy-related causes. The composite events were defined as the first occurrence of death or hospitalization due to each cause (see Supplementary data, Tables S1–S3 for lists of qualifying events). Time at risk for the Cox analyses of each outcome began on the date of ancillary biosample collection for each patient and continued until the clinical outcome was observed, patients departed from J-DOPPS (typically due to transfer out of the study site) or the end date of J-DOPPS Phase 5 (31 May 2015). We provide hazard ratios (HRs) and 95% confidence intervals (CIs) corresponding to a 10 μg/mL increase in tIS as well as for quartiles of tIS using the first quartile as the referent category. A robust variance estimator was employed to account for potential intrafacility clustering.
We selected candidate model covariates based on expected clinical relevance and known associations suggested by prior research studies. Model results were estimated using three progressive sets of potential confounders: (i) age, sex, dialysis vintage, diabetic status and prior history of CVD; (ii) single-pool Kt/V urea [12] and measures of nutritional status/intake including serum albumin, normalized protein catabolic rate (nPCR) [13], serum creatinine and body mass index (BMI); and (iii) use of hemodiafiltration (HDF) and serum levels of alkaline phosphatase, total calcium, log C-reactive protein and phosphorus. HRs for confounder variables had the expected directionality with respect to clinical outcomes. We also investigated several potential effect modifications of tIS with respect to clinical outcomes. Global tests based on Schoenfeld residuals suggested the proportional hazards assumption was satisfied for all models. The association of tIS with vintage was described using a scatterplot and a LOcal regrESSion smoothed trend [14].
Missing data for each variable were <5% except for BMI (6.6%), single-pool Kt/V urea (9.7%) and residual kidney function (RKF, defined as urine output >200 mL/day; 14.6%). We used multiple imputations to replace missing values. For each variable, we obtained five random instances drawn from posterior distributions estimated using the chained equations’ method implemented by IVEware [15]. Model results were estimated separately by imputation and combined using SAS PROC MIANALYZE.
Data management and statistical analyses were performed using SAS 9.4 (SAS Institute Inc., Cary, NC, USA).
RESULTS
The final analysis sample included 1170 patients for the mortality analysis and 1165 patients for composite analyses. The distribution of tIS values is shown in Figure 1. At study enrollment, the mean [standard deviation (SD)] tIS level was 33.1 μg/mL (15.4) and the median level was 31.6 μg/mL [interquartile range (IQR) 22.6–42.0; Table 1]. Patients with higher serum tIS levels tended to have younger age and longer vintage (Figure 2), higher levels of nutritional intake markers (nPCR, albumin, creatinine and phosphorus) and parathyroid hormone, lower prevalence of RKF and diabetes, and were more likely to be prescribed noncalcium-based phosphate binders.
FIGURE 1:
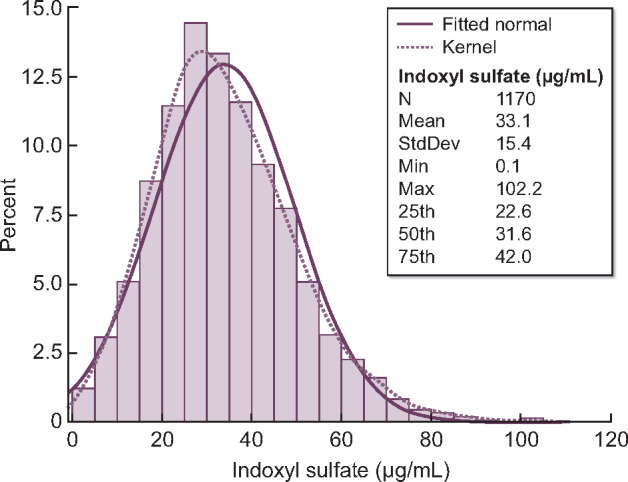
Distribution of tIS (combination of protein-bound and free fraction). Values were obtained ∼1 month after J-DOPPS 5 study entry.
Table 1.
Characteristics of the analysis sample (n = 1170)
| Quartile of tIS |
|||||
|---|---|---|---|---|---|
| Overall | <23 μg/mL | 23–32 μg/mL | 32–42 μg/mL | 42+ μg/mL | |
| IS, range, μg/mL | 0–102 | 0–23 | 23–32 | 32–42 | 42–102 |
| IS, mean (SD), μg/mL | 33.1 (15.4) | 15.2 (5.6) | 27.3 (2.6) | 36.3 (3.0) | 53.8 (10.5) |
| IS, median (IQR), μg/mL | 31.6 (22.6, 42.0) | 16.5 (11.8, 19.7) | 27.1 (25.2, 29.5) | 36.0 (33.7, 39.1) | 50.6 (45.9, 58.4) |
| Age, mean (SD), years | 65.6 (12.2) | 66.1 (12.5) | 65.7 (11.6) | 66 (12.5) | 64.4 (12.2) |
| Vintage, median (IQR), years | 6.1 (2.8, 12.5) | 3.5 (1.5, 8.5) | 5.9 (3.0, 13.2) | 6.6 (3.1, 12.6) | 7.6 (4.2, 15.0) |
| RKF, % | 16.1 | 22.6 | 16.4 | 15.4 | 9.9 |
| Primary end-stage renal disease cause, % | |||||
| Diabetes | 34.8 | 42.1 | 33.3 | 34.2 | 29.5 |
| Glomerulonephritis | 38.1 | 34.5 | 37.9 | 38.9 | 41.1 |
| Hypertension | 7.1 | 6.5 | 8.5 | 6.2 | 7.3 |
| Other | 20.0 | 16.9 | 20.2 | 20.7 | 22.2 |
| Male, % | 62.6 | 63.4 | 59.0 | 64.5 | 63.4 |
| HDF use, % | 8.2 | 8.2 | 7.5 | 7.8 | 9.2 |
| Vascular access, % | |||||
| Arteriovenous fistula | 93.1 | 93.7 | 93.9 | 93.6 | 91.2 |
| Arteriovenous graft | 6.5 | 5.6 | 5.4 | 6.4 | 8.4 |
| Central venous catheter | 0.4 | 0.7 | 0.7 | 0.0 | 0.4 |
| Single-pool Kt/V urea, mean (SD) | 1.42 (0.29) | 1.35 (0.33) | 1.42 (0.29) | 1.43 (0.28) | 1.46 (0.25) |
| BMI, mean (SD), kg/m2 | 21.5 (3.6) | 21.7 (3.8) | 21.3 (3.7) | 21.4 (3.5) | 21.4 (3.5) |
| nPCR, mean (SD) | 0.93 (0.20) | 0.89 (0.20) | 0.93 (0.20) | 0.94 (0.19) | 0.97 (0.18) |
| CVD at study entry, % | 42.8 | 44.2 | 43.3 | 46.8 | 37.0 |
| Cancer (nonskin) at study entry, % | 10.4 | 12.3 | 7.2 | 9.2 | 13.0 |
| Cerebrovascular disease at study entry, % | 12.0 | 11.0 | 14.3 | 11.9 | 10.6 |
| Diabetes at study entry, % | 37.2 | 46.6 | 36.5 | 33.8 | 31.8 |
| GI bleeding at study entry, % | 4.5 | 3.4 | 3.4 | 4.8 | 6.5 |
| Hypertension at study entry, % | 80.7 | 82.5 | 82.6 | 83.6 | 74.0 |
| Lung disease at study entry, % | 3.3 | 2.4 | 3.4 | 3.1 | 4.5 |
| Neuro disorder at study entry, % | 6.2 | 8.2 | 5.8 | 5.1 | 5.5 |
| Psych disorder at study entry, % | 4.8 | 4.5 | 4.1 | 4.8 | 5.8 |
| Peripheral vascular disease at study entry, % | 14.3 | 11.6 | 16.0 | 11.6 | 17.8 |
| Recurrent cellulitis at study entry, % | 2.8 | 1.0 | 3.8 | 3.8 | 2.7 |
| Albumin, mean (SD), g/dL | 3.7 (0.4) | 3.6 (0.4) | 3.6 (0.4) | 3.7 (0.3) | 3.8 (0.3) |
| Hemoglobin, mean (SD), g/dL | 10.6 (1.2) | 10.7 (1.2) | 10.5 (1.3) | 10.6 (1.2) | 10.7 (1.1) |
| Creatinine, mean (SD), mg/dL | 10.7 (2.8) | 9.5 (2.9) | 10.4 (2.7) | 11.2 (2.6) | 11.7 (2.6) |
| Calcium, mean (SD), mg/dL | 8.6 (0.7) | 8.6 (0.7) | 8.6 (0.7) | 8.7 (0.7) | 8.6 (0.7) |
| Phosphorus, mean (SD), mg/dL | 5.1 (1.3) | 4.9 (1.2) | 4.9 (1.3) | 5.2 (1.3) | 5.3 (1.3) |
| Intact parathyroid hormone, median (IQR), pg/mL | 120 (62–216) | 108 (56–186) | 106 (60–197) | 140 (65–218) | 143 (75–259) |
| High-sens. C-reactive protein, median (IQR), mg/dL | 0.08 (0.03–0.27) | 0.10 (0.03–0.35) | 0.09 (0.03–0.30) | 0.08 (0.03–0.26) | 0.07 (0.03–0.20) |
Data are shown using first imputation only. GI, gastrointestinal.
FIGURE 2:
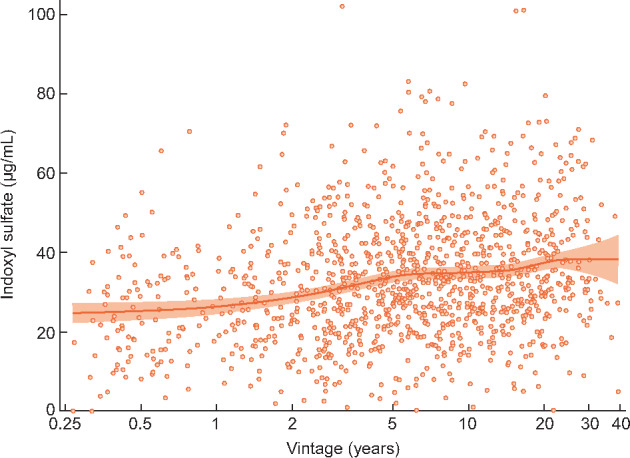
Association of tIS level (combination of protein-bound and free fraction) with years on dialysis (vintage). Scatterplot includes a smoothed LOcal regrESSion curve with 95% CI band.
Median follow-up time per patient was 2.8 years for analyses of both mortality and composite events (range, 0.01–2.9 years). We observed 174 deaths (14.9%; crude rate per year, 0.06), 174 CV-related events (14.9%; crude rate, 0.069), 141 infectious-related events (12.1%; crude rate, 0.055) and 55 malignancy-related events (4.7%; crude rate, 0.021) during follow-up. Crude models indicated weak associations of tIS with each clinical event (HR range = 0.96–1.04 per 10 μg/mL) (Table 2 and Figure 3). However, after adjusting for Model 2 covariates, positive and monotonic associations of tIS with all-cause mortality (HR = 1.16; 95% CI 1.04–1.28) and infectious composite events (HR = 1.18; 95% CI 1.04–1.34) were revealed (Table 2 and Figure 3); weaker associations that failed to achieve statistical significance were observed for CV events (HR = 1.08; 95% CI 0.97–1.20) and malignancy events (HR = 1.02; 95% CI 0.87–1.21). Additional covariate adjustments in Model 3 reduced these Model 2 associations modestly. The adjusted association of IS with CV events was not appreciably different according to atheromatous or nonatheromatous indication (Supplementary data, Table S4).
Table 2.
Associations of tIS (combination of protein-bound and free fraction) with all-cause mortality and cause-specific composite events
| Per 10 μg/mL |
tIS: 0–23 μg/mL |
tIS: 23–32 μg/mL |
tIS: 32–42 μg/mL |
tIS: 42–102 μg/mL |
||||||
|---|---|---|---|---|---|---|---|---|---|---|
| HR (95% CI) | P-value | HR (95% CI) | P-value | HR (95% CI) | P-value | HR (95% CI) | P-value | HR (95% CI) | P-value | |
| All-cause mortality | ||||||||||
| Unadjusted | 0.96 (0.87–1.06) | 0.41 | 1 (REF) | 0.82 (0.52–1.28) | 0.38 | 0.69 (0.41–1.15) | 0.16 | 0.87 (0.58–1.28) | 0.48 | |
| Model 1 | 1.00 (0.91–1.09) | 0.93 | 1 (REF) | 0.91 (0.58–1.43) | 0.68 | 0.70 (0.46–1.08) | 0.11 | 1.08 (0.72–1.64) | 0.70 | |
| Model 2 | 1.16 (1.04–1.28) | 0.01 | 1 (REF) | 1.03 (0.61–1.73) | 0.91 | 1.12 (0.70–1.77) | 0.64 | 1.96 (1.17–3.29) | 0.01 | |
| Model 3 | 1.13 (1.02–1.26) | 0.02 | 1 (REF) | 0.98 (0.60–1.60) | 0.93 | 1.10 (0.67–1.80) | 0.72 | 1.88 (1.17–3.01) | 0.01 | |
| CV composite | ||||||||||
| Unadjusted | 1.04 (0.95–1.14) | 0.45 | 1 (REF) | 0.99 (0.61–1.61) | 0.97 | 1.04 (0.71–1.54) | 0.84 | 1.15 (0.78–1.70) | 0.49 | |
| Model 1 | 1.05 (0.94–1.16) | 0.39 | 1 (REF) | 0.98 (0.61–1.58) | 0.94 | 0.99 (0.67–1.46) | 0.95 | 1.22 (0.79–1.88) | 0.37 | |
| Model 2 | 1.08 (0.97–1.20) | 0.15 | 1 (REF) | 1.04 (0.66–1.64) | 0.88 | 1.13 (0.75–1.72) | 0.56 | 1.41 (0.88–2.26) | 0.15 | |
| Model 3 | 1.06 (0.95–1.17) | 0.31 | 1 (REF) | 1.04 (0.67–1.61) | 0.87 | 1.11 (0.72–1.72) | 0.64 | 1.33 (0.82–2.14) | 0.25 | |
| Infectious composite | ||||||||||
| Unadjusted | 1.02 (0.90–1.16) | 0.70 | 1 (REF) | 0.98 (0.62–1.53) | 0.93 | 0.99 (0.59–1.69) | 0.98 | 1.05 (0.67–1.67) | 0.82 | |
| Model 1 | 1.04 (0.91–1.18) | 0.56 | 1 (REF) | 0.96 (0.62–1.48) | 0.84 | 0.91 (0.55–1.49) | 0.71 | 1.11 (0.70–1.77) | 0.65 | |
| Model 2 | 1.18 (1.04–1.34) | 0.01 | 1 (REF) | 1.13 (0.72–1.79) | 0.59 | 1.39 (0.83–2.35) | 0.21 | 1.83 (1.10–3.03) | 0.02 | |
| Model 3 | 1.18 (1.04–1.34) | 0.01 | 1 (REF) | 1.11 (0.72–1.70) | 0.64 | 1.40 (0.83–2.35) | 0.20 | 1.83 (1.10–3.03) | 0.02 | |
| Malignancy composite | ||||||||||
| Unadjusted | 0.97 (0.82–1.15) | 0.73 | 1 (REF) | 0.61 (0.28–1.30) | 0.20 | 0.58 (0.28–1.19) | 0.14 | 0.98 (0.52–1.83) | 0.95 | |
| Model 1 | 1.00 (0.84–1.18) | 0.97 | 1 (REF) | 0.64 (0.30–1.37) | 0.25 | 0.60 (0.30–1.19) | 0.14 | 1.12 (0.59–2.11) | 0.72 | |
| Model 2 | 1.02 (0.87–1.21) | 0.77 | 1 (REF) | 0.66 (0.31–1.41) | 0.29 | 0.65 (0.32–1.30) | 0.22 | 1.24 (0.66–2.32) | 0.50 | |
| Model 3 | 1.04 (0.87–1.23) | 0.68 | 1 (REF) | 0.66 (0.31–1.40) | 0.28 | 0.67 (0.33–1.33) | 0.25 | 1.30 (0.70–2.40) | 0.40 | |
Model 1 adjusts for age, sex, vintage and history of diabetes, and prior CVD. Model 2 adjusts for Model 1 covariates, plus markers of nutritional status (albumin, nPCR, BMI and creatinine) and single-pool Kt/V urea. Model 3 adjusts for Model 2 covariates, plus other potential confounders (log C-reactive protein, total calcium, alkaline phosphatase, serum phosphorus and use of HDF). See Supplementary data, Tables S1–S3 for diagnoses and procedures used to define cause-specific composites. ‘Unadjusted’ and ‘Model 2’ rows are visually displayed in Figure 3.
FIGURE 3:

Associations of tIS (combination of protein-bound and free fraction) quartile with all-cause mortality and cause-specific composite events. ‘Adjusted’ model includes age, sex, vintage, history of diabetes, prior CVD, markers of nutritional status (albumin, nPCR, BMI and creatinine) and single-pool Kt/V urea. Error bars represent the 95% CI. Values not labeled may be viewed in Table 2 (‘Unadjusted’ and ‘Model 2’ rows).
The association between tIS and all-cause mortality, adjusted for Model 2 covariates, was stronger among patients with RKF (i.e. residual urine >200 mL/day) compared with patients without RKF (P for interaction = 0.02, Table 3). We also observed a stronger association of tIS with all-cause mortality among persons with nPCR <0.85 (P for interaction = 0.01, Table 3).
Table 3.
Interaction analyses for the association of tIS (combination of protein-bound and free fraction) with all-cause mortality
| Unadjusted |
Model 1 |
Model 2 |
Model 3 |
||||||
|---|---|---|---|---|---|---|---|---|---|
| Parameter | tIS median | HR (95% CI) | P-value | HR (95% CI) | P-value | HR (95% CI) | P-value | HR (95% CI) | P-value |
| Vintage: <3.6 years | 27.1 | 0.99 (0.87–1.13) | 0.90 | 0.99 (0.87–1.12) | 0.83 | 1.21 (1.06–1.39 | 0.004 | 1.20 (1.05–1.37) | 0.01 |
| Vintage: 3.6–9.6 years | 33.0 | 1.02 (0.92–1.12) | 0.76 | 1.01 (0.90–1.12) | 0.90 | 1.16 (1.03–1.31 | 0.01 | 1.13 (1.00–1.28) | 0.05 |
| Vintage: 9.6+ years | 33.8 | 0.95 (0.84–1.07) | 0.39 | 0.99 (0.87–1.13) | 0.88 | 1.08 (0.94–1.25 | 0.28 | 1.07 (0.92–1.24) | 0.39 |
| Interaction P | 0.52 | 0.91 | 0.33 | 0.37 | |||||
| Age: <62.3 years | 31.9 | 1.09 (0.96–1.23) | 0.18 | 1.13 (1.00–1.27) | 0.05 | 1.26 (1.11–1.43 | 0.001 | 1.24 (1.09–1.41) | 0.001 |
| Age: 62.3–71.3 years | 32.2 | 0.99 (0.88–1.12) | 0.89 | 1.02 (0.90–1.15) | 0.77 | 1.16 (1.03–1.31 | 0.01 | 1.16 (1.03–1.30) | 0.01 |
| Age: 71.3+ years | 31.0 | 0.95 (0.84–1.07) | 0.41 | 0.95 (0.84–1.08) | 0.46 | 1.13 (0.98–1.30 | 0.10 | 1.10 (0.96–1.26) | 0.17 |
| Interaction P | 0.18 | 0.10 | 0.41 | 0.37 | |||||
| nPCR: <0.85 | 29.0 | 1.08 (0.95–1.23) | 0.25 | 1.09 (0.96–1.24) | 0.20 | 1.29 (1.15–1.44) | <.0001 | 1.29 (1.14–1.45) | <.0001 |
| nPCR: 0.85–1.01 | 32.1 | 0.91 (0.81–1.02) | 0.11 | 0.92 (0.83–1.03) | 0.15 | 1.08 (0.95–1.21) | 0.24 | 1.05 (0.94–1.18) | 0.39 |
| nPCR: 1.01+ | 33.7 | 0.93 (0.82–1.05) | 0.25 | 0.98 (0.87–1.10) | 0.71 | 1.12 (0.98–1.29) | 0.09 | 1.11 (0.97–1.26) | 0.13 |
| Interaction P | 0.07 | 0.03 | 0.01 | 0.004 | |||||
| Albumin: <3.6 g/dL | 33.7 | 1.05 (0.92–1.20) | 0.48 | 1.08 (0.94–1.23) | 0.28 | 1.17 (1.02–1.35) | 0.02 | 1.15 (1.00–1.33) | 0.05 |
| Albumin: 3.6+ g/dL | 28.5 | 1.05 (0.95–1.16 | 0.32 | 1.08 (0.97–1.20) | 0.17 | 1.14 (1.02–1.27) | 0.02 | 1.12 (1.01–1.25) | 0.04 |
| Interaction P | 0.97 | 0.96 | 0.66 | 0.68 | |||||
| spKt/V urea: <1.30 | 30.3 | 0.95 (0.85–1.07) | 0.39 | 0.97 (0.87–1.08) | 0.57 | 1.17 (1.04–1.31) | 0.01 | 1.15 (1.02–1.30) | 0.02 |
| spKt/Vurea: 1.30–1.54 | 32.6 | 0.96 (0.85–1.09 | 0.56 | 0.97 (0.86–1.10) | 0.66 | 1.13 (0.99–1.30) | 0.07 | 1.11 (0.97–1.27) | 0.13 |
| spKt/Vurea: 1.54+ | 32.6 | 1.03 (0.91–1.16) | 0.68 | 1.08 (0.93–1.25) | 0.31 | 1.17 (1.01–1.36) | 0.04 | 1.16 (1.01–1.34) | 0.04 |
| Interaction P | 0.46 | 0.19 | 0.83 | 0.67 | |||||
| RKF+ | 28.6 | 1.02 (0.83–1.24) | 0.85 | 1.12 (0.92–1.35) | 0.25 | 1.44 (1.20–1.73) | 0.0001 | 1.37 (1.13–1.68) | 0.002 |
| RKF− | 32.4 | 0.94 (0.84–1.05) | 0.30 | 0.98 (0.87–1.09) | 0.68 | 1.13 (1.01–1.26) | 0.04 | 1.11 (0.99–1.24) | 0.08 |
| Interaction P | 0.53 | 0.27 | 0.02 | 0.06 | |||||
| HDF+ | 32.5 | 0.78 (0.57–1.08) | 0.13 | 0.80 (0.56–1.16) | 0.25 | 0.94 (0.68–1.31) | 0.73 | 0.93 (0.64–1.36) | 0.73 |
| HDF− | 31.6 | 0.98 (0.88–1.08) | 0.67 | 1.01 (0.92–1.11) | 0.81 | 1.17 (1.06–1.30) | 0.001 | 1.15 (1.04–1.27) | 0.01 |
| Interaction P | 0.21 | 0.24 | 0.18 | 0.27 | |||||
Associations represented as HR for tIS, per 10 μg/mL higher. Model 1 adjusts for age, sex, vintage and history of diabetes, and prior CVD. Model 2 adjusts for Model 1 covariates, plus markers of nutritional status (albumin, nPCR, BMI and creatinine) and single-pool Kt/V urea. Model 3 adjusts for Model 2 covariates, plus other potential confounders (log C-reactive protein, total calcium, alkaline phosphatase, serum phosphorus and use of HDF).
DISCUSSION
In this study, we found that serum level of tIS, a representative PBUT, was positively associated with all-cause mortality and infectious events in maintenance HD patients participating in J-DOPPS.
Accumulation of uremic toxins is known to induce and accelerate various systemic disorders in CKD patients, especially those undergoing dialysis treatment. For example, previous studies reported Kt/V urea, a parameter for water-soluble small-sized molecule clearance, is associated with mortality in HD patients [16–18]. However, with recent progress in dialysis treatment, most patients now achieve adequate removal of small molecular weight molecules [19]. β2-Microglobulin (β2-m), a middle-sized uremic toxin, is associated with infectious death in dialysis patients [20]. During the last decade, β2-m clearance has improved from 43% to 60% within one HD session [21], probably due to increased use of high-flux dialyzers or HDF. Whereas the impact both of small- and middle-sized uremic toxins on clinical outcomes in HD patients may be reduced with improved dialysis treatment, removal of PBUTs with conventional HD treatment remains inadequate owing to their high-protein-bound property [5]. In our study, the median (IQR) serum tIS level was 31.6 μg/mL (22.6–42.0), the median (IQR) dialysis vintage of participants was 6.1 years (2.8–12.5) and the mean (SD) Kt/V urea was 1.42 (0.29) (Table 1), indicating that the sample included patients with long-term duration of HD treatment and adequate removal of small-sized uremic toxins. Serum tIS levels in our study were higher than in studies from other regions [8, 9], probably owing to difference in patient characteristics, such as race and dialysis vintage, and/or method used to measure IS. Among J-DOPPS 5 participants, we examined the association of serum level of tIS with mortality as well as some clinical events in HD patients in Japan and found that a high serum level of tIS was associated with elevated mortality. The strongest association was found for patients in the highest quartile of tIS (≥42 μg/mL) compared with the lowest quartile (<23 μg/mL) (Figure 3 and Table 2). Patients having higher tIS levels also tended to have better nutritional status (Table 1), which may protect against the deleterious effects of IS during follow-up. Serum tIS level was positively correlated with dialysis vintage, and the toxic effect of tIS was observed when adjusted models included dialysis vintage which was not adjusted in previous large cohort studies [8, 9]. This result may be based on the toxicity of IS to tissue and organs reported by basic studies [6, 22–26], suggesting that IS is one of multiple factors to worsen survival and various clinical events in CKD patients.
In this study, the association between tIS and mortality was stronger in HD patients with RKF (Table 3). A previous study in a sample of patients with CKD Stages 2–5 D (68% predialysis and 32% on dialysis), including many CKD patients with RKF, showed a clear relation of tIS with mortality [8]. In contrast, the HEMO study, which did not include many HD patients with substantial RKF, did not show a significant association of IS with CV death [9]. It is known that serum IS level is negatively associated with RKF [9]; other unmeasured factors related with RKF may be associated with the toxicity of IS. Another possible explanation for the observed interaction may be that the circulating IS may not reflect accumulated IS in the tissues in patients without RKF and/or after long-term dialysis treatment, and thus toxicity of IS in patients without RKF seemed to be weaker than that in patients with RKF. Patients in our study with nPCR <0.85 also showed a stronger association between IS and mortality compared with those with nPCR 0.85–1.01 and nPCR ≥1.01. (Table 3) The HEMO study showed that IS was associated with cardiac death in HD patients with low serum albumin [9] and our study, among others, suggests that other unmeasured factors related to low nPCR may be associated with the toxicity of IS, even though this analysis was adjusted with several nutritional parameters.
Higher tIS was modestly associated with increased incidence of CV events in this study although our finding did not achieve statistical significance (Figure 3 and Table 2). HD patients in Japan are known to have fewer CV events than other regions [27]; thus, the small number of reported CV events captured during the J-DOPPS 5 follow-up period may have limited our ability to estimate this association with high precision. It is suggested that IS has toxic properties for CV tissues, as previous basic studies reported IS-induced CV disorders as mentioned above. The HEMO study reported no association between IS and CV death/events in HD patients [9] and unmeasured various factors other than IS may induce CV events in HD patients. Further worldwide study will be needed to identify the role of IS in CVD for patients undergoing recent advanced dialysis treatment.
High tIS was clearly associated with higher incidence of infectious events in this study (Figure 3 and Table 2). Though not fully understood, infection is a major cause of death in dialysis patients, with increased incidence recently [2]. Previous studies show that serum levels of β2-m and p-cresyl sulfate are associated with infectious death in HD patients [20, 28], and uremic toxins will induce immunological disorders in CKD patients. An in vitro study suggested that IS enhanced lipopolysaccharide-induced inflammatory reaction in macrophages, which may be associated with impaired immune defense against bacteremia [29]. Further studies will be needed to elucidate the role of IS in infection in CKD patients.
While there is no current recommended target for removal amount of IS, therapeutic strategies, such as longer HD session time [30], HDF [31], use of superflux dialysis membrane [32] or use of oral charcoal adsorbents [33], are suggested to increase the removal of IS. This study points out the importance of IS for patients with end-stage kidney disease; interventional studies will be needed to recommend a target level of IS in HD patients.
The J-DOPPS study design allowed us to present the associations of serum tIS level with clinical outcomes in a real-world cohort of HD patients, similar to what physicians may encounter when rounding in the dialysis unit. However, we acknowledge some limitations. As with any observational study, the reported associations do not prove causality and may be affected by unmeasured confounders. The fixed sample size and observational period, together with the relatively low event rates typically seen in Japan, were not sufficient to precisely estimate associations of tIS with specific clinical outcomes, especially CV events. This study was limited to patients on HD, and no predialysis information was available. RKF was captured only once, at J-DOPPS study entry, as a binary variable indicating residual urine volume of 200 mL/day or not, preventing a more detailed analysis of the effect modification we reported. In this study, we measured serum level of tIS (including both protein-bound and free fraction) but not other kinds of PBUTs. Although different uremic toxins may each affect clinical outcomes in HD patients, IS induces the strongest production of reactive oxygen species from endothelial cells [5]. Furthermore, tIS level is related to levels of other PBUTs (measured both as total and free concentrations) in HD patients [34]. For these reasons, tIS may be an appropriate measure for the assessment of circulating PBUTs, but further studies to compare the toxicity of various PBUTs in HD patients will be needed.
In conclusion, serum tIS level was positively associated with all-cause mortality and infectious events in maintenance HD patients. Further studies will be needed to identify more detailed mechanisms of IS toxicity and to assess whether treatments to lower IS levels may limit CKD-related systemic disease.
SUPPLEMENTARY DATA
Supplementary data are available at ckj online.
Supplementary Material
ACKNOWLEDGEMENTS
We wish to express appreciation to the steering committee members of J-DOPPS. We are also grateful to the study nurses, physicians and medical directors for all the time and attention they have devoted to our study.
FUNDING
This manuscript was directly supported by Kyowa Kirin Co., Ltd. Global support for the DOPPS Program is provided without restriction on publications. The DOPPS program is supported by Amgen, AstraZeneca Pharmaceuticals LP, Baxter Healthcare Corp., ERA-EDTA, Fresenius Medical Care Asia-Pacific Ltd, Fresenius Medical Care Canada Inc., German Society of Nephrology, Italian Society of Nephrology, Janssen Pharmaceuticals Inc., Japanese Society for Peritoneal Dialysis, Keryx Biopharmaceuticals, Inc., Kidney Care UK, Kyowa Kirin Co., Ltd (since 1999 for J-DOPPS), MEDICE Arzneimittel Pütter GmbH & Co. KG, Otsuka America Pharmaceutical, Inc., Proteon Therapeutics, Inc., The Association of German Nephrology Centres (Verband Deutsche Nierenzentren e. V.) and Vifor Fresenius Medical Care Renal Pharma Ltd. Public funding and support is provided for specific DOPPS projects, ancillary studies or affiliated research projects in the following countries: Australia—National Health & Medical Research Council; Belgium—Belgian Federal Public Service of Public Health; Canada—Cancer Care Ontario through the Ontario Renal Network; France—French National Institute of Health and Medical Research (INSERM); Thailand—Thailand Research Foundation, Chulalongkorn University Matching Fund, King Chulalongkorn Memorial Hospital Matching Fund and the National Research Council of Thailand; UK—National Institute for Health Research via the Comprehensive Clinical Research Network; USA—National Institutes of Health. All grants were made to Arbor Research Collaborative for Health and not to coauthors directly. None of the funders had any role in study design; collection, analysis and interpretation of data; writing the report or the decision to submit this report for publication. Shauna Leighton, BA, medical editor with Arbor Research Collaborative for Health, provided editorial assistance on this manuscript.
AUTHORS’ CONTRIBUTIONS
All authors contributed study conception, design, analysis and interpretation of data. S.Y. and D.S.F. drafted the article. Final approval of the version to be published was done by S.Y.
CONFLICT OF INTEREST STATEMENT
S.Y. has received honoraria from Kyowa Kirin. H.K. has received honoraria, consulting fees and/or grant/research support from Bayer Yakuhin and Kyowa Kirin. T.N. is an employee of Kyowa Kirin. M.F. has received honoraria, consulting fees and/or grant/research support from Astellas Pharma, Bayer Yakuhin, Kyowa Kirin, Ono Pharmaceutical and Torii Pharmaceutical. Z.A.M. reports grants for CKD REIN and other research projects from Amgen, Baxter, Fresenius Medical Care, GlaxoSmithKline, Merck Sharp and Dohme-Chibret, Sanofi-Genzyme, Lilly, Otsuka and the French government, as well as fees and grants to charities from Amgen, Baxter and Sanofi-Genzyme. D.S.F., B.B., R.P. and B.R. are employees for the nonprofit research organization Arbor Research Collaborative for Health, which has designed and carries out the DOPPS Program. Grants are made to Arbor Research Collaborative for Health and not to individual investigators.
REFERENCES
- 1. Levey AS, Coresh J.. Chronic kidney disease. Lancet 2012; 379: 165–180 [DOI] [PubMed] [Google Scholar]
- 2. Masakane I, Nakai S, Ogata S. et al. An overview of regular dialysis treatment in Japan (as of 31 December 2013). Ther Apher Dial 2015; 19: 540–574 [DOI] [PubMed] [Google Scholar]
- 3. Lekawanvijit S, Kompa AR, Wang BH. et al. Cardiorenal syndrome: the emerging role of protein-bound uremic toxins. Circ Res 2012; 111: 1470–1483 [DOI] [PubMed] [Google Scholar]
- 4. Duranton F, Cohen G, De Smet R. et al. ; on behalf of the European Uremic Toxin Work Group. Normal and pathologic concentrations of uremic toxins. J Am Soc Nephrol 2012; 23: 1258–1270 [DOI] [PMC free article] [PubMed] [Google Scholar]
- 5. Itoh Y, Ezawa A, Kikuchi K. et al. Protein-bound uremic toxins in hemodialysis patients measured by liquid chromatography/tandem mass spectrometry and their effects on endothelial ROS production. Anal Bioanal Chem 2012; 403: 1841–1850 [DOI] [PubMed] [Google Scholar]
- 6. Yamamoto S, Zuo Y, Ma J. et al. Oral activated charcoal adsorbent (AST-120) ameliorates extent and instability of atherosclerosis accelerated by kidney disease in apolipoprotein E-deficient mice. Nephrol Dial Transplant 2011; 26: 2491–2497 [DOI] [PMC free article] [PubMed] [Google Scholar]
- 7. Iwasaki Y, Kazama JJ, Yamato H. et al. Accumulated uremic toxins attenuate bone mechanical properties in rats with chronic kidney disease. Bone 2013; 57: 477–483 [DOI] [PubMed] [Google Scholar]
- 8. Barreto FC, Barreto DV, Liabeuf S. et al. ; on behalf of the European Uremic Toxin Work Group (EUTox). Serum indoxyl sulfate is associated with vascular disease and mortality in chronic kidney disease patients. Clin J Am Soc Nephrol 2009; 4: 1551–1558 [DOI] [PMC free article] [PubMed] [Google Scholar]
- 9. Shafi T, Sirich TL, Meyer TW. et al. Results of the HEMO Study suggest that p-cresol sulfate and indoxyl sulfate are not associated with cardiovascular outcomes. Kidney Int 2017; 92: 1484–1492 [DOI] [PMC free article] [PubMed] [Google Scholar]
- 10. Young E, Goodkin DA, Mapes DL. et al. the dialysis outcomes and practice patterns study (DOPPS): an international hemodialysis study. Kidney Int 2000; 57: S74–S81 [DOI] [PubMed] [Google Scholar]
- 11. Sato B, Yoshikawa D, Ishii H. et al. Relation of plasma indoxyl sulfate levels and estimated glomerular filtration rate to left ventricular diastolic dysfunction. Am J Cardiol 2013; 111: 712–716 [DOI] [PubMed] [Google Scholar]
- 12. Daugirdas JT. Second generation logarithmic estimates of single-pool variable volume Kt/V: an analysis of error. J Am Soc Nephrol 1993; 4: 1205–1213 [DOI] [PubMed] [Google Scholar]
- 13. Depner TA, Daugirdas JT.. Equations for normalized protein catabolic rate based on two-point modeling of hemodialysis urea kinetics. J Am Soc Nephrol 1996; 7: 780–785 [DOI] [PubMed] [Google Scholar]
- 14. Cleveland WS, Kleiner B, Warner JL.. Robust statistical methods and photochemical air pollution data. J Air Pollut Control Assoc 1976; 26: 36–38 [DOI] [PubMed] [Google Scholar]
- 15. Raghunathan TE, Lj V, Hoewyk J. et al. A multivariate technique for multiply imputing missing values using a sequence of regression models. Surv Methodol 2001; 27: 85–95 [Google Scholar]
- 16. Saran R, Bragg-Gresham JL, Levin NW. et al. Longer treatment time and slower ultrafiltration in hemodialysis: associations with reduced mortality in the DOPPS. Kidney Int 2006; 69: 1222–1228 [DOI] [PubMed] [Google Scholar]
- 17. Parker TF 3rd, Husni L, Huang W. et al. Survival of hemodialysis patients in the United States is improved with a greater quantity of dialysis. Am J Kidney Dis 1994; 23: 670–680 [DOI] [PubMed] [Google Scholar]
- 18. Held PJ, Port FK, Wolfe RA. et al. The dose of hemodialysis and patient mortality. Kidney Int 1996; 50: 550–556 [DOI] [PubMed] [Google Scholar]
- 19. Vanholder R, Glorieux G, Eloot S.. Once upon a time in dialysis: the last days of Kt/V? Kidney Int 2015; 88: 460–465 [DOI] [PubMed] [Google Scholar]
- 20. Cheung AK, Greene T, Leypoldt JK. et al. Association between serum 2-microglobulin level and infectious mortality in hemodialysis patients. Clin J Am Soc Nephrol 2008; 3: 69–77 [DOI] [PMC free article] [PubMed] [Google Scholar]
- 21. Hoshino J, Yamagata K, Nishi S. et al. Significance of the decreased risk of dialysis-related amyloidosis now proven by results from Japanese nationwide surveys in 1998 and 2010. Nephrol Dial Transplant 2016; 31: 595–602 [DOI] [PubMed] [Google Scholar]
- 22. Chen J, Zhang X, Zhang H. et al. Indoxyl sulfate enhance the hypermethylation of klotho and promote the process of vascular calcification in chronic kidney disease. Int J Biol Sci 2016; 12: 1236–1246 [DOI] [PMC free article] [PubMed] [Google Scholar]
- 23. Adijiang A, Goto S, Uramoto S. et al. Indoxyl sulphate promotes aortic calcification with expression of osteoblast-specific proteins in hypertensive rats. Nephrol Dial Transplant 2008; 23: 1892–1901 [DOI] [PubMed] [Google Scholar]
- 24. Lekawanvijit S, Kompa AR, Manabe M. et al. Chronic kidney disease-induced cardiac fibrosis is ameliorated by reducing circulating levels of a non-dialysable uremic toxin, indoxyl sulfate. PLoS One 2012; 7: e41281. [DOI] [PMC free article] [PubMed] [Google Scholar]
- 25. Wang R, Kozhaya L, Mercer F. et al. Expression of GARP selectively identifies activated human FOXP3+ regulatory T cells. Proc Natl Acad Sci USA 2009; 106: 13439–13444 [DOI] [PMC free article] [PubMed] [Google Scholar]
- 26. Sato E, Saigusa D, Mishima E. et al. Impact of the oral adsorbent AST-120 on organ-specific accumulation of uremic toxins: LC-MS/MS and MS imaging techniques. Toxins (Basel) 2017; 10: 19. [DOI] [PMC free article] [PubMed] [Google Scholar]
- 27. Zhang H, Schaubel DE, Kalbfleisch JD. et al. Dialysis outcomes and analysis of practice patterns suggests the dialysis schedule affects day-of-week mortality. Kidney Int 2012; 81: 1108–1115 [DOI] [PMC free article] [PubMed] [Google Scholar]
- 28. Wu IW, Hsu KH, Hsu HJ. et al. Serum free p-cresyl sulfate levels predict cardiovascular and all-cause mortality in elderly hemodialysis patients–a prospective cohort study. Nephrol Dial Transplant 2012; 27: 1169–1175 [DOI] [PubMed] [Google Scholar]
- 29. Adesso S, Popolo A, Bianco G. et al. The uremic toxin indoxyl sulphate enhances macrophage response to LPS. PLoS One 2013; 8: e76778. [DOI] [PMC free article] [PubMed] [Google Scholar]
- 30. Basile C, Libutti P, Di Turo AL. et al. Removal of uraemic retention solutes in standard bicarbonate haemodialysis and long-hour slow-flow bicarbonate haemodialysis. Nephrol Dial Transplant 2011; 26: 1296–1303 [DOI] [PubMed] [Google Scholar]
- 31. Krieter DH, Hackl A, Rodriguez A. et al. Protein-bound uraemic toxin removal in haemodialysis and post-dilution haemodiafiltration. Nephrol Dial Transplant 2010; 25: 212–218 [DOI] [PubMed] [Google Scholar]
- 32. De Smet R, Dhondt A, Eloot S. et al. Effect of the super-flux cellulose triacetate dialyser membrane on the removal of non-protein-bound and protein-bound uraemic solutes. Nephrol Dial Transplant 2007; 22: 2006–2012 [DOI] [PubMed] [Google Scholar]
- 33. Yamamoto S, Kazama JJ, Omori K. et al. Continuous reduction of protein-bound uraemic toxins with improved oxidative stress by using the oral charcoal adsorbent AST-120 in haemodialysis patients. Sci Rep 2015; 5: 14381. [DOI] [PMC free article] [PubMed] [Google Scholar]
- 34. Itoh Y, Ezawa A, Kikuchi K. et al. Correlation between serum levels of protein-bound uremic toxins in hemodialysis patients measured by LC/MS/MS. Mass Spectrom (Tokyo) 2013; 2: S0017. [DOI] [PMC free article] [PubMed] [Google Scholar]
Associated Data
This section collects any data citations, data availability statements, or supplementary materials included in this article.