Abstract
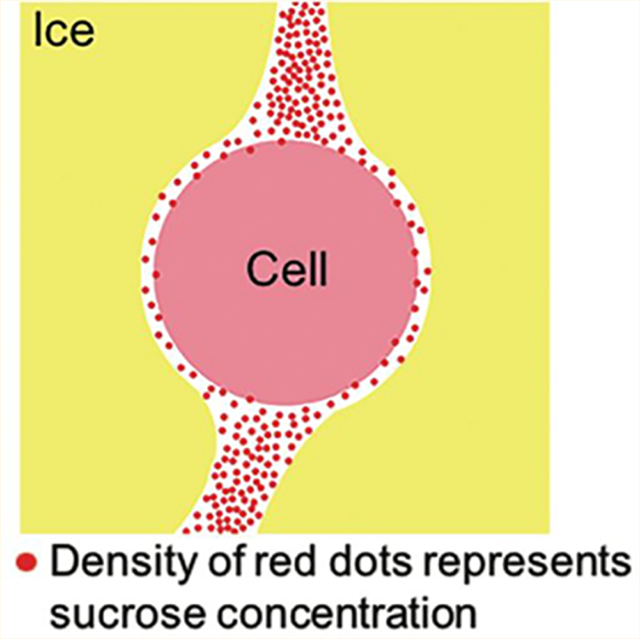
There is considerable interest in the use of sugars to preserve cells. In this study, low temperature Raman spectroscopy was used to characterize the behaviors of sucrose during freezing. The hydrogen bond network between sucrose and water was investigated at −10 °C and −50 °C, and the Raman spectra showed strengthened sucrose-water and sucrose-sucrose hydrogen bonds in more concentrated sucrose solution at −50 °C. The concentration of sucrose at the ice interface increased as the ice density decreased, and it plateaued across a narrow channel of nonfrozen sucrose solution before it decreased toward the next ice interface. The biophysical environment at interfaces between the cell and nonfrozen sucrose solution and between the cell and extracellular ice was also studied. A thin layer of nonfrozen sucrose solution was observed at the interface between the cell and extracellular ice. The extracellular concentration of sucrose at this interface was generally lower than that of bulk nonfrozen sucrose solution. The variation of sucrose concentration outside different regions of the cell membrane suggests that the chemical environment around the cell during freezing may be more heterogeneous than previously thought. Raman spectra and images also showed colocalization of nonfrozen sucrose solution and the cell, which implied that direct interaction between sucrose and cell membrane might be responsible for protective properties of sucrose. Sucrose was predominantly distributed outside the cell, and the observation of strong partitioning of sucrose across the cell membrane is consistent with substantial cell dehydration detected by the Raman spectra. This work enhances our understanding of the behaviors of sucrose solution and its interactions with cells at low temperature and can improve cryopreservation protocols of cells frozen in a sucrose-based media.
Graphical Abstract
INTRODUCTION
Cryopreservation is the technology used to stabilize cells at cryogenic temperatures for a variety of research and clinical applications. The majority of mammalian cells are cryopreserved with dimethyl sulfoxide (DMSO) using slow cooling rates. Unfortunately, there are cells that respond poorly to this conventional method of freezing,1,2 and DMSO itself is associated with dangerous adverse effects when infused into the human body.3 As a result, non-DMSO cryoprotectants such as sugars have been commonly utilized in the cryopreservation of various mammalian cell types to replace the use of DMSO.4–6 In addition, we have recently demonstrated that sugars in combination with sugar alcohols and amino acids are effective in preserving cells.7,8
Numerous studies have been performed to understand the mechanisms of protective properties of sucrose, most of which aimed at the interactions between sucrose and water, protein, and membranes. In dilute aqueous solutions, the destructuring effect of sucrose on the water tetrahedral hydrogen bond network has been observed in both experimental studies and molecular dynamics simulations.9,10 In sucrose/water mixture at concentrations over 30%, it was found that all the water molecules were involved in hydrogen bonds with sucrose11 and that the hydrogen bonds formed between sucrose and water significantly slowed down the water dynamics.12 In these studies, the interactions between sucrose and water were examined based on a limited range of solute concentrations; however, the change of solute composition induced by the formation and growth of ice crystals in the real situation of cryopreservation might be substantial. As a result, it will be beneficial to explore the interactions between sucrose and water in a frozen sucrose solution.
The interactions between sucrose and macromolecules including proteins and membranes have been extensively examined, with several hypotheses being proposed to explain the protective properties of sucrose including the water-replacement hypothesis13–17 and the vitrification hypothesis.18 Various techniques, including infrared spectroscopy,16,17,19 nuclear magnetic resonance,20 differential scanning calorimeter,18 and molecular modeling,21 have been employed to provide supporting evidence for these hypotheses. However, there have been no studies to visualize the interactions between sucrose and cell membrane at a low temperature directly.
Interactions between cell and extracellular ice and their influence on cell survival have been systematically studied by the encapsulation and partitioning of cells in growing ice crystals.22–26 It has been shown that interactions between cell and solidifying interface can produce a beneficial local environment to protect cells from damage.27 However, information regarding the solute concentration at the interface between cell and extracellular ice is still lacking except for a couple of simulation studies.27,28 It is still unclear how the cells interfere with the local solute transport ahead of the interface. Detailed knowledge of the distribution and concentration of sucrose relative to the cryopreserved cell is essential for understanding the interactions between the nonfrozen sucrose solution and cell, interactions between extracellular ice and cell, and dehydration induced cell damage.
Recently, Raman spectroscopy has been emerging as a powerful imaging tool to investigate the freezing responses of various types of cells cryopreserved in different cryoprotectants.8,29–35 The high spatial resolution of Raman spectroscopy allowed us to visualize the distribution of extracellular and intracellular ice, cryoprotectants, and biological signals for single cells during freezing.29 The morphology and size of ice crystals formed in different combinations of cryoprotectants have also been successfully captured by Raman imaging.8,36 Raman spectroscopy is sensitive to the structure of hydrogen bond network, making it a suitable tool to examine the effects of cryoprotectants on the water hydrogen bond network at a low temperature.10 In this work, Raman spectroscopy was utilized to study the interactions between sucrose and water during freezing and to explore the biophysical environment at interfaces between cell and nonfrozen sucrose solution, between cell and extracellular ice, and between nonfrozen sucrose solution and ice. This work will enhance our understanding of the behaviors of sucrose solution at a low temperature and the mechanisms of its protective effects on cell.
MATERIALS AND METHODS
Cell Culture.
Jurkat cells (ATCC, TIB-1522) were incubated at 37 °C with 5% CO2 in media composed of high glucose RPMI-1640 (Life technologies, Carlsbad, CA) and 10% fetal bovine serum (qualified, Life technologies, Carlsbad, CA). Cells were grown in suspension and maintained at a concentration of (1–2) × 106 cells/ mL. Cells were washed twice in Dulbecco’s phosphate buffered saline (DPBS) by centrifugation at 1000 rpm for 5 min prior to experiments, then suspended in each experimental solution of interest, and frozen using a temperature-controlled stage.
Temperature Controlled Stage.
The temperature-controlled stage consisted of a four-stage Peltier (Thermonamic Electronics Corp. Jiangxi, China) and a series 800 temperature controller (Alpha Omega Instruments Corp, Lincoln, RI). Cell identity was confirmed by Short Tandem Repeat profiling. For this, 1–3 μL of cell suspension or sucrose solution was placed on the stage, covered with a piece of mica (TED PELLA, Redding, CA), and sealed with Kapton tape (Dupont, Wilmington, DE) to prevent evaporation and sublimation during each experiment. Condensation on the surface of mica was minimized by encasing the stage with plastic film and purging the enclosed area with dry nitrogen gas. All cell samples were seeded at −6 °C with a liquid nitrogen-chilled needle and frozen at 1 °C/min to a final temperature of −50 °C where Raman images were captured, except for Jurkat cells suspended in DPBS, the Raman images of which were captured at room temperature.
Confocal Raman System.
Confocal Raman spectroscopy measurements were conducted using a WITec Confocal Raman Microscope System Alpha 300R (WITec, Ulm, Germany) with a UHTS300 spectrometer and a DV401 CCD detector with 600/mm grating. The WITec spectrometer was calibrated with a Mercury—Argon lamp. A 532 nm wavelength Nd:YAG laser was used as the excitation source. A 100× air objective (NA 0.90; Nikon Instruments, Melville, NY) was used for focusing the 532 nm excitation laser to the sample. Laser power at the objective was 10 mW as measured by an optical power meter (THORLABS, New Jersey). Resolution of the microscope was approximately 0.3 μm based on Abbe’s diffraction formula for lateral resolution.
Raman Image/Spectra Analysis.
Raman images were generated by integrating spectra at each pixel based on characteristic wavelength of common intracellular and extracellular materials (Figure 1). Raman signals and the associated wavenumbers selected for these studies were given in Table 1. Amide I and Alkyl C=C stretches were used to generate a distribution of protein and lipid to delineate the area of frozen Jurkat cells. Images of ice were generated with background subtraction at both sides of the peak range to separate ice and water signals. The image size was 15 μm × 15 μm, and each image had 45 × 45 pixels with an integration time of 0.2 s for each pixel. All of Raman images were spatially deconvolved using the theoretical point spread function (PSF) for the equipment setup. The 2D PSF was generated using the ImageJ macro Diffraction PSF 3D, and the 2D deconvolution was performed using the ImageJ macro Iterative Deconvolve 3D.37
Figure 1.
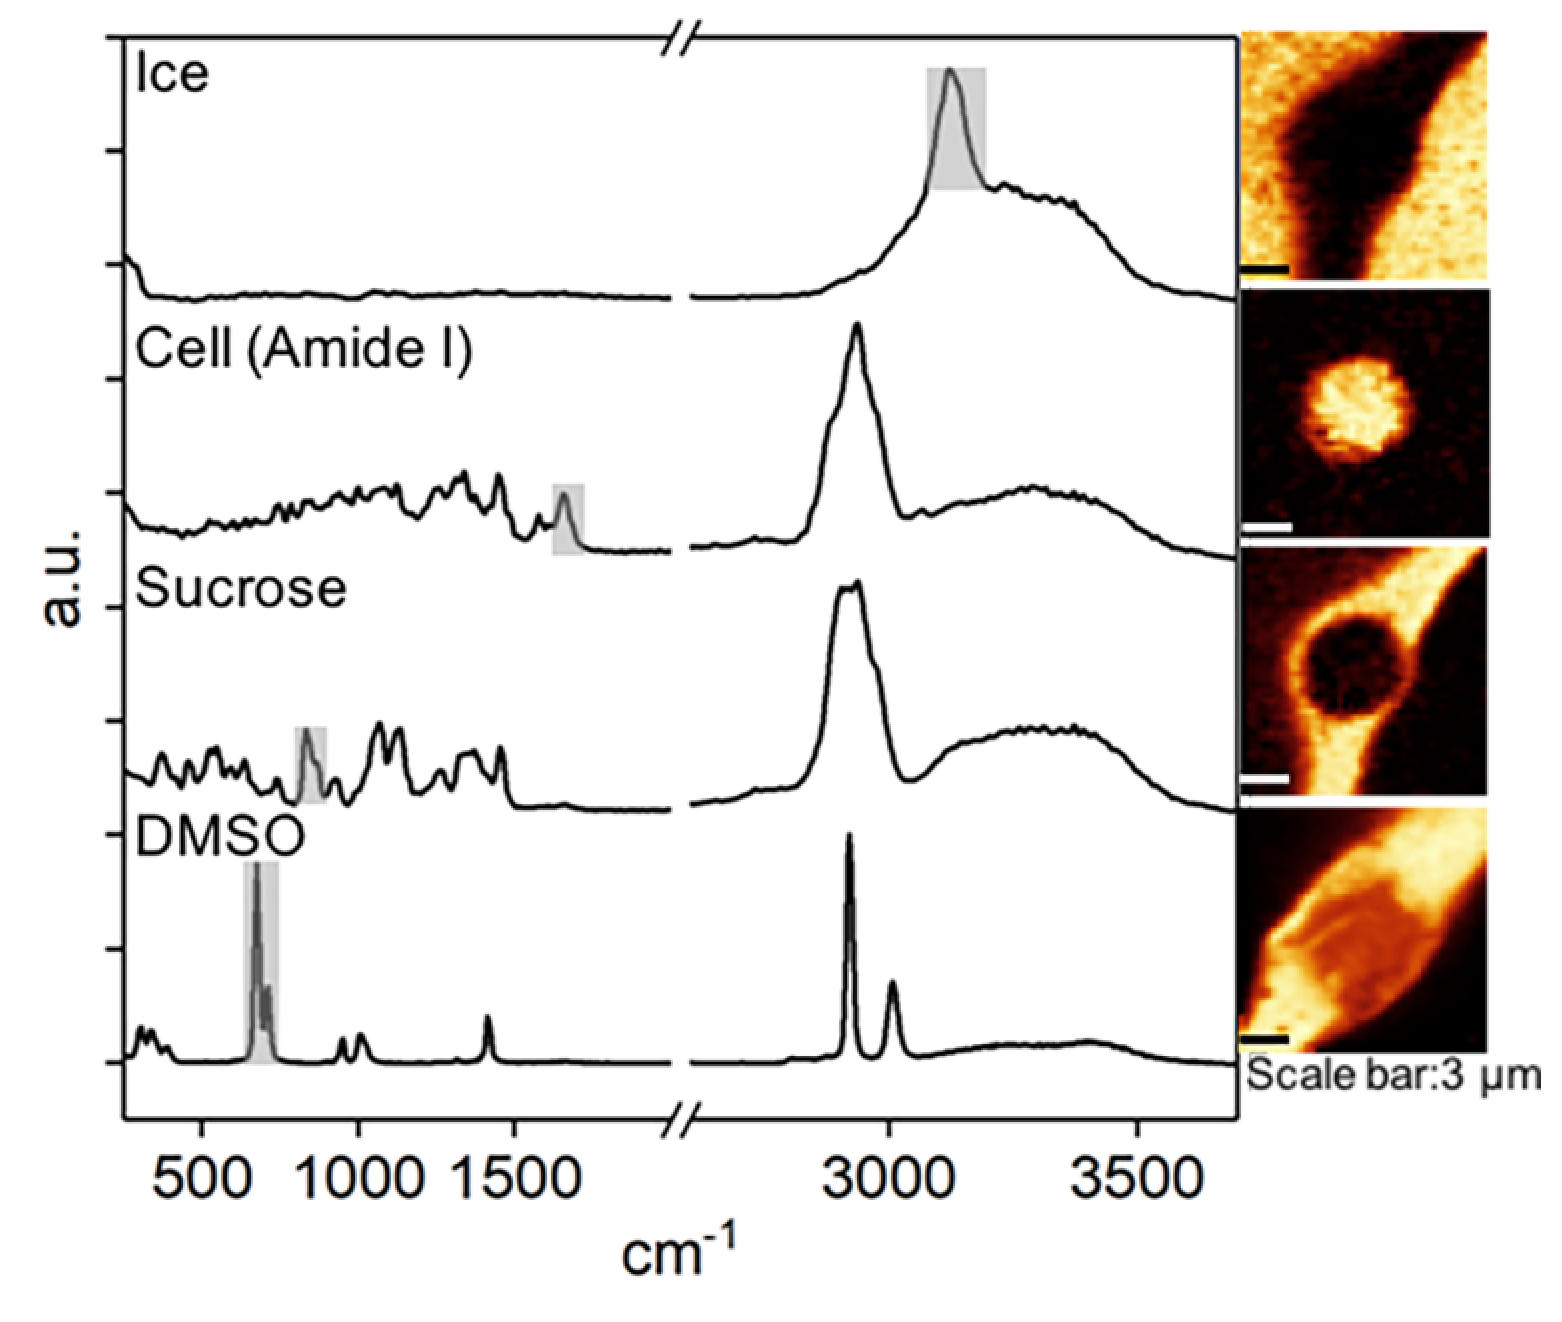
Raman spectra and images of ice, cell (amide I), sucrose, and DMSO. Raman images were rendered based on the specific Raman signals indicated on the spectra.
Table 1.
Wavenumber Assignments for Raman Spectra
RESULTS AND DISCUSSION
Interactions between Sucrose and Water at Low Temperature.
To characterize the behaviors of a nonfrozen sucrose solution at a low temperature, 730 mM sucrose solution was seeded at −6 °C and cooled at 1 °C/min to −10 °C and −50 °C. Raman images rendered on the signals associated with ice and the sucrose were generated (Figure 2A). Spectra were averaged over the area of nonfrozen sucrose solution (excluding the influence of ice) for both temperatures and further normalized to the CH2 stretching peak at 2936 cm−1 of the spectra at −50 °C40 (Figure 2B). The stronger intensity of CH2 stretching peak at −50 °C compared to that at −10 °C indicates a substantial increase of sucrose concentration as the temperature decreased. To determine the concentration of nonfrozen sucrose solution at a low temperature, Raman spectra of sucrose solutions with concentration ranging from 2920 mM to 4380 mM were collected. A calibration curve was developed based on the ratio of peak intensity at 2936 cm−1 to the peak intensity at 3420 cm−1 (Figure 2C,D). The concentration of sucrose in the nonfrozen solution at −10 °C was estimated to be 3650 mM. The concentration at −50 °C exceeded the range of the calibration curve, greatly higher than 4380 mM (i.e., the solubility limit achieved at room temperature), and no extrapolation was used to estimate the exact concentration (Figure 2D).
Figure 2.
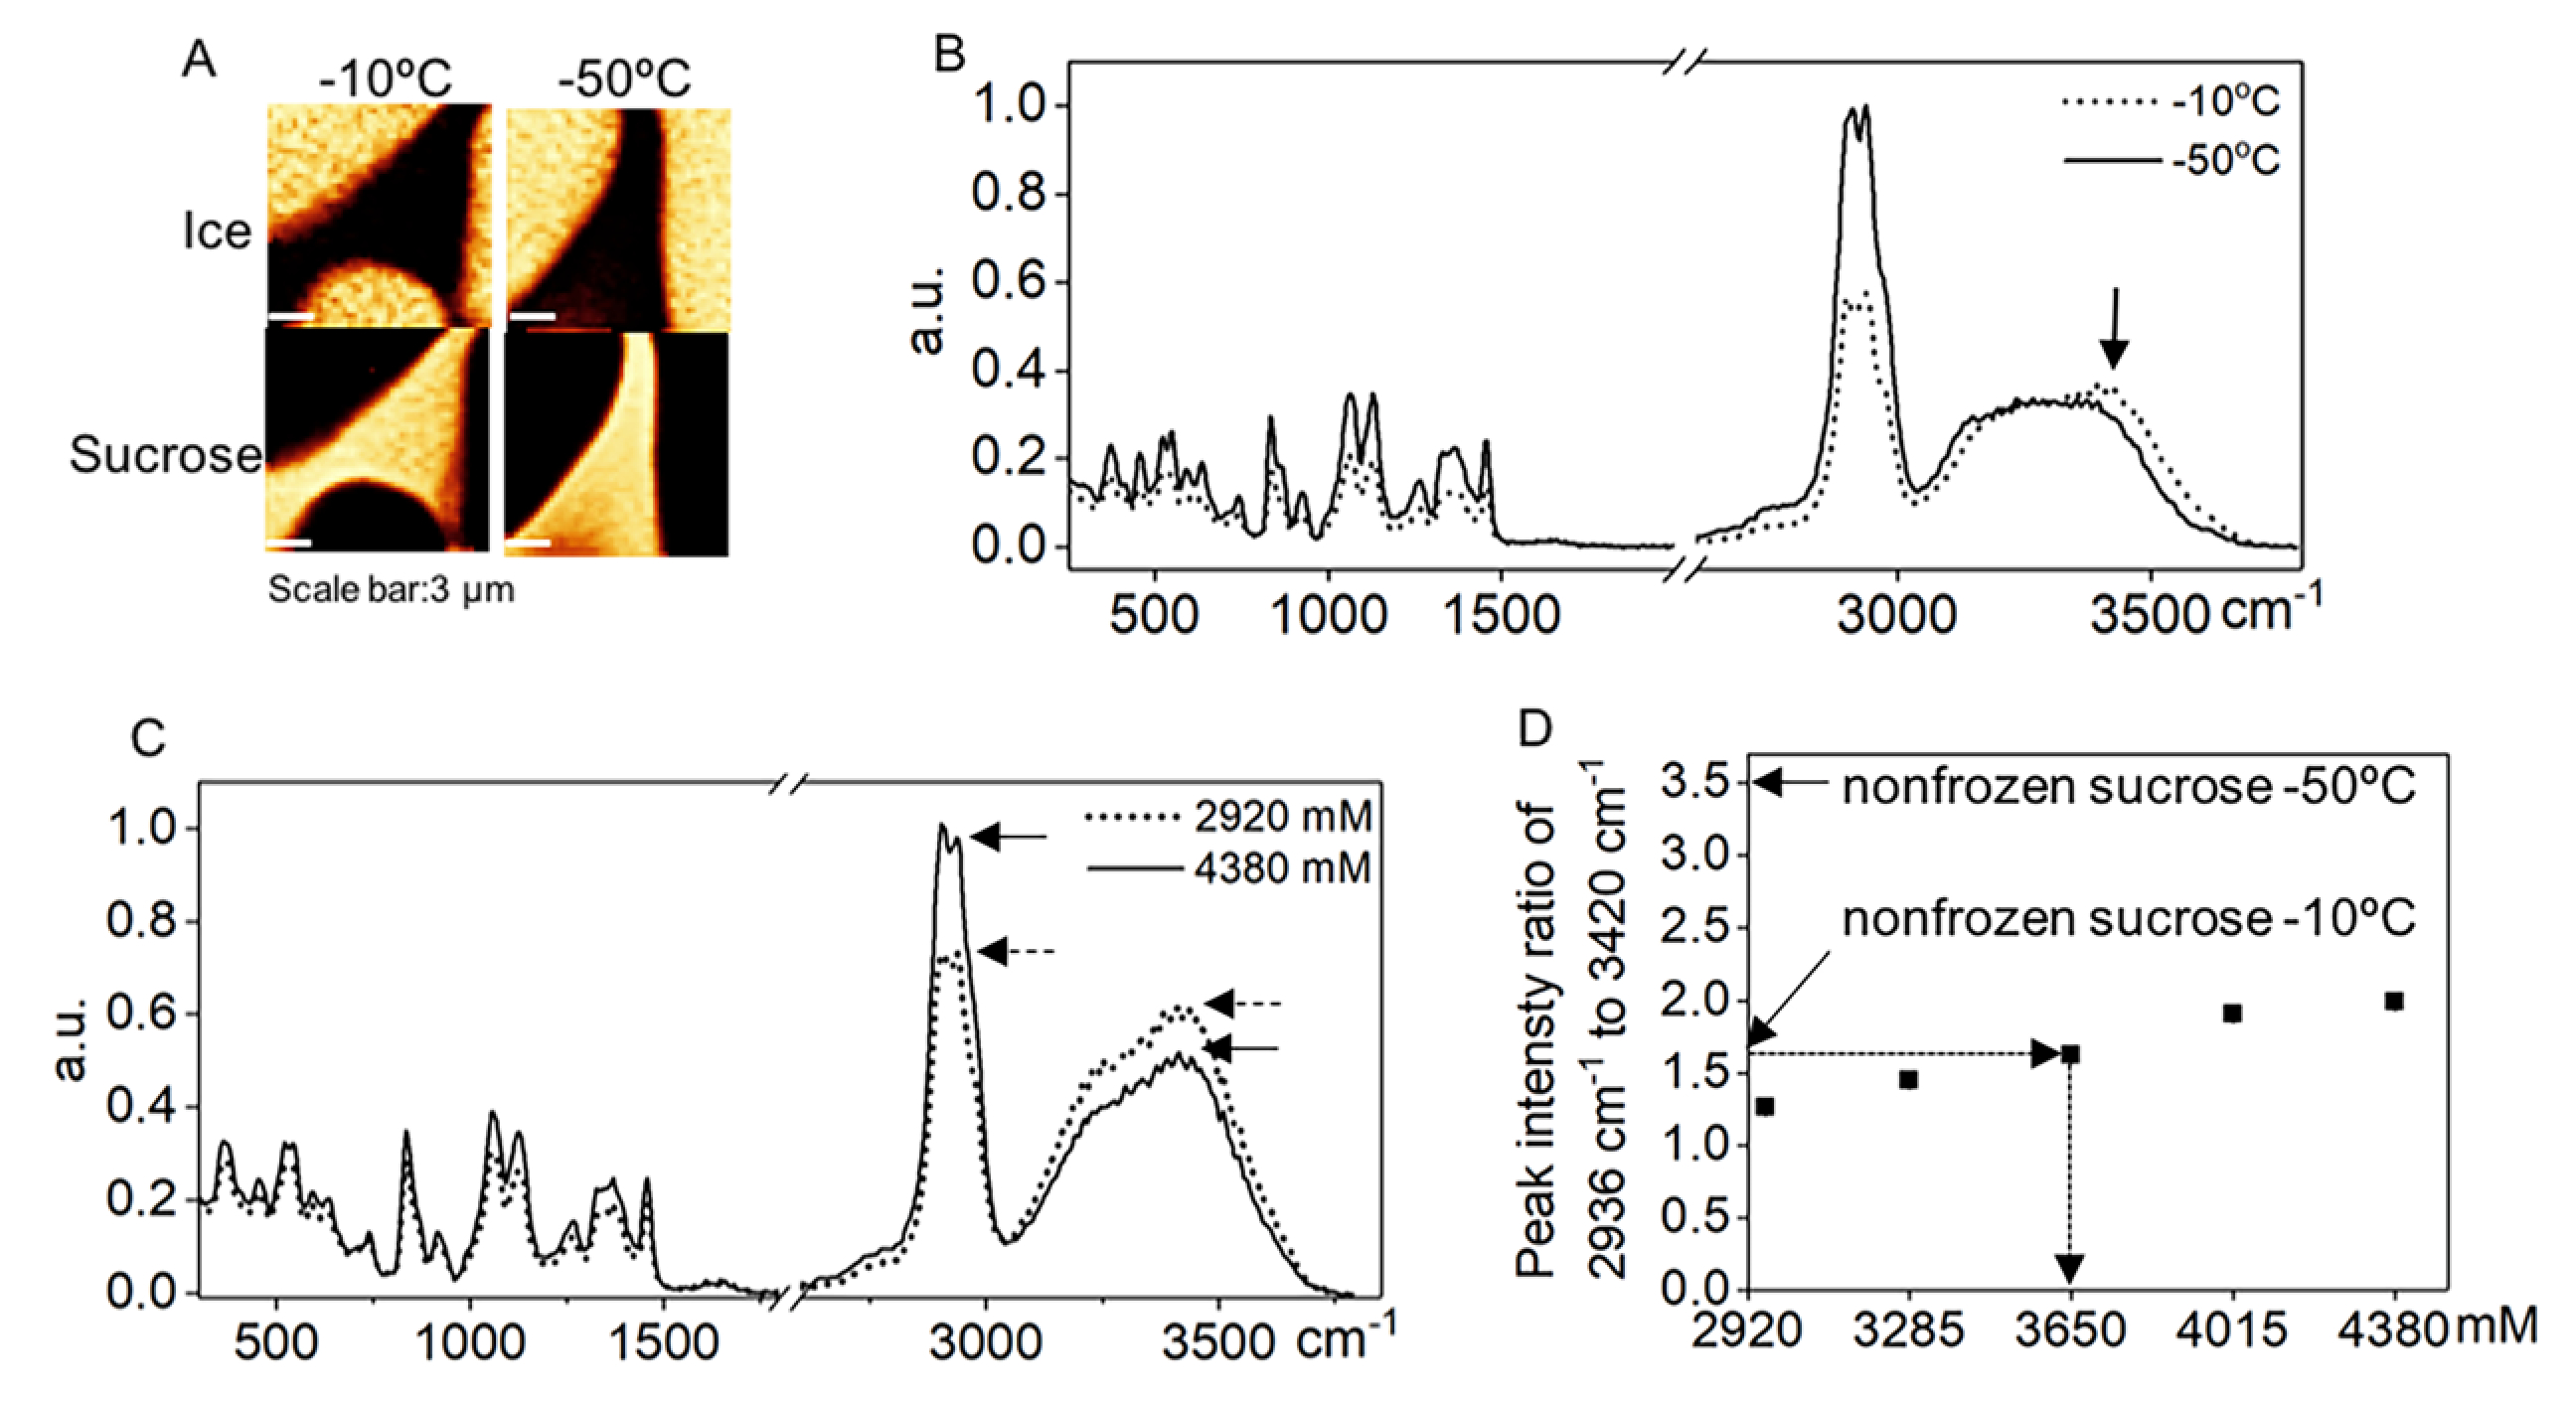
(A) Raman images of ice and nonfrozen sucrose solution at −10 °C and −50 °C for 730 mM sucrose solution. (B) Raman spectra averaged over the nonfrozen sucrose solution area at −10 °C and −50 °C. (C) Raman spectra of 2920 mM and 4380 mM sucrose solution. (D) Peak intensity ratio of 2936 cm−1 to 3420 cm−1 for a range of sucrose concentration. This ratio for Raman spectra averaged over nonfrozen sucrose solution at −10 °C and −50 °C were 1.6 and 3.5, respectively.
Raman spectra could also be used to characterize the hydrogen bond network of the nonfrozen solution. The broad OH stretching peak from 3100 to 3800 cm−1 has been decomposed into symmetric OH stretching centered at 3230 cm−1 (corresponding to tetrahedral hydrogen bond of water molecules) and asymmetric OH stretching centered at 3420 cm−1 (corresponding to a partially developed hydrogen bond of water molecules) for dilute sugar solutions.10,41 However, in this work, the high concentration of nonfrozen sucrose solution no longer qualified as dilute sugar solution, and the OH stretching from sucrose also contributed to the broad OH stretching peak, so the method of decomposing OH stretching peak into symmetric and asymmetric OH stretching of water was not performed. However, it could still be observed that peak intensity at 3420 cm−1 slightly decreased from −10 °C to −50 °C in Figure 2B, and the whole OH stretching peak shifted to a lower wavenumber as the temperature decreased.
The shorter OH stretching peak at 3420 cm−1 at the lower temperature indicates fewer “free” water molecules and strengthened intermolecular hydrogen bond between sucrose and water,9,42,43 which is consistent with the substantially increased sucrose concentration at −50 °C measured in this investigation. Previous studies suggested that sucrose molecules in concentrated solutions form chains via their hydroxyl groups and create a polymer-like structure with cavities.11 As a result, nonfrozen water molecules could be constrained or trapped in the highly viscous sucrose glass, and the dynamics of the water molecules was halted.12,44 The shift of wide OH stretching peak to lower wavenumber also indicates an enhanced hydrogen bond network of the nonfrozen solution as lower OH stretching frequency is associated with stronger hydrogen bond.45,46 However, it could not be discerned whether this shift resulted from an increased sucrose concentration or decreased temperature itself or a combination of both and will require further investigation.
Complex solutions, such as sucrose and water, freeze over a range of temperatures and the high spatial resolution of the Raman microscopy enabled us to closely investigate the nonfrozen solution between two adjacent ice crystals. Across the gap filled with nonfrozen solution (Figure 3A), a red arrow was drawn from one ice crystal through the nonfrozen sucrose solution to the other ice crystal. Normalized sucrose concentration and ice intensity were plotted (Figure 3B). At the interface of ice crystal and nonfrozen sucrose solution, the concentration of sucrose gradually increased away from the ice, while the ice density gradually decreased into the sucrose solution. The gradual nature of the changes in sucrose concentration and ice density at the interface was consistent with results shown by other interfacial studies.47 Across this channel of sucrose solution, the distribution of sucrose was relatively uniform in the noninterfacial region. The plateau of sucrose across the narrow channel of nonfrozen solution was unlike the accumulation of solutes at the interface during dynamic freezing process.48 The high lateral and spectral (chemical) resolution of confocal Raman spectroscopy allowed us to observe the sucrose-ice interface on the submicron level. On the other hand, its lower axial and temporal resolution limited our ability to study the interface on the third dimension or capture transient states of the interface during freezing. The analysis here illustrates the interface in a relatively steady state, where images were taken roughly 1 h after seeding and 30 min after reaching −50 °C.
Figure 3.
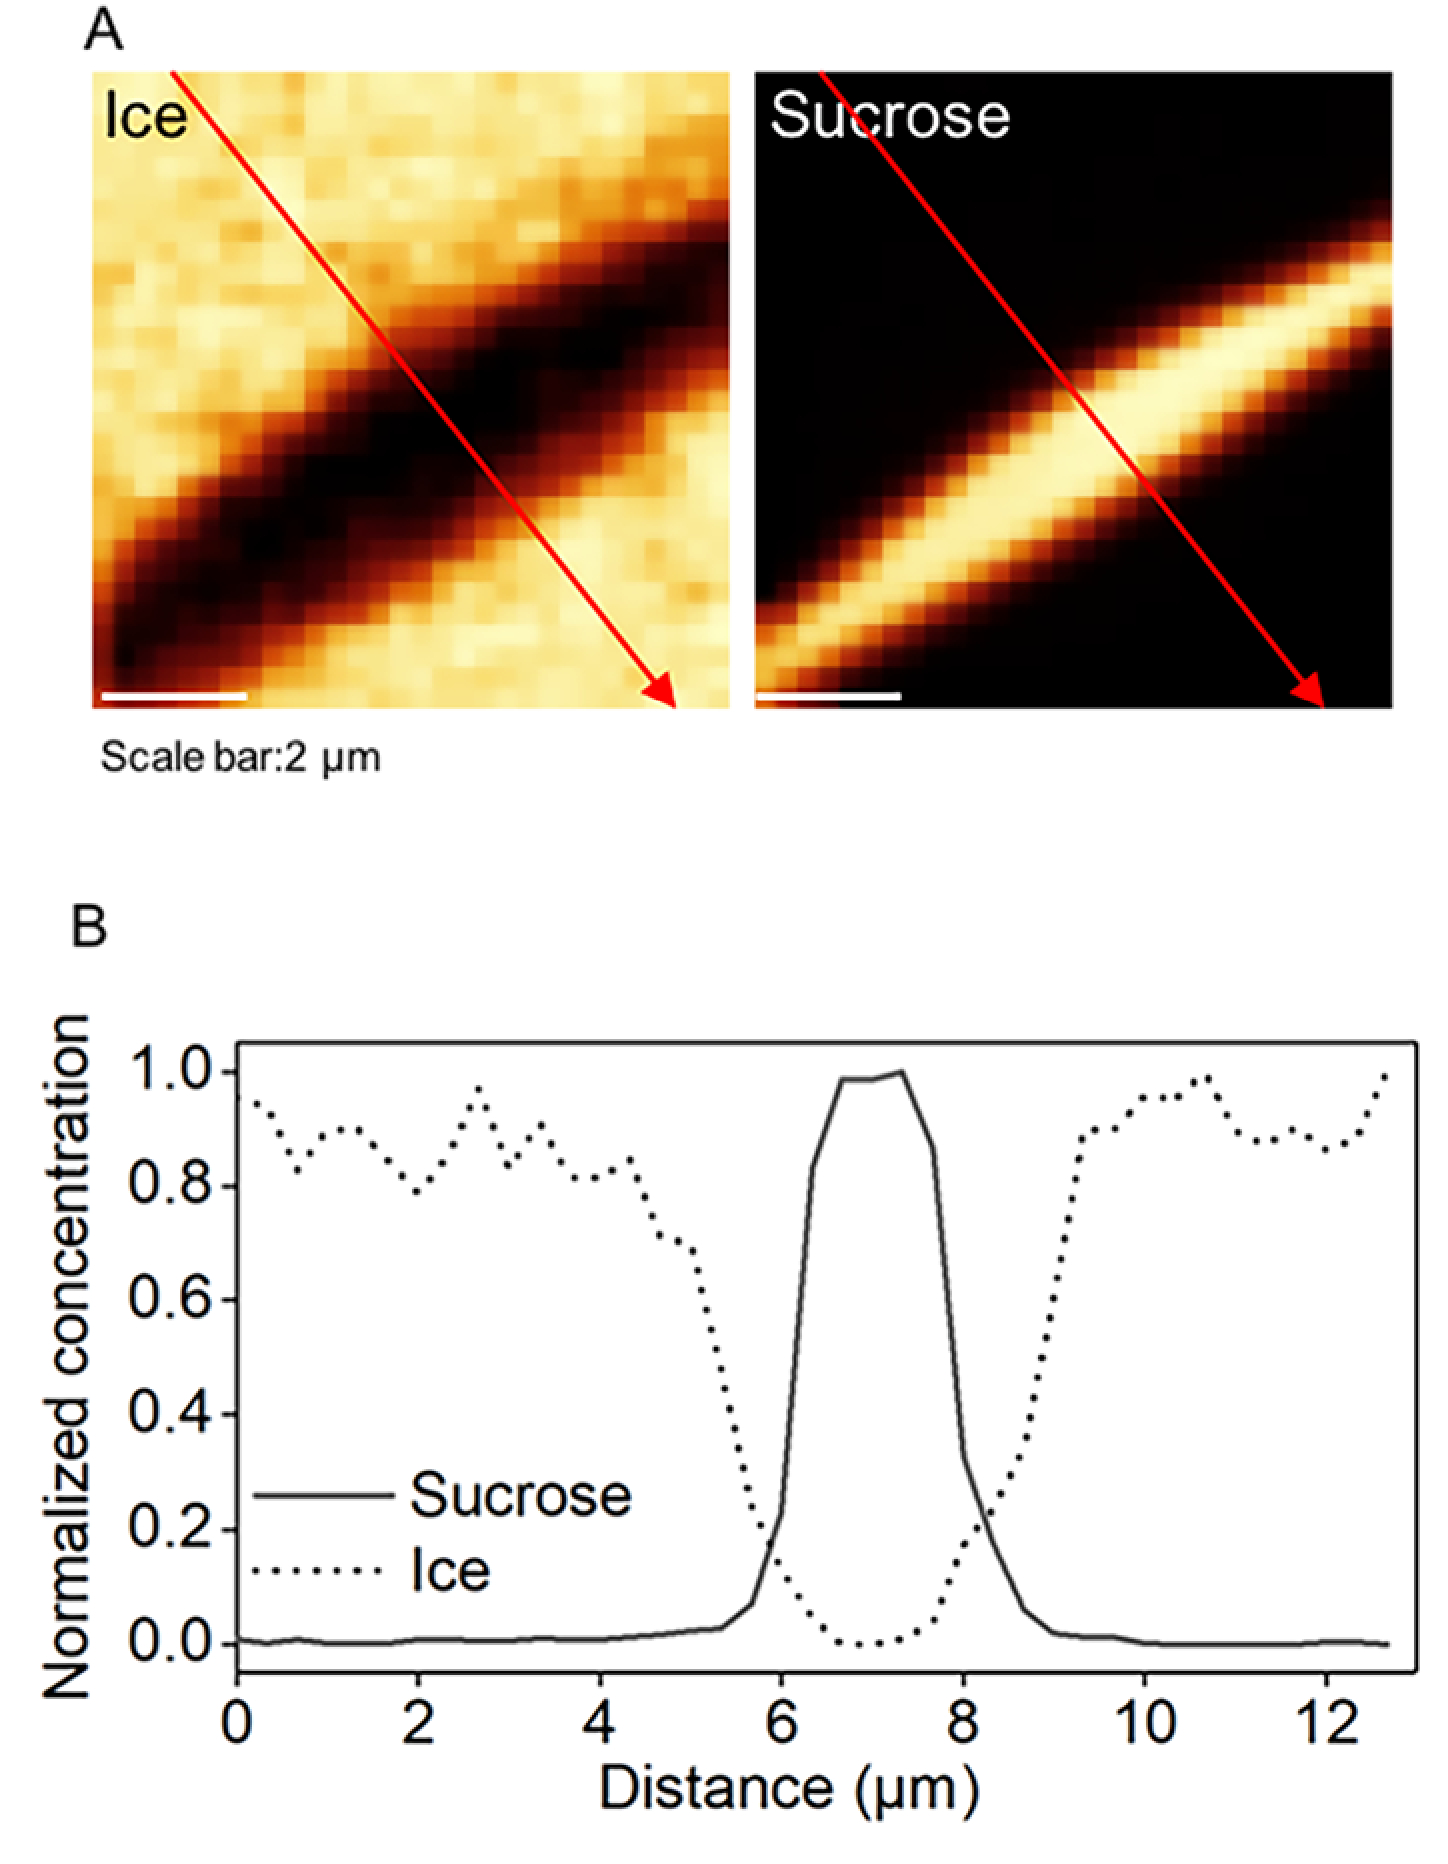
(A) Raman images of sucrose and ice at −50 °C for 730 mM sucrose solution. (B) Normalized sucrose concentration and ice intensity along the red arrow.
Freezing Behaviors in the Presence of Jurkat Cells.
It is generally accepted that sugars such as sucrose and trehalose are not cell-penetrating, although several techniques have been proposed to load sugars into cells to improve cell survival.49–51 However, studies that explore the precise distribution of sucrose relative to the cryopreserved cells are limited. To remedy this gap, Jurkat cells were cryopreserved in 730 mM sucrose solution at 1 °C/min to −50 °C and Raman images were rendered on the signals associated with sucrose as well as of the ice and cell (amide I) (Figure 4A). Raman images of sucrose demonstrated that sucrose was predominantly distributed outside the cell. The cell membrane was either in close proximity to the extracellular ice or connecting with an nonfrozen sucrose solution between adjacent ice crystals. It is noteworthy that sucrose was present at the interface between cell membrane and extracellular ice and formed a thin layer of nonfrozen solution surrounding the cell, which, to the best of our knowledge, has never been observed before. The thickness of the layer of sucrose solution between the cell membrane and the extracellular ice was calculated, and the average thickness was in the range of 0.4–0.9 μm (Figure 4B). Distances between extracellular ice and the cell membrane that were below the lateral spatial resolution of the confocal Raman microscope could not be resolved. Raman images of ice showed little intracellular ice formation (IIF) in the cryopreserved cells, and Raman images of cell showed that the cells maintained their normal circular morphology.
Figure 4.
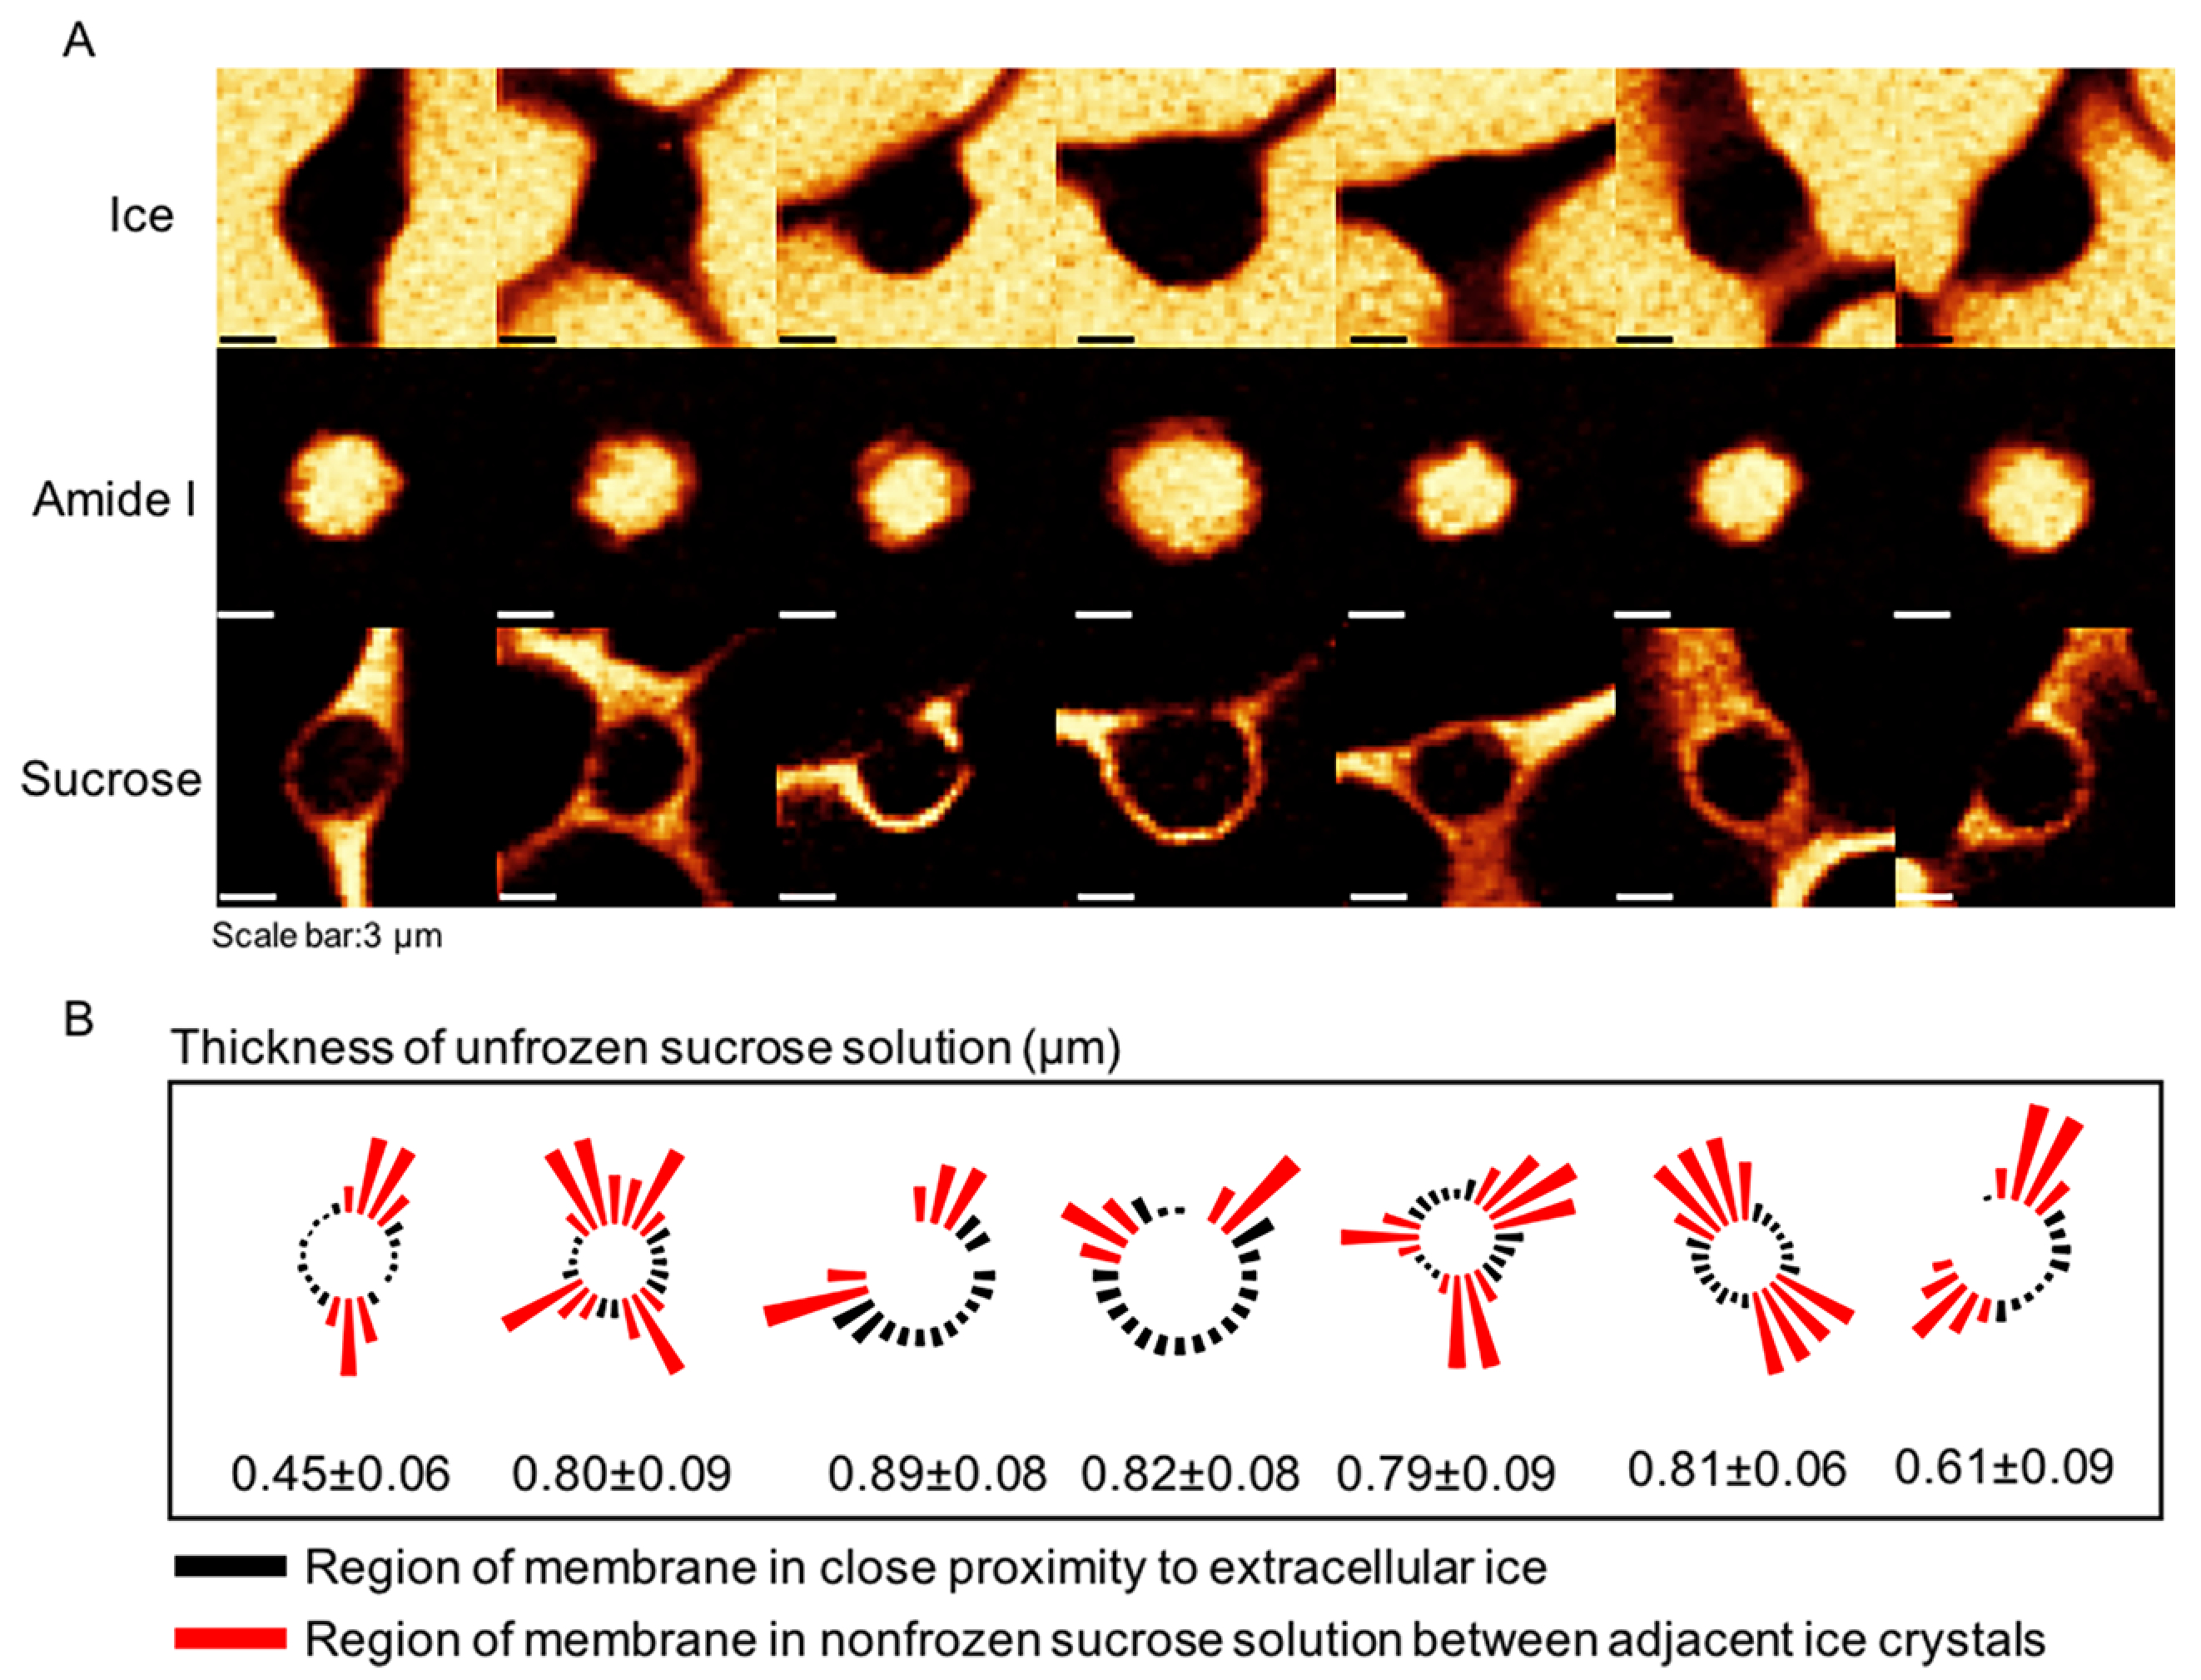
(A) Raman images of ice, cell (amide I) and sucrose for Jurkat cells cryopreserved in 730 mM sucrose solution. (B) Thickness of the nonfrozen sucrose solution around the cell. For the regions where solution thickness is not indicated, the thickness is less that the spatial resolution of the microscope (∼300 nm).
Cells were trapped between adjacent ice crystals whose geometric proximity to the cell was not uniform. The next phase of investigation involved quantifying the variation in the sucrose concentration in a gap between a cell and the ice phase. Raman images of ice, cell (amide I), and sucrose were shown for the cell used for analysis (Figure 5A). The normalized sucrose concentration was obtained along the white arrow passing through the interface (Figure 5B). The sucrose concentration at the interface between cell and extracellular ice was lower than that in bulk nonfrozen solution (Figure 5C). It was also noteworthy that the ice front was curved when close to the cell (Figure 5A).
Figure 5.
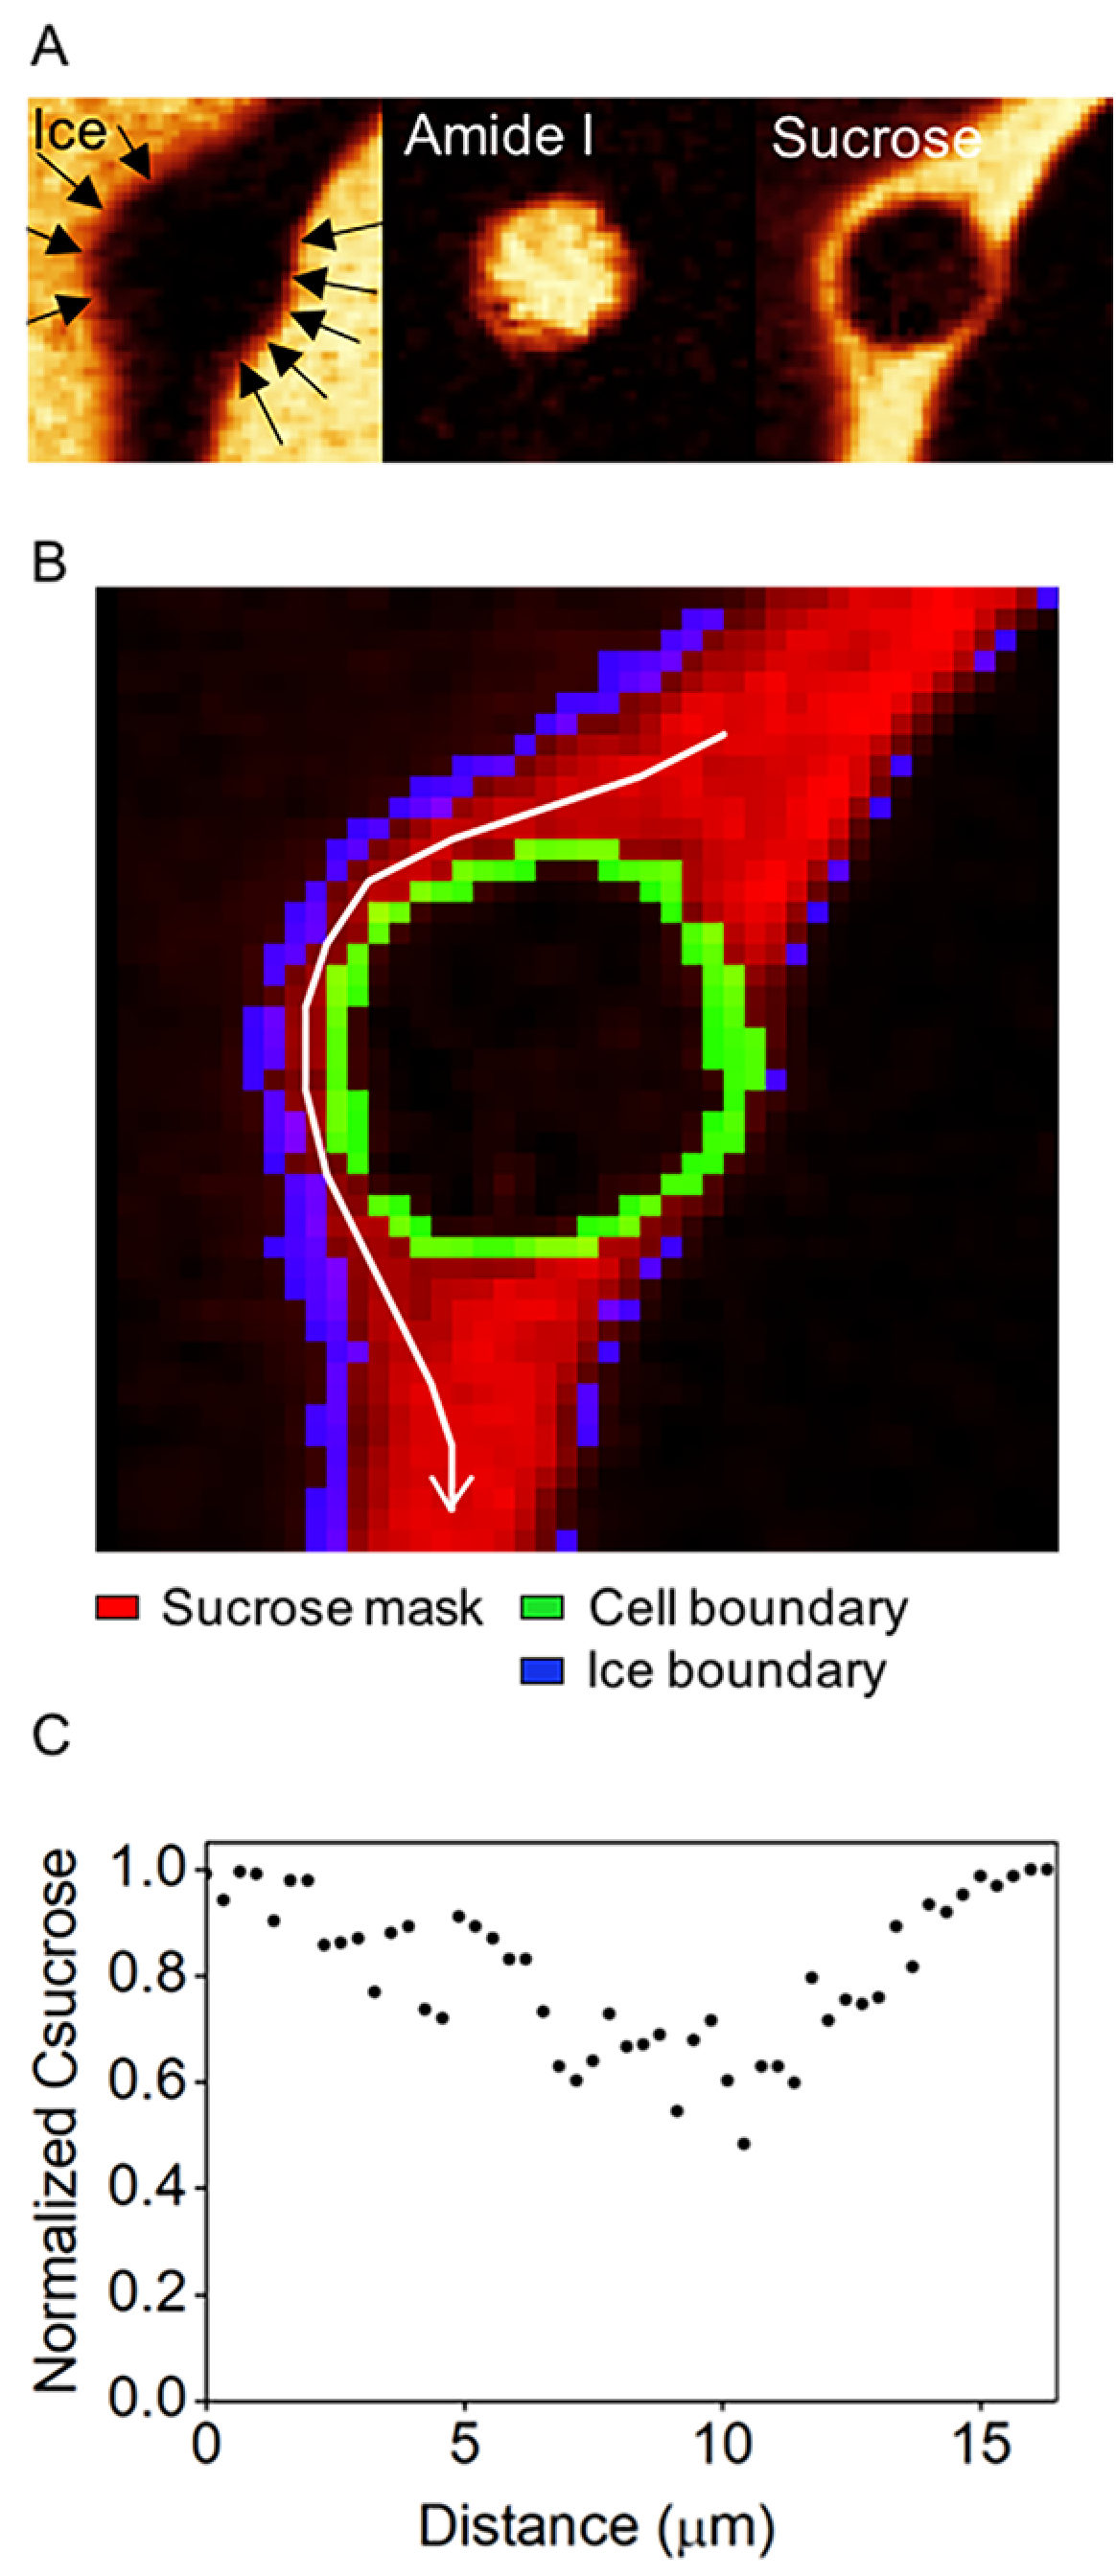
(A) Raman image of ice, cell (amide I), and sucrose for the cell used for analysis. (B) Binary image showing the location of white arrow used to illustrate sucrose concentration. (C) Normalized sucrose concentration obtained along the white arrow in panel B.
The interactions between solidifying interface and biological cells have been investigated by both experimental and simulation studies.22,25–27,48,52–54 The engulfment or entrapment of the cells between ice crystals in sugar solution has been studied before. It was previously suggested that molecular-level interactions between the cell and sugar were important.22 However, without accurate knowledge of the solute concentration, the effects of solute concentration and solidifying interface on the biological cells could not be precisely estimated. Concentration of solute at a concave solidifying interface was theorized by Dantzig and Rappaz to be higher than that at a planar interface for the same freezing conditions.55 However, the results in this study showed that sucrose concentration at the concave interface between the cell and the extracellular ice was lower than that of bulk nonfrozen solution. This suggests that cells are exposed to a heterogeneous chemical environment during freezing. The most likely cause of this outcome was the outflow of water from the cell, thereby diluting the concentration of sucrose in the nonfrozen solution.56 The timing of the exoösmosis from the cell is unclear (during freezing, during the hold period, or both), but it is likely that the lower concentration of sucrose in the narrow region of cell—extracellular ice interface and higher concentration in the bulk solution may reflect the inability of the water to quickly diffuse out of the narrow region and into the bulk regions at the low temperatures. The presence of the nonfrozen solution between cell and extracellular ice resulted in the growth of ice around the cell, which was consistent with simulation studies of cell/particle capture in binary solidification.57,58 The presence of a thin layer of nonfrozen sucrose solution also increased the distance between the cell membrane and the ice phase, which, in turn, reduced the potential for IIF.29
To further examine the interactions between cell and sucrose solution, a cell engulfed in ice was analyzed (Figure 6A). Binary masks were created from Raman images of sucrose and amide I to indicate the location and area of sucrose solution and cell, and the overlay of the two binary masks was observed (Figure 6B). Averaged Raman spectra over the sucrose mask in Figure 6B showed both peaks of sucrose (box 1) and amide I (box 2), which substantiated the overlap between sucrose solution and cell (Figure 6C). Raman spectra averaged over the cell area (excluded the overlapping area of cell and sucrose) showed much lower OH stretching peak than that of cell in DPBS at room temperature, which indicated dehydration of the cells cryopreserved in sucrose solution (Figure 6D).
Figure 6.
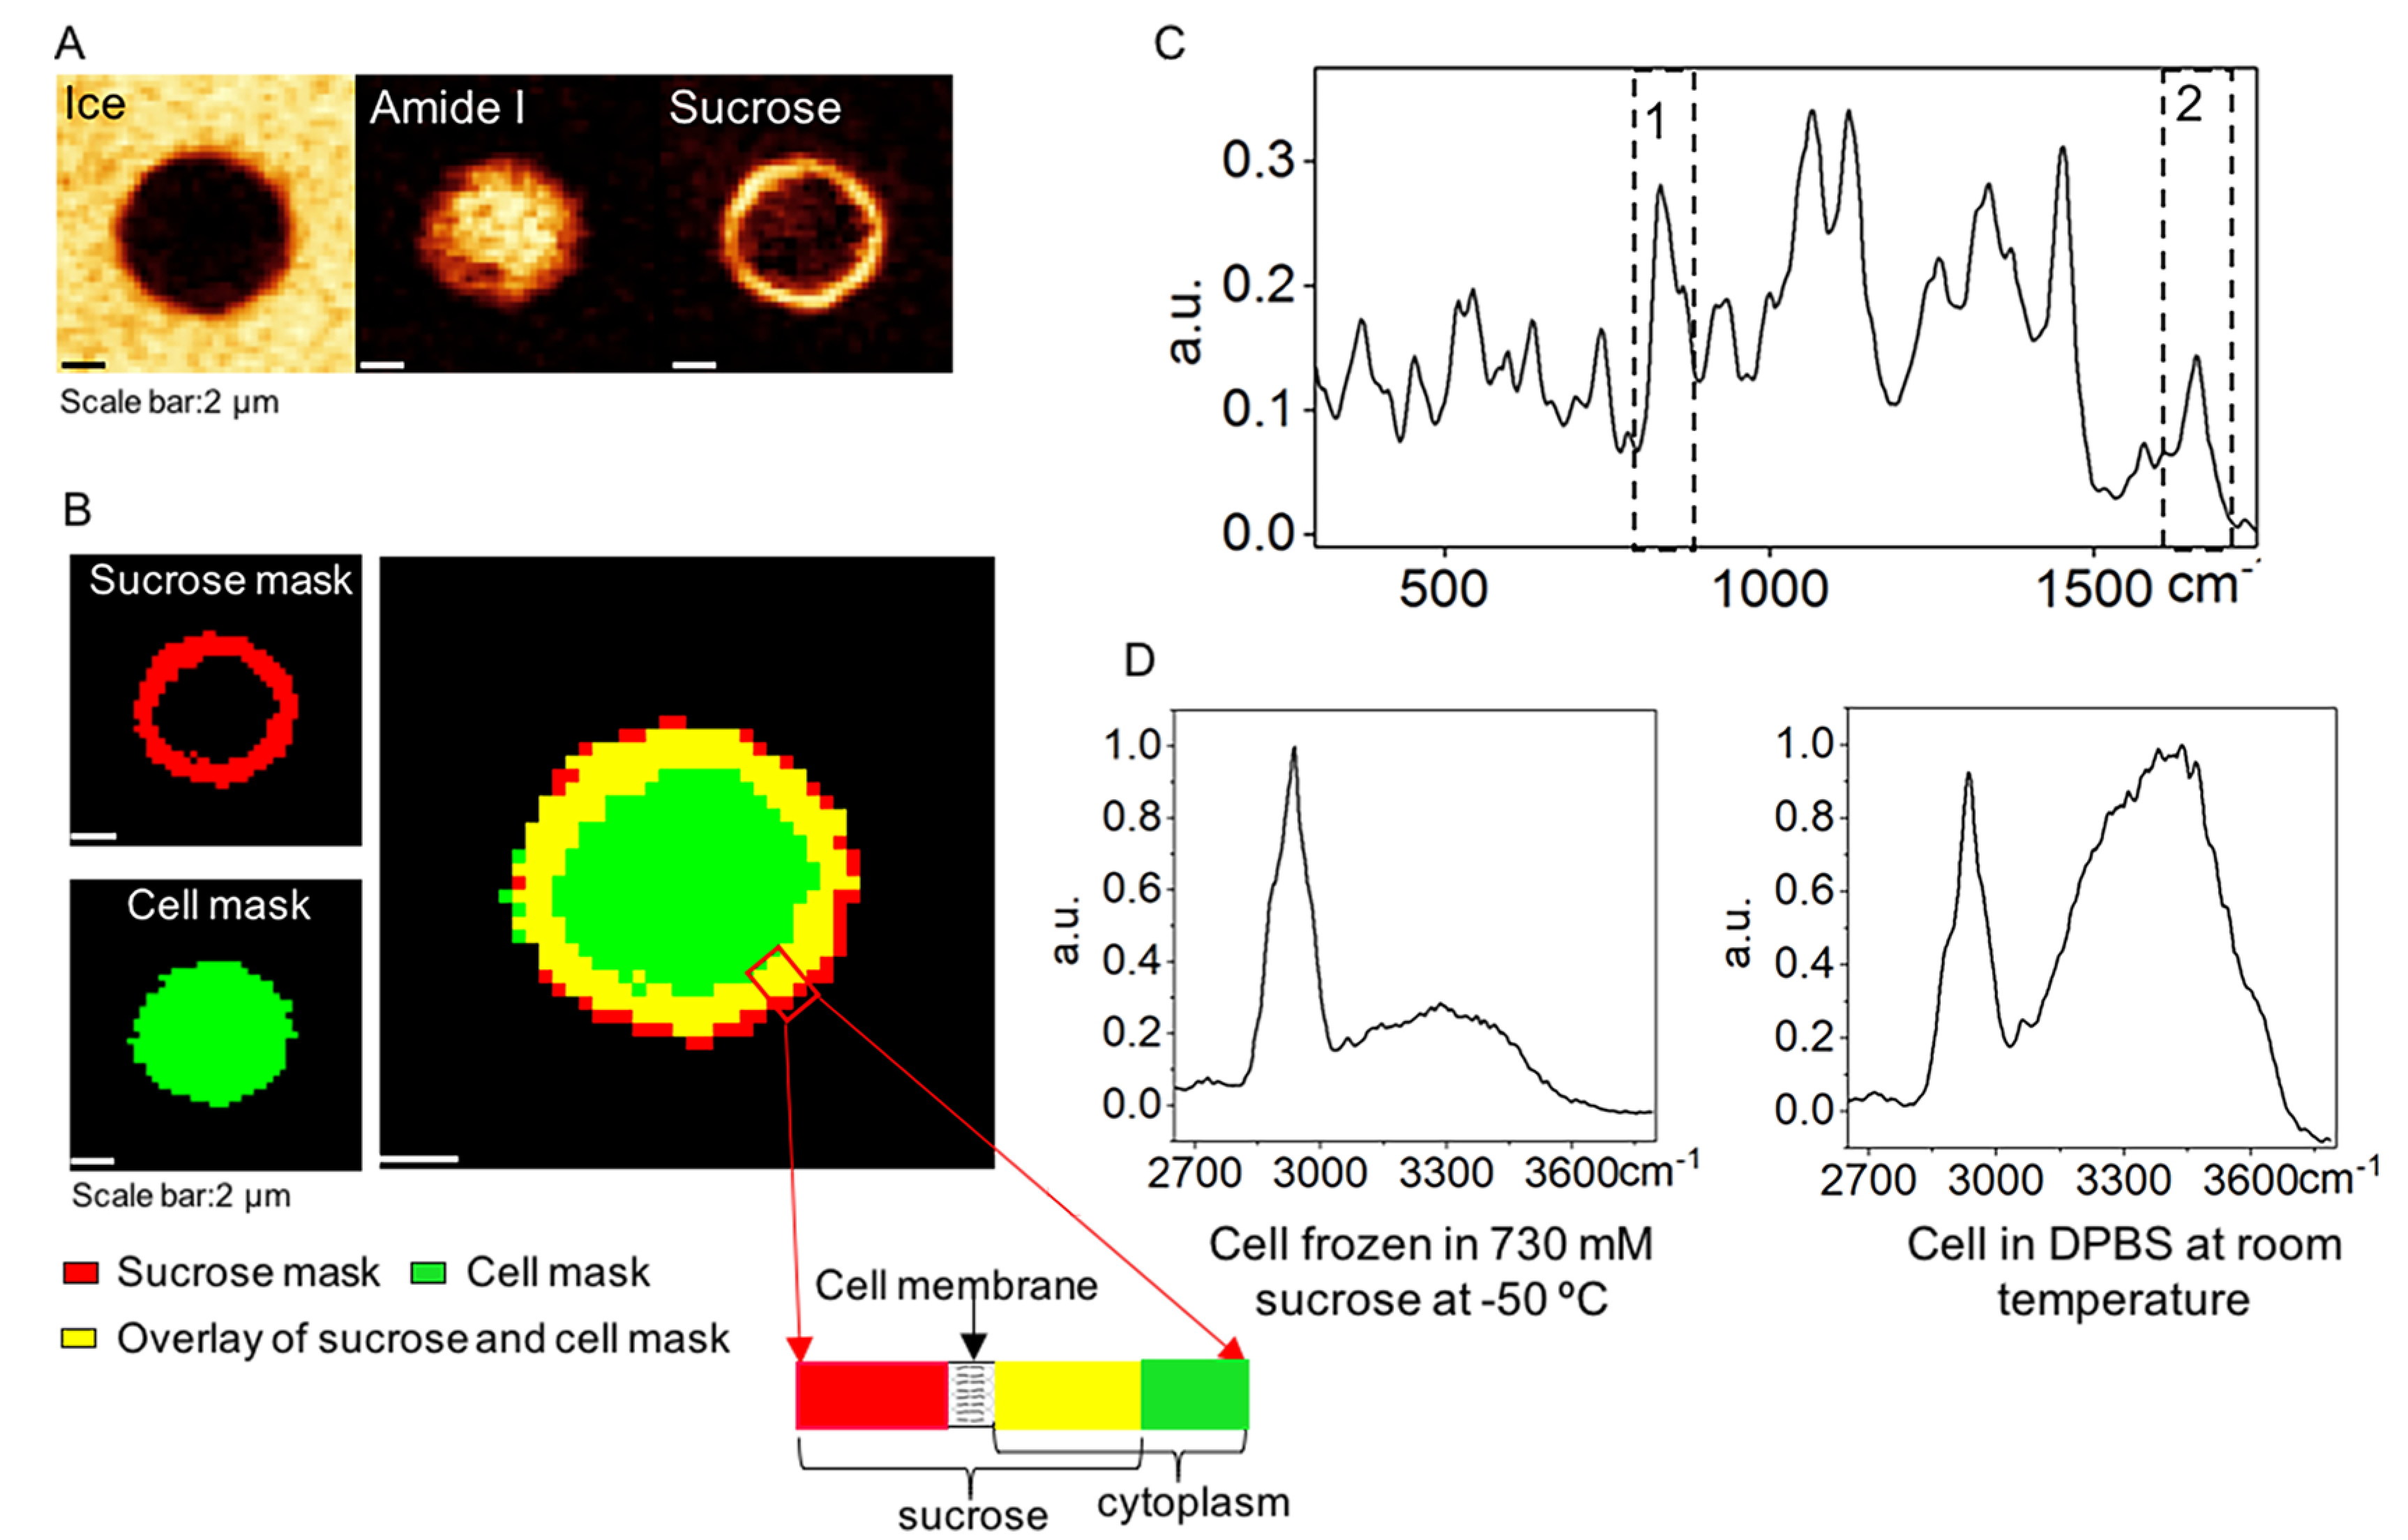
(A) Raman image of ice, cell (amide I), and sucrose for a Jurkat cell cryopreserved in 730 mM sucrose. (B) Binary masks of location and area of unfrozen sucrose solution and cell, and corresponding overlay of the two masks. Rectangular area showing the location of cell membrane relative to the sucrose solution. (C) Raman spectra averaged over the sucrose mask. Box 1 indicates Raman signal of sucrose, and box 2 indicates Raman signal of amide I. (D) Raman spectra of a cell cryopreserved in 730 mM sucrose solution at −50 °C and in DPBS at room temperature.
Although sucrose is normally not cell-permeant, Raman imaging of the sucrose and cell (amide I) showed that sucrose was not completely excluded from the cell. The overlap of Raman image of sucrose with that of amide I suggested that sucrose was adjacent to the cell membrane and was potentially integrated into the cell membrane. The interactions between sugars and cell membrane during freezing have been postulated by others.13 The results of this investigation are consistent with those observations. As the typical thickness of cell membrane is more than one order of magnitude below the spatial resolution of the microscope, the spectral composition of cell membrane could not be resolved from that of the cytoplasm, which made it difficult to determine definitely the relationship between sucrose and the cell membrane.
Furthermore, the partitioning of sucrose across the cell membrane was quantified by correlating intracellular and extracellular sucrose concentration for a Jurkat cell frozen in 730 mM sucrose solution. A red arrow was drawn in the Raman image of sucrose, and normalized sucrose concentration was calculated (Figure 7A). The intracellular sucrose concentration was less than 10% of the extracellular sucrose concentration. The same method was employed on another Jurkat cell frozen in 934 mM sucrose solution, which showed that the intracellular and the extracellular sucrose concentrations were comparable. This implied the breakdown of cell membrane (Figure 7B), which was consistent with the fact that Jurkat cells frozen in 934 mM sucrose exhibited poor post thaw recovery (data not shown). A Raman image of the cell (amide I) also showed that the cell with strong partitioning of sucrose maintained its circular morphology and the cell with sucrose penetration showed an irregular morphology and a decrease in peak intensity of amide I (Figure S1). There was little IIF in both cells based on the Raman images of ice. The partitioning of 10% DMSO across the cell membrane was also examined. It was found that the intracellular DMSO concentration was lower than the extracellular DMSO concentration (Figure 7C). Unlike sucrose, the gap between extracellular ice and the cell cryopreserved in DMSO solution was beyond the resolution limit of the Raman microscopy.
Figure 7.

(A) Brightfield image and Raman image of ice, cell (amide I), and sucrose for a cell cryopreserved in 730 mM sucrose solution. Normalized sucrose concentration was obtained across the red arrow. (B) Brightfield image and Raman image of ice, cell (amide I), and sucrose for a cell cryopreserved in 934 mM sucrose solution. Normalized sucrose concentration was obtained across the red arrow. (C) Brightfield image and Raman image of ice, cell (amide I), and DMSO for a cell cryopreserved in 10% DMSO solution. Normalized DMSO concentration was obtained across the red arrow. Representative images of one cell were selected from eight different cells and shown here for each condition.
During freezing, cells respond to the change of composition of a nonfrozen solution by an efflux of water.56,59,60 Cells cryopreserved in 730 mM sucrose solution were significantly dehydrated, as demonstrated by the Raman spectra; however, the cell membrane was still intact. Raman spectroscopy also enabled us to determine loss of membrane integrity during freezing, which could not be detected by conventional microscopy without fluorescent tag. The freezing of cells in 934 mM sucrose solution demonstrated such a loss in membrane integrity, and corresponding post thaw recoveries were poor.
CONCLUSION
Raman spectroscopy detected the strengthened hydrogen bond network in concentrated sucrose solution at low temperature. The variation in concentration of sucrose outside different regions of the cell membrane suggested that the chemical environment around the cell during freezing may be more heterogeneous than previously thought. Overlap between nonfrozen sucrose solution and cryopreserved cell was visually observed for the first time, which suggested that protective properties of sucrose might originate from its direct interaction with cell. Hopefully, future advancement in Raman spectroscopy modality will allow faster data acquisition and higher spatial resolution and improve our interfacial investigation of cells frozen in various cryoprotectants. Nonetheless, the results presented in this study showed that Raman spectroscopy was a powerful tool to characterize freezing responses of cells including interactions between cell and extracellular ice, partitioning of cryoprotectants, and cell morphology at low temperature.
Supplementary Material
ACKNOWLEDGMENTS
We would like to thank Professor Jonathan Dantzig for reading this manuscript and providing meaningful discussion and for further input from Samantha Brown. This work was funded by R01EB023880. Parts of this work were carried out in the Characterization Facility, University of Minnesota, which receives partial support from NSF through the MRSEC program.
Footnotes
ASSOCIATED CONTENT
Supporting Information
The Supporting Information is available free of charge on the ACS Publications website at DOI: 10.1021/acs.langmuir.8b01616.
Raman spectra of cell and nonfrozen sucrose solution (PDF)
Notes
The authors declare no competing financial interest.
■ REFERENCES
- (1).Iwatani M; Ikegami K; Kremenska Y; Hattori N; Tanaka S; Yagi S; Shiota K Dimethyl Sulfoxide Has an Impact on Epigenetic Profile in Mouse Embryoid Body. Stem Cells 2006, 24 (11), 2549–2556. [DOI] [PubMed] [Google Scholar]
- (2).Moll G; Alm JJ; Davies LC; Von Bahr L; Heldring N; Stenbeck-Funke L; Hamad OA; Hinsch R; Ignatowicz L; Locke M; et al. Do Cryopreserved Mesenchymal Stromal Cells Display Impaired Immunomodulatory and Therapeutic Properties? Stem Cells 2014, 32 (9), 2430–2442. [DOI] [PMC free article] [PubMed] [Google Scholar]
- (3).Windrum P; Morris TCM; Drake MB; Niederwieser D; Ruutu T Variation in Dimethyl Sulfoxide Use in Stem Cell Transplantation: A Survey of EBMT Centres. Bone Marrow Transplant 2005, 36 (7), 601–603. [DOI] [PubMed] [Google Scholar]
- (4).Petrenko Y. a.; Jones DRE; Petrenko a Y. Cryopreservation of Human Fetal Liver Hematopoietic Stem/Progenitor Cells Using Sucrose as an Additive to the Cryoprotective Medium. Cryobiology 2008, 57 (3), 195–200. [DOI] [PubMed] [Google Scholar]
- (5).Cardoso LM; Pinto MA; Henriques Pons A; Alves LA Cryopreservation of Rat Hepatocytes with Disaccharides for Cell Therapy. Cryobiology 2017, 78, 15–21. [DOI] [PubMed] [Google Scholar]
- (6).Rodrigues JP; Paraguassu-Braga FH; Carvalho L; Abdelhay E; Bouzas LF; Porto LC Evaluation of Trehalose and Sucrose as Cryoprotectants for Hematopoietic Stem Cells of Umbilical Cord Blood. Cryobiology 2008, 56 (2), 144–151. [DOI] [PubMed] [Google Scholar]
- (7).Pollock K; Samsonraj RM; Dudakovic A; Thaler R; Stumbras A; McKenna DH; Dosa PI; van Wijnen AJ; Hubel A Improved Post-Thaw Function and Epigenetic Changes in Mesenchymal Stromal Cells Cryopreserved Using Multicomponent Osmolyte Solutions. Stem Cells Dev 2017, 26 (11), 828–842. [DOI] [PMC free article] [PubMed] [Google Scholar]
- (8).Pollock K; Yu G; Moller-Trane R; Koran M; Dosa PI; McKenna DH; Hubel A Combinations of Osmolytes, Including Monosaccharides, Disaccharides, and Sugar Alcohols Act in Concert During Cryopreservation to Improve Mesenchymal Stromal Cell Survival. Tissue Eng., Part C 2016, 22 (11), 999–1008. [DOI] [PMC free article] [PubMed] [Google Scholar]
- (9).Shiraga K; Adachi A; Ogawa Y Characterization of the Hydrogen-Bond Network of Water around Sucrose and Trehalose: H-O-H Bending Analysis. Chem. Phys. Lett 2017, 678, 59–64. [DOI] [PubMed] [Google Scholar]
- (10).Lerbret A; Bordat P; Affouard FF; Guinet Y; Hédoux A; Paccou L; Prévost D; Descamps M Influence of Homologous Disaccharides on the Hydrogen-Bond Network of Water: Complementary Raman Scattering Experiments and Molecular Dynamics Simulations. Carbohydr. Res 2005, 340 (5), 881–887. [DOI] [PubMed] [Google Scholar]
- (11).Roozen MJGW; Hemminga MA Molecular Motion in Sucrose-Water Mixtures in the Liquid and Glassy State as Studied by Spin Probe ESR. J. Phys. Chem 1990, 94 (18), 7326–7329. [Google Scholar]
- (12).Lerbret A; Affouard F; Bordat P; Hédoux A; Guinet Y; Descamps M Slowing down of Water Dynamics in Disaccharide Aqueous Solutions. J. Non-Cryst. Solids 2011, 357, 695–699. [Google Scholar]
- (13).Anchordoguy TJ; Rudolph AS; Carpenter JF; Crowe JH Modes of Interaction of Cryoprotectants with Membrane Phospholipids during Freezing. Cryobiology 1987, 24 (4), 324–331. [DOI] [PubMed] [Google Scholar]
- (14).Crowe JH; Leslie SB; Crowe LM Is Vitrification Sufficient to Preserve Liposomes during Freeze-Drying? Cryobiology 1994, 31 (4), 355–366. [DOI] [PubMed] [Google Scholar]
- (15).Crowe JH; Crowe LM; Carpenter JF; Rudolph AS; Wistrom CA; Spargo BJ; Anchordoguy TJ Biochim. Biophys. Acta, Rev. Biomembr 1988, 947, 367–384. [DOI] [PubMed] [Google Scholar]
- (16).Crowe H; Crowe LM Infrared Spectroscopic Carbohydrates Studies on Interactions of Water and with a Biological Membrane. Arch. Biochem. Biophys 1994, 232 (1), 400–407. [DOI] [PubMed] [Google Scholar]
- (17).Leslie SB; Israeli E; Lighthart B; Crowe JH; Crowe LM Trehalose and Sucrose Protect Both Membranes and Proteins in Intact Bacteria during Drying. Appl. Environ. Microbiol 1995, 61 (10), 3592–3597. [DOI] [PMC free article] [PubMed] [Google Scholar]
- (18).Green JL; Angell CA Phase Relations and Vitrification in Saccharide-Water Solutions and the Trehalose Anomaly. J. Phys. Chem 1989, 93 (8), 2880–2882. [Google Scholar]
- (19).Crowe JH; Hoekstra FA; Nguyen KHN; Crowe LM Is Vitrification Involved in Depression of the Phase Transition Temperature in Dry Phospholipids? Biochim. Biophys. Acta, Biomembr 1996, 1280 (2), 187–196. [DOI] [PubMed] [Google Scholar]
- (20).Lee CW; Das Gupta SK; Mattai J; Shipley GG; Abdel-Mageed OH; Makriyannis A; Griffin RG Characterization of the L_lambda Phase in Trehalose-Stabilized Dry Membranes by Solid-State NMR and X-Ray Diffraction. Biochemistry 1989, 28 (12), 5000–5009. [DOI] [PubMed] [Google Scholar]
- (21).Rudolph BR; Chandrasekhar I; Gaber BP; Nagumo M Molecular Modelling of Saccharide-Lipid Interactions. Chem. Phys. Lipids 1990, 53 (2–3), 243–261. [Google Scholar]
- (22).Hubel A; Darr TB; Chang A; Dantzig J Cell Partitioning during the Directional Solidification of Trehalose Solutions. Cryobiology 2007, 55 (3), 182–188. [DOI] [PubMed] [Google Scholar]
- (23).Beckmann J; Körber C; Rau G; Hubel A; Cravalho EG Redefining Cooling Rate in Terms of Ice Front Velocity and Thermal Gradient: First Evidence of Relevance to Freezing Injury of Lymphocytes. Cryobiology 1990, 27 (3), 279–287. [DOI] [PubMed] [Google Scholar]
- (24).Hubel A; Cravalho EG; Nunner B; Körber C Survival of Directionally Solidified B-Lymphoblasts under Various Crystal Growth Conditions. Cryobiology 1992, 29 (2), 183–198. [DOI] [PubMed] [Google Scholar]
- (25).Lipp G; Galow S; KÖrber C; Rau G Encapsulation of Human Erythrocytes by Growing Ice Crystals. Cryobiology 1994, 31 (3), 305–312. [DOI] [PubMed] [Google Scholar]
- (26).Ishiguro H; Rubinsky B Mechanical Interactions between Ice Crystals and Red Blood Cells during Directional Solidification. Cryobiology 1994, 31 (5), 483–500. [DOI] [PubMed] [Google Scholar]
- (27).Chang A; Dantzig JA; Darr BT; Hubel A Modeling the Interaction of Biological Cells with a Solidifying Interface. J. Comput. Phys 2007, 226 (2), 1808–1829. [Google Scholar]
- (28).Carin M; Jaeger M Numerical Simulation of the Interaction of Biological Cells with an Ice Front during Freezing. Eur. Phys. J.: Appl. Phys 2001, 16 (3), 231–238. [Google Scholar]
- (29).Yu G; Yap YR; Pollock K; Hubel A Characterizing Intracellular Ice Formation of Lymphoblasts Using Low-Temperature Raman Spectroscopy. Biophys. J 2017, 112 (12), 2653–2663. [DOI] [PMC free article] [PubMed] [Google Scholar]
- (30).Kreiner-Møller A; Stracke F; Zimmermann H Hydrohalite Spatial Distribution in Frozen Cell Cultures Measured Using Confocal Raman Microscopy. Cryobiology 2014, 69 (1), 41–47. [DOI] [PubMed] [Google Scholar]
- (31).Kreiner-Møller A; Stracke F; Zimmermann H Confocal Raman Microscopy as a Non-Invasive Tool to Investigate the Phase Composition of Frozen Complex Cryopreservation Media. CryoLetters 2013, 34 (3), 248–260. [PubMed] [Google Scholar]
- (32).Abazari A; Chakraborty N; Hand S; Aksan A; Toner M A Raman Microspectroscopy Study of Water and Trehalose in Spin-Dried Cells. Biophys. J 2014, 107 (10), 2253–2262. [DOI] [PMC free article] [PubMed] [Google Scholar]
- (33).Dong J; Malsam J; Bischof JC; Hubel A; Aksan A Spatial Distribution of the State of Water in Frozen Mammalian Cells. Biophys. J 2010, 99 (8), 2453–2459. [DOI] [PMC free article] [PubMed] [Google Scholar]
- (34).Li R; Yu G; Azarin SM; Hubel A Freezing Responses in DMSO-Based Cryopreservation of Human IPS Cells: Aggregates Versus Single Cells. Tissue Eng., Part C 2018, 24 (5), 289. [DOI] [PMC free article] [PubMed] [Google Scholar]
- (35).Solocinski J; Osgood Q; Wang M; Connolly A; Menze AM; Chakraborty N Effect of Trehalose as an Additive to Dimethyl Sulfoxide Solutions on Ice Formation, Cellular Viability, and Metabolism. Cryobiology 2017, 75, 134–143. [DOI] [PubMed] [Google Scholar]
- (36).Bailey TL; Wang M; Solocinski J; Nathan BP; Chakraborty N; Menze MA Protective Effects of Osmolytes in Cryopreserving Adherent Neuroblastoma (Neuro-2a) Cells. Cryobiology 2015, 71 (3), 472–480. [DOI] [PubMed] [Google Scholar]
- (37).Dougherty R Extensions of DAMAS and Benefits and Limitations of Deconvolution in Beamforming; 11th AIAA/CEAS Aeroacoustics Conference, 2005. [Google Scholar]
- (38).Mathlouthi M; Vinh Luu D Laser-Raman Spectra of d-Glucose and Sucrose in Aqueous Solution. Carbohydr. Res 1980, 81 (2), 203–212. [Google Scholar]
- (39).Martens WN; Frost RL; Kristof J; Theo Kloprogge J Raman Spectroscopy of Dimethyl Sulfoxide and Deuterated Dimethyl Sulfoxide at 298 and 77 K. J. Raman Spectrosc 2002, 33 (2), 84–91. [Google Scholar]
- (40).Brizuela AB; Bichara LC; Romano E; Yurquina A; Locatelli S; Brandán SA A Complete Characterization of the Vibrational Spectra of Sucrose. Carbohydr. Res 2012, 361, 212–218. [DOI] [PubMed] [Google Scholar]
- (41).Branca C; Magazu S; Maisano G; Migliardo P Anomalous Cryoprotective Effectiveness of Trehalose: Raman Scattering Evidences. J. Chem. Phys 1999, 111 (1), 281–287. [Google Scholar]
- (42).Richardson SJ; Baianu IC; Steinberg MP Mobility of Water in Sucrose Solutions Determined by Deuterium and Oxygen-17 Nuclear Magnetic Resonance Measurements. J. Food Sci 1987, 52 (3), 806–809. [Google Scholar]
- (43).Shiraga K; Adachi A; Nakamura M; Tajima T; Ajito K; Ogawa Y Characterization of the Hydrogen-Bond Network of Water around Sucrose and Trehalose: Microwave and Terahertz Spectroscopic Study. J. Chem. Phys 2017, 146 (10), 105102. [DOI] [PubMed] [Google Scholar]
- (44).Douglas Goff H Low-Temperature Stability and the Glassy State in Frozen Foods. Food Res. Int 1992, 25 (4), 317–325. [Google Scholar]
- (45).Dashnau JL; Nucci NV; Sharp KA; Vanderkooi JM Hydrogen Bonding and the Cryoprotective Properties of Glycerol/ Water Mixtures. J. Phys. Chem. B 2006, 110 (27), 13670–13677. [DOI] [PubMed] [Google Scholar]
- (46).Galkina YA; Kryuchkova NA; Vershinin MA; Kolesov BA Features of Strong O-H···O and N-H···O Hydrogen Bond Manifestation in Vibrational Spectra. J. Struct. Chem 2017, 58 (5), 911–918. [Google Scholar]
- (47).Drori R; Holmes-Cerfon M; Kahr B; Kohn RV; Ward MD Dynamics and Unsteady Morphologies at Ice Interfaces Driven by D 2 O-H 2 O Exchange. Proc. Natl. Acad. Sci. U. S. A 2017, 114 (44), 11627–11632. [DOI] [PMC free article] [PubMed] [Google Scholar]
- (48).Körber C Phenomena at the Advancing Ice—Liquid Interface: Solutes Particles and Biological Cells. Q. Rev. Biophys 1988, 21 (2), 229–298. [DOI] [PubMed] [Google Scholar]
- (49).Sitaula R; Elmoazzen H; Toner M; Bhowmick S Desiccation Tolerance in Bovine Sperm: A Study of the Effect of Intracellular Sugars and the Supplemental Roles of an Antioxidant and a Chelator. Cryobiology 2009, 58 (3), 322–330. [DOI] [PubMed] [Google Scholar]
- (50).Lynch AL; Chen R; Dominowski PJ; Shalaev EY; Yancey RJ; Slater NKH. Biopolymer Mediated Trehalose Uptake for Enhanced Erythrocyte Cryosurvival. Biomaterials 2010, 31 (23), 6096–6103. [DOI] [PubMed] [Google Scholar]
- (51).Zhang M; Oldenhof H; Sieme H; Wolkers WF Freezing-Induced Uptake of Trehalose into Mammalian Cells Facilitates Cryopreservation. Biochim. Biophys. Acta, Biomembr 2016, 1858 (6), 1400–1409. [DOI] [PubMed] [Google Scholar]
- (52).Harmison HR; Diller KR; Walsh JR; Neils CM; Brand JJ Measurement of Cell Volume Loss in the Liquid Region Preceding an Advancing Phase Change Interface. Ann. N.Y. Acad. Sci 1998, 858, 276–283. [DOI] [PubMed] [Google Scholar]
- (53).Mao L; Udaykumar HS; Karlsson JOM Simulation of Micro-Scale Interaction between Ice and Biological Cells. Int. J. Heat Mass Transfer 2003, 46 (26), 5123–5136. [Google Scholar]
- (54).Jaeger M; Carin M; Medale M; Tryggvason G The Osmotic Migration of Cells in a Solute Gradient. Biophys. J 1999, 77 (3), 1257–1267. [DOI] [PMC free article] [PubMed] [Google Scholar]
- (55).Dantzig J; Rappaz M Thermodynamics. In Solidification; EPFL Press, 2017; pp 55–59. [Google Scholar]
- (56).MAZUR P Kinetics of Water Loss from Cells at Subzero Temperatures and the Likelihood of Intracellular Freezing. J. Gen. Physiol 1963, 47, 347–369. [DOI] [PMC free article] [PubMed] [Google Scholar]
- (57).Kao JCT; Golovin AA; Davis SH Particle Capture in Binary Solidification. J. Fluid Mech 2009, 625, 299–320. [Google Scholar]
- (58).Carin M; Jaeger M Numerical Simulation of the Interaction of Biological Cells with an Ice Front during Freezing. Eur. Phys. J.: Appl. Phys 2001, 16, 231. [Google Scholar]
- (59).Pegg DE; Diaper MP On the Mechanism of Injury to Slowly Frozen Erythrocytes. Biophys. J 1988, 54 (3), 471–488. [DOI] [PMC free article] [PubMed] [Google Scholar]
- (60).Lovelock JEE The Haemolysis of Human Red Blood-Cells by Freezing and Thawing. Biochim. Biophys. Acta 1953, 10, 414–426. [DOI] [PubMed] [Google Scholar]
Associated Data
This section collects any data citations, data availability statements, or supplementary materials included in this article.


