

Abstract
Analyses of whole organs from parasite-infected animals can reveal the entirety of the host tissue transcriptome, but conventional approaches make it difficult to dissect out the contributions of individual cellular subsets to observed gene expression. Computational deconvolution of gene expression data may be one solution to this problem. We tested this potential solution by deconvoluting whole bladder gene expression microarray data derived from a model of experimental urogenital schistosomiasis. A supervised technique was used to group B-cell and T-cell related genes based on their cell types, with a semi-supervised technique to calculate the proportions of urothelial cells. We demonstrate that the deconvolution technique was able to group genes into their correct cell types with good accuracy. A clustering-based methodology was also used to improve prediction. However, incorrectly predicted genes could not be discriminated using this methodology. The incorrect predictions were primarily IgH- and IgK-related genes. To our knowledge, this is the first application of computational deconvolution to complex, parasite-infected whole tissues. Other computational techniques such as neural networks may need to be used to improve prediction.
Keywords: Deconvolution, Bioinformatics, Schistosomiasis, Mouse model, Schistosoma haematobium, Bladder, Gene expression, Microarray
Graphical abstract
1. Introduction
Pathogens induce complex patterns of host gene expression by a multitude of host cellular subsets. This is particularly true for mammalian infection by schistosomes and other helminthes (Gobert et al., 2010; Ray et al., 2012). During schistosomiasis, adult worm pairs reside in the portal or pelvic veins, depending on the species, and lay thousands of eggs daily. These eggs lodge in the liver, intestines or pelvic organs (i.e., bladder), and approximately half are expulsed in the fecal or urinary stream. The remaining eggs are intensely immunogenic and a highly heterogeneous cellular infiltrate forms around them. These infiltrates ultimately develop into fibrotic granulomas, the characteristic lesions of schistosomiasis. Schistosome egg granulomas consist of fibroblasts, eosinophils, T-cells, B-cells, macrophages, epithelioid cells, natural killer (NK) cells, NK T-cells (NKT), neutrophils and other cell types. Some of these cells are present in low numbers, and yet exert out-sized influences on granuloma biology (Iacomini et al., 1995). These cellularly diverse granulomas develop in tight proximity to parenchymal cells of affected organs including hepatocytes, intestinal epithelial cells and urothelial cells. Therefore, it can be challenging to physically dissect individual cells or cellular subsets of interest from infected tissues, which in turn makes it difficult to perform downstream molecular analyses such as cell-specific gene expression microarrays. In addition, whole tissue-based assays reflect the biology of an entire organ of interest and thus biologically important gene expression “signals” may be more likely to be drowned out by the “noise” of less relevant transcribed genes.
A case in point is our decision to perform whole organ-based gene expression microarray analyses rather than dissecting out individual cells or cellular subsets within Schistosoma haematobium egg-injected mouse bladders (Ray et al., 2012). Although these studies revealed egg-induced bladder expression of genes strongly associated with specific cellular subsets (uroplakins and urothelial cells, CD68 and macrophages, B-cell receptor pathway and B lymphocytes), we were unable to estimate the relative number of individual cell types. This made it impossible to quantitatively ascribe expression of many genes to particular cellular subsets.
Traditional microarray techniques do not group gene expression profiles by cell types. Experimental techniques such as laser capture microdissection (LCM) or cell sorting of blood or tissue-derived single cell suspensions can be used upstream of molecular analyses to help assign gene expression to individual cells (Rekhter and Chen, 2001). However, LCM and cell sorter instrumentation is expensive and although the technology is robust, individual applications can require significant protocol optimization. In recent years computational deconvolution has gained in popularity as an in silico alternative given that it does not require any sophisticated equipment. Herein we describe our attempts to apply computational deconvolution to our whole bladder gene expression microarray data. To our knowledge, this is the first application of computational deconvolution of gene expression by individual host cellular subsets from microarray analyses of complex, infected whole tissues.
2. Materials and methods
Microarray data described by Ray et al. (2012) and flow cytometry results outlined by Fu et al. (2012) were used for this deconvolution analysis. The Immunological Genome Project (http://www.immgen.org) was used to select non-immunoglobulin B-cell and T-cell related genes (Heng and Painter, 2008). Immunoglobulin- and urothelial cell-related genes, however, were manually selected for deconvolution analysis. Deconvolution is represented by the following formula:
| (1) |
Where, X is the sample expression, i is the sample (sample 1, sample 2…sample n), j is the gene (1,2..p), k is the cell type (1,2…K), w is the measured cell proportion, and h is the gene expression grouping. In matrix form, wik can be represented as W, Xij can be represented as X, and hkj can be represented as H. We can solve for the coefficient, H, the gene expression of cell type k and gene j, via a standard linear regression (Shen-Orr et al., 2010). In other words, the formula above can also be represented in the following matrix form (Venet et al., 2001)
| (2) |
R was the programming language of choice to solve the least squares equation shown above (Team, 2013). Any value of H that was computed to be negative was set to zero. The microarray data that we used were not normalized. To categorize gene expression as being either B- or T-cell-associated, we solved for H, and to calculate cell proportions of urothelial cells we solved for both W and H.
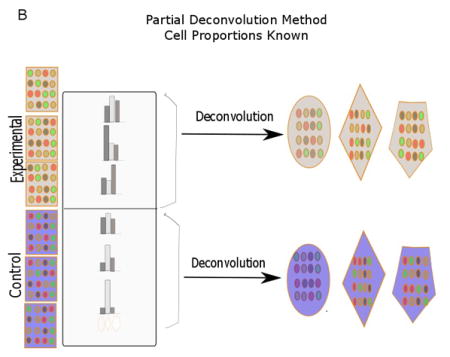
Deconvolution can be broadly divided into partial and complete deconvolution (Fig. 1). In partial deconvolution, we have knowledge of X, and either W or H. In complete deconvolution, we have knowledge of only X, in which case unsupervised techniques such as non-negative matrix factorization need to be used to solve for W and H (Gaujoux and Seoighe, 2013). However, unsupervised methods are not guaranteed to converge to a correct solution that we are looking for. To alleviate this issue, a semi-supervised deconvolution strategy can be employed where we use prior knowledge of certain gene markers to make our prediction (Gaujoux and Seoighe, 2012). In our case, partial deconvolution was used to categorize genes as being B- and T-cell-related, and semi-supervised deconvolution methodology was used to calculate the proportion of urothelial cells. The results for partial deconvolution had two outputs per gene. Based on which of the two values was greater, genes were grouped as either B- or T-cell related. The Modern Applied Statistics with S (MASS) package of R was used to predict the gene types (Venables and Ripley, 2002). The data for X for both partial and semi-supervised deconvolution was simply the microarray data, and signifies fold change.
Fig. 1.
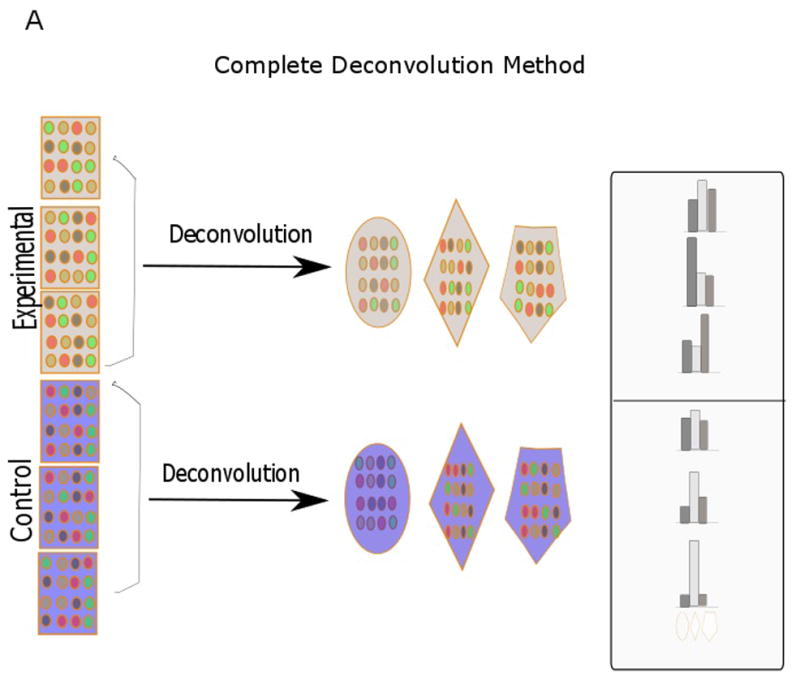
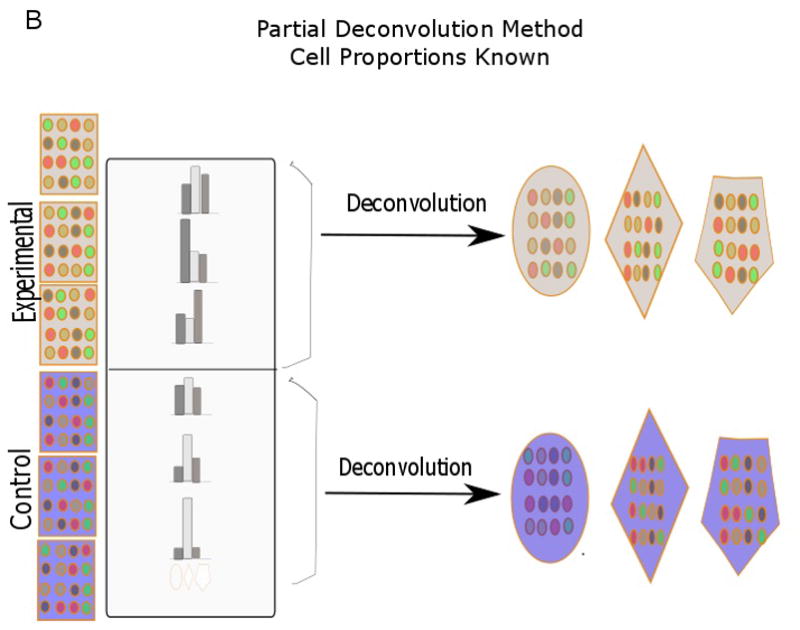
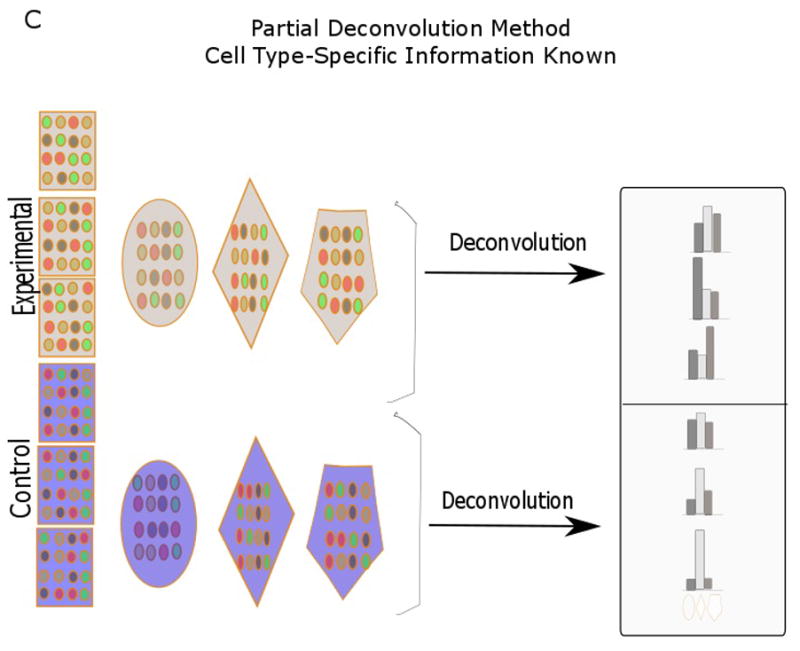
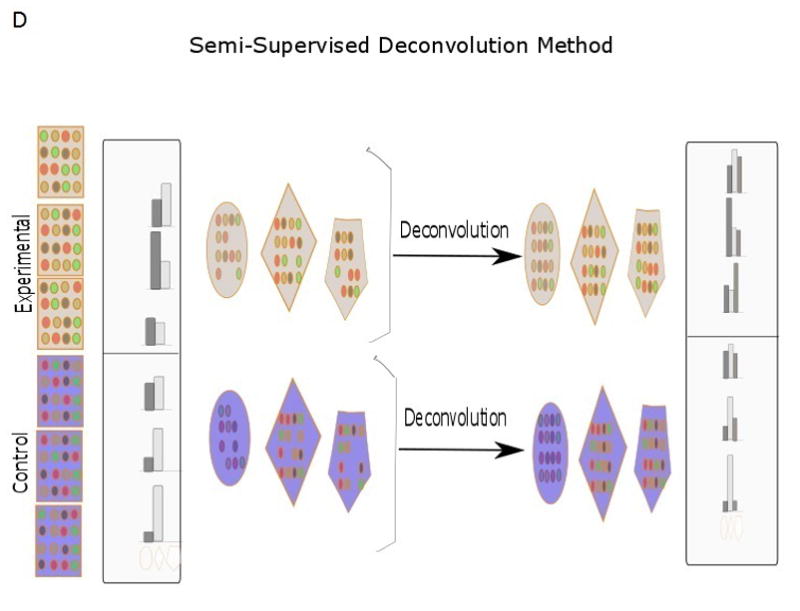
Diagram showing various deconvolution methodologies (adapted from Shen-Orr et al., 2010 and Gaujoux et al., 2013). In partial deconvolution, either cell proportion (B) or cell-specific gene signatures (C) are known together with sample expression profiles. In complete devonvolution, only sample gene expression is known (A). When there is some knowledge of cell proportion and cell-specific gene signatures, a semi-supervised strategy (D) can be used. Each row signifies distinct gene expression profiles, while the different shapes (polygon, hexagon, oval) signify cell types.
In order to calculate cell proportions for urothelial cells, W, X and H were assumed to be known quantities for B-cell and T-cells (in other words, known data from B- and T-cells was used to calculate cell proportions for urothelial cells). W and H were unknown for urothelial cells. The matrix H had three columns with each column representing a cell type. For instance, the B-cell column (50 B-cell related genes) was set to 100 for B-cell related genes and set to zero for T-cell and urothelial-related genes. For the six genes that were urothelial cell-associated, all three rows were randomized, as these genes were assumed to be of unknown cell type. The cell proportions for this third cell type was initialized randomly. Lee-Seung non-negative matrix factorization method was used to calculate cell proportions (Lee and Seung, 2006). X and H were fixed, since these were taken as known quantities. The algorithm was then used to calculate W using the multiplicative update rule (Lee and Seung, 2006). One thousand iterations were enough for convergence. The proportions calculated were always the same values regardless of the random numbers chosen.
3. Results
The list of genes used can be found in Table 1. The predictions for all B and T-cells used in this study, and the comparsions against actual cell type-specific gene expression, can be found in Table 2. Seven immunoglobulin genes were incorrectly predicted. Fig. 2 shows the proportions of B- and T-cells in egg-injected bladders at 5 weeks post-injection. Fig. 3 shows the estimate of urothelial cell proportions at the same time point. Controls clustered in a tight space, whereas the experimental samples were more separated. Finally, Fig. 4 depicts the cluster created using the dendrogram-based method, which again shows that the seven immunoglobulin-related genes were incorrectly predicted.
Table 1.
List of genes used in this study, which are either T-cell, B-cell or urothelial cell related.
| Gene Name | Cell Type |
|---|---|
| CD19 | B-cellsa |
| CD79b | B-cells |
| IGHA_J00475$V00785_Ig_heavy_constant_alpha_135 | B-cells |
| Ighg | B-cells |
| IGHG1_J00453$V00793_Ig_heavy_constant_gamma_1_792 | B-cells |
| IGHV10S3_AF064446_Ig_heavy_variable_10S3_9 | B-cells |
| Igh-V11 | B-cells |
| IGHV12S1_M22439_Ig_heavy_variable_12S1_339 | B-cells |
| IGHV1S113_L33954_Ig_heavy_variable_1S113_110 | B-cells |
| IGHV1S114_L33955_Ig_heavy_variable_1S114_205 | B-cells |
| IGHV1S119_L33961_Ig_heavy_variable_1S119_14 | B-cells |
| IGHV1S120_AF025443_Ig_heavy_variable_1S120_8 | B-cells |
| IGHV1S124_AF025449_Ig_heavy_variable_1S124_11 | B-cells |
| IGHV1S133_AF304553_Ig_heavy_variable_1S133_89 | B-cells |
| IGHV1S135_AF304556_Ig_heavy_variable_1S135_43 | B-cells |
| IGHV1S14_K00707$X00161_Ig_heavy_variable_1S14_164 | B-cells |
| IGHV1S28_X02460_Ig_heavy_variable_1S28_13 | B-cells |
| IGHV1S30_X02462_Ig_heavy_variable_1S30_12 | B-cells |
| IGHV1S34_X02467_Ig_heavy_variable_1S34_71 | B-cells |
| IGHV1S35_M12376_Ig_heavy_variable_1S35_13 | B-cells |
| IGHV1S36_M13788_Ig_heavy_variable_1S36_40 | B-cells |
| IGHV1S41_X06868_Ig_heavy_variable_1S41_72 | B-cells |
| IGHV1S52_M34982_Ig_heavy_variable_1S52_158 | B-cells |
| IGHV1S59_L17134_Ig_heavy_variable_1S59_150 | B-cells |
| IGHV2S1_V00767$J00492_Ig_heavy_variable_2S1_5 | B-cells |
| IGHV5S18_AF290972_Ig_heavy_variable_5S18_125 | B-cells |
| IGHV8S6_U23021_Ig_heavy_variable_8S6_61 | B-cells |
| IGHV8S7_U23022_Ig_heavy_variable_8S7_163 | B-cells |
| IGHV9S5_L14364_Ig_heavy_variable_9S5_82 | B-cells |
| Igh-VJ558 | B-cells |
| Igh-VS107 | B-cells |
| Igj | B-cells |
| IGK-V1 | B-cells |
| IGKV1-88_AJ231206_Ig_kappa_variable_1-88_289 | B-cells |
| IGKV1-99_AJ231207_Ig_kappa_variable_1-99_1 | B-cells |
| IGKV2-137_AJ231263_Ig_kappa_variable_2-137_15 | B-cells |
| IGKV3-2_X16954_Ig_kappa_variable_3-2_18 | B-cells |
| Igk-V33 | B-cells |
| Igk-V38 | B-cells |
| IGKV4-53_AJ231231_Ig_kappa_variable_4-53_12 | B-cells |
| IGKV4-71_AJ231218_Ig_kappa_variable_4-71_20 | B-cells |
| IGKV4-73_AJ231216_Ig_kappa_variable_4-73_18 | B-cells |
| IGKV4-80_AJ231213_Ig_kappa_variable_4-80_91 | B-cells |
| IGKV4-91_AJ231229_Ig_kappa_variable_4-91_29 | B-cells |
| Igk-V5 | B-cells |
| IGKV6-13_J00569_Ig_kappa_variable_6-13_23 | B-cells |
| IGKV8-31_AJ235957_Ig_kappa_variable_8-31_3 | B-cells |
| IGKV9-120_V00804$J00566_Ig_kappa_variable_9-120_12 | B-cells |
| IGKV9-128_AJ231245_Ig_kappa_variable_9-128_15 | B-cells |
| IGLC2_J00595_Ig_lambda_constant_2_14 | B-cells |
| CD27 | T-cells |
| CD6 | T-cells |
| sh2d2a | T-cells |
| Foxp3 | T-cells |
| cd3d | T-cells |
| Zap70 | T-cells |
| Skap1 | T-cells |
| CD3E | T-cells |
| CD3G | T-cells |
| UPK1a | Urothelial Cells |
| UPK2 | Urothelial Cells |
| UPK3A | Urothelial Cells |
| UPK3B | Urothelial Cells |
| JAM4 | Urothelial Cells |
| CLDN23 | Urothelial Cells |
CD19 is also implicated in wound healing.
Table 2.
Gene expression by actual and predicted cell types. A least squares strategy was used to group genes by cell type. All incorrect assignments were B-cell-related and were misidentified as T-cell-related by the algorithm.
| Gene Name | Accuracy of Prediction | Actual Cell Type | Predicted |
|---|---|---|---|
| CD19 | Incorrect | B-cells | T-cells |
| CD79b | Correct | B-cells | B-cells |
| CD3E | Correct | T-cells | T-cells |
| CD3G | Correct | T-cells | T-cells |
| IGHA_J00475$V00785_Ig_heavy_constant_alpha_135 | Correct | B-cells | B-cells |
| Ighg | Correct | B-cells | B-cells |
| IGHG1_J00453$V00793_Ig_heavy_constant_gamma_1_792 | Correct | B-cells | B-cells |
| IGHV10S3_AF064446_Ig_heavy_variable_10S3_9 | Correct | B-cells | B-cells |
| Igh-V11 | Correct | B-cells | B-cells |
| IGHV12S1_M22439_Ig_heavy_variable_12S1_339 | Correct | B-cells | B-cells |
| IGHV1S113_L33954_Ig_heavy_variable_1S113_110 | Correct | B-cells | B-cells |
| IGHV1S114_L33955_Ig_heavy_variable_1S114_205 | Incorrect | B-cells | T-cells |
| IGHV1S119_L33961_Ig_heavy_variable_1S119_14 | Correct | B-cells | B-cells |
| IGHV1S120_AF025443_Ig_heavy_variable_1S120_8 | Correct | B-cells | B-cells |
| IGHV1S124_AF025449_Ig_heavy_variable_1S124_11 | Correct | B-cells | B-cells |
| IGHV1S133_AF304553_Ig_heavy_variable_1S133_89 | Correct | B-cells | B-cells |
| IGHV1S135_AF304556_Ig_heavy_variable_1S135_43 | Correct | B-cells | B-cells |
| IGHV1S14_K00707$X00161_Ig_heavy_variable_1S14_164 | Correct | B-cells | B-cells |
| IGHV1S28_X02460_Ig_heavy_variable_1S28_13 | Correct | B-cells | B-cells |
| IGHV1S30_X02462_Ig_heavy_variable_1S30_12 | Correct | B-cells | B-cells |
| IGHV1S34_X02467_Ig_heavy_variable_1S34_71 | Correct | B-cells | B-cells |
| IGHV1S35_M12376_Ig_heavy_variable_1S35_13 | Correct | B-cells | B-cells |
| IGHV1S36_M13788_Ig_heavy_variable_1S36_40 | Correct | B-cells | B-cells |
| IGHV1S41_X06868_Ig_heavy_variable_1S41_72 | Incorrect | B-cells | T-cells |
| IGHV1S52_M34982_Ig_heavy_variable_1S52_158 | Correct | B-cells | B-cells |
| IGHV1S59_L17134_Ig_heavy_variable_1S59_150 | Correct | B-cells | B-cells |
| IGHV2S1_V00767$J00492_Ig_heavy_variable_2S1_5 | Correct | B-cells | B-cells |
| IGHV5S18_AF290972_Ig_heavy_variable_5S18_125 | Correct | B-cells | B-cells |
| IGHV8S6_U23021_Ig_heavy_variable_8S6_61 | Correct | B-cells | B-cells |
| IGHV8S7_U23022_Ig_heavy_variable_8S7_163 | Correct | B-cells | B-cells |
| IGHV9S5_L14364_Ig_heavy_variable_9S5_82 | Incorrect | B-cells | T-cells |
| Igh-VJ558 | Correct | B-cells | B-cells |
| Igh-VS107 | Incorrect | B-cells | T-cells |
| Igj | Correct | B-cells | B-cells |
| IGK-V1 | Incorrect | B-cells | T-cells |
| IGKV1-88_AJ231206_Ig_kappa_variable_1-88_289 | Correct | B-cells | B-cells |
| IGKV1-99_AJ231207_Ig_kappa_variable_1-99_1 | Incorrect | B-cells | T-cells |
| IGKV2-137_AJ231263_Ig_kappa_variable_2-137_15 | Correct | B-cells | B-cells |
| IGKV3-2_X16954_Ig_kappa_variable_3-2_18 | Correct | B-cells | B-cells |
| Igk-V33 | Correct | B-cells | B-cells |
| Igk-V38 | Correct | B-cells | B-cells |
| IGKV4-53_AJ231231_Ig_kappa_variable_4-53_12 | Correct | B-cells | B-cells |
| IGKV4-71_AJ231218_Ig_kappa_variable_4-71_20 | Correct | B-cells | B-cells |
| IGKV4-73_AJ231216_Ig_kappa_variable_4-73_18 | Correct | B-cells | B-cells |
| IGKV4-80_AJ231213_Ig_kappa_variable_4-80_91 | Correct | B-cells | B-cells |
| IGKV4-91_AJ231229_Ig_kappa_variable_4-91_29 | Correct | B-cells | B-cells |
| Igk-V5 | Correct | B-cells | B-cells |
| IGKV6-13_J00569_Ig_kappa_variable_6-13_23 | Correct | B-cells | B-cells |
| IGKV8-31_AJ235957_Ig_kappa_variable_8-31_3 | Correct | B-cells | B-cells |
| IGKV9-120_V00804$J00566_Ig_kappa_variable_9-120_12 | Correct | B-cells | B-cells |
| IGKV9-128_AJ231245_Ig_kappa_variable_9-128_15 | Correct | B-cells | B-cells |
| IGLC2_J00595_Ig_lambda_constant_2_14 | Correct | B-cells | B-cells |
| CD27 | Correct | T-cells | T-cells |
| CD6 | Correct | T-cells | T-cells |
| sh2d2a | Correct | T-cells | T-cells |
| Foxp3 | Correct | T-cells | T-cells |
| cd3d | Correct | T-cells | T-cells |
| Zap70 | Correct | T-cells | T-cells |
| Skap1 | Correct | T-cells | T-cells |
Fig. 2.
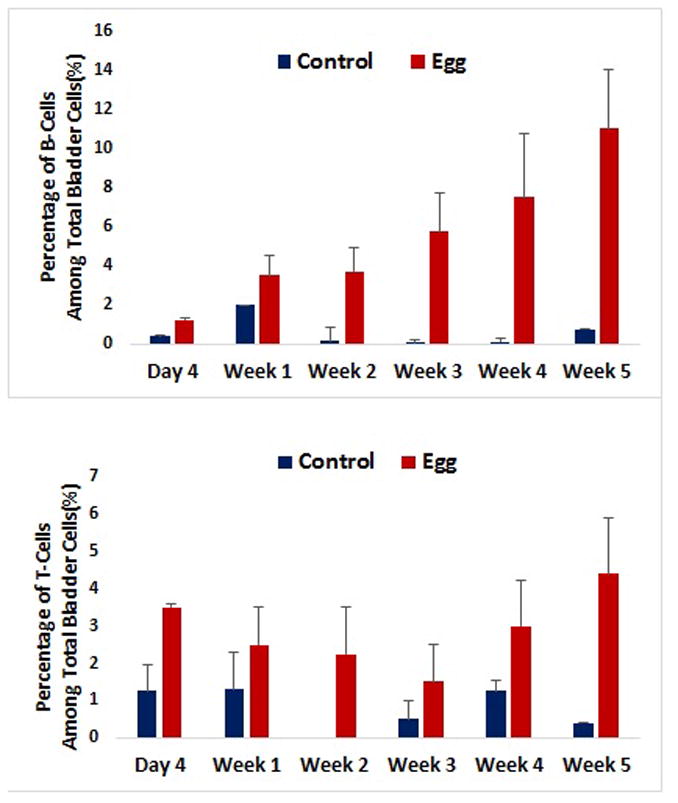
Proportion of B- and T-cells in mouse bladders at various time points following schistosome egg injection. Data derived from previously unpublished flow cytometry data. The sample size was at least three animals in each group.
Fig. 3.
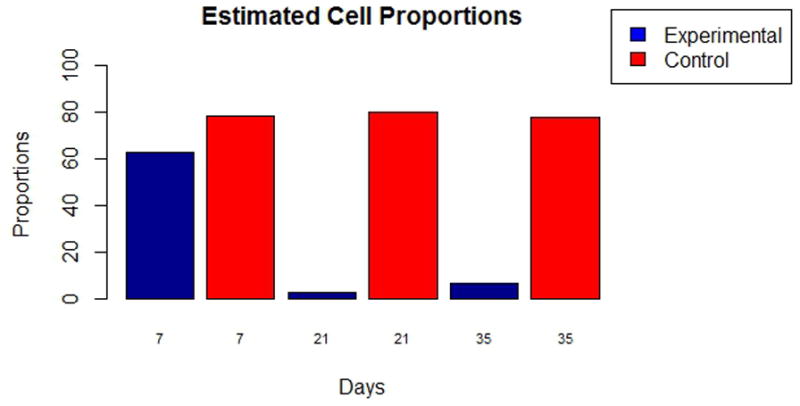
Proportions of urothelial cell as calculated by semi-supervised deconvolution techniques. The control group (ctrl) is clustered in a tight region, whereas samples from the experimental group (exp) show more variation, due to variation in B- and T-cell representation.
Fig. 4.

Dendrogram showing clustering of incorrectly predicted immunoglobulin-related genes in relation to T-cell related genes. The B-cell genes that were incorrectly identified using the least squares strategy could not be differentiated by a dendrogram-based algorithm, since the genes were misassigned to T-cells. The black-coded genes are T-cell-related genes, with the rest being B-cell related genes.
Since seven incorrectly predicted genes were primarily immunoglobulin-related genes, we hypothesize that these errors may have been caused by a low level of immunoglobulin-related expression by non-B-cell related genes. This hypothesis is further buttressed by the fact that neither the clustering method nor the deconvolution method was able to separate out those genes from T-cells.
4. Discussion
We sought to verify that computational deconvolution can distinguish gene expression by individual cellular subsets within complex, parasite-infected host tissues subjected to whole organ transcriptomic analyses. Our test dataset was derived from microarray and flow cytometric findings reported by Ray et al. (2012) and Fu et al. (2012). In Ray et al. (2012) vehicle or S. haematobium egg-injected bladder transcriptomes were characterized at various points post-injection. Using partial computational deconvolution, we were able to categorize genes into those expressed by either B or T-cells. Our study shows that for most genes, computational deconvolution was able to correctly predict their cell types. We were also able to use a cluster-based method to further corroborate the categorization of these genes. We found no discrepancies between the computational deconvolution and the cluster-based methodology. Furthermore, we were also able to estimate the frequency of urothelial cells in the tissue samples using a semi-supervised deconvolution strategy based on urothelial cell microarray expression profiles.
We selected genes related to B-cells and T-cells, using the Immunological Genome Project (IGP; http://www.immgen.org), to ensure that the genes selected were differentially expressed (Heng and Painter, 2008). Immunoglobulin- and urothelial cell-related genes were also used for this study and manually curated by the authors. In total, 65 genes were assayed, out of which 50 were B-cell-, nine were T-cell-, and six were urothelial cell-associated.
The computed urothelial cell proportions showed a relative decrease in frequency of this cell population, likely due to a massive increase in leukocytes associated with granuloma formation. This is interesting in light of our prior work, which demonstrated S. haematobium egg-induced urothelial hyperplasia, which by definition would be associated with an increase in absolute urothelial cell counts (Fu et al., 2012; Ray et al., 2012).
Our approach features notable limitations. Due to the fact that the deconvolution techniques used in this study rely on computational approaches, there were some errors in the predictions. In other words, one would expect computational methods to not be as accurate as empirical methods of experimentation. In our case, for the B-cell and T-cell analysis involving 50 B-cell related genes and nine T-cell related genes, the error rate in prediction was approximately 12% (or seven out of 59 genes). The errors were primarily B-cell–specific, immunoglobulin-related genes predicted by the deconvolution technique to be expressed by T-cells. We speculate that one source for this error may be low level baseline expression of immunoglobulin-related genes by non-B-cells, a possibility that cannot be deconfounded by our algorithm.
Another possible reason for the deconvolution errors may be due to the fact that there were more B-cell related genes (59 in total) in our analysis compared with T-cell related genes (six in total). Due to an over-abundance of B-cell-related versus T-cell-related genes, it is possible that B-cell-related genes were more likely to suffer from a higher false discovery rate.
Since immunoglobulin genes were primarily the genes incorrectly predicted by a least squares-based deconvolution technique, a dendrogram-based methodology was employed to see if the predictions could be improved. As Fig. 4 shows, we saw no improvements using this method, as all seven genes that were incorrectly predicted by the least squares strategy clustered with T-cell related genes. This suggests that these immunoglobulin-related genes probably cannot be discriminated using current known techniques. The clustering algorithm also was unable to effectively separate subgroups of B- and T-cells, and therefore only worked at the broader level to distinguish between B- and T-cells. Finally, it should be noted that the immunoglobulin-related genes were not selected using the IGP, whereas genes associated with other leukocyte subsets were based on IGP. Thus, some of the immunoglobulin genes selected may not have been as carefully curated as those derived from the IGP. The deconvolution techniques used in this study require a carefully curated dataset of genes in order to ensure accuracy in prediction. In short, deconvolution is unable to successfully predict gene expression perfectly in every scenario.
The cell proportions used for deconvolution were obtained using flow cytometry, which could be biased if there was any disproportionate loss of particular cellular subsets during the digestion and flow process.
A source for incorrect predictions based on microarray data (such as our dataset) may be cross-hybridization (Shen-Orr et al., 2010). For example, when a microarray probe binds with a sequence that is not actually a complementary sequence, the resultant output will be incorrect, as the probe would not bind with the correct sequence.
Although we uncovered many potential issues with deconvolution applied to parasite-infected host tissue gene expression profiles, we believe these techniques may still prove useful in studies of host-parasite interactions. Since our dataset is derived from host tissues intimately admixed with infiltrating leukocytes and parasite eggs, individual cells within the granulomas are difficult to separate for downstream analyses, making deconvolution an ideal alternative to experimental manipulation. We were able to demonstrate that computational deconvolution was able to accurately categorize non-immunoglobulin genes into those broadly expressed by B- or T-cells. Future refinements may enable deconvolution strategies to separate T- and B-cells into subsets. Application of various machine learning techniques, i.e., neural networks or genetic algorithms, may enhance prediction accuracy. Clearly, new tools need to be developed for deconvolution strategies to be consistently effective for large gene expression datasets, including those gleaned from parasite-infected host tissues.
Highlights.
Analyses of whole, parasite-infected organs give a broad view of the host transcriptome
This approach has limited ability to assign gene expression to specific cells
Computational deconvolution may overcome this limitation of whole organ analysis
We show proof of principle using schistosomiasis-infected bladder microarray data
Errors indicate further refinements are needed to study host-parasite interactions
Acknowledgments
We would like to thank the National Institute of Allergy and Infectious Diseases (NIAID) Schistosomiasis Resource Center of the Biomedical Research Institute (Rockville, MD, USA) (NIH-NIAID Contract HHSN272201000005I) and BEI Resources, USA for providing and shipping schistosome reagents, respectively. We would also like to acknowledge National Institutes of Health (NIH), USA, R56 AI119168 as our funding source.
Footnotes
Publisher's Disclaimer: This is a PDF file of an unedited manuscript that has been accepted for publication. As a service to our customers we are providing this early version of the manuscript. The manuscript will undergo copyediting, typesetting, and review of the resulting proof before it is published in its final citable form. Please note that during the production process errors may be discovered which could affect the content, and all legal disclaimers that apply to the journal pertain.
References
- Fu CL, Odegaard JI, Herbert DR, Hsieh MH. A Novel Mouse Model of Schistosoma haematobium Egg-Induced Immunopathology. PLoS Pathog. 2012;8:e1002605. doi: 10.1371/journal.ppat.1002605. [DOI] [PMC free article] [PubMed] [Google Scholar]
- Gaujoux R, Seoighe C. CellMix: a comprehensive toolbox for gene expression deconvolution. Bioinformatics. 2013;29:2211–2212. doi: 10.1093/bioinformatics/btt351. [DOI] [PubMed] [Google Scholar]
- Gaujoux R, Seoighe C. Semi-supervised Nonnegative Matrix Factorization for gene expression deconvolution: A case study. Infect Genet Evol. 2012;12:913–921. doi: 10.1016/j.meegid.2011.08.014. [DOI] [PubMed] [Google Scholar]
- Gobert GN, Tran MH, Moertel L, Mulvenna J, Jones MK, McManus DP, Loukas A. Transcriptional changes in Schistosoma mansoni during early schistosomula development and in the presence of erythrocytes. PLoS Negl Trop Dis. 2010;4:e600. doi: 10.1371/journal.pntd.0000600. [DOI] [PMC free article] [PubMed] [Google Scholar]
- Heng TSP, Painter MW. The Immunological Genome Project: networks of gene expression in immune cells. Nat Immunol. 2008;9:1091–1094. doi: 10.1038/ni1008-1091. [DOI] [PubMed] [Google Scholar]
- Iacomini J, Ricklan DE, Stadecker MJ. T cells expressing the gamma delta T cell receptor are not required for egg granuloma formation in schistosomiasis. Eur J Immunol. 1995;25:884–888. doi: 10.1002/eji.1830250404. [DOI] [PubMed] [Google Scholar]
- Lee DD, Seung HS. Algorithms for Non-negative Matrix Factorization. Lect Notes Comput Sci. 2006;4029:548–562. doi: 10.1007/11785231_58. [DOI] [Google Scholar]
- Ray D, Nelson TA, Fu C-L, Patel S, Gong DN, Odegaard JI, Hsieh MH. Transcriptional profiling of the bladder in urogenital schistosomiasis reveals pathways of inflammatory fibrosis and urothelial compromise. PLoS Negl Trop Dis. 2012;6:e1912. doi: 10.1371/journal.pntd.0001912. [DOI] [PMC free article] [PubMed] [Google Scholar]
- Rekhter MD, Chen J. Molecular analysis of complex tissues is facilitated by laser capture microdissection: critical role of upstream tissue processing. Cell Biochem Biophys. 2001;35:103–113. doi: 10.1385/CBB:35:1:103. [DOI] [PubMed] [Google Scholar]
- Shen-Orr SS, Tibshirani R, Khatri P, Bodian DL, Staedtler F, Perry NM, Hastie T, Sarwal MM, Davis MM, Butte AJ. Cell type-specific gene expression differences in complex tissues. Nat Methods. 2010;7:287–289. doi: 10.1038/nmeth.1439. [DOI] [PMC free article] [PubMed] [Google Scholar]
- Team R; R Development Core Team. R A Lang Environ Stat Comput. 2013;55:275–286. [Google Scholar]
- Venables WN, Ripley BD. Modern Applied Statistics with S. Issues of Accuracy and Scale. 2002:868. doi: 10.1198/tech.2003.s33. [DOI] [Google Scholar]
- Venet D, Pecasse F, Maenhaut C, Bersini H. Separation of samples into their constituents using gene expression data. Bioinformatics. 2001;17(Suppl 1):S279–S287. doi: 10.1093/bioinformatics/17.Suppl_1.S279. [DOI] [PubMed] [Google Scholar]