

Abstract
Energy-producing pathways are novel therapeutic targets for the treatment of neurodevelopmental disorders. Here, we focussed on correcting metabolic defects in a catastrophic paediatric epilepsy, Dravet syndrome which is caused by mutations in sodium channel NaV1.1 gene, SCN1A. We utilized a translatable zebrafish model of Dravet syndrome (scn1lab) which exhibits key characteristics of patients with Dravet syndrome and shows metabolic deficits accompanied by down-regulation of gluconeogenesis genes, pck1 and pck2. Using a metabolism-based small library screen, we identified compounds that increased gluconeogenesis via up-regulation of pck1 gene expression in scn1lab larvae. Treatment with PK11195, a pck1 activator and a translocator protein ligand, normalized dys-regulated glucose levels, metabolic deficits, translocator protein expression and significantly decreased electrographic seizures in mutant larvae. Inhibition of pck1 in wild-type larvae mimicked metabolic and behaviour defects observed in scn1lab mutants. Together, this suggests that correcting dys-regulated metabolic pathways can be therapeutic in neurodevelopmental disorders such as Dravet syndrome arising from ion channel dysfunction.
Keywords: epilepsy, gluconeogenesis, metabolism, mitochondria, zebrafish
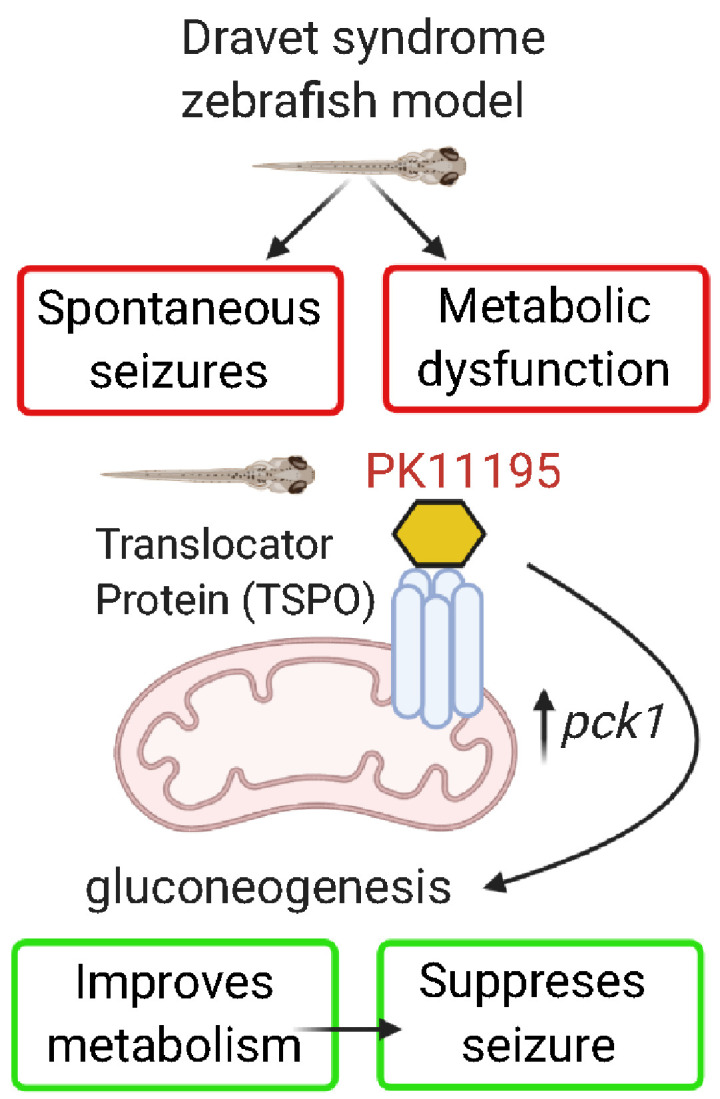
Banerji et al. identified a gluconeogenesis modulator, PK11195, a known mitochondrial translocator protein ligand that normalized metabolic deficits and suppressed electrographic seizures in a pre-clinical zebrafish model of Dravet syndrome. This suggests a novel metabolism-based therapeutic avenue to treat catastrophic paediatric epilepsies such as Dravet syndrome arising from ion channel mutations.
Graphical Abstract
Graphical Abstract.
Introduction
Epilepsy, regardless of its aetiology, is a heterogeneous group of disorders arising from altered ionic or synaptic transmission. It is a common neurological condition with a complex spectrum of disorders widely accepted as a disease of network excitability (England et al., 2012; Pearson-Smith and Patel, 2017; Patel, 2018). While metabolic and bioenergetic alterations have been reported in acquired epilepsy syndromes, their role has remained secondary rather than central (Patel, 2018). In contrast, the role of metabolism has not been systematically investigated in genetic forms of epilepsy representing a major gap in our understanding of these catastrophic diseases. The vast majority of these genetic disorders arise from mutations in ion channels, signalling molecules or receptors (Porter et al., 2012). Therefore, metabolism-based approaches to treat these disorders are a novel and promising alternative strategy. Dravet syndrome is a prototypical severe genetic form of epilepsy primarily affecting the paediatric population (Dravet, 2011). It is most commonly associated with de novo gene mutations in a voltage-gated sodium channel NaV1.1 gene, SCN1A (Depienne et al., 2009; Catterall, 2010; Escayg and Goldin, 2010; Dravet and Oguni, 2013). Children affected with SCN1A loss-of-function mutations experience frequent prolonged spontaneous seizures, developmental delays, cognitive and behavioural deficits as well as increased risk of Sudden Unexpected Death in Epilepsy (Dravet, 2011; Li et al., 2011; Skluzacek et al., 2011; Dravet and Oguni, 2013; Kearney, 2013; Cooper et al., 2016).
Glucose is the primary fuel required by the brain, the most metabolically demanding organ in the human body (Costantini et al., 2008). Hypometabolism refers to a condition of decreased brain glucose consumption and has been reported in both acquired and genetic human epilepsies including Dravet syndrome (Ferrie et al., 1996; Korinthenberg et al., 2004; Benedek et al., 2006; Craig et al., 2012). Interestingly, a metabolic signature of glucose hypermetabolism and hypometabolism has been reported during ictal and inter-ictal periods of seizure activity, respectively (Theodore, 1999; Guo et al., 2009; Kumar et al., 2012; Shultz et al., 2014; Patel, 2018). Although temporal hypometabolism has been reported in most patients with intractable temporal lobe epilepsy, the concept of glucose hypometabolism is more prevalent in chronic epilepsies (Guo et al., 2009; Matheja et al., 2001; Zilberter and Zilberter, 2017). Hypometabolism associated with seizures may reflect glucose transport abnormalities or defects in mitochondrial oxidative phosphorylation enzymes (Tenney et al., 2014). Interestingly, clinical efficacy of ketogenic diets (KD) in Dravet syndrome patients suggests a critical role for energy metabolism, particularly its ability to enhance mitochondrial fatty acid utilization and glucose-sparing in genetic epilepsies. KD treatment is very effective as the diet provides alternative fuels for mitochondria and can reduce seizures by up to 90% in some patients with Dravet syndrome (Kinsman et al., 1992; Kang et al., 2005; Kossoff et al., 2009; Nabbout et al., 2011; Veggiotti et al., 2011; Laux and Blackford, 2013; Gano et al., 2014; Dressler et al., 2015). Mitochondrial dysfunction can underlie hypometabolism concomitant with alterations in glucose metabolism, suggesting a co-ordinated response to an epilepsy-causing genetic mutation. Consistent with this, patients with Dravet syndrome muscle biopsies exhibit mitochondrial defects (Doccini et al., 2015).
Using a larval zebrafish model of Dravet syndrome (scn1lab), we previously reported hypometabolism in the form of decreased glycolysis and mitochondrial oxygen consumption as a prominent characteristic of the mutants (Kumar et al., 2016). The use of larval zebrafish has emerged as a promising whole-animal vertebrate model system due to its high degree of genetic homology to humans, small size, high reproducibility, rapid developmental rate and cost-effectiveness (Malicki, 2000; Chen and Ekker, 2004; Howe et al., 2013). Additionally, their capacity to be used in multi-well assays with microliter amounts of media and rapid diffusion of media-dissolved drugs through the skin have made them quite popular for rapid high-throughput in vivo drug screening assays (Zon and Peterson, 2005; Rubinstein, 2006; Schlegel and Stainier, 2007; Hortopan et al., 2010; Delvecchio et al., 2011; Lessman, 2011; Rinkwitz et al., 2011; Griffin et al., 2017). The scn1lab mutant, a pre-clinical animal model originally identified in a chemical mutagenesis screen, recapitulates many aspects of the Dravet syndrome disease condition such as spontaneous unprovoked seizures, pharmaco-resistance, sleep disturbance, oculomotor deficit and early death (Schoonheim et al., 2010; Baraban et al., 2013; Hong et al., 2016; Grone et al., 2017). Demonstrating the true translational value of this model, two different serotonin receptor agonists (lorcaserin, Belviq© and trazodone, Desyrel©) identified in scn1lab mutant seizure screens have shown clinical efficacy in small compassionate-use trials with an additional identified serotonin agonist (clemizole) currently in Phase II clinical trials and a serotonin re-uptake inhibitor (fenfluramine, Fintepla©) recently approved by the Federal Drug Administration for clinical treatment of Dravet syndrome (Dinday and Baraban, 2015; Sourbron et al., 2016, 2017; Devinsky et al., 2017, 2018; Griffin et al., 2017; Kauppila et al., 2018; Tolete et al., 2018) (https://clinicaltrials.gov/ct2/show/NCT04462770?term=clemizole&draw=2&rank=3). Using a novel methodology to assess real-time bioenergetics, we previously reported significantly lower baseline glycolytic rates and mitochondrial respiration in scn1lab mutants compared to the wild-type controls (Kumar et al., 2016). Remarkably, KD treatment effectively rescued altered metabolism to control levels resulting in attenuation of seizure activity in mutants (Baraban et al., 2013; Kumar et al., 2016). Thus, two lines of evidence validate the scn1lab mutant zebrafish model to study metabolic defects in human epilepsies. First, zebrafish and mammals regulate glucose similarly since the key gluco-regulatory mechanism is evolutionarily conserved among them (Elo et al., 2007; Eames et al., 2010). Second, glucose hypometabolism occurs in the brain of patients with Dravet syndrome with SCN1A mutations and zebrafish scn1lab mutants (Ferrie et al., 1996; Korinthenberg et al., 2004; Benedek et al., 2006; Guerrini et al., 2011; Sundaram et al., 2013; Kumar et al., 2016, 2018).
Interestingly, metabolic deficits in larval scn1lab mutants are accompanied by down-regulation of phosphoenolpyruvate carboxykinase (PEPCK)-encoded genes pck1 and pck2 (Kumar et al., 2016). PEPCK, encoding gluconeogenic genes pck1 (PEPCK-C, cytosolic) and pck2 (PEPCK-M, mitochondrial), plays a vital role in metabolism as the enzyme has been almost exclusively linked to gluconeogenesis (Yang et al., 2009). Deficiency in pck gene has been linked to a rare, autosomal recessive disorder associated with metabolic defects, muscle wasting and seizures, suggesting a critical role for pck/PEPCK in metabolic function and seizure control (Van Den Berghe, 1996). PEPCK is the primary enzyme that provides glucose during development and post-natal life (Jurczyk et al., 2011). In larval zebrafish, the pck gene is used as a surrogate marker for glucose and a way to measure glucose in the whole organism (Elo et al., 2007; Gut et al., 2013). The rationale for our focus on PEPCK is 2-fold. First, it has been established that PEPCK is the primary source of glucose during development. Second, there are reports, suggesting that several drug classes (serotonergic compounds, corticosteroids, branched chain amino acids and KD) increase PEPCK flux via pck up-regulation (Elo et al., 2007; Caraballo, 2011; Jurczyk et al., 2011; Gut et al., 2013; Kumar et al., 2016). Both patients with Dravet syndrome and scn1lab mutant fish benefit from serotonergic compounds or KD, suggesting their metabolic actions may be mediated by a common pathway via PEPCK (Caraballo, 2011; Kumar et al., 2016). Since both scn1lab mutants and patients with Dravet syndrome show hypometabolism, improvement of PEPCK activity or expression could ‘normalize’ metabolic deficits in scn1lab zebrafish to achieve the normal range of glycolysis and consequent substrate flux into mitochondrial energy production. We thus hypothesize that impaired glucose regulation may be a primary cause of metabolic defects and seizure behaviour in Dravet syndrome.
In this study, we asked if normalization of glucose levels via pck up-regulation in scn1lab mutant larvae improved phenotypic defects. We performed a metabolism-based small library screen with commercially available compounds that increased gluconeogenesis via up-regulation of pck gene expression (or PEPCK flux). The targeted screen identified compounds which up-regulate the expression of pck1, but not pck2 more than 2-fold in scn1lab mutant larvae. The major finding in this study is that up-regulation of pck1 by a translocator protein (TSPO) ligand PK11195 reversed metabolic deficits and electrographic seizures in the scn1lab mutants.
Materials and methods
Statement on the ethical treatment of animals
The study was carried out in strict accordance with the recommendations in the Guide for the Care and Use of Laboratory Animals of the National Institutes of Health (NIH). All procedures were approved by the Institute Animal Care and Use Committee (IACUC) of the University of Colorado Denver (UCD), which is fully accredited by the American Association for the Accreditation of Laboratory Animal Care. All experiments were designed to minimize pain and discomfort and conform to NIH regulatory standards of care.
Zebrafish housing and husbandry
Zebrafish (Danio rerio) were maintained in the Animal Core Facility located at UCD according to standard procedures (Westerfield, 1993). Zebrafish were housed in a temperature-controlled facility under the standard light/dark (14:10 h) cycle. The temperature was tightly regulated and varied from 27 to 29°C (Westerfield, 1995). Water quality was monitored automatically and dosed to maintain conductivity (1000–1050 μs) and pH (6.95–7.30). The filtration system consisted of a bead filter, fluidized bed biofilter, finishing filters (bag filters) and UV sterilization. Zebrafish embryos were raised at 28.5°C in embryo medium consisting of 0.03% Instant Ocean (Aquarium Systems, Inc., Mentor, OH, USA) in deionized water containing 0.2 ppm methylene blue as a fungicide (Kumar et al., 2016). Larvae were maintained in round Petri dishes (depth, 20 mm) in an incubator with a similar light–dark cycle. The housing density was limited to ∼50 larvae per dish. Adult zebrafish were housed in 1.5‐l tanks with stock density of 5–10 fish/tank and fed twice daily with adult commercial zebrafish diet (Gemma, 300).
Zebrafish lines
The zebrafish strains used in this study were Tüpfel long fin and homozygous mutants scn1lab−/− (didys552) maintained on a Tüpfel long fin strain background (Baraban et al., 2013). The scn1lab−/− larvae were obtained by crossing adult scn1lab+/− zebrafish and were sorted by their unique dark pigmentation. All experiments were performed with 5- to 6-days post-fertilization (dpf) larvae which were randomly selected as sex determination was not possible at the early stages (Griffin et al., 2017). One limitation of the scn1lab mutant larvae that restricts long-term studies is that they have a shorter life span and they die prematurely between 10 and 12 dpf (Novak et al., 2006; Baraban et al., 2013).
Drug dilutions
All drugs were purchased from Sigma-Aldrich and reconstituted in dimethylsulphoxide (DMSO) at a final concentration of 20 mM and stored at −20°C. On the day of assay, stock solutions were diluted with embryo media and pH adjusted to 7–7.5 to prepare the working concentration. Final DMSO concentration for all drug dilutions was ∼1%. All drug solutions were coded and a second investigator blinded to the drug identity performed the assays. The drug-treated larvae were monitored for good health and toxicity. Every larva was checked under the microscope to rule out the possibility of poor health based on two criteria; a visible beating heart and movement in response to touch or external stimulus. To ensure drug specificity, we ran drug-treated larvae with controls in the same plate with larvae from the same clutch. To address toxicity, a dose response for each compound was performed on wild-type fish before starting any experiment. A maximum tolerated dose was established for the drugs based on the above-mentioned criteria. Drugs were considered lethal or toxic if no visible heartbeat or movement in response to touch (external stimulus) was detected in at least 50% of the test fish after a 90-min exposure to drug (Baraban et al., 2013; Griffin et al., 2017).
Gene expression studies
For qPCR, ∼10–12 scn1lab mutant larvae (6 dpf) treated with drugs (or DMSO as vehicle) were pooled and homogenized in TRIzol Reagent (Invitrogen). Total RNA was isolated using RNeasy spin columns (Qiagen) and quantified with a Nanodrop-1000 spectrophotometer (Thermo Scientific). The isolated RNA was used to synthesize cDNA using the High-Capacity cDNA Reverse Transcription Kit (Applied Biosystems). Universal PCR Master Mix and custom zebrafish-specific TaqMan probes-acta1, pck1, pck2, gck and Tspo (Applied Biosystem) were used for running the real-time PCR using a 7500 ABI Real-Time PCR System (Applied Biosystem). Relative gene expression was determined using the ΔΔCt comparative method to calculate fold change (RQ). The experimental unit for the qPCR experiments was as follows: For pck1 and pck2, n = 4 (vehicle, PK11195, AC-5216, Ro5-4864 and stiripentol); n = 3 (remaining drugs), gck (n = 3) and Tspo (n = 3).
Swim behaviour monitoring
For tracking zebrafish larvae swim behavior, we followed an acute locomotion assay protocol using DanioVision system running EthoVision XT software (Noldus Information Technology, Leesburg, VA, USA) as established previously (Baraban et al., 2013; Dinday and Baraban, 2015; Griffin et al., 2017, 2018, 2020). Briefly, 5–6 dpf scn1lab mutant larvae were placed individually in 96-well plates with embryo media in each well. The larvae were first acclimatized by placing them in the DanioVision chamber under dark light for a 20-min period followed by a 10-min baseline recording epoch. After obtaining baseline measurements, the embryo media was replaced with 75-μl test drugs (at specific concentrations) or 1% DMSO (vehicle) in control wells and incubated for a period of 3-h. The treatment period was followed by a 10-min experimental recording epoch. Criteria for a positive hit with the threshold set at ≥40% mean velocity based on the previous standard deviations was followed as established by Baraban et al. (2005). The experimental unit for this assay was n = 36 of scn1lab mutants for each drug treatment. Two independent locomotion screens (screen1 and screen 2) were performed in two facilities; University of Colorado, Denver (UCD) and University of California, San Francisco (UCSF), respectively. Coded drugs were used for screening and the analysis was performed by investigators blinded to the compounds. The 3-mercaptopicolinic acid (3-MPA) studies were performed at UCD with n = 24 for the wild-type control group and drug-treated group.
Metabolic measurements
Baseline glycolysis and mitochondrial respiration rates (ECAR, Extracellular Acidification Rate and OCR, Oxygen Consumption Rate, respectively) were simultaneously measured in live 6 dpf scn1lab mutant larvae with Seahorse XF24 Extracellular Flux Analyzer (Agilent) as described previously (Stackley et al., 2011; Kumar et al., 2016). In brief, 6-dpf scn1lab larvae were exposed to drug treatment (10 μM) or control DMSO (1%) using a 3-h exposure protocol. Drug/DMSO-treated larvae were individually loaded per well of a 24-well islet plate with a mesh screen placed on top to hold the fish in place as described in Kumar et al. (2016) and Stackley et al. (2011). For testing mitochondrial function, the XF Cell Mito Stress Test (Seahorse Bioscience, Agilent) was used as per manufacture’s guidance. Three inhibitors, oligomycin, trifluoromethoxy carbonylcyanide phenylhydrazone (FCCP) and Sodium Azide, were used which target the functions of ATP synthase, mitochondrial uncoupling and complex I/III, respectively. All drugs were prepared by following the manufacturer’s recommendations and were dissolved in embryo water. The inhibitors were loaded into XF Extracellular Flux assay plates (Agilent). Titrations were performed to determine the optimal concentration of each inhibitor. Proton leak, ATP-linked respiration and spare respiratory capacity were calculated by the XF Cell Mito Stress Test Report Generator (Agilent). The experimental unit for these assays are n = 10 for both baseline ECAR and OCR; n = 20 for XF Cell Mito Stress Test.
Glucose measurements
For measuring absolute glucose levels, lysates were prepared by pooling exactly 20 zebrafish larvae with/without drug treatment and briefly sonicated (on ice) in 160 μl ice-cold phosphate-buffered saline. The volume of phosphate-buffered saline was equivalent to 8μl per larva. Samples were centrifuged for 10 min at 12 000 rpm and the glucose was quantified using an Amplex Red Glucose/Glucose Oxidase Assay kit (Invitrogen). The reaction was assembled and glucose standard curves were generated for every plate as per the manufacturer’s guidance. For our experiment, 50 μl of sample buffer composed of 8 μl of sample lysate and 42 μl of assay buffer (supplied with the kit) was used, and fluorescence (excitation 535 nm; emission, 590 nm) was detected using a plate reader (BioTek Synergy 4). As per manufacturer’s instructions, the fluorescence values were corrected by subtracting measurements from control reactions without sample. Standard curves were generated and the absolute glucose values were interpolated. The absolute glucose values were normalized with the protein content which was measured by a standard Bradford assay using Coomassie Protein Assay Kit (Pierce). For drug treatment assay n = 11 for vehicle and PK11195; n = 6 for rest of the drugs. For 3-MPA studies, n = 5 for the wild-type control group and drug-treated group. For all experiments, samples were measured in triplicates and each experiment repeated a minimum of three times.
Electrophysiology
Freely behaving 6-dpf scn1lab larvae were exposed to PK11195 drug treatment (10 μM) or control embryo media using a 3-h exposure protocol. The coded larvae were randomly selected by a second investigator blinded to the drug exposure group, paralysed with pancuronium (300 μM) and immobilized in 2% low-melting agarose. Local field potential (LFP) recordings were obtained from forebrain structures using a single-electrode recording at room temperature as described previously (Baraban et al., 2005, 2013; Griffin et al., 2017, 2020). Briefly, a single LFP glass microelectrode was placed, under visual guidance, in optic tectum and 10-min recording epochs were obtained using Axoclamp software (Molecular Devices; Sunnyvale, CA) at an acquisition rate of 1 kHz. Electrophysiological recordings were analysed post hoc using Clampfit software (Molecular Devices). Burst frequency was determined by counting the number of epileptiform events per minute during a 10-min recording epoch. Burst duration was determined by measuring the onset-to-offset interval for all events during the same epoch. At the end of the recordings, larvae were gently freed from agarose and returned to a Petri dish containing embryo media. All experiments were performed in the UCSF facility on at least three independent clutches of scn1lab zebrafish larvae (n = 16 for both control- and drug-treated groups).
Statistical analyses
Statistical analyses were performed with Graphpad Prism 7.0 for Windows. All data were represented as mean ± SEM unless stated otherwise. Statistical analyses included Student’s two-tailed unpaired t-test followed by Welch’s correction and ANOVA followed by Dunnett’s Multiple comparison tests. For all experiments, significance was taken as *P < 0.05, **P < 0.01, ***P < 0.001 and ****P < 0.0001 unless otherwise stated.
Data availability
The data that support the findings of this study are available from the corresponding author, upon reasonable request.
Results
The scn1lab mutants have impaired mitochondrial bioenergetics and are hypoglycaemic
We previously reported metabolic deficits in scn1lab and stxbp1b mutant zebrafish lines (Grone et al., 2016; Kumar et al., 2016). Both basal ECAR (a measure of glycolytic rate) and OCR (a measure of mitochondrial respiration) were significantly lower in mutants. To validate and further characterize oxidative metabolic defects in scn1lab mutants, we performed a Mitochondrial Stress Test on 6-dpf wild-type (n = 20) and scn1lab mutant larvae (n = 20) using the Seahorse XF Flux Analyzer (Stackley et al., 2011; Gibert et al., 2013; Kumar et al., 2016; Ibhazehiebo et al., 2018). The stress test is designed to test bioenergetic function of mitochondria by measuring various key parameters such as basal respiration, maximal respiration, proton leak, spare respiratory capacity and non-mitochondrial respiration after injections of inhibitors and an uncoupler. As shown in the schematic representation of the assay (Fig. 1A), these injections are typically oligomycin—an inhibitor of ATP synthase (complex V), followed by FCCP—an uncoupling agent and finally a combination of rotenone/antimycin A—complex I and III inhibitors, respectively. Maximal respiration and proton leak are calculated after the addition of FCCP and oligomycin, respectively. Spare respiratory capacity is calculated based on the difference between the basal respiration and the maximal respiration. Figure 1B represents an individual run with the pharmacological inhibitors to measure the bioenergetic profile of scn1lab mutants and wild-type control larvae. Here, we used sodium azide; an inhibitor of cytochrome c oxidase (complex IV) and the ATP synthase (complex V) instead of antimycin A/rotenone as it proved to be a better non-toxic choice for the larvae. Figure 1B clearly shows that the OCR is lower in mutants compared to the wild-type controls. Interestingly, we observed deficits in three key parameters of mitochondrial function in scn1lab mutants: (i) maximal respiration, (ii) spare respiratory capacity and (iii) proton leak (Fig. 1C).
Figure 1.

The scn1lab mutants have impaired mitochondrial bioenergetics and are hypoglycemic. (A) A schematic representation of a complete metabolic profile of mitochondrial respiration for measuring different mitochondrial indices using the XF Seahorse Mito Stress Test. Agilent Technologies, Inc.© 2020, adapted and reproduced with permission, courtesy of Agilent Technologies, Inc. Figure created with BioRender.com. (B) The Seahorse Bioanalyzer was used to measure OCR in 6-dpf scn1lab and wild-type larvae by sequentially adding oligomycin, FCCP and sodium azide (instead of antimycin A/rotenone). A representative OCR profile plot from a single run represents decreased OCR in scn1lab mutant compared to wild-type group. (C) Bar graphs represent mitochondrial metabolic parameters. There is a significant decrease in maximal respiration, proton leak and spare respiratory capacity in scn1lab mutants compared to the wild-type larvae. There is no significant difference in non-mitochondrial consumption rate. Data are presented as mean ± SEM and are normalized to the control group (wild type). Statistics performed by unpaired-t test with Welch’s correction. Asterisks (*) indicate a significance of difference between the two groups at *P < 0.05, **P < 0.01 and ***P < 0.001 and ****P < 0.0001; the data points represent each larva, n = 20 for each group. (D) Representative bar graph depicting glucose levels in 6-dpf scn1lab and wild-type larvae. There is a significant decrease in glucose levels in the scn1lab mutants compared to the wild-type larvae. Data are presented as mean ± SEM and are normalized to the control group (wild type). (E) Representative bar graph depicting total protein levels in 6-dpf scn1lab and wild-type larvae. No significant difference is observed in the total protein levels between the two groups. Data are presented as mean ± SEM. For (D) and (E), statistics were performed by unpaired-t test with Welch’s correction. Asterisks (*) indicate a significance of difference between the two groups at **P < 0.01. n = 8, where each sample represents 20 pooled larva. In all panels, WT refers to wild-type larvae.
To further investigate hypometabolic characteristics of larval scn1lab mutants, we measured absolute glucose levels. Since pck levels are important for larval glucose regulation (Elo et al., 2007), we assayed glucose levels in whole scn1lab mutants (n = 8) and wild-type sibling controls (n = 8). We observed significantly lower glucose levels in scn1lab mutants compared to wild type (Fig. 1D). No significant differences were observed in total protein concentrations between scn1lab mutants (n = 8) and wild-type (n = 8) (Fig. 1D). Taken together, our results indicate that scn1lab mutants have defective mitochondrial respiration and are hypoglycaemic, suggesting an overall decrease in both major energy-producing pathways.
Reduction in convulsive seizure-like swim behaviour with validated pck1 activators
Metabolic defects in scn1lab zebrafish larvae are accompanied by decreased expression levels of key gluconeogenic genes pck1 and pck2 which encode PEPCK-C and PEPCK-M in the cytosol and mitochondria, respectively (Kumar et al., 2016). Larval zebrafish share close similarities with mammals in regulating glucose metabolism and PEPCK has been identified as a biomarker of glucose levels. The strategy to up-regulate gluconeogenesis by increased expression of pck1/2 or increased PEPCK flux provides an alternate pathway (i.e. independent of glycolysis) to improve metabolism. Previous reports suggest that several drug classes such as serotonin, steroids, branched chain amino acids and KD increase PEPCK flux via pck up-regulation (Caraballo, 2011; Gut et al., 2013; Kumar et al., 2016). To determine if pharmacological manipulation of pck1/2 is therapeutic in scn1lab mutants, we first selected a small group of commercially available known pck/PEPCK flux activators from various drug classes (Table 1). A schematic representation of the workflow is shown in Fig. 2, which outlines three main steps. In the first step, the ability of pck activators to increase pck expression was evaluated in larval zebrafish model, and only those capable of inducing a 2-fold increase in pck expression (pck1 and/or pck2) progressed. In the second step, the validated pck activators were screened in two platforms; behaviour and metabolism, independently. Only drugs that were positive hits in both behaviour and metabolic platforms were taken to the third step, in which electrophysiology was examined.
Table 1.
Screen composed of pck activators tested in scn1lab mutants
| Drugs | Class | pck1 Expression | Behavior |
Metabolism |
|||
|---|---|---|---|---|---|---|---|
| Screen 1 | Screen 2 | ECAR | OCR | Glucose | |||
| PK11195a |
TSPO ligands (antagonist, agonist) |
+ | + | + | + | + | + |
| AC-5216b | + | + | ND | − | − | − | |
| Ro5-4864c | + | − | − | − | − | − | |
| 9-cis Retinoic acid | Vitamin A | + | − | − | + | + | + |
| Fluoxetineb | SSRI | + | + | + | − | − | − |
| Clofibrated | Fatty acids and fibrates | NC | − | − | − | − | − |
| Oleate | + | − | − | − | − | − | |
| 8-Bromo cAMP | cAMP analog | + | − | − | − | − | + |
| Formoterol |
Beta-adrenergic Agonists |
+ | − | − | − | + | + |
| Isoprenaline | + | − | − | − | + | + | |
| Ractopamine | + | − | − | − | − | + | |
| Oxaloacetate | PEPCK flux substrate | NC | − | − | − | − | − |
| Stiripentole | Anti-convulsant | NC | + | + | − | − | − |
+ Positive for the assay; − Negative for the assay; ND, not determined; NC, no change;
Drug positive for all assays;
Positive for screen 1 of behaviour assay but negative for all metabolic assays;
Hyper-excitability in both screens of behaviour assays;
No change in pck1 expression, but tested as a negative control for all assays,
Positive control for all assays.
Figure 2.
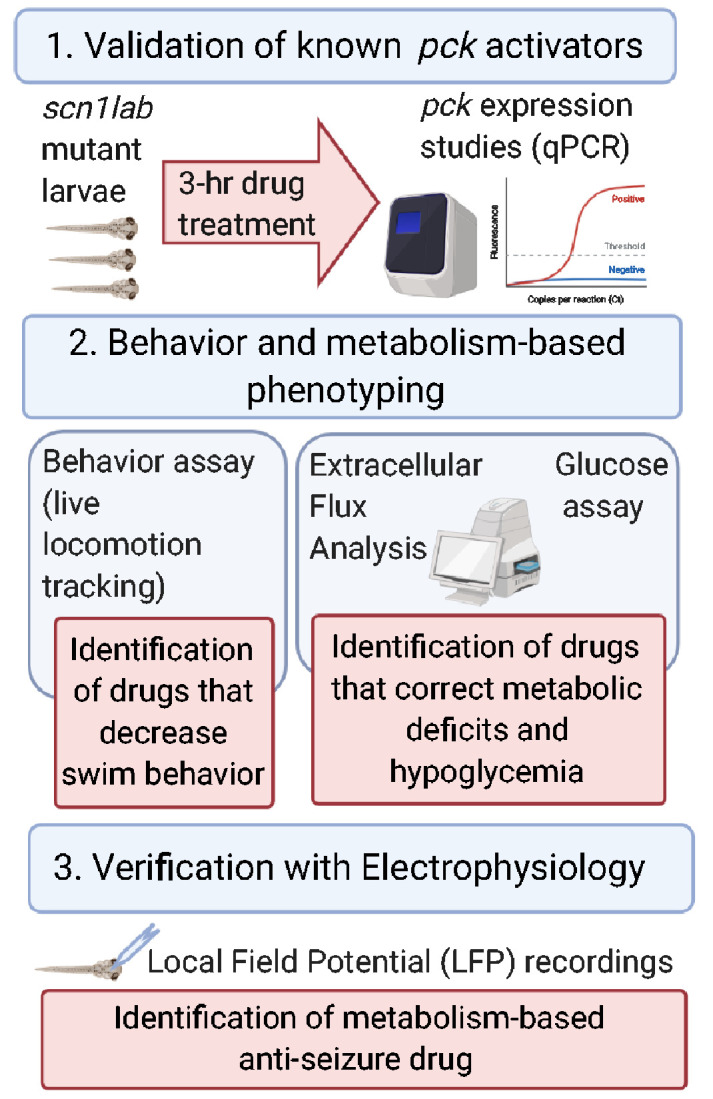
Schematic representation of the workflow of the experimental strategy. The three main steps to identify metabolism-based anti-epileptic drugs for Dravet syndrome include: validation of pck activators, behaviour and metabolism-based phenotyping and finally verification with electrophysiology. (Figure created with BioRender.com).
To validate up-regulation of pck expression, we treated 6-dpf scn1lab mutant larvae with the selected compounds (10 μM) for 3-h and performed qPCR to measure the expression levels of pck1 and pck2 (n = 4, vehicle, PK11195, AC-5216, Ro5-4864 and stiripentol; n = 3, remaining drugs). Interestingly, we found more than a 2-fold increase in pck1 expression for the majority of compounds: PK11195, AC-5216, fluoxetine, isoprenaline, oleate, formoterol and ractopamine (Fig. 3A). Additionally, we found a more than 4-fold increase in pck1 expression for Ro5-4864, 9-cis retinoic acid and 8-bromo-cAmp (Fig. 3A). We did not observe an increase in pck2 expression for most drugs with the exception of ractopamine, which showed more than 2-fold increase (Fig. 3B). Predictably, oxaloacetate, which is known to increase flux through PEPCK and stiripentol, an antiepileptic drug used in Dravet syndrome patients did not up-regulate either pck1 or pck2 (Fig. 3A and B). Clofibrate did not increase either pck1 or pck2 expression (Fig. 3A and B). The expression studies indicate that pharmacologically targeting pcks results in significant up-regulation of particularly pck1 in scn1lab mutant larvae. Furthermore, 3-h incubation with pck activators PK11195 and 9-cis retinoic acid, (n = 4) increased pck1 expression but not the glycolytic gene glucokinase (gck), thus validating specificity of the expression data (Fig. 3C). Moreover, the antiepileptic drug stiripentol did not alter pck1, pck2 or gck expression (n = 4). This finding indicates that the anti-epileptic property of stiripentol is not dependent on gluconeogenesis and it functions via its known allosteric actions on GABA-A receptors (Fisher, 2011).
Figure 3.

Reduction in convulsive seizure-like swim behaviour with validated pck1 activators. (A) The bar graph represents qPCR data with relative fold change of pck1 gene in 3-h drug-treated scn1lab mutants. The drugs that had more than 4-fold up-regulation of pck1 were 9-cis retinoic acid, Ro5-4864 and 8-bromo-cAmp and with more than 2-fold up-regulation were PK11195, AC-5216, fluoxetine, isoprenaline, formoterol, oleate and ractopamine. (B) The bar graph represents qPCR data with relative fold change of pck2 gene in 3-h drug-treated scn1lab mutants. No significant up-regulation of pck2 was observed except with ractopamine. (C) No change in expression of gck gene was observed in drug-treated scn1lab mutants. Drugs include PK 11195, 9-cis retinoic acid and stiripentol. Data for A, B and C were normalized to the housekeeping gene acta1 and presented as mean ± S.E.M. Statistics were performed by one-way ANOVA followed by Dunnett’s multiple comparison test with significance taken as *P < 0.05, **P < 0.01, ***P < 0.001 and ****P < 0.0001. Values represent averages from n = 4, where each sample represents 10–12 pooled 6-dpf scn1lab mutant larvae. (D) Behaviour-based screening of validated pck1 activators. Heat maps representing change in mean velocity of scn1lab mutants in response to the 13 compounds with 3-h treatment. The heat maps represent two independent screens of behaviour phenotyping in scn1lab mutants. Screen 1 represents percent change in mean velocity (mm s−1) in scn1lab larvae treated with three concentrations (10, 30 and 100 μM) of the drugs for 3-h (performed in UCD facility). Screen 2 represents behaviour screen performed in UCSF facility with three concentrations (10, 100 and 250 μM). The locomotion assay was recorded for 10 min in Danio Vision system using locomotion tracking software (EthoVision XT 11.5-Noldus Information Technology). PK11195 at 10 and 30 μM; AC-5216 at 10 and 30 μM; fluoxetine at 100 μM shows significant decrease in mean velocity (threshold set as ≥40%). Stiripentol was used as a positive control in both screens. Each box represents the percent change in velocity from independent locomotion assays with at least six scn1lab larvae (n = 36). Toxic dose is represented with a cross and the scale at the right-hand side represents the range in percent change in mean velocity.
To test if pck1 activators validated from the expression studies could pharmacologically restore behavioural phenotypes, we tracked swim activity. Prior to tracking, 5–6 dpf scn1lab mutant larvae were first treated for 3-h with pck1 activators at three different concentrations 10, 30 and 100 μM dissolved in embryo media (n = 36 per group). Next, a second investigator blinded to drug exposure monitored convulsive seizure-like swim behaviours using a DanioVision system with automated locomotion tracking software (EthoVision XT 11.5, Noldus Information Technology). The threshold for a significant effect on locomotion was set at −40% (Baraban et al., 2013; Griffin et al., 2017, 2018, 2020). This value is based on a large database composed of control trials in untreated scn1lab mutants (vehicle). Among 13 tested compounds, we identified three compounds PK11195 (10 and 30 μM), AC-5216 (10 and 30 μM) and fluoxetine (100 μM) that significantly decreased swim behaviour in scn1lab mutants (screen 1, Fig. 3D). Additionally, PK11195 (10 μM) and fluoxetine (100 μM) were validated in an independent DanioVision-based behavioural screen in the UCSF lab (screen 2, Fig. 3D). Stiripentol was used as a positive control in both screens (Baraban et al., 2013). Taken together, we identified the top ranking drug PK11195, that up-regulated pck1 expression and reduced convulsive seizure-like swim behaviours in scn1lab mutants from two independent screens.
Correcting metabolic deficits and hypoglycaemia with validated pck1 activators
Extracellular Flux Analyzers have a unique ability to measure in vivo metabolic phenotypes by simultaneously measuring respiration and glycolysis in real time. We previously reported metabolic deficits in scn1lab and stxbp1b mutant zebrafish lines (Grone et al., 2016; Kumar et al., 2016). Mutations in the synaptic machinery gene syntaxin-binding protein 1 (STXBP1) are also linked to neurodevelopmental disorders (Saitsu et al., 2008; Otsuka et al., 2010; Carvill et al., 2014; Tso et al., 2014). To determine if the pck1 activators would improve these metabolic deficits, we treated 6 dpf scn1lab mutants with 10 μM of the drugs for 3-h (n = 10). We simultaneously measured baseline glycolysis and mitochondrial respiration rates in scn1lab mutants with drug treatment or vehicle using the XF24 Flux Analyzer. Interestingly, PK11195 and 9-cis retinoic acid treatment normalized baseline glycolytic rates (ECAR) and mitochondrial respiration rates (OCR) (Fig. 4A and B), whereas formoterol and isoprenaline rescued only the levels of OCR (Fig. 4B).
Figure 4.

Correcting metabolic deficits and hypoglycaemia with validated pck1 activators. (A) Representative bar graph showing baseline ECAR in 6-dpf scn1lab mutants treated with pck1 activators. A significant increase was observed in ECAR for PK11195 and 9-cis retinoic acid. Data are presented as mean ± SEM normalized to wild-type controls. Statistics were performed by one-way ANOVA followed by Dunnett’s multiple comparison test with significance taken as **P < 0.01 ***P < 0.001 and ****P < 0.0001 (n = 10). (B) Representative bar graph showing baseline OCR in scn1lab mutants treated with pck1 activators. A significant increase in OCR was observed for PK11195, 9-cis retinoic acid, formoterol and isoprenaline. Data are presented as mean ± SEM normalized to wild-type controls. Statistics were performed by one-way ANOVA followed by Dunnett’s multiple comparison test with significance taken as **P < 0.01, ***P < 0.001 and ****P < 0.0001 (n = 10). (C) Representative bar graph showing glucose levels (normalized to total protein) in drug-treated scn1lab mutants. There is a significant increase in glucose levels in the scn1lab mutants treated with PK11195, 9-cis retinoic acid, formoterol, 8-bromo-cAMP and ractopamine, compared to the DMSO control (vehicle). Data are presented as mean ± SEM normalized to wild-type controls. Statistics were performed by one-way ANOVA followed by Dunnett’s multiple comparison test with significance taken as *P < 0.05, **P < 0.01 and ***P < 0.001. Values represent averages from n = 11, vehicle, PK11195; (n = 6), other drugs, where each sample represents 10–20 pooled larvae. In all panels, WT refers to wild-type larvae.
Next, to determine if the pck1 activators would improve hypoglycaemia in scn1lab mutants, we treated 6-dpf mutants with 10 μM of the drugs for 3-h (n = 11, vehicle, PK11195; n = 6, other drugs). Using the glucose oxidase-based fluorescence assay, we measured glucose levels in the drug-treated samples and compared them with vehicle control. Any significant improvement of glucose was considered as a normalization or correction of glycolytic levels in the drug-treated scn1lab mutants. Interestingly, PK11195, 9-cis retinoic acid, isoprenaline, ractopamine, 8-bromo cAMP and formoterol treatment significantly increased larval glucose levels (Fig. 4C). Thus, our results from the bioenergetic and glucose assays indicate that PK11195 corrects metabolic deficits (i.e. glycolytic rates, mitochondrial respiration and glucose levels) in scn1lab mutants.
TSPO ligand, PK11195 is a promising therapeutic drug
Our metabolism-based small library screen with commercially available compounds identified drugs that increased gluconeogenesis via up-regulation of pck1 gene expression (or PEPCK flux) in scn1lab mutants. The TSPO ligand, PK11195 was identified as our top candidate as it was the only drug that was a positive hit in all assays (Table 1). Most notably, PK11195 treatment increased pck1 expression, normalized glucose levels, corrected metabolic deficits and significantly decreased seizure-like swim behaviour in mutant larvae. PK11195 is a well-known synthetic ligand of the 18-kDa TSPO, localized at the mitochondrial outer membrane. A 3-h treatment of PK11195 at 10 µM (n = 4) increased pck1 expression more than 2-fold but not pck2 expression. Our two independent locomotion screens identified PK11195 because its 3-h treatment could reduce convulsive seizure-like swim behaviours in scn1lab mutants (Fig. 5A and B, n = 36). Additionally, scn1lab mutants treated with PK11195 could significantly rescue both ECAR (n = 20) and OCR (n = 16) levels as well as glucose levels (n = 11) to wild-type controls. Given the higher expression of Tspo mRNA in various diseased models, we performed Tspo mRNA expression studies with scn1lab mutants and wild-type larvae. Interestingly, we observed more than 2-fold increase in Tspo expression in the mutants (Fig. 5C, n = 3). Since elevated TSPO expression has been linked with and used to detect neuroinflammation, we asked if PK11195 treatment altered Tspo expression in scn1lab mutants. Although we did not observe a statistically significant change in the expression levels but we did observe a trend of decreased Tspo mRNA after PK11195 treatment which suggests a possibility of the drug inhibiting the expression Tspo (Fig. 5C, n = 3).
Figure 5.

PK11195 is a positive hit in both metabolic and behaviour phenotyping assays. (A) Bar graph representing percent change in mean velocity (mm s−1) in scn1lab mutant larvae (6 dpf) treated with three concentrations of PK11195 (10, 30 and 100 μM) for 3-h. Locomotion was recorded for 10-min in DanioVision system using a locomotion tracking software (EthoVision XT 11.5-Noldus Information Technology). PK11195 at both 10 and 30 μM showed significant decrease in mean velocity. PK11195 at 100 μM was a toxic dose. Data are presented as mean change in velocity ± SEM with n = 36. The cut-off for significant decrease in mean velocity is set at ≥40% (dashed line). (B) Representative traces of locomotion plots obtained from 10-min recordings for baseline and 10 μM PK11195-treated larvae are shown. (C) The bar graph represents qPCR data with increased expression of Tspo mRNA in scn1lab mutants compared to wild-type. The bar graph on the right represents qPCR data with relative fold change of Tspo with 3-h PK11195-treated scn1lab mutants. No significant change was observed; however, a trend of decreased Tspo expression was seen in PK11195-treated scn1lab mutants. Data were normalized to the housekeeping gene acta1 and presented as mean ± S.E.M. Statistics were performed by Student’s unpaired t-test. Asterisks (*) indicate a significance *P < 0.05. Values represent averages from n = 3, where each sample represents 10–12 pooled 6-dpf larvae. (D) The bar graph represents increased swim behaviour in 5-dpf wild-type larvae treated with 500 μM 3-MPA. No increase in swim behaviour was observed with 100 μM 3-MPA (n = 24). WT refers to wild-type larvae. (E) Representative traces of locomotion plots obtained from 10-min recordings for baseline and 500 µM 3-MPA-treated wild-type larvae are shown. (F) Representative bar graph showing glucose levels (normalized to total protein) in 3-MPA-treated wild-type larvae. A significant decrease of glucose levels was observed in 3-MPA-treated larvae (3- and 6-h) when compared with vehicle (wild-type untreated larvae). The bar graph in the right-hand side represents glucose levels in PK11195-treated larvae. A significant increase of glucose levels was observed in larvae that were incubated with 3-MPA (500 μM) and PK11195 (10 μM) for 6-h but not for 3-h compared with vehicle (3-MPA-treated larvae). Data are presented as mean ± SEM. Statistics were performed by two-way ANOVA followed by Tukey’s multiple comparison test with significance taken as **P < 0.01, ***P < 0.001 and ****P < 0.0001. Values represent averages for n = 5, where each sample represents 20 pooled larvae.
To begin an investigation of the underlying mechanism of PK11195 and to assess if its action on gluconeogenesis is sufficient to rescue the defects in scn1lab mutants, we used an approach to inhibit the metabolic pathway. Because PEPCK enzymes are crucial for providing glucose in larval zebrafish during embryogenesis, the genetic deletion of pck1 would be deleterious and thus not a feasible model. We therefore used a pharmacological approach to determine if transient inhibition of PEPCK-C in wild-type larvae would mimic the behaviour and metabolic phenotype observed in scn1lab mutants using a well-known pck1 inhibitor, 3-MPA (Makinen and Nowak, 1983; Jurczyk et al., 2011; Balan et al., 2015). We monitored spontaneous swim behaviour in wild-type larvae treated with 3-MPA (n = 24) using the Danio Vision system with automated locomotion tracking software (EthoVision XT 11.5-Noldus Information Technology). Our results show that 3-MPA increased seizure-like swim behaviour in wild-type larvae (Fig. 5D and E). In Fig. 5E, the representative locomotion plots of 3-MPA-treated wild-type larvae indicate hyperactivity and convulsive seizure-like behaviour as seen in scn1lab mutants (Fig. 5B, see baseline locomotion plots). This kind of characteristic behaviour phenotype in scn1lab mutants has already been validated in the study of Baraban et al. (2013). Our data suggest that the 3-MPA-treated wild-type larvae mimics the behaviour phenotype of scn1lab mutants. Treatment of 5-dpf wild-type larvae for 3-h with 3-MPA (n = 5) decreased glucose levels in a dose-dependent manner, confirming its ability to inhibit PEPCK (Fig. 5F). Finally, we asked if PK11195 would normalize glucose levels in 3-MPA-treated wild-type larvae. Briefly, 5-dpf wild-type larvae were treated with 3-MPA (500 µM) and PK11195 (10 µM) and harvested at 3- or 6-h time point (n = 5). Incubation of wild-type larvae for 6-h, but not 3-h with PK11195, restored glucose levels to wild-type levels (Fig. 5F). These data further confirm the ability of PK11195 to normalize dys-regulated glucose metabolism.
PK11195 treatment suppresses electrographic seizures
Successful phenotype-based screening for anti-seizure activity in scn1lab mutant zebrafish larvae requires a secondary electrophysiology assay to discriminate compounds that effectively reduce, or suppress, electrographic seizure events from false-positives that only suppress behaviours (Baraban et al., 2013; Dinday and Baraban, 2015; Griffin et al., 2017, 2018, 2020). Prolonged 3-h exposure to PK11195 increased pck1 expression (Fig. 3A) and reduced convulsive seizure-like swim behaviours observed in scn1lab mutants at 5 dpf in two independent screening assays (Figs. 3D and 5A and B). To confirm an action on electrographic seizure activity in the central nervous system, we first exposed freely behaving scn1lab larvae to 10 μM PK11195 (n = 22) or control embryo media (n = 21) using the same 3-h exposure protocol. Next, coded larvae were randomly selected by a second investigator blinded to drug exposure protocol, briefly paralysed with pancuronium, and immobilized in agarose for LFP recordings. A single LFP glass microelectrode was placed, under visual guidance, in optic tectum and 10-min recording epochs were obtained (Fig. 6A). Long-duration large-amplitude ictal-like and brief small-amplitude inter-ictal-like events were analysed offline using an event detection setting. We noted a significant reduction in the frequency of ictal- and inter-ictal-like electrographic seizure events with a 3-h 10 μM PK11195 exposure (Fig. 6B and C). No change in ictal event duration was noted (Fig. 6D). At the conclusion of some recordings, larvae were gently freed from agarose and returned to a Petri dish containing embryo media (n = 16); 94% of scn1lab larvae exposed to this protocol were alive and freely swimming at 24-h.
Figure 6.

PK11195 treatment effectively suppresses electrographic seizure activity. (A) Representative 10-min local field LFP recording epochs with 6-dpf scn1lab mutants treated with control media and 10 μM PK11195 for 3-h. (B) The graph shows a significant reduction in the frequency of ictal- and inter-ictal-like electrographic seizure events with a 3-h 10 μM PK11195 exposure. (C) The graph shows a significant effect of 3-h 10 μM PK11195 exposure in significantly suppressing ictal events alone. (D) No change in ictal event duration was observed among the two groups. All drug-treated scn1lab mutant larvae were freed from agar post-experiment and the survival rate at 24-h was 94%. Data represent 6 dpf from three independent clutches, n = 17 for controls; n = 22 for PK11195 treatment. Data are presented as mean ± SEM; Student’s unpaired t-test was used. Asterisks (*) indicate a significance *P < 0.05; **P < 0.001.
Discussion
This study builds on our previous work that demonstrated metabolic deficits and down-regulation of key gluconeogenic genes, pck1 and pck2 in scn1lab mutants, a translatable zebrafish model of Dravet syndrome (Kumar et al., 2016). Here, we further characterized the hypometabolic characteristics of scn1lab mutants and identified a pharmacological lead from a metabolism-based small library screen, suggesting therapeutic potential for neurodevelopmental disorders such as Dravet syndrome. In addition to lower glycolytic and mitochondrial respiration rates of scn1lab mutants reported in Kumar et al. (2016), we show that mutants have impaired mitochondrial function and are also hypoglycaemic (Fig. 1). The Seahorse Extracellular Flux Analyzer is a great bioenergetics tool to measure the complete metabolic profile of live zebrafish in real time (Stackley et al., 2011; Gibert et al., 2013; Kumar et al., 2016; Ibhazehiebo et al., 2018). Although impaired bioenergetics were reported in the zebrafish model of Dravet syndrome (Kumar et al., 2016), this is the first time hypoglycaemia has been identified in these mutants. Most importantly, here we tested known pck activators and conducted behaviour and metabolic assays to identify the activators of gluconeogenesis that could improve both convulsive seizure-like swim behaviour and impaired metabolism in larval scn1lab mutants. Based on our screen, we discovered a Translocator protein (TSPO) ligand, PK11195 as the lead compound and a potential therapeutic target for Dravet syndrome. The final step in this process confirmed PK11195 as the most promising drug for its anti-epileptic property using electrophysiology. According to our experimental workflow (Fig. 2) and strict criteria, only drugs that increased pck1 or pck2 (or both) expression more than 2-fold were included for behaviour and metabolism-based screening. The gene expression studies suggested that the vast majority of the drugs increased PEPCK-C, encoding pck1 gene present in the cytosol but not PEPCK-M, encoding pck2 gene present in the mitochondria (Fig. 3).
Among the validated pck1 activators, only PK11195, AC-5216 and fluoxetine significantly suppressed seizure-like swim behaviour in scn1lab mutants (Fig. 3). Interestingly, in our metabolism platform, we found drugs such as PK11195, 9-cis retinoic acid, 8-bromo-cAMP, isoprenaline, formoterol and ractopamine could improve metabolic deficits and glucose levels (Fig. 4). The top candidate, PK11195, the ligand of the outer mitochondrial membrane was chosen due to its ability to consistently up-regulate pck1 expression, normalize metabolic deficits, restore glucose levels and improve swim behaviour in the scn1lab mutant. Interestingly, several drugs with similar potential as PK11195 to improve metabolism in scn1lab mutants, did not suppress seizure-like swim behaviour in the mutants. A secondary electrophysiology assay using LFP recordings verified the anti-seizure properties of PK11195 and ruled out the possibility of false-positives from the locomotion assay (Fig. 6); (Baraban et al., 2013; Dinday and Baraban, 2015; Griffin et al., 2017, 2018, 2020). In contrast, stiripentol, an FDA-approved anti-seizure drug used in conjunction with clobazam for the treatment of patients with Dravet syndrome (Fisher, 2011) decreased swim behaviour but not pck expression or metabolism in scn1lab mutants, confirming that it targets a distinct pathway separate from PK11195. Moreover, the inability of stiripentol to inhibit metabolic deficits suggests that decreasing swim behaviour was not sufficient to account for the effects of PK11195.
PK11195 is a classical synthetic ligand of the 18-kDa TSPO, which is previously known as peripheral-type benzodiazepine receptor and is located specifically in the outer mitochondrial membrane (Braestrup and Squires, 1977; Papadopoulos et al., 2006, 2007; Rupprecht et al., 2010; Bhoola et al., 2018). TSPO is an evolutionarily conserved and composed of five trans-membrane proteins and is widely expressed in mostly all mammalian organs (Anholt et al., 1986; Antkiewicz-Michaluk et al., 1988; Benavides et al., 1989; Bhoola et al., 2018). This mitochondrial outer membrane protein is highly expressed in the steroid-producing tissues including the microglia and reactive astrocytes present in the central nervous system (Anholt et al., 1986; Gavish et al., 1999; Kuhlmann and Guilarte, 2000; Casellas et al., 2002; Jayakumar et al., 2002; Delavoie et al., 2003; Lacapere and Papadopoulos, 2003; Jordà et al., 2005; Maeda et al., 2007; Chen and Guilarte, 2008). Among many functions of this protein, the primary and the most well-characterized function is its involvement in neurosteroid synthesis of trans-locating cholesterol inside the mitochondria (Papadopoulos et al., 2006, 2007; Rupprecht et al., 2010). Interestingly, TSPO is widely studied and is of great interest because of its role as a biomarker for brain inflammation associated with microglial activation in neuropathological conditions (Chauveau et al., 2008; Rupprecht et al., 2010). Thus, PK11195 and other synthetic ligands were developed for diagnostic neuroimaging and as neurotherapeutics. It is a TSPO antagonist with sub-nanomolar affinity (Shah et al., 1994) and is widely used for decades as a positron emission tomography radioligand to detect neuroinflammation in humans (Charbonneau et al., 1986; Cagnin et al., 2002; Chauveau et al., 2008; Miyoshi et al., 2009; Owen et al., 2011; Butler et al., 2013; Koepp et al., 2017).The mechanism by which this drug works has been controversial, but traditionally believed to work via the peripheral-type benzodiazepine receptor. Interestingly, PK11195 imaging using tracer doses is widely used in human neurological diseases including patients with temporal lobe epilepsy as a surrogate biomarker of neuroinflammation (Kannan et al., 2009; Dedeurwaerdere et al., 2012; Dickstein et al., 2019). Peripheral-type benzodiazepine receptor-independent actions of PK11195 at pharmacological concentrations have been linked to its anti-cancer activity which sensitizes cells to the apoptosis process via a mitochondrial pathway (Gonzalez-Polo et al., 2005). Relevant to our study, PK11195 and another synthetic TSPO ligand, Ro5-4864 were unexpectedly identified in larval zebrafish by large-scale screening efforts in search of small-molecule activators of fasting metabolism (Gut et al., 2013). In that study, PK11195 was shown to improve glucose tolerance in obese mice, thus providing evidence of this drug as a regulator of gluconeogenesis. It is curious that other TSPO ligands, Ro5-4864 and AC-5216, did not show similar effects as PK11195 in our study. A potential reason for this difference may be due to the underlying pharmacological mechanisms of the ligands. Although PK11195 is an antagonist, Ro5-4864 and AC-5216 are both agonists for TSPO. In fact, we found that Ro5-4864 increased swim behavior, indicative of seizure-like activity in scn1lab larvae (Fig. 3). This is also in agreement with another study which showed opposite effects of Ro5-4864 and PK11195 on audiogenic seizures in mice (Benavides et al., 1984).These authors showed that Ro5-4864 and PK11195 increased and decreased audiogenic seizures, respectively. However, another selective TSPO ligand, AC-5216, has been shown to exert rapid anxiolytic effects and thus providing further evidence of therapeutic potential of these outer mitochondrial membrane ligands (Rupprecht et al., 2009). Other studies have also shown anti-anxiety and antidepressant-like activities of AC-5216 (Kita et al., 2004; Qiu et al., 2016). Interestingly, in addition to PK11195, we found AC-5216 and a known antidepressant drug, fluoxetine (selective serotonin re-uptake inhibitor or SSRI), to effectively reduce seizure-like swim behaviour in scn1lab mutants (Fig. 3). In contrast to PK11195, neither of the two drugs had any effect on metabolism-based assays and thus did not meet our criteria for further testing. Notably, PK11195 was identified as the most promising drug from our screen of 13 drugs as it was positive in all our assays (Table 1). Elevated levels of the Tspo gene have been linked to cancer, numerous neurological diseases and also brain injury, and thus it is a well-documented diagnostic and imaging target (Bai et al., 2007; Vlodavsky and Soustiel, 2007; Rupprecht et al., 2010; Buck et al., 2011). Our study provides novel findings of higher mRNA levels of Tspo in the scn1lab mutants compared to the wild-type controls (Fig. 5). This suggests that scn1lab mutants have elevated neuroinflammation potentially associated with microglial activation. Although we did not see a significant change with PK11195 treatment, the decreased trend in Tspo expression looks promising (Fig. 5). However, to conclude if PK11195 is acting as an antagonist needs further exploration.
Most importantly, our study identified a therapeutic potential of the TSPO ligand, PK11195, as it was the only drug that reversed metabolic deficits and inhibited electrographic seizures in the scn1lab mutants at low micro-molar concentrations. It is interesting to note in the 2013 study (Gut et al., 2013), glucose control was achieved by PK11195 concomitant with an up-regulation of pck1 in a model of pre-diabetes and obesity typically associated with hyperglycaemia. In contrast, our results indicated that PK11195 treatment elevated energetic pathways (ECAR and OCR) as well as glucose levels in the scn1lab mutants to wild-type levels. Taken together, this suggests that PK11195 being a gluconeogenesis modulator may serve as a glucose ‘sensor’ and ‘normalize’ impaired glucose metabolism and consequently OCR. Our data suggest that PK11195 treatment selectively ‘senses’ glucose and metabolic dys-regulation in the scn1lab mutants, and modulates the deficits via pck1 expression. Interesting, in wild-type larvae, we did not observe significant pck1 or pck2 up-regulation when treated with the three TSPO ligands, PK11195, Ro5-4864 and AC-5216 (Supplementary Fig. 1). This finding validates our rationale for hypothesizing PK11195 as a ‘sensor’. As no abnormality was detected in wild-type larvae, PK11195 treatment did not have any effect on up-regulation of gluconeogenesis.
Thus, targeting glucose metabolism via gluconeogenesis may provide a novel therapeutic strategy to attenuate seizure activity. Although it is unclear how metabolism-based therapies exert anti-seizure effects, our study suggests one possible mechanism via ‘normalizing’ glucose by gluconeogenesis which is independent of glycolysis. The best evidence implicating the role of such a metabolic switch to achieve seizure control is use of the KD which also diverts fuels from glycolysis (Kinsman et al., 1992; Kang et al., 2005; Kossoff et al., 2009; Nabbout et al., 2011; Veggiotti et al., 2011; Laux and Blackford, 2013; Gano et al., 2014; Dressler et al., 2015). In accordance with this, ketogenic substrates have also been shown to rescue impaired metabolism and attenuate seizures in scn1lab mutants (Baraban et al., 2013; Kumar et al., 2016). However, additional underlying mechanisms cannot be ruled out and need further exploration.
Our study did not identify the target tissue or organelle underlying the benefits of PK11195 in the mutant zebrafish. Localization of pck1 is predominantly in the liver; although brain pck1 expression has been noted where its functions may be related to glyceroneogenesis (Owen et al., 2002; Cadoudal et al., 2008). Since we assayed whole zebrafish larvae, it is likely that lower glucose levels and bioenergetics in scn1lab mutants were reflective of the yolk sac which serves as the major source of glucose for this larval stage rather than brain levels. The observation that metabolic deficits and seizures in scn1lab mutants can be controlled via gluconeogenesis is intriguing regardless of whether the brain and/or liver were targeted by PK11195 action. The role of pck1 was further suggested by the demonstration that treatment of wild-type larvae with 3-MPA, a well-known gluconeogenesis inhibitor caused metabolic and behaviour defects similar to those observed in scn1lab mutants. Furthermore, PK11195 treatment rescued decreased glucose levels in the 3-MPA-treated zebrafish larvae in a manner similar to scn1lab mutants (Fig. 5). Moreover, treatment with known gluconeogenesis regulators, isoprenaline and formoterol, is also known to increase glucose levels (Gut et al., 2013) similar to what we observe in our screen (Fig. 4).
It is noteworthy that bioenergetic platforms such as the one we utilized are increasingly used in the literature to identify metabolism-based anti-seizure drugs. Using a similar strategy, a recent study (Ibhazehiebo et al., 2018) identified an approved anti-cancer drug, vorinostat, which improved mitochondrial bioenergenics and seizures in a potassium channel gene knockdown epilepsy model (kcn1a). Interestingly, they observed opposite OCR effects in the kcna1-morpholino zebrafish larval model in contrast with the scn1lab mutants (Fig. 1). This may be related to differences in the targeted ion channels, method used to target the ion channels i.e. acute seizures in kcn1a morphants similar to chemically induced seizures induced by pentylenetetrazole versus chronic seizures in scn1lab mutants generated by a chemical mutagenesis screen, or differences in the seizure burden in the two models. In contrast with the kcna1 epilepsy model, a striking characteristic of the scn1lab mutant is the severe and relentless seizures which may cause shunting of glucose from the embryo sac and periphery to the brain which then utilizes it as an energy source for seizures. This could result in the depletion of peripheral and sac glucose, decreased ECAR and as a consequence decreased OCR in scn1lab mutants.
Conclusion
In summary, we show that correcting gluconeogenesis, a pathway biochemically distinct from glycolysis, is able to rescue metabolic defects and seizures in a pre-clinical model of Dravet syndrome. This suggests that targeting energy-producing pathways is a viable and novel therapeutic avenue for the treatment of genetic neurodevelopmental disorders such as Dravet syndrome. Although our study focussed on Dravet syndrome, a rare genetic epilepsy, our findings may apply to other forms of epilepsy.
Supplementary material
Supplementary material is available at Brain Communications online.
Supplementary Material
Acknowledgements
The authors thank zebrafish core facility (UCD) for maintaining the zebrafish lines; Angie Ribera for generous access to the Danio Vision System located in her lab (UCD); Patel lab members (UCD) and Baraban lab members (UCSF) for technical advice and critical thinking. Graphical abstract and Fig. 2 were created with BioRender.com.
Funding
This study was supported by the postdoctoral fellowship from the Dravet Syndrome Foundation (R.B.); National Institute of Neurological Disorders and Stroke (NINDS): R01NS039587 and R01NS086423 to M.P. and R01NS096976 to S.C.B. and National Institute of health (NIH)/Eunice Kennedy Shriver National Institute of Child Health and Human Development (NICHD): R01HD102071-01 to M.P. and S.C.B.
Competing interests
S.C.B. is a co-Founder and Scientific Advisor for EpyGenix Therapeutics.
Glossary
- DMSO =
dimethylsulphoxide
- dpf =
days post-fertilization
- ECAR =
Extracellular Acidification Rate
- FCCP =
trifluoromethoxy carbonylcyanide phenylhydrazone
- KD =
ketogenic diets
- LFP =
local field potential
- OCR =
oxygen consumption rate
- PEPCK =
phosphoenolpyruvate carboxykinase
- SSRI =
selective serotonin reuptake inhibitor
- TSPO =
Translocator protein
References
- Anholt RR, Pedersen PL, De Souza EB, Snyder SH.. The peripheral-type benzodiazepine receptor. Localization to the mitochondrial outer membrane. J Biol Chem 1986; 261: 576–83. [PubMed] [Google Scholar]
- Antkiewicz-Michaluk L, Guidotti A, Krueger KE.. Molecular characterization and mitochondrial density of a recognition site for peripheral-type benzodiazepine ligands. Mol Pharmacol 1988; 34: 272–8. [PubMed] [Google Scholar]
- Bai M, Rone MB, Papadopoulos V, Bornhop DJ.. A novel functional translocator protein ligand for cancer imaging. Bioconjugate Chem 2007; 18: 2018–23. [DOI] [PubMed] [Google Scholar]
- Balan MD, Mcleod MJ, Lotosky WR, Ghaly M, Holyoak T.. Inhibition and allosteric regulation of monomeric phosphoenolpyruvate carboxykinase by 3-mercaptopicolinic acid. Biochemistry 2015; 54: 5878–87. [DOI] [PubMed] [Google Scholar]
- Baraban SC, Dinday MT, Hortopan GA.. Drug screening in Scn1a zebrafish mutant identifies clemizole as a potential Dravet syndrome treatment. Nat Commun 2013; 4: 2410. [DOI] [PMC free article] [PubMed] [Google Scholar]
- Baraban SC, Taylor MR, Castro PA, Baier H.. Pentylenetetrazole induced changes in zebrafish behavior, neural activity and c-fos expression. Neuroscience 2005; 131: 759–68. [DOI] [PubMed] [Google Scholar]
- Benavides J, Dubois A, Dennis T, Hamel E, Scatton B.. Omega 3 (peripheral type benzodiazepine binding) site distribution in the rat immune system: an autoradiographic study with the photoaffinity ligand [3H]PK 14105. J Pharmacol Exp Ther 1989; 249: 333–9. [PubMed] [Google Scholar]
- Benavides J, Guilloux F, Allam DE, Uzan A, Mizoule J, Renault C, et al. Opposite effects of an agonist, RO5-4864, and an antagonist, PK 11195, of the peripheral type benzodiazepine binding sites on audiogenic seizures in DBA/2J mice. Life Sci 1984; 34: 2613–20. [DOI] [PubMed] [Google Scholar]
- Benedek K, Juhasz C, Chugani DC, Muzik O, Chugani HT.. Longitudinal changes in cortical glucose hypometabolism in children with intractable epilepsy. J Child Neurol 2006; 21: 26–31. [DOI] [PubMed] [Google Scholar]
- Bhoola NH, Mbita Z, Hull R, Dlamini Z.. Translocator protein (TSPO) as a potential biomarker in human cancers. Int J Mol Sci 2018; 19: 2176. [DOI] [PMC free article] [PubMed] [Google Scholar]
- Braestrup C, Squires RF.. Specific benzodiazepine receptors in rat brain characterized by high-affinity (3H)diazepam binding. Proc Natl Acad Sci USA 1977; 74: 3805–9. [DOI] [PMC free article] [PubMed] [Google Scholar]
- Buck JR, Mckinley ET, Hight MR, Fu A, Tang D, Smith RA, et al. Quantitative, preclinical PET of translocator protein expression in glioma using 18F-N-fluoroacetyl-N-(2,5-dimethoxybenzyl)-2-phenoxyaniline. J Nucl Med 2011; 52: 107–14. [DOI] [PMC free article] [PubMed] [Google Scholar]
- Butler T, Ichise M, Teich AF, Gerard E, Osborne J, French J, et al. Imaging inflammation in a patient with epilepsy due to focal cortical dysplasia. J Neuroimaging 2013; 23: 129–31. [DOI] [PMC free article] [PubMed] [Google Scholar]
- Cadoudal T, Glorian M, Massias A, Fouque F, Forest C, Benelli C.. Retinoids upregulate phosphoenolpyruvate carboxykinase and glyceroneogenesis in human and rodent adipocytes. J Nutr 2008; 138: 1004–9. [DOI] [PubMed] [Google Scholar]
- Cagnin A, Gerhard A, Banati RB.. The concept of in vivo imaging of neuroinflammation with [11C](R)-PK11195 PET. Ernst Schering Res Found Workshop 2002; 179–91. [DOI] [PubMed] [Google Scholar]
- Caraballo RH.Nonpharmacologic treatments of Dravet syndrome: focus on the ketogenic diet. Epilepsia 2011; 52: 79–82. [DOI] [PubMed] [Google Scholar]
- Carvill GL, Weckhuysen S, Mcmahon JM, Hartmann C, Moller RS, Hjalgrim H, et al. GABRA1 and STXBP1: novel genetic causes of Dravet syndrome. Neurology 2014; 82: 1245–53. [DOI] [PMC free article] [PubMed] [Google Scholar]
- Casellas P, Galiegue S, Basile AS.. Peripheral benzodiazepine receptors and mitochondrial function. Neurochem Int 2002; 40: 475–86. [DOI] [PubMed] [Google Scholar]
- Catterall WA.Signaling complexes of voltage-gated sodium and calcium channels. Neurosci Lett 2010; 486: 107–16. [DOI] [PMC free article] [PubMed] [Google Scholar]
- Charbonneau P, Syrota A, Crouzel C, Valois JM, Prenant C, Crouzel M.. Peripheral-type benzodiazepine receptors in the living heart characterized by positron emission tomography. Circulation 1986; 73: 476–83. [DOI] [PubMed] [Google Scholar]
- Chauveau F, Boutin H, Van Camp N, Dolle F, Tavitian B.. Nuclear imaging of neuroinflammation: a comprehensive review of [11C]PK11195 challengers. Eur J Nucl Med Mol Imaging 2008; 35: 2304–19. [DOI] [PubMed] [Google Scholar]
- Chen E, Ekker SC.. Zebrafish as a genomics research model. CPB 2004; 5: 409–13. [DOI] [PubMed] [Google Scholar]
- Chen MK, Guilarte TR.. Translocator protein 18 kDa (TSPO): molecular sensor of brain injury and repair. Pharmacol Ther 2008; 118: 1–17. [DOI] [PMC free article] [PubMed] [Google Scholar]
- Cooper MS, Mcintosh A, Crompton DE, Mcmahon JM, Schneider A, Farrell K, et al. Mortality in Dravet syndrome. Epilepsy Res 2016; 128: 43–7. [DOI] [PubMed] [Google Scholar]
- Costantini LC, Barr LJ, Vogel JL, Henderson ST.. Hypometabolism as a therapeutic target in Alzheimer’s disease. BMC Neurosci 2008; 9 Suppl 2: S16. [DOI] [PMC free article] [PubMed] [Google Scholar]
- Craig AK, De Menezes MS, Saneto RP.. Dravet syndrome: patients with co-morbid SCN1A gene mutations and mitochondrial electron transport chain defects. Seizure 2012; 21: 17–20. [DOI] [PubMed] [Google Scholar]
- Dedeurwaerdere S, Callaghan PD, Pham T, Rahardjo GL, Amhaoul H, Berghofer P, et al. PET imaging of brain inflammation during early epileptogenesis in a rat model of temporal lobe epilepsy. EJNMMI Res 2012; 2: 60. [DOI] [PMC free article] [PubMed] [Google Scholar]
- Delavoie F, Li H, Hardwick M, Robert JC, Giatzakis C, Peranzi G, et al. In vivo and in vitro peripheral-type benzodiazepine receptor polymerization: functional significance in drug ligand and cholesterol binding. Biochemistry 2003; 42: 4506–19. [DOI] [PubMed] [Google Scholar]
- Delvecchio C, Tiefenbach J, Krause HM.. The zebrafish: a powerful platform for in vivo, HTS drug discovery. Assay Drug Dev Technol 2011; 9: 354–61. [DOI] [PubMed] [Google Scholar]
- Depienne C, Trouillard O, Saint-Martin C, Gourfinkel-An I, Bouteiller D, Carpentier W, et al. Spectrum of SCN1A gene mutations associated with Dravet syndrome: analysis of 333 patients. J Med Genet 2009; 46: 183–91. [DOI] [PubMed] [Google Scholar]
- Devinsky O, Cross JH, Wright S.. Trial of cannabidiol for drug-resistant seizures in the Dravet syndrome. N Engl J Med 2017; 377: 699–700. [DOI] [PubMed] [Google Scholar]
- Devinsky O, Patel AD, Thiele EA, Wong MH, Appleton R, Harden CL, On behalf of the GWPCARE1 Part A Study Group, et al. Randomized, dose-ranging safety trial of cannabidiol in Dravet syndrome. Neurology 2018; 90: e1204–11. [DOI] [PMC free article] [PubMed] [Google Scholar]
- Dickstein LP, Liow JS, Austermuehle A, Zoghbi S, Inati SK, Zaghloul K, et al. Neuroinflammation in neocortical epilepsy measured by PET imaging of translocator protein. Epilepsia 2019; 60: 1248–54. [DOI] [PMC free article] [PubMed] [Google Scholar]
- Dinday MT, Baraban SC.. Large-scale phenotype-based antiepileptic drug screening in a zebrafish model of Dravet syndrome. Eneuro 2015; 2: ENEURO.0068-15.2015. [DOI] [PMC free article] [PubMed] [Google Scholar]
- Doccini S, Meschini MC, Mei D, Guerrini R, Sicca F, Santorelli FM.. Mitochondrial respiratory chain defects in skin fibroblasts from patients with Dravet syndrome. Neurol Sci 2015; 36: 2151–5. [DOI] [PubMed] [Google Scholar]
- Dravet C.The core Dravet syndrome phenotype. Epilepsia 2011; 52 Suppl 2: 3–9. [DOI] [PubMed] [Google Scholar]
- Dravet C, Oguni H.. Dravet syndrome (severe myoclonic epilepsy in infancy). Handb Clin Neurol 2013; 111: 627–33. [DOI] [PubMed] [Google Scholar]
- Dressler A, Trimmel-Schwahofer P, Reithofer E, Muhlebner A, Groppel G, Reiter-Fink E, et al. Efficacy and tolerability of the ketogenic diet in Dravet syndrome—comparison with various standard antiepileptic drug regimen. Epilepsy Res 2015; 109: 81–9. [DOI] [PubMed] [Google Scholar]
- Eames SC, Philipson LH, Prince VE, Kinkel MD.. Blood sugar measurement in zebrafish reveals dynamics of glucose homeostasis. Zebrafish 2010; 7: 205–13. [DOI] [PMC free article] [PubMed] [Google Scholar]
- Elo B, Villano CM, Govorko D, White LA.. Larval zebrafish as a model for glucose metabolism: expression of phosphoenolpyruvate carboxykinase as a marker for exposure to anti-diabetic compounds. J Mol Endocrinol 2007; 38: 433–40. [DOI] [PubMed] [Google Scholar]
- England MJ, Liverman CT, Schultz AM, Strawbridge LM.. Epilepsy across the spectrum: promoting health and understanding. A summary of the Institute of Medicine report. Epilepsy Behav 2012; 25: 266–76. [DOI] [PMC free article] [PubMed] [Google Scholar]
- Escayg A, Goldin AL.. Sodium channel SCN1A and epilepsy: mutations and mechanisms. Epilepsia 2010; 51: 1650–8. [DOI] [PMC free article] [PubMed] [Google Scholar]
- Ferrie CD, Maisey M, Cox T, Polkey C, Barrington SF, Panayiotopoulos CP, et al. Focal abnormalities detected by 18FDG PET in epileptic encephalopathies. Arch Dis Child 1996; 75: 102–7. [DOI] [PMC free article] [PubMed] [Google Scholar]
- Fisher JL.The effects of stiripentol on GABA(A) receptors. Epilepsia 2011; 52 Suppl 2: 76–8. [DOI] [PMC free article] [PubMed] [Google Scholar]
- Gano LB, Patel M, Rho JM.. Ketogenic diets, mitochondria, and neurological diseases. J Lipid Res 2014; 55: 2211–28. [DOI] [PMC free article] [PubMed] [Google Scholar]
- Gavish M, Bachman I, Shoukrun R, Katz Y, Veenman L, Weisinger G, et al. Enigma of the peripheral benzodiazepine receptor. Pharmacol Rev 1999; 51: 629–50. [PubMed] [Google Scholar]
- Gibert Y, Mcgee SL, Ward AC.. Metabolic profile analysis of zebrafish embryos. J Vis Exp 2013; e4300. [DOI] [PMC free article] [PubMed] [Google Scholar]
- Gonzalez-Polo RA, Carvalho G, Braun T, Decaudin D, Fabre C, Larochette N, et al. PK11195 potently sensitizes to apoptosis induction independently from the peripheral benzodiazepin receptor. Oncogene 2005; 24: 7503–13. [DOI] [PubMed] [Google Scholar]
- Griffin A, Anvar M, Hamling K, Baraban SC.. Phenotype-based screening of synthetic cannabinoids in a Dravet syndrome zebrafish model. Front Pharmacol 2020; 11: 464. [DOI] [PMC free article] [PubMed] [Google Scholar]
- Griffin A, Hamling KR, Hong S, Anvar M, Lee LP, Baraban SC.. Preclinical animal models for Dravet syndrome: seizure phenotypes, comorbidities and drug screening. Front Pharmacol 2018; 9: 573. [DOI] [PMC free article] [PubMed] [Google Scholar]
- Griffin A, Hamling KR, Knupp K, Hong S, Lee LP, Baraban SC.. Clemizole and modulators of serotonin signalling suppress seizures in Dravet syndrome. Brain 2017; 140: 669–83. [DOI] [PMC free article] [PubMed] [Google Scholar]
- Grone BP, Marchese M, Hamling KR, Kumar MG, Krasniak CS, Sicca F, et al. Epilepsy, behavioral abnormalities, and physiological comorbidities in syntaxin-binding protein 1 (STXBP1) mutant zebrafish. PLos One 2016; 11: e0151148. [DOI] [PMC free article] [PubMed] [Google Scholar]
- Grone BP, Qu T, Baraban SC.. Behavioral comorbidities and drug treatments in a zebrafish scn1lab model of Dravet syndrome. eNeuro 2017; 4: ENEURO.0066-17.2017. [DOI] [PMC free article] [PubMed] [Google Scholar]
- Guerrini R, Striano P, Catarino C, Sisodiya SM.. Neuroimaging and neuropathology of Dravet syndrome. Epilepsia 2011; 52 Suppl 2: 30–4. [DOI] [PubMed] [Google Scholar]
- Guo Y, Gao F, Wang S, Ding Y, Zhang H, Wang J, et al. In vivo mapping of temporospatial changes in glucose utilization in rat brain during epileptogenesis: an 18F-fluorodeoxyglucose-small animal positron emission tomography study. Neuroscience 2009; 162: 972–9. [DOI] [PubMed] [Google Scholar]
- Gut P, Baeza-Raja B, Andersson O, Hasenkamp L, Hsiao J, Hesselson D, et al. Whole-organism screening for gluconeogenesis identifies activators of fasting metabolism. Nat Chem Biol 2013; 9: 97–104. [DOI] [PMC free article] [PubMed] [Google Scholar]
- Hong S, Lee P, Baraban SC, Lee LP.. A novel long-term, multi-channel and non-invasive electrophysiology platform for zebrafish. Sci Rep 2016; 6: 28248. [DOI] [PMC free article] [PubMed] [Google Scholar]
- Hortopan GA, Dinday MT, Baraban SC.. Zebrafish as a model for studying genetic aspects of epilepsy. Dis Model Mech 2010; 3: 144–8. [DOI] [PubMed] [Google Scholar]
- Howe K, Clark MD, Torroja CF, Torrance J, Berthelot C, Muffato M, et al. The zebrafish reference genome sequence and its relationship to the human genome. Nature 2013; 496: 498–503. [DOI] [PMC free article] [PubMed] [Google Scholar]
- Ibhazehiebo K, Gavrilovici C, De La Hoz CL, Ma SC, Rehak R, Kaushik G, et al. A novel metabolism-based phenotypic drug discovery platform in zebrafish uncovers HDACs 1 and 3 as a potential combined anti-seizure drug target. Brain 2018; 141: 744–61. [DOI] [PMC free article] [PubMed] [Google Scholar]
- Jayakumar AR, Panickar KS, Norenberg MD.. Effects on free radical generation by ligands of the peripheral benzodiazepine receptor in cultured neural cells. J Neurochem 2002; 83: 1226–34. [DOI] [PubMed] [Google Scholar]
- Jordà EG, JiméNez A, Verdaguer E, Canudas AM, Folch J, Sureda FX, et al. Evidence in favour of a role for peripheral-type benzodiazepine receptor ligands in amplification of neuronal apoptosis. Apoptosis 2005; 10: 91–104. [DOI] [PubMed] [Google Scholar]
- Jurczyk A, Roy N, Bajwa R, Gut P, Lipson K, Yang C, et al. Dynamic glucoregulation and mammalian-like responses to metabolic and developmental disruption in zebrafish. Gen Comp Endocrinol 2011; 170: 334–45. [DOI] [PMC free article] [PubMed] [Google Scholar]
- Kang HC, Kim YJ, Kim DW, Kim HD.. Efficacy and safety of the ketogenic diet for intractable childhood epilepsy: Korean multicentric experience. Epilepsia 2005; 46: 272–9. [DOI] [PubMed] [Google Scholar]
- Kannan S, Balakrishnan B, Muzik O, Romero R, Chugani D.. Positron emission tomography imaging of neuroinflammation. J Child Neurol 2009; 24: 1190–9. [DOI] [PMC free article] [PubMed] [Google Scholar]
- Kauppila LA, Amorim I, Bentes C, Peralta AR.. Trazodone: a new antiepileptic drug for Dravet syndrome? Int J Epilepsy 2018; 5: 099–103. [Google Scholar]
- Kearney J.Sudden unexpected death in dravet syndrome. Epilepsy Curr 2013; 13: 264–5. [DOI] [PMC free article] [PubMed] [Google Scholar]
- Kinsman SL, Vining EP, Quaskey SA, Mellits D, Freeman JM.. Efficacy of the ketogenic diet for intractable seizure disorders: review of 58 cases. Epilepsia 1992; 33: 1132–6. [DOI] [PubMed] [Google Scholar]
- Kita A, Kohayakawa H, Kinoshita T, Ochi Y, Nakamichi K, Kurumiya S, et al. Antianxiety and antidepressant-like effects of AC-5216, a novel mitochondrial benzodiazepine receptor ligand. Br J Pharmacol 2004; 142: 1059–72. [DOI] [PMC free article] [PubMed] [Google Scholar]
- Koepp MJ, Årstad E, Bankstahl JP, Dedeurwaerdere S, Friedman A, Potschka H, et al. Neuroinflammation imaging markers for epileptogenesis. Epilepsia 2017; 58: 11–9. [DOI] [PubMed] [Google Scholar]
- Korinthenberg R, Bauer-Scheid C, Burkart P, Martens-Le Bouar H, Kassubek J, Juengling FD.. 18FDG-PET in epilepsies of infantile onset with pharmacoresistant generalised tonic-clonic seizures. Epilepsy Res 2004; 60: 53–61. [DOI] [PubMed] [Google Scholar]
- Kossoff EH, Zupec-Kania BA, Amark PE, Ballaban-Gil KR, Christina Bergqvist AG, Blackford R, Charlie Foundation, P. C. O. T. C. N. S., Practice Committee of the Child Neurology, S. & International Ketogenic Diet Study, G, et al. Optimal clinical management of children receiving the ketogenic diet: recommendations of the International Ketogenic Diet Study Group. Epilepsia 2009; 50: 304–17. [DOI] [PubMed] [Google Scholar]
- Kuhlmann AC, Guilarte TR.. Cellular and subcellular localization of peripheral benzodiazepine receptors after trimethyltin neurotoxicity. J Neurochem 2000; 74: 1694–704. [DOI] [PubMed] [Google Scholar]
- Kumar A, Juhasz C, Luat A, Govil-Dalela T, Behen ME, Hicks MA, et al. Evolution of brain glucose metabolic abnormalities in children with epilepsy and SCN1A gene variants. J Child Neurol 2018; 33: 832–6. [DOI] [PubMed] [Google Scholar]
- Kumar A, Semah F, Chugani HT, Theodore WH.. Epilepsy diagnosis: positron emission tomography. Handb Clin Neurol 2012; 107: 409–24. [DOI] [PubMed] [Google Scholar]
- Kumar MG, Rowley S, Fulton R, Dinday MT, Baraban SC, Patel M.. Altered glycolysis and mitochondrial respiration in a zebrafish model of Dravet syndrome. eNeuro 2016; 3: [DOI] [PMC free article] [PubMed] [Google Scholar]
- Lacapere JJ, Papadopoulos V.. Peripheral-type benzodiazepine receptor: structure and function of a cholesterol-binding protein in steroid and bile acid biosynthesis. Steroids 2003; 68: 569–85. [DOI] [PubMed] [Google Scholar]
- Laux L, Blackford R.. The ketogenic diet in Dravet syndrome. J Child Neurol 2013; 28: 1041–4. [DOI] [PubMed] [Google Scholar]
- Lessman CA.The developing zebrafish (Danio rerio): a vertebrate model for high-throughput screening of chemical libraries. Birth Defects Res C Embryo Today 2011; 93: 268–80. [DOI] [PubMed] [Google Scholar]
- Li BM, Liu XR, Yi YH, Deng YH, Su T, Zou X, et al. Autism in Dravet syndrome: prevalence, features, and relationship to the clinical characteristics of epilepsy and mental retardation. Epilepsy Behav 2011; 21: 291–5. [DOI] [PubMed] [Google Scholar]
- Maeda J, Higuchi M, Inaji M, Ji B, Haneda E, Okauchi T, et al. Phase-dependent roles of reactive microglia and astrocytes in nervous system injury as delineated by imaging of peripheral benzodiazepine receptor. Brain Res 2007; 1157: 100–11. [DOI] [PubMed] [Google Scholar]
- Makinen AL, Nowak T.. 3-Mercaptopicolinate. A reversible active site inhibitor of avian liver phosphoenolpyruvate carboxykinase. J Biol Chem 1983; 258: 11654–62. [PubMed] [Google Scholar]
- Malicki J.Genetic analysis of eye development in zebrafish. Results Probl Cell Differ 2000; 31: 257–82. [DOI] [PubMed] [Google Scholar]
- Matheja P, Kuwert T, Ludemann P, Weckesser M, Kellinghaus C, Schuierer G, et al. Temporal hypometabolism at the onset of cryptogenic temporal lobe epilepsy. Eur J Nucl Med 2001; 28: 625–32. [DOI] [PubMed] [Google Scholar]
- Miyoshi M, Ito H, Arakawa R, Takahashi H, Takano H, Higuchi M, et al. Quantitative analysis of peripheral benzodiazepine receptor in the human brain using PET with (11)C-AC-5216. J Nucl Med 2009; 50: 1095–101. [DOI] [PubMed] [Google Scholar]
- Nabbout R, Copioli C, Chipaux M, Chemaly N, Desguerre I, Dulac O, et al. Ketogenic diet also benefits Dravet syndrome patients receiving stiripentol: a prospective pilot study. Epilepsia 2011; 52: e54–7. [DOI] [PubMed] [Google Scholar]
- Novak AE, Taylor AD, Pineda RH, Lasda EL, Wright MA, Ribera AB.. Embryonic and larval expression of zebrafish voltage-gated sodium channel alpha-subunit genes. Dev Dyn 2006; 235: 1962–73. [DOI] [PubMed] [Google Scholar]
- Otsuka M, Oguni H, Liang JS, Ikeda H, Imai K, Hirasawa K, et al. STXBP1 mutations cause not only Ohtahara syndrome but also West syndrome—result of Japanese cohort study. Epilepsia 2010; 51: 2449–52. [DOI] [PubMed] [Google Scholar]
- Owen DR, Gunn RN, Rabiner EA, Bennacef I, Fujita M, Kreisl WC, et al. Mixed-affinity binding in humans with 18-kDa translocator protein ligands. J Nucl Med 2011; 52: 24–32. [DOI] [PMC free article] [PubMed] [Google Scholar]
- Owen OE, Kalhan SC, Hanson RW.. The key role of anaplerosis and cataplerosis for citric acid cycle function. J Biol Chem 2002; 277: 30409–12. [DOI] [PubMed] [Google Scholar]
- Papadopoulos V, Baraldi M, Guilarte TR, Knudsen TB, Lacapere JJ, Lindemann P, et al. Translocator protein (18kDa): new nomenclature for the peripheral-type benzodiazepine receptor based on its structure and molecular function. Trends Pharmacol Sci 2006; 27: 402–9. [DOI] [PubMed] [Google Scholar]
- Papadopoulos V, Liu J, Culty M.. Is there a mitochondrial signaling complex facilitating cholesterol import? Mol Cell Endocrinol 2007; 265-266: 59–64. [DOI] [PubMed] [Google Scholar]
- Patel M.A metabolic paradigm for epilepsy. Epilepsy Curr 2018; 18: 318–22. [DOI] [PMC free article] [PubMed] [Google Scholar]
- Pearson-Smith JN, Patel M.. Metabolic dysfunction and oxidative stress in epilepsy. Int J Mol Sci 2017; 18: 2365. [DOI] [PMC free article] [PubMed] [Google Scholar]
- Porter RJ, Dhir A, Macdonald RL, Rogawski MA.. Mechanisms of action of antiseizure drugs. Handb Clin Neurol 2012; 108: 663–81. [DOI] [PubMed] [Google Scholar]
- Qiu ZK, He JL, Liu X, Zhang GH, Zeng J, Nie H, et al. The antidepressant-like activity of AC-5216, a ligand for 18KDa translocator protein (TSPO), in an animal model of diabetes mellitus. Sci Rep 2016; 6: 37345. [DOI] [PMC free article] [PubMed] [Google Scholar]
- Rinkwitz S, Mourrain P, Becker TS.. Zebrafish: an integrative system for neurogenomics and neurosciences. Prog Neurobiol 2011; 93: 231–43. [DOI] [PubMed] [Google Scholar]
- Rubinstein AL.Zebrafish assays for drug toxicity screening. Expert Opin Drug Metab Toxicol 2006; 2: 231–40. [DOI] [PubMed] [Google Scholar]
- Rupprecht R, Papadopoulos V, Rammes G, Baghai TC, Fan J, Akula N, et al. Translocator protein (18 kDa) (TSPO) as a therapeutic target for neurological and psychiatric disorders. Nat Rev Drug Discov 2010; 9: 971–88. [DOI] [PubMed] [Google Scholar]
- Rupprecht R, Rammes G, Eser D, Baghai TC, Schule C, Nothdurfter C, et al. Translocator protein (18 kD) as target for anxiolytics without benzodiazepine-like side effects. Science 2009; 325: 490–3. [DOI] [PubMed] [Google Scholar]
- Saitsu H, Kato M, Mizuguchi T, Hamada K, Osaka H, Tohyama J, et al. De novo mutations in the gene encoding STXBP1 (MUNC18-1) cause early infantile epileptic encephalopathy. Nat Genet 2008; 40: 782–8. [DOI] [PubMed] [Google Scholar]
- Schlegel A, Stainier DY.. Lessons from “lower” organisms: what worms, flies, and zebrafish can teach us about human energy metabolism. PLoS Genet 2007; 3: e199. [DOI] [PMC free article] [PubMed] [Google Scholar]
- Schoonheim PJ, Arrenberg AB, Del Bene F, Baier H.. Optogenetic localization and genetic perturbation of saccade-generating neurons in zebrafish. J Neurosci 2010; 30: 7111–20. [DOI] [PMC free article] [PubMed] [Google Scholar]
- Shah F, Hume SP, Pike VW, Ashworth S, Mcdermott J.. Synthesis of the enantiomers of [N-methyl-11C]PK 11195 and comparison of their behaviours as radioligands for PK binding sites in rats. Nucl Med Biol 1994; 21: 573–81. [DOI] [PubMed] [Google Scholar]
- Shultz SR, O’Brien TJ, Stefanidou M, Kuzniecky RI.. Neuroimaging the epileptogenic process. Neurotherapeutics 2014; 11: 347–57. [DOI] [PMC free article] [PubMed] [Google Scholar]
- Skluzacek JV, Watts KP, Parsy O, Wical B, Camfield P.. Dravet syndrome and parent associations: the IDEA League experience with comorbid conditions, mortality, management, adaptation, and grief. Epilepsia 2011; 52 Suppl 2: 95–101. [DOI] [PubMed] [Google Scholar]
- Sourbron J, Schneider H, Kecskes A, Liu Y, Buening EM, Lagae L, et al. Serotonergic modulation as effective treatment for Dravet syndrome in a zebrafish mutant model. ACS Chem Neurosci 2016; 7: 588–98. [DOI] [PubMed] [Google Scholar]
- Sourbron J, Smolders I, De Witte P, Lagae L.. Pharmacological analysis of the anti-epileptic mechanisms of fenfluramine in scn1a mutant zebrafish. Front Pharmacol 2017; 8: 191. [DOI] [PMC free article] [PubMed] [Google Scholar]
- Stackley KD, Beeson CC, Rahn JJ, Chan SS.. Bioenergetic profiling of zebrafish embryonic development. PLoS One 2011; 6: e25652. [DOI] [PMC free article] [PubMed] [Google Scholar]
- Sundaram SK, Chugani HT, Tiwari VN, Huq AH.. SCN2A mutation is associated with infantile spasms and bitemporal glucose hypometabolism. Pediatr Neurol 2013; 49: 46–9. [DOI] [PMC free article] [PubMed] [Google Scholar]
- Tenney JR, Rozhkov L, Horn P, Miles L, Miles MV.. Cerebral glucose hypometabolism is associated with mitochondrial dysfunction in patients with intractable epilepsy and cortical dysplasia. Epilepsia 2014; 55: 1415–22. [DOI] [PubMed] [Google Scholar]
- Theodore WH.Cerebral blood flow and glucose metabolism in human epilepsy. Adv Neurol 1999; 79: 873–81. [PubMed] [Google Scholar]
- Tolete P, Knupp K, Karlovich M, Decarlo E, Bluvstein J, Conway E, et al. Lorcaserin therapy for severe epilepsy of childhood onset: a case series. Neurology 2018; 91: 837–9. [DOI] [PMC free article] [PubMed] [Google Scholar]
- Tso WW, Kwong AK, Fung CW, Wong VC.. Folinic acid responsive epilepsy in Ohtahara syndrome caused by STXBP1 mutation. Pediatr Neurol 2014; 50: 177–80. [DOI] [PubMed] [Google Scholar]
- Van Den Berghe G.Disorders of gluconeogenesis. J Inherit Metab Dis 1996; 19: 470–7. [DOI] [PubMed] [Google Scholar]
- Veggiotti P, Burlina A, Coppola G, Cusmai R, De Giorgis V, Guerrini R, et al. The ketogenic diet for Dravet syndrome and other epileptic encephalopathies: an Italian consensus. Epilepsia 2011; 52 Suppl 2: 83–9. [DOI] [PubMed] [Google Scholar]
- Vlodavsky E, Soustiel JF.. Immunohistochemical expression of peripheral benzodiazepine receptors in human astrocytomas and its correlation with grade of malignancy, proliferation, apoptosis and survival. J Neurooncol 2007; 81: 1–7. [DOI] [PubMed] [Google Scholar]
- Westerfield M, 1993. The zebrafish: a guide for the laboratory use of zebrafish (Brachydanio reriro). Eugene: Inst. of Neuroscience, University of Oregon. [Google Scholar]
- Westerfield M, 1995. The zebrafish book: a guide for the laboratory use of zebrafish (Brachydanio rerio). Eugene: University of Oregon press. [Google Scholar]
- Yang J, Kong X, Martins-Santos ME, Aleman G, Chaco E, Liu GE, et al. Activation of SIRT1 by resveratrol represses transcription of the gene for the cytosolic form of phosphoenolpyruvate carboxykinase (GTP) by deacetylating hepatic nuclear factor 4alpha. J Biol Chem 2009; 284: 27042–53. [DOI] [PMC free article] [PubMed] [Google Scholar]
- Zilberter Y, Zilberter M.. The vicious circle of hypometabolism in neurodegenerative diseases: ways and mechanisms of metabolic correction. J Neurosci Res 2017; 95: 2217–35. [DOI] [PubMed] [Google Scholar]
- Zon LI, Peterson RT.. In vivo drug discovery in the zebrafish. Nat Rev Drug Discov 2005; 4: 35–44. [DOI] [PubMed] [Google Scholar]
Associated Data
This section collects any data citations, data availability statements, or supplementary materials included in this article.
Supplementary Materials
Data Availability Statement
The data that support the findings of this study are available from the corresponding author, upon reasonable request.