Figure 1.
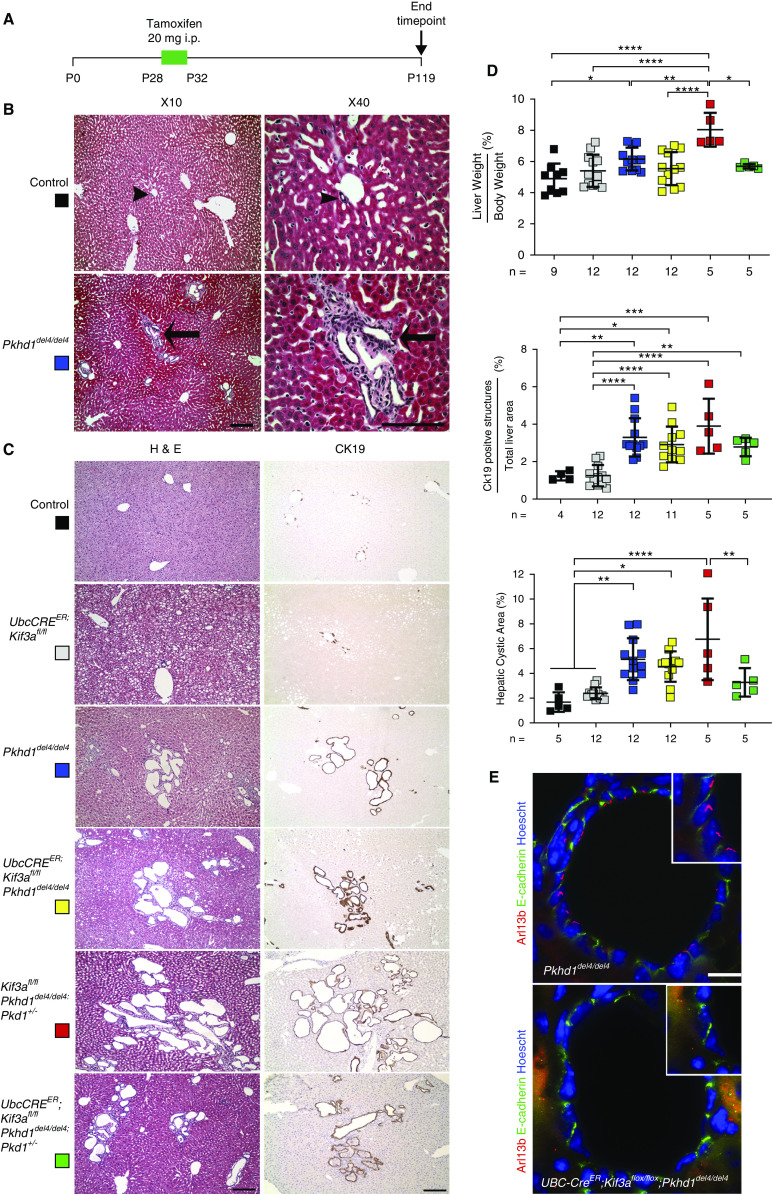
Inactivation of cilia does not affect cyst progression in Pkhd1del4/del4 livers. (A) Schematic diagram of the course of tamoxifen induction for cilia inactivation and study end point. i.p., intraperitoneal. (B) Histologic representation of littermate control (arrowheads) and Pkhd1del4/del4 (arrows) bile ducts at postnatal day 28 (P28) prior to inactivation of cilia. Pkhd1del4/del4 livers exhibit mild bile duct proliferation accompanied by von Meyenburg complexes indicated by arrows. Scale bars, 500 µm in 10× panel; 40 µm in 40× panel. (C) Representative hematoxylin and eosin (H&E)– and cytokeratin-19 (CK19)–stained sections show biliary epithelia of the indicated allelic combinations induced with tamoxifen from P28-32P and examined at 17 weeks of age. Single Kif3a knockouts (UBC-creER; Kif3a fl/fl; gray squares) show mild bile duct proliferation as previously described (16). Pkhd1del4/del4 animals have extensive bile duct cyst formation (blue squares), and double knockouts of Pkhd1 and Kif3a (UBC-creER; Kif3a fl/fl; Pkhd1del4/del4; yellow squares) showed no significant difference in cystic disease progression compared with Pkhd1del4/del4 alone. Representative images of livers from Kif3afl/fl; Pkhd1del4/del4; Pkd1+/− (red squares) show enhanced cystic disease progression due to reduced Pkd1 dosage. This incremental worsening is improved upon removal of cilia in UBC-creER; Kif3a fl/fl; Pkhd1del4/del4; Pkd1+/− (green squares). Scale bar, 500 µM. (D) Quantitation of differences in liver phenotypes at 17 weeks for the allele combinations in (C). The color squares correspond to the genotypes in (C). Pkhd1del4/del4 (blue squares) shows significant increase in liver weight-body weight ratio, CK19-positive population, and hepatic cystic area compared with littermate controls (black squares). Significant increase in CK19 population and hepatic cystic area was observed in Pkhd1del4/del4 livers compared with Ubc-creER; Kif3afl/fl livers (gray squares), but there was no difference with UBC-creER; Kif3afl/fl; Pkhd1del4/del4 (yellow squares) cilia and Pkhd1 double-knockout livers. Kif3afl/fl; Pkhd1del4/del4; Pkd1+/− (red squares) mice with reduced Pkd1 dosage have significantly increased liver weight/body weight relative to all other groups, and inactivation of cilia in these mice (UBC-creER; Kif3a fl/fl; Pkhd1del4/del4; Pkd1+/−; green squares) counteracts the effect of Pkd1 haploinsufficiency as indicated by significantly improved liver weight-body weight ratio and hepatic cystic area. Each square represents a single animal; both males and females were used. The absolute number of animals used for each genotype is displayed under the graph. Multiple group comparisons were performed using one-way ANOVA followed by Tukey multiple comparison test and are presented as the mean±SD. *P=0.05; **P=0.01; ***P<0.001; ****P<0.001. (E) Immunohistochemistry for Arl13b (red) and E-cadherin (green) in bile duct cysts from mice with loss of Pkhd1 alone or in combination with conditional inactivation of Kif3a at 17 weeks of age. Cilia were present in the cyst lining epithelia of the Pkhd1del4/del4 mutant but absent from the UBC-creER; Kif3afl/fl; Pkhd1del4/del4 cells. The nuclei are marked by Hoechst stain in blue. Scale bar, 100 µM.

