

Abstract

The conventional method of assigning formal oxidation states (FOSs) to metals and ligands is an important tool for understanding and predicting the chemical reactivity, in particular, in catalysis research. For complexes containing redox-noninnocent ligands, the oxidation state of the ligand can be ambiguous (i.e., their spectroscopic oxidation state can differ from the FOS) and thus frustrates the assignment of the oxidation state of the metal. A quantitative correlation between the empirical metric data of redox-active ligands and their oxidation states using a metrical oxidation state (MOS) model has been developed for catecholate- and amidophenoxide-derived ligands by Brown. In the present work, we present a MOS model for 1,4-diazabutadiene (DADn) ligands. This model is based on a similar approach as reported by Brown, correlating the intra-ligand bond lengths of the DADn moiety in a quantitative manner with the MOS using geometrical information from X-ray structures in the Cambridge Crystallographic Data Center (CCDC) database. However, an accurate determination of the MOS of these ligands turned out to be dependent on the coordination mode of the DAD2– moiety, which can adopt both a planar κ2-N2-geometry and a η4-N2C2 π-coordination mode in (transition) metal complexes in its doubly reduced, dianionic enediamide oxidation state. A reliable MOS model was developed taking the intrinsic differences in intra-ligand bond distances between these coordination modes of the DAD2– ligand into account. Three different models were defined and tested using different geometric parameters (C=C → M distance, M–N–C angle, and M–N–C–C torsion angle) to describe the C=C backbone coordination with the metal in the η4-N2-C2 π-coordination mode of the DAD2– ligand. Statistical analysis revealed that the C=C → M distance best describes the η4-N2-C2 coordination mode using a cutoff value of 2.46 Å for π-coordination. The developed MOS model was used to validate the oxidation state assignment of elements not contained within the training set (Sr, Yb, and Ho), thus demonstrating the applicability of the MOS model to a wide range of complexes. Chromium complexes with complex electronic structures were also shown to be accurately described by MOS analysis. Furthermore, it is shown that a combination of MOS analysis and FOD calculations provides an inexpensive method to gain insight into the electronic structure of singlet spin state (S = 0) [M(trop2dad)] transition-metal complexes showing (potential) singlet biradical character.
Short abstract
Assigning oxidation states to metals and ligands is an important tool for understanding and predicting the chemical reactivity. For complexes containing redox-noninnocent ligands, the oxidation state of the ligand can be ambiguous. We present a metrical oxidation state model for 1,4-diazabutadiene ligands, correlating the intra-ligand bond lengths with the oxidation state using information from X-ray structures. This model accounts for the difference in bond length distances between the different coordination modes of the fully reduced ligand.
1. Introduction
Assigning oxidation states to metals and ligands is an important tool in the field of inorganic chemistry to understand and predict the chemical reactivity. In particular, understanding the concepts of homogeneous catalysis strongly relies on electron counting and oxidation state assignments. The conventional method for assigning oxidation states concerns the use of formal oxidation states (FOSs), in which the ionic character of all bonds is exaggerated. This is a particularly useful tool for the bookkeeping of electrons in redox reactions. However, the FOS is not a measurable quantity but an axiomatic formalism, and in complexes that have electronic structures not properly described by an ionic approximation, the FOS does not reflect the real (spectroscopic) electronic density distribution of the complex. Limitations to the FOS concept have long been described in the literature, stemming from inconsistencies in FOS rules and problematic organometallic cases.1−3 In particular, redox-active ligands and complexes thereof have time and again proven to have electronic structures not accurately described by FOSs. The physical oxidation state of a metal can be thought of as a continuous electronic structure descriptor that reflects the electron density distribution around the metal center in a transition-metal complex.4 The physical (or spectroscopic) oxidation state of the metal center in a complex can be inferred through several spectroscopic methods, and only a multi-technique approach allows for a comprehensive understanding of the electronic structure. For the oxidation state of redox-active ligands, in particular, the geometric information obtained from crystal structures has been used to deduce the ligand oxidation state, and alternatively, the metal oxidation state. In practice, this is generally done by qualitatively comparing a newly acquired crystal structure with structures from the literature with known electronic structures.5 Statistical analysis of crystal structures is a growing field within chemistry and has particular strengths in highlighting trends that might not be visible by looking at a single crystal structure.6,7 More specifically, statistical research using the Cambridge Structural Database (CSD) has been used to enhance the chemical understanding of bond conformations,8,9 discover new bonding interactions,10 improve computational methods,11 and better understand metal–ligand interactions.12,13 In the case of redox-active ligands (or redox-noninnocent ligands), large literature surveys in combination with computational methods have been used to gain insight into continuous bond deformations as a function of oxidation state.14 In 2012, a seminal article by Brown proposed important steps for quantifying the relationship between the geometric information of catecholate and amidophenoxide ligands through defining a metrical oxidation state (MOS), which is a continuous (integer or non-integer) variable describing the oxidation state of the ligand.15 By using least-squares fitting of ligand bond lengths, the oxidation state of a newly acquired crystal structure can be determined without having to resort to literature comparison with selected structures. Following this approach, Brown quantified the well-known intra-ligand metrical changes in catecholate and amidophenoxide ligands within a single parameter, and the thus-obtained MOS provides a convenient handle to assign ligand oxidation states in a quantitative manner. MOS calculations were subsequently used to confirm various oxidation state assignments of newly synthesized complexes.16
Herein, we present the development of a related model for redox-active 1,4-diazabutadiene-type ligands (Figure 1a).
Figure 1.

(a) Accessible oxidation states of the diazabutadiene ligand framework. Neutral diimine (left), one-electron reduced semi-iminato (middle), and fully reduced enediamide (right) forms. (b) κ2-N2 (left) and η4-N2C2 (right) binding modes of the fully reduced enediamide form. R = H, CH3.
The treatment of the fully reduced enediamide form is of particular interest as it is known to bind in both κ2-N2 and η4-N2C2 manners (Figure 1b). Rearrangement from σ- to π-coordination has been shown to facilitate elementary steps in catalytic cycles of DAD2– complexes.17,18 These geometrical differences also give rise to differences in the intra-ligand bond lengths, which is of prime importance for the MOS model developed in this paper. As such, we evaluated various geometric descriptors for the treatment of both binding modes in a single model. The flexible π-coordination of the enediamide C=C backbone leads to a distortion in the planarity of the ligand, and subsequently, we hypothesized that the C=C → M distance, M–N–C bond angle, and M–N–C–C torsion angles could be valid descriptors of the η4-N2C2 binding mode.
2. Methods
In order to establish a MOS model for the DAD ligand framework, an initial data set was created using complexes reported in the Cambridge Structural Database (CSD) for which the physical oxidation state is unambiguously characterized in the available literature. Particular care was taken in selecting a wide variety of complexes to reduce any bias in the data set. Figure 2 contains a list of all metal centers with at least one entry in the final data set. A consistent set of criteria was set up in order to ensure the integrity of the data set, excluding complexes in which the ligand framework coordinates to multiple metal centers, metal cluster compounds, and complexes in which the DAD moiety is part of a higher denticity ligand. X-ray structures with unusually large ellipsoids, metal centers on symmetry axes, or other crystallographic issues such as checkCIF alerts were manually excluded. The geometric parameters of these complexes were collected from the Cambridge Structural Database (CSD) version 5.41 (November 2019) using the ConQuest tool version 2.0.4 (build 270009).19,20 This provided 147 crystallographic distinct entries for neutral diimine ligands (DAD0), 43 entries for one-electron reduced semi-iminato ligands (DAD1–), and 64 entries for fully reduced enediamide ligands (DAD2–).
Figure 2.

Metal complexes included in the training data set containing 1,4-diazabutadiene ligands highlighted in blue.
The average C–N and C–C bond lengths of DAD ligands in the selected complexes were plotted as a function of the reported DADn– ligand oxidation states, and subsequently, fitted to a linear relationship for the C–N bond length and a quadratic relationship for the C–C bond length (Figure 3). A comparison between the bond lengths of DAD ligands with methyl groups and hydrogens on the backbone revealed no significant influence on the C–N and C–C bond lengths, which was confirmed (p < 0.05) by Grubbs tests. The MOS of each ligand was calculated by unweighted least-squares fitting (for details, see the Supporting Information), minimizing the sum of squares of the difference between the observed bond lengths and the calculated bond lengths from the functions derived from the training set. The minimization of the least-squares fitting was applied with the Levenberg–Marquardt algorithm, as presented in Microsoft Excel. To determine the error of the calculated MOS values, an estimated standard deviation (esd) was computed for each structure. The esd values were calculated using the typical formula for the estimated standard deviation with an additional factor for the propagation of error, which was based upon the standard error of the observed bond lengths. The calculated MOS values were tested on normality by Shapiro–Wilk Extended (SWE) tests.
Figure 3.

DAD bond distances as a function of reported DAD ligand oxidation states. Exact values of the C–C and C–N bond lengths are shown as a function of literature-reported ligand oxidation state.
The calculated MOS values were evaluated on the basis of their distribution around and deviation from the literature-assigned oxidation states. All calculated MOS values can be found in the Supporting Information spreadsheet “MOSCalculator.xlsx”, and all MOS distribution histograms and box plots can be found in the Supporting Information. For none of the models, any overlap between the calculated MOS values of the DADn ligands (n = 0, 1–, 2−) is visible in the box plots, which was confirmed (p < 0.05) by Grubbs tests. The spread of the neutral diimine (DAD0) and one-electron reduced semi-iminato (DAD1–) ligand is small, and the data sets do not overlap at all (Figure 4). The MOS calculated for the DAD0 complexes in the data set are found in a range between +0.3 and −0.4, with a clear peak at 0 and most complexes having a MOS between +0.1 and −0.1. The MOS calculated for the DAD1– complexes in the data set are found in a range between −0.6 and −1.3, with a clear peak at −1 and most complexes having a MOS between −1.1 and −0.9. These data suggest that most DAD0 and DAD1– ligands have integer oxidation states (n = 0 or n = −1), with only a few exceptions pointing to possible non-integer ligand oxidation states. While the data set of the fully reduced DAD2– ligand does not overlap with the DAD1– data set (Figure 4), it is clear that the spread is broader and differs for each geometry descriptor. The MOS calculated for the DAD2– complexes in the data set are found in a range between −1.5 and −2.6, in two sections: a data section between −1.5 and −2.0 (most data between −1.6 and −1.8) and a data section between −2.0 and −2.6 (most data between −2.1 and −2.3). The broader spread of calculated (uncorrected) MOS observed for the fully reduced DAD2– ligand is not (primarily) caused by a larger number of complexes with non-integer ligand oxidation states (i.e., deviations from n = −2), but rather to a distribution of DAD2– complexes in different binding modes. A majority of complexes are with a κ2-N2-DAD2– binding mode, a smaller number of complexes with a η4-N2C2-DAD2– binding mode, and some in-between, each giving rise to MOS values deviating somewhat from −2. This leads to deviations in the calculated MOSs if left untreated, as the intra-ligand bond distances of η4-N2C2-DAD2– ligands are quite different from those in the κ2-N2-DAD2– ligands (especially the C–N distances, see Table 1). This would lead to overestimation of the MOS of the κ2-N2-DAD2– ligands and underestimation of the MOSs of the η4-N2C2-DAD2– ligands. Hence, we decided to modify the MOS model to correct for this fact, in which the MOS of the DAD2– ligand is calculated based on a weighted contribution of κ2-N2- and η4-N2C2 binding modes (see below). Understanding the flexible backbone of the DAD2– ligand is of particular interest as π-coordination of the C=C backbone has been shown to play a critical role in lowering the activation barriers in catalysis.17,18
Figure 4.
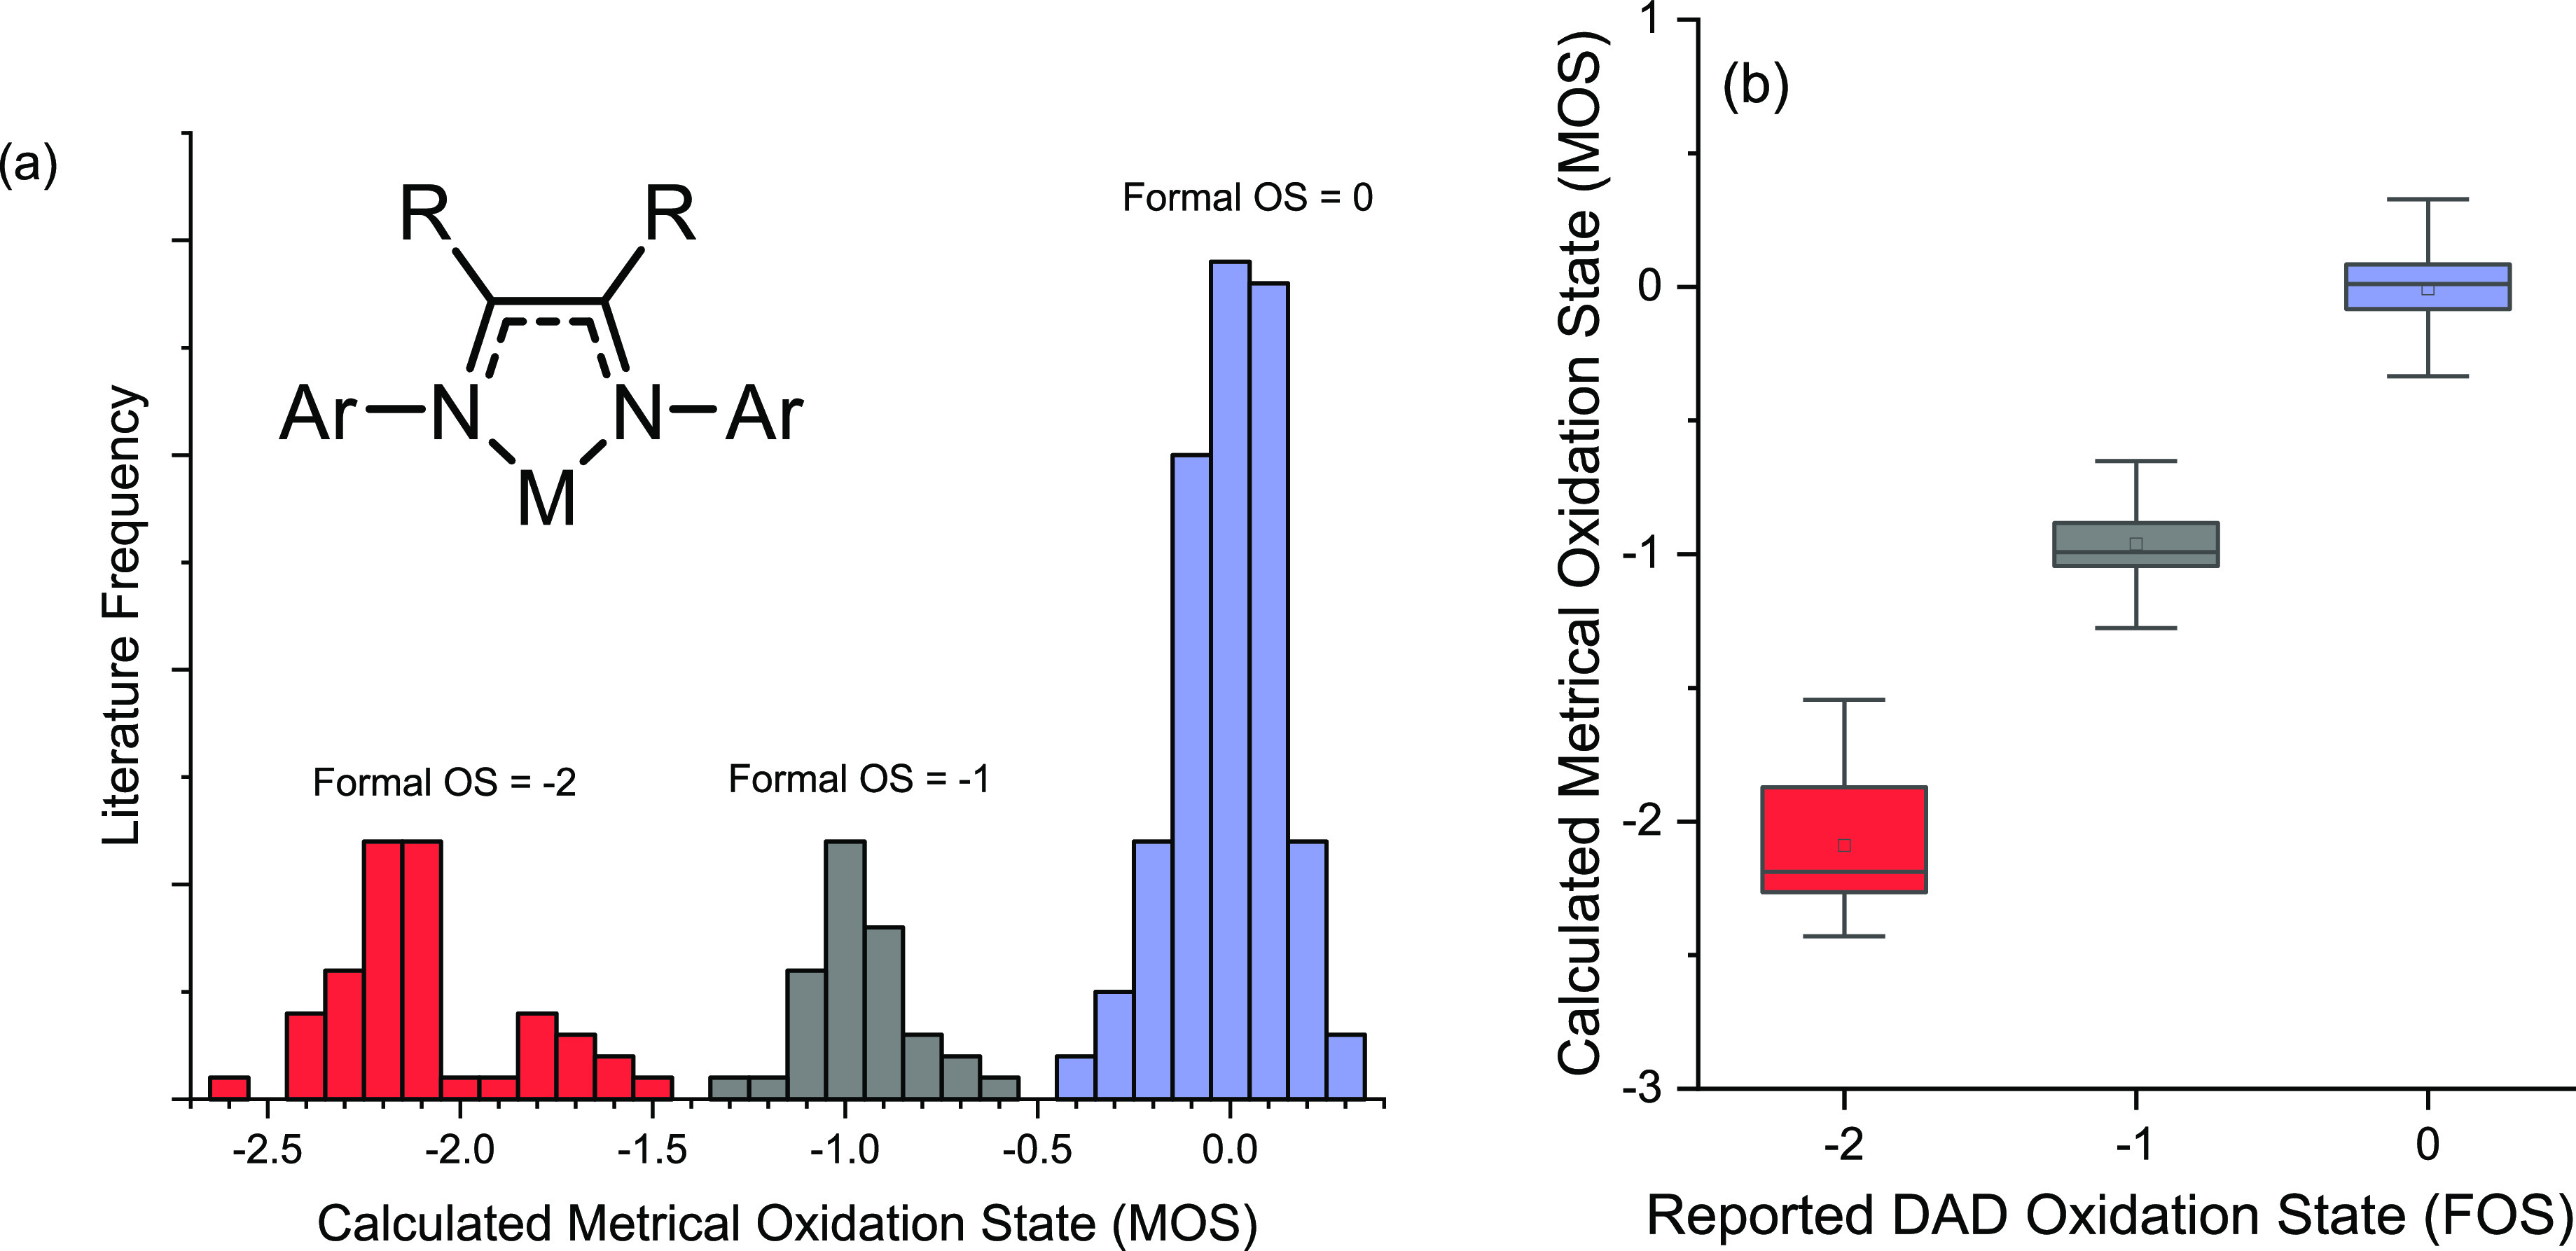
Distribution of calculated MOSs for the initial data set without separate treatment of the enamide κ2-N2-DAD2– and η4-N2C2-DAD2– binding modes as (a) histogram and (b) box plot (MOS = 0: range between +0.3 and −0.4; MOS = −1: range between −0.6 and −1.3; MOS = −2: a broad range between −1.5 and −2.6, split into two smaller distributions; one distribution between −1.5 and −2.0 and another between −2.0 and −2.6).
Table 1. Cutoff Values and the Resulting Average Bond Lengths of the DAD2– Ligand in η4-and κ2-Binding Modes Found in the Data Set.
| descriptor | C=C → M distance (Å) | M–N–C angle (deg) | M–N–C–C torsion angle (deg) |
|---|---|---|---|
| cutoff value (davg) ± esdd | <2.46 ± 0.09: η4-N2C2 | <98.96 ± 2.95: η4-N2C2 | <19.91 ± 3.71: κ2-N2 |
| >2.46 ± 0.09: κ2-N2 | >98.96 ± 2.95: κ2-N2 | >19.91 ± 3.71: η4-N2C2 | |
| Resulting Average Bond Distances Using the above Different Cutoff Parameters: | |||
| η4 C–N average (Å)a | 1.3958 | 1.4051 | 1.4070 |
| κ2 C–N average (Å)a | 1.4173 | 1.4180 | 1.4165 |
| η4 C=C average (Å)a | 1.3743 | 1.3712 | 1.3701 |
| κ2 C=C average (Å)a | 1.3618 | 1.3560 | 1.3530 |
Averaged intra-ligand bond distances of the DAD2– ligand in the assigned η4 and κ2 binding modes, depending on the selections determined by the three indicated descriptors and cutoff values as listed at the top of each column.
For the neutral diimine (DAD0) and mono-anionic semi-iminato (DAD1–) oxidation states of the ligand, no special data treatment was required, as for those, only the κ2-N2 binding mode is observed.21 The geometrical parameters that were considered relevant to capture the η4-N2C2-DAD2– geometries are the C=C centroid-to-metal distance (C=C → M), the M–N–C bond angle, and the M–N–C–C torsion angle. The M–C–C–N torsion angle provided results nearly identical to the M–N–C–C torsion angle. These parameters were collected for all structures, and their distributions were fitted to two Gaussian curves, from which a π-coordination cutoff value davg was determined (fitted curves are shown in Supporting Information S1 and cutoff values are presented in Table 1) with an accompanying estimated standard deviation based on the pooled variance. Based on the cutoff value, the DAD2– data set was split based on the binding modes leading to two different average C–N and C=C bond lengths (Figure 5). Each cutoff value led to significantly different averaged C–C and C–N bond length data sets (p < 0.05) for the two different DAD2– binding modes.
Figure 5.

(a) Distribution of calculated MOSs using the C=C → M distance as a weight factor to describe enamide κ2-N2-DAD2– and η4-N2C2-DAD2– binding modes. (b) Fitted distributions of the C=C → M distance in η4-N2C2-coordinated and κ2-N2-coordinated structures.
Correlations between the DAD intra-ligand bond length and the reported DADn– oxidation states were again made using a linear relationship for the C–N bond lengths and a quadratic relationship for the C=C bond lengths. This led to two separate fits for the κ2-and η4 binding modes for each geometric descriptor (see Supporting Information S2), which were incorporated into a single MOS calculation using the cumulative distribution function of the geometric descriptors (bond length, bond angle, and torsion angle) as a weight factor WF according to eq 1. This weight factor determines what percentage of κ2 and η4 fit is incorporated into the MOS calculation. Other ways of weighing the κ2 and η4 models were evaluated as well, such as taking the weighted descriptor average and using a discrete cutoff value, but the sigmoidal function best describes the continuous physical picture of π-coordination.
| 1 |
WF = weighting factor; esdd = estimated standard deviation of geometric descriptor; dobs = observed descriptor value; and davg = descriptor cutoff value.
In order to evaluate the performance of the geometry descriptors to describe the η4-N2C2-DAD2– coordination mode with C=C → M backbone coordination, two MOS performance criteria were evaluated (Table 2) as follows: (1) the average MOS value, which describes the accuracy of the model and should be as close to −2.000 as possible and (2) the standard deviation describing the precision. While all descriptors provide a comparable accuracy, the precision of C=C → M distance as a descriptor outperforms the M–N–C angle and the M–N–C–C torsion angle, which is also visible in the histograms (Supporting Information S3).
Table 2. Performance Criteria of Selected Geometric Descriptors.
| descriptor | average MOS in the DAD2– data set | estimated standard deviation of the MOS |
|---|---|---|
| C=C → M distance | –2.020 | 0.16 |
| M–N–C angle | –2.025 | 0.23 |
| M–N–C–C torsion angle | –2.026 | 0.24 |
Prior to this investigation, we expected all complexes containing a bent DAD ligand to contain a metal–backbone interaction. The difference in the precision of the models prompted us to investigate which complexes were selected as η4 by their deviation from planarity but still had a large C=C to metal distance. The discrepancy in the descriptor performance seemed to stem from a set of samarium and yttrium complexes which contain not only a large C=C → M distance (2.63 ± 0.08 Å) but also a bent ligand (ω = 33.8 ± 3.6°). Put into chemical terms, this means that judging from the bond distance, the DAD2– ligand in these complexes is ligated in the κ2 binding mode, but judging from the ligand planarity, the enediamide ligand is coordinated in η4 fashion. Looking at the average C–N (1.420 Å) and C=C (1.366 Å) bond lengths, these complexes contain ligands that are described as predominantly κ2. We propose that either a weak C=C → M interaction causes a large deviation of ligand planarity (e.g., due to the large ionic radii of these metals) or other effects such as crystal packing can cause bending of the DAD2– ligand. The former hypothesis is supported by the larger distribution of interference of the C=C → M distances (27% vs 5%), making it a more continuous descriptor compared to the M–N–C–C torsion angle, which is either flat (6°) or bent (34°). However, solid-state crystal packing effects cannot be ruled out as the cause of a large torsion angle. Based on the performance metrics and the MOS normality, the distance between the C=C bond and the metal center best describes the metal–backbone interaction. Satisfyingly, this is in agreement with chemical intuition. The average C=C → M distance for the η4-N2C2-DAD2–coordinated structures is 2.33 ± 0.07 Å. As such, this statistical analysis allows us to put a number on C=C → M π-coordination of the DAD2– ligands, which could be of broader interest (Figure 5).
Deviations of the metrical from the literature-assigned oxidation state greater than 0.25 units are rare (4.2%), and the average residual sum of squares for each model was on the order of 10–3, confirming the efficacy of describing the ligand oxidation state through the bond lengths. This survey also provided the average C–C and C–N bond lengths for the ligand framework depending on the ligand oxidation state and binding mode, which seems largely independent of the metal oxidation state and is tabulated in the MOS model based on N-aryl substituted DAD ligands and as such should provide the most accurate results for aryl-substituted DAD ligands. A random sample of cyclohexyl-substituted DAD ligands was evaluated (see Supporting Information S6), and while the MOS analysis provided accurate assignment of the oxidation states for those complexes, we expect the most reliable results to be achieved for N-aryl-substituted DAD ligands.
3. Results and Discussion
With the MOS model in hand, which accurately describes both η4 and κ2 binding modes of DAD2– and the three oxidation states of the DAD ligand, the next step was to validate the model with various compounds outside of the training set. When developing the training set, care was taken to incorporate a wide range of elements to create a model applicable to all DAD complexes regardless of the metal center. In order to validate whether the developed model provides satisfactory results for any metal, the MOSs for six DAD complexes of elements not contained within the training set (SrII, HoIII, and YbIII) were calculated (Figure 6). The computed MOS values all provide results well within the ±0.3 range of the literature-assigned oxidation states. The two ytterbium complexes containing a DAD2– ligand are described in the literature as having a weak interaction with the C=C backbone.23 From the C=C → M distance (2.530 and 2.536 Å, respectively), it is expected that there is a slight interaction that influences the C=C and C–N bond lengths. Indeed, the weight factor (0.78 and 0.80) indicates that these complexes are predominantly κ2-N2-DAD2–. For comparison, we calculated the MOS value with WF = 1 to validate the approach of using the C=C → M distance to incorporate weak backbone interactions into the MOS model. This indeed provided MOS values further away from the literature-assigned oxidation state, which shows that even when the backbone–metal interaction is weak, the sigmoidal weight function improves the accuracy of the MOS calculation.
Figure 6.

Sr, Ho, and Yb complexes containing the DADn moiety.22,23 For the holmium complex, the siloxane cluster is not shown (dipp = 2,6-diisopropylphenyl; thf = tetrahydrofuran). The calculated MOSs are listed next to the ligand, with the model error in brackets. Crystallographic inequivalent entries were calculated separately, and their MOS values were averaged and the error in the model was pooled.
In the amidophenoxide training set of Brown, three complexes with a ligand formal oxidation state of −1.5 were included, which can be interpreted as two ligands with an overall charge of −3 containing a radical delocalized over both ligands. In our studies, we only came across a single complex, which can be described as a complex with mixed-oxidation state DADn– ligands. The anionic chromium(II) complex shown in Figure 7a was published in 2008 by Theopold et al., who characterized the electronic structures of several chromium complexes in detail.24 For [Cr(dippDAD)2][Li(thf)4], a quartet spin ground state was found by magnetic measurements, for which DFT analysis revealed a Cr(II) center with one ligand-centered radical anion. This leads to an overall description of the complex as containing two DAD ligands with an overall cumulative oxidation state of −3, and thus individually −1.5, as the orbitals are not localized on either ligand. The mean MOS value of this complex calculated with our model (−1.65 ± 0.11) is in excellent agreement with this description. Such delocalization is not general for homoleptic DAD complexes, as MOS investigation for the square pyramidal Th(IV) complex shown in Figure 7b revealed one DAD1– and one DAD2– ligand showing that it is also possible to have the radical centered on one of the two ligands.25
Figure 7.

(a) Homoleptic chromium(II) DAD complex [Cr(dippDAD)2][Li(thf)4] best described as the ligand oxidation state DAD1.5–. (b) Homoleptic Th(IV) DAD complex [Th(MesDAD)2I] best described as having one semi-iminato and one enediamide ligand.
While not enough complexes were available to reliably include the fractional oxidation states in the training set, we postulate that the model is robust enough to describe such cases.
When developing the training set, we opted to leave out a set of five semi-iminato chromium(II) complexes due to the potential semi-iminato/enediamide CrII/III ambiguity and only include chromium(III) complexes. However, the electronic state of these five structures is strongly supported by spectroscopic and computational techniques as a CrII/DAD1– oxidation state assignment.26 The mean MOS values calculated for the nine crystallographically inequivalent DAD ligands (−1.15 ± 0.21) are in satisfactory agreement with the assignment of these complexes as CrII/DAD1–.
Aluminum complexes were not included in the training set. When we applied the MOS model for 59 crystallographically inequivalent aluminum DAD complexes in the CSD (see Supporting Information S5), we found satisfactory results for DAD0 (16 entries, average MOS: 0.00 ± 0.14) and DAD1– (10 entries, average MOS: −0.99 ± 0.21) ligands. However, for DAD2– ligands, a deviation toward somewhat more negative values (33 entries, average MOS: −2.30 ± 0.14) was found. As this behavior is not seen for other p-block metals such as gallium, we postulate this deviation to be due to bond lengths in these complexes more closely resembling those of organic compounds (C–N 1.43 ± 0.01 in AlIII/DAD2– vs 1.40 ± 0.01 in other metal DAD complexes and 1.47 for methylamine).
3.1. Electronic Structure of [M(trop2dad)] Complexes
Due to the exclusion of DAD ligands with a higher denticity from the MOS training set, the trop2dad ligands were excluded from the training set. However, this ligand has seen widespread adoption in iron and ruthenium hydrogenation chemistry, thus an evaluation of the electronic structure of known [M(trop2dad)] complexes through their MOSs was deemed interesting. Some of these complexes in their singlet spin state (S = 0) are known to contain significant singlet biradical character to their electronic structures,17 thus complicating the DAD ligand oxidation state assignment. We therefore sought to combine the information gained from MOS analysis with inexpensive fractional occupation density (FOD) analysis on the crystal structures of these complexes (see Table 4). FOD calculations show a potential singlet biradical character (and/or significant π-back donation) in the electronic ground state arising from static electron correlation between the metal and ligand-centered (partially) occupied and unoccupied molecular orbitals (see Supporting Information S6 for details). Many singlet spin state (S = 0) [M(trop2dad)] complexes show singlet biradical contributions to their ground-state wavefunction and were shown to be best described with resonance structures involving ligand oxidation states between DAD0 and DAD2–, and/or DAD1– contributions (see Figure 1A). In good agreement, our MOS calculator predicts fractional oxidation state values for many of these complexes.
Table 4. MOS and NFOD Analysis of Various [M(trop2dad)] Complexes.
| entry | CSD ID | spin | molecular formula | NFOD | MOS |
|---|---|---|---|---|---|
| 1 | HEVWOW | S = 0 | [Ru(trop2dad) (H)]– | 0.78 | –1.22 |
| 2 | YARYAU | S = 0 | [Ru(trop2dad) (H)]– | 0.83 | –1.35 |
| 3 | HEZXIW | S = 0 | [Ru(trop2dad) (thf)] | 0.97 | –0.91 |
| 4 | HEVXIR | S = 0 | [Ru(trop2dad) (PPh3)] | 0.87 | –1.16 |
| 5 | IKUFOJ | S = 0 | [Rh(trop2dad)]+ | 0.90 | –0.24 |
| 6 | JUXPAV | S = 0 | [Fe(trop2dad) (CH3CN)] | 1.02 | –0.97 |
| 7 | JUXPEZ | S = 0 | [Fe(trop2dad) (PPh3)] | 1.12 | –0.96 |
| 8 | JUXPID | S = 0 | [Fe(trop2dad) (P(OMe)3)] | 0.82 | –0.97 |
Table 3. Average Bond Lengths for C–C/C=C and C–N Bonds in Metal DADn Complexes as a Function of Literature-Assigned Ligand Oxidation States.
| ligand oxidation state n (number of entries in the CSD) | C–N average ± stdev | C–C/C=C ± stdev |
|---|---|---|
| 0 (147) | 1.2853 ± 0.0075 | 1.4932 ± 0.017 |
| –1 (43) | 1.3420 ± 0.0088 | 1.4060 ± 0.012 |
| –2 η4 (25) | 1.3958 ± 0.010 | 1.3743 ± 0.009 |
| –2 κ2 (39) | 1.4173 ± 0.011 | 1.3618 ± 0.013 |
From the FOD analysis, it is clear that all of these singlet (S = 0) ground-state complexes indeed have a large (probability of having) singlet biradical character (Table 4, entries 2–4), which is strongly indicative of substantial π-delocalization, metal-to-ligand (single) electron transfer, and/or metal–ligand biradical character. The large NFOD values correspond to DAD π-type “hot electrons” in the FOD plots, thus confirming substantial π-electron delocalization contributions. This can be described by strong π-back donation (contributions of both DAD0 and DAD2– to the ground state) and/or formation of a DAD1– ligand antiferromagnetically coupled to a metal-centered spin.27 Both descriptions result in large NFOD values. However, the absolute NFOD value in itself does not tell us whether these “hot electrons” are primarily located on the metal or rather at the ligand and hence does not discriminate between the relative contributions of DAD0 and DAD2– ligand oxidation states. For that, the MOS is a better measure, and the combined MOS and FOD results provide a fast and easy–to-use method to probe the electronic structure of singlet spin state (S = 0) [M(trop2dad)] complexes.
The electronic structure of most of these [M(trop2dad)] complexes seems to be best described by contributions from both DAD0 and DAD2– resonance structures (Figure 1a), leading to a fractional MOS close to −1.28,29 The results in Table 4 suggest that, for some complexes, the DAD2– resonance structure dominates somewhat over DAD0 (entries 1 and 2), while for others they contribute nearly equally (DAD1–) (entries 3 and 4). For [Rh(trop2dad)]+, the DAD0 resonance structure clearly dominates (entry 5), which makes sense given the cationic charge of the complex and the higher electronegativity of Rh. Notably, for all three neutral, formal Fe(0) complexes [Fe(trop2dad) (L)] in Table 4, the MOSs are almost exactly −1, regardless of ligand L. This suggests that these systems are perhaps best described as DAD1– ligands that are (strongly) anti-ferromagnetically coupled to Fe(I)-based spins, but equal contributions of DAD0 and DAD2– resonance structures cannot be fully excluded.27 In any case, the FOD analysis results support the robustness of the MOS calculator, thus allowing an accurate description of the ligand oxidation state even in difficult cases with strong static electron correlation effects.
4. Conclusions
The relationship between the ligand oxidation state and bond lengths of the backbone of the diazabutadiene (DAD) framework has been evaluated quantitatively through a MOS model similar to the one developed by Brown for amidophenoxides and catecholates. Several descriptors were evaluated to describe the labile coordination of the C=C backbone, and the bond centroid to metal distance was found to be more accurate and precise than the bond angles within the DAD ligand. As a small backbone interaction can already cause a large bending of the ligand, the more continuous nature of the C=C to metal distance better describes the highly flexible interaction. From the statistical analysis, the average C=C → M distance for π-coordination of the enediamide ligand was found to be 2.33 ± 0.07 Å. The developed model was subsequently used successfully on complexes with metals not contained in the training set, showing the generality of the MOS model. Investigation of a single chromium(II) complex with DAD ligands in the −1.5 oxidation state shows that deviations of more than 0.3 from an integer MOS value indicate a deviation from an integer physical oxidation state. The combination of FOD calculations and MOS analysis provides an insight into complexes with strong π-backdonation and/or open-shell electronic structures, and as such, the MOS calculator was shown to accurately describe the ligand oxidation states even for difficult cases with strong static electron correlation effects. The MOS calculator thus provides a fast and accessible tool to understand the electronic structure of several DAD complexes.
Acknowledgments
This work was financially supported by the Advanced Research Center for Chemical Building Blocks (ARC-CBBC, project 2018.015.C) which is co-financed by the Netherlands Organization for Scientific Research (NWO). We thank Nicole S. van Leeuwen for useful discussion and support.
Supporting Information Available
The Supporting Information is available free of charge at https://pubs.acs.org/doi/10.1021/acs.inorgchem.0c03685.
Author Present Address
† V.S.: Inorganic Systems Engineering, Department of Chemical Engineering, Delft University of Technology, Van der Maasweg 9, Delft 2629 HZ, Netherlands
Author Contributions
The manuscript was written through contributions of all authors. All authors have given approval to the final version of the manuscript. VS carried out DFT calculations and FOD analysis.
The authors declare no competing financial interest.
Supplementary Material
References
- Jorgensen C. K.Oxidation Numbers and Oxidation States; Springer Science & Business Media: Berlin, DE, 2012. [Google Scholar]
- Lyaskovskyy V.; De Bruin B. Redox Non-Innocent Ligands: Versatile New Tools to Control Catalytic Reactions. ACS Catal. 2012, 2, 270–279. 10.1021/cs200660v. [DOI] [Google Scholar]
- Steinborn D. The Concept of Oxidation States in Metal Complexes. J. Chem. Educ. 2004, 81, 1148–1154. 10.1021/ed081p1148. [DOI] [Google Scholar]
- Butschke B.; Fillman K. L.; Bendikov T.; Shimon L. J. W.; Diskin-Posner Y.; Leitus G.; Gorelsky S. I.; Neidig M. L.; Milstein D. How Innocent Are Potentially Redox Non-Innocent Ligands? Electronic Structure and Metal Oxidation States in Iron-PNN Complexes as a Representative Case Study. Inorg. Chem. 2015, 54, 4909–4926. 10.1021/acs.inorgchem.5b00509. [DOI] [PubMed] [Google Scholar]
- Léonard N. G.; Yruegas S.; Ho S. C.; Sattler A.; Bezdek M. J.; Chirik P. J. Synthesis of Cationic, Dimeric α-Diimine Nickel Hydride Complexes and Relevance to the Polymerization of Olefins. Organometallics 2020, 39, 2630–2635. 10.1021/acs.organomet.0c00257. [DOI] [Google Scholar]
- Cole J. C.; Wiggin S.; Stanzione F. New Insights and Innovation from a Million Crystal Structures in the Cambridge Structural Database. Struct. Dynam. 2019, 6, 054301. 10.1063/1.5116878. [DOI] [PMC free article] [PubMed] [Google Scholar]
- Taylor R.; Wood P. A. A Million Crystal Structures: The Whole Is Greater than the Sum of Its Parts. Chem. Rev. 2019, 119, 9427–9477. 10.1021/acs.chemrev.9b00155. [DOI] [PubMed] [Google Scholar]
- Rahim A.; Saha P.; Jha K. K.; Sukumar N.; Sarma B. K. Reciprocal Carbonyl–Carbonyl Interactions in Small Molecules and Proteins. Nat. Commun. 2017, 8, 78. 10.1038/s41467-017-00081-x. [DOI] [PMC free article] [PubMed] [Google Scholar]
- Reid R. C.; Yau M.-K.; Singh R.; Lim J.; Fairlie D. P. Stereoelectronic Effects Dictate Molecular Conformation and Biological Function of Heterocyclic Amides. J. Am. Chem. Soc. 2014, 136, 11914–11917. 10.1021/ja506518t. [DOI] [PubMed] [Google Scholar]
- Bauzá A.; Mooibroek T. J.; Frontera A. The Bright Future of Unconventional σ/π-Hole Interactions. ChemPhysChem 2015, 16, 2496–2517. 10.1002/cphc.201500314. [DOI] [PubMed] [Google Scholar]
- Riniker S.; Landrum G. A. Better Informed Distance Geometry: Using What We Know To Improve Conformation Generation. J. Chem. Inf. Model. 2015, 55, 2562–2574. 10.1021/acs.jcim.5b00654. [DOI] [PubMed] [Google Scholar]
- Welch A. What Can We Learn from the Crystal Structures of Metallacarboranes?. Crystals 2017, 7, 234. 10.3390/cryst7080234. [DOI] [Google Scholar]
- Magubane M. N.; Nyamato G. S.; Ojwach S. O.; Munro O. Q. Structural, Kinetic, and DFT Studies of the Transfer Hydrogenation of Ketones Mediated by (Pyrazole)Pyridine Iron(II) and Nickel(II) Complexes. RSC Adv. 2016, 6, 65205–65221. 10.1039/c6ra12788f. [DOI] [Google Scholar]
- Budzelaar P. H. M.; De Bruin B.; Gal A. W.; Wieghardt K.; van Lenthe J. H. Metal-to-Ligand Electron Transfer in Diiminopyridine Complexes of Mn–Zn. A Theoretical Study. Inorg. Chem. 2001, 40, 4649–4655. 10.1021/ic001457c. [DOI] [PubMed] [Google Scholar]
- Brown S. N. Metrical Oxidation States of 2-Amidophenoxide and Catecholate Ligands: Structural Signatures of Metal-Ligand π Bonding in Potentially Noninnocent Ligands. Inorg. Chem. 2012, 51, 1251–1260. 10.1021/ic202764j. [DOI] [PubMed] [Google Scholar]
- Cameron L. A.; Ziller J. W.; Heyduk A. F. Near-IR absorbing donor-acceptor ligand-to-ligand charge-transfer complexes of nickel(ii). Chem. Sci. 2016, 7, 1807–1814. 10.1039/c5sc02703a. [DOI] [PMC free article] [PubMed] [Google Scholar]
- Sinha V.; Trincado M.; Grützmacher H.; de Bruin B. DFT Provides Insight into the Additive-Free Conversion of Aqueous Methanol to Dihydrogen Catalyzed by [Ru(trop2dad)]: Importance of the (Electronic) Flexibility of the Diazadiene Moiety. J. Am. Chem. Soc. 2018, 140, 13103–13114. 10.1021/jacs.8b09011. [DOI] [PMC free article] [PubMed] [Google Scholar]
- Nishiyama H.; Ikeda H.; Saito T.; Kriegel B.; Tsurugi H.; Arnold J.; Mashima K. Structural and Electronic Noninnocence of α-Diimine Ligands on Niobium for Reductive C-Cl Bond Activation and Catalytic Radical Addition Reactions. J. Am. Chem. Soc. 2017, 139, 6494–6505. 10.1021/jacs.7b02710. [DOI] [PubMed] [Google Scholar]
- Allen F. H. The Cambridge Structural Database: A Quarter of a Million Crystal Structures and Rising. Acta Crystallogr., Sect. B: Struct. Sci. 2002, 58, 380–388. 10.1107/s0108768102003890. [DOI] [PubMed] [Google Scholar]
- Bruno I. J.; Cole J. C.; Edgington P. R.; Kessler M.; Macrae C. F.; McCabe P.; Pearson J.; Taylor R. New Software for Searching the Cambridge Structural Database and Visualizing Crystal Structures. Acta Crystallogr., Sect. B: Struct. Sci. 2002, 58, 389–397. 10.1107/s0108768102003324. [DOI] [PubMed] [Google Scholar]
- One semiiminato (−1) structure with a coordinated backbone was found, CCDC ID: 971183.
- Lorenz V.; Hrib C. G.; Grote D.; Hilfert L.; Krasnopolski M.; Edelmann F. T. Diazadiene Complexes of the Heavy Alkaline-Earth Metals Strontium and Barium: Structures and Reactivity. Organometallics 2013, 32, 4636–4642. 10.1021/om400622d. [DOI] [Google Scholar]
- Trifonov A. A.; Borovkov I. A.; Fedorova E. A.; Fukin G. K.; Larionova J.; Druzhkov N. O.; Cherkasov V. K. Ytterbocenes as One- and Two-Electron Reductants in Their Reactions with Diazadienes: YbIII Mixed-Ligand Bent-Sandwich Complexes Containing a Dianion of Diazabutadiene. Chem.—Eur. J. 2007, 13, 4981–4987. 10.1002/chem.200601481. [DOI] [PubMed] [Google Scholar]
- Kreisel K. A.; Yap G. P. A.; Theopold K. H. Synthesis, Characterization, and Electronic Structure of Diimine Complexes of Chromium. Inorg. Chem. 2008, 47, 5293–5303. 10.1021/ic800302w. [DOI] [PubMed] [Google Scholar]
- Mrutu A.; Barnes C. L.; Bart S. C.; Walensky J. R. Bringing Redox Reactivity to a Redox Inactive Metal Center - E-I (E = C, Si) Bond Cleavage with a Thorium Bis(α-diimine) Complex. Eur. J. Inorg. Chem. 2013, 4050–4055. 10.1002/ejic.201300390. [DOI] [Google Scholar]
- CCDC identifiers: QASREJ, NAYSUD, EFEFIF, EFEFUR, KIZXOI.
- In a post-HF configuration interaction description, an electronic structure with nearly equal contributions of DAD0 and DAD2– resonance structures is basically indistinguishable from an electronic structure described as a singlet biradical in which a DAD1– ligand is anti-ferromagnetically (AF) coupled to a metal-based spin (a situation being the result of metal-to-ligand SET). For systems with large AF-coupling constants (large ΔES–T > 0) distinguishing between such singlet biradical and strong π-back donation descriptions also becomes experimentally impossible, making such distinction largely a matter of semantics.
- Lichtenberg C.; Adelhardt M.; Gianetti T. L.; Meyer K.; De Bruin B.; Grützmacher H. Low-Valent Iron Mono-Diazadiene Compounds: Electronic Structure and Catalytic Application. ACS Catal. 2015, 5, 6230–6240. 10.1021/acscatal.5b01416. [DOI] [Google Scholar]
- Sinha V.; Pribanic B.; de Bruin B.; Trincado M.; Grützmacher H. Ligand- and Metal-Based Reactivity of a Neutral Ruthenium Diolefin Diazadiene Complex: The Innocent, the Guilty and the Suspicious. Chem.—Eur. J. 2018, 24, 5513–5521. 10.1002/chem.201705957. [DOI] [PMC free article] [PubMed] [Google Scholar]
Associated Data
This section collects any data citations, data availability statements, or supplementary materials included in this article.