

Abstract
Accumulating evidence shows that auditory cortex (AC) of humans, and other primates, is involved in more complex cognitive processes than feature segregation only, which are shaped by experience-dependent plasticity and thus likely show substantial individual variability. However, thus far, individual variability of ACs has been considered a methodological impediment rather than a phenomenon of theoretical importance. Here, we examined the variability of ACs using intrinsic functional connectivity patterns in humans and macaques. Our results demonstrate that in humans, interindividual variability is greater near the nonprimary than primary ACs, indicating that variability dramatically increases across the processing hierarchy. ACs are also more variable than comparable visual areas and show higher variability in the left than in the right hemisphere, which may be related to the left lateralization of auditory-related functions such as language. Intriguingly, remarkably similar modality differences and lateralization of variability were also observed in macaques. These connectivity-based findings are consistent with a confirmatory task-based functional magnetic resonance imaging analysis. The quantification of variability in auditory function, and the similar findings in both humans and macaques, will have strong implications for understanding the evolution of advanced auditory functions in humans.
Keywords: auditory cortex, functional connectivity, individual differences, nonhuman primate
Introduction
Association areas of the brain, which underlie complex cognitive qualities such as speech and language, demonstrate considerable individual variability (Mueller et al. 2013; Stoecklein et al. 2020). In contrast, sensory cortices, which are evolutionarily old (Kaas 2006) and maturate at early stages of human development (Hill et al. 2010), have been considered to be relatively similar across individuals. The human auditory cortex (AC) might, however, represent an exception to this rule (King and Nelken 2009). Even in primary ACs, neurons have dense integrative connections (Lu and Wang 2004) and strong preference for multifeature patterns (Nelken 2004). In humans, relatively early aspects of ACs are also sensitive to complex signals such as speech and music (Griffiths and Warren 2002; Mesgarani et al. 2008; Norman-Haignere et al. 2015), whose representations are modified by experience-dependent plasticity that varies between individuals (Herholz and Zatorre 2012; Ressel et al. 2012). Nonprimary ACs that have a strong capacity for adaptive plasticity (Hackett et al. 2001; Cheung et al. 2005), needed to interpret vocalizations that show subtle but rich variability between different individuals and subpopulations of the same species, exist in apes and monkeys as well (Arcadi 1996; Ghazanfar and Santos 2003; Belin 2006; Salmi et al. 2014; Aboitiz 2018). Interindividual differences thus appear to be a fundamental feature of the AC.
However, previous studies have considered individual variability of ACs as a methodological impediment rather than a measure of importance. Pioneering studies of human AC anatomy, which were based on 3D anatomical normalization, were complicated by the individual differences of Heschl’s gyrus (HG), the primary anatomical landmark of ACs (reviewed in Moerel et al. 2014). Today, this problem can be greatly alleviated thanks to improved surface-based intersubject alignment methods (Dick et al. 2012; Coalson et al. 2018; Fischl and Sereno 2018). Nevertheless, functional alignment of AC areas has remained a challenge due to the lack of a definite localizer paradigm. Localizing functional subareas in the primary cortices are often achieved using tasks that target specific functional properties. For example, subareas of visual cortex (VC) can be delineated based on mirror-symmetric representations of eccentricity and polar angle (Sereno et al. 1995). However, similar approaches cannot be directly applied to AC because the representation of cochlea is one dimensional. The lack of unequivocal mapping paradigm has prevented precise quantification of AC functional variability.
A powerful way to characterize the individuality of our brains is the analysis of their functional connectome (Seung 2012), a method so far largely unexploited in the auditory domain (for pioneering efforts, see Cha et al. 2016; Lumaca et al. 2019). In humans, such analyses are possible using resting state functional connectivity magnetic resonance imaging (fcMRI) (Mueller et al. 2013; Stoecklein et al. 2020). A remarkable finding has been that while the intrinsic functional connectome of human brain is individually variable, it is highly robust and reliable within subjects (Finn et al. 2015; Wang et al. 2015). Moreover, while the within-subject replicability of functional connectivity is robust throughout the brain, the degree of between-subject variability increases hierarchically from early sensory to higher areas (Mueller et al. 2013). However, it is unclear whether intersubject variability can also reflect the functional hierarchy within sensory areas, especially within the AC. Here we aim to estimate the individual variability of different levels of AC processing and to compare it to other sensory areas such as the VC, after controlling for anatomical biases and regional differences in magnetic resonance imaging (MRI) data quality. The VC that plays an equally critical role in the sensory system is widely accepted as a sensory region with smaller interindividual difference than the AC, but the quantitative comparison of the individual difference between 2 sensory cortices is still lacking.
Individual variability in functional connectivity might also provide insights of hemispheric lateralization, an organizing principle of the human brain that is hypothesized to contribute to efficient processing (Liu et al. 2009; Wang et al. 2014). Early task-based neuroimaging studies provide ample evidence for hemispheric lateralization of complex auditory properties, such as different attributes of speech and music (Zatorre et al. 1992; Shtyrov et al. 1998; Tervaniemi and Hugdahl 2003). It has been further suggested that the degree of lateralization of AC functions is modified by environmental factors such as musical training (Angulo-Perkins et al. 2014). However, there is evidence to support a more conservative view that such lateralization patterns emerge at the higher cognitive processing stages (e.g., semantic or linguistic processing) beyond ACs themselves (Poeppel et al. 2004). At the same time, many task-based functional magnetic resonance imaging (fMRI) analyses support a view of relatively distributed, bilateral processing of relatively complex auditory attributes including pitch and timbre (Allen et al. 2017) as well as phonetic information (Arsenault and Buchsbaum 2015). Intrinsic functional connectivity and its individual variability could provide a new way to probe the hierarchical organization of ACs and how that differs between the left and right hemispheres.
Revealing interindividual differences in AC could also lead to a better understanding of the evolution of our unique, human-specific auditory–cognitive skills. There is increasing evidence that not only humans but also nonhuman primates show communication behaviors that cannot be explained without the existence of a highly advanced auditory system (Ghazanfar and Santos 2003; Belin 2006). For example, the vocalizations that nonhuman primates use for group communication show subtle but rich variability depending on the social context (Aboitiz 2018), across different populations of the same subspecies (Arcadi 1996), and even between different individuals within a specific population (Salmi et al. 2014). The ability to interpret these modulations has evolved alongside an increasingly complex ACs (Hackett et al. 2001), which has a strong capacity for adaptive plasticity (Cheung et al. 2005) and, which, thus, also likely show considerable functional variability between individuals.
Here, to elucidate the individual functional variability of ACs, we quantified resting state connectivity patterns and investigated whether their variability increases as a function of processing hierarchy. We further tested whether intersubject variability is greater in the AC than other primary areas, specifically the VC, and reflects some features of higher-order processing, such as hemispheric lateralization. The results obtained in humans were compared with fcMRI analyses in macaques, which offered a way to verify the interspecies consistency of AC versus VC differences in a model that lacks the additional 3D variability caused by HG, a structure that is found only in humans.
Materials and Methods
Participants and Data Collection
Three human and 2 macaque fMRI datasets publicly available were employed in the present study.
CoRR-HNU Dataset
The Hangzhou Normal University of the Consortium for Reliability and Reproducibility (CoRR-HNU) dataset (Zuo et al. 2014) consisted of 30 young healthy adults (15 females, mean age = 24, standard deviation [SD] = 2.41). None of the participants had a history of neurological or psychiatric disorders, substance abuse, or head injury with loss of consciousness. Each subject underwent ten 10-min scanning sessions (100 min in total) over approximately 1 month. The Ethics Committee of the Center for Cognition and Brain Disorders at Hangzhou Normal University approved the study. Written informed consent was obtained from each participant prior to data collection. MRI data were acquired on a GE MR750 3 T scanner (GE Medical Systems). Structural images were acquired using a T1-weighted Fast Spoiled Gradient echo (time repetition [TR] = 8.1 ms, time echo [TE] = 3.1 ms, time to inversion [TI] = 450 ms, flip angle = 8°, field of view [FOV] = 256 × 256 mm, matrix = 256 × 256, voxel size = 1.0 × 1.0 × 1.0 mm, 176 sagittal slices). Functional data were obtained using an echo-planar imaging sequence (EPI: TR = 2000 ms, TE = 30 ms, flip angle = 90°, FOV = 220 × 220 mm, matrix = 64 × 64, voxel size = 3.4 × 3.4 × 3.4 mm, 43 slices). The participants were instructed to relax and remain still with their eyes open, not to fall asleep, and not to think about anything in particular. The screen presented a black crosshair in the center of a gray background.
MSC Dataset
The Midnight Scanning Club (MSC) dataset (Gordon et al. 2017) included 10 healthy young adults (5 females, mean age = 29.1, SD = 3.3). Informed consent was obtained from all participants. The study was approved by the Washington University School of Medicine Human Studies Committee and Institutional Review Board. For each participant, 30 continuous minutes of resting state were scanned on 10 separate days on a Siemens TRIO 3 T MRI scanner. Structural MRI data were obtained using T1-weighted images (voxel size = 1.0 × 1.0 × 1.0 mm, TE = 3.74 ms, TR = 2400 ms, TI = 1000 ms, flip angle = 8°, 224 sagittal slices). All functional imaging data were acquired using a gradient-echo EPI sequence (TR = 2.2 s, TE = 27 ms, flip angle = 90°, voxel size = 4 mm × 4 mm × 4 mm, 36 slices). The participants visually fixated on a white crosshair presented against a black background.
Human-Voice Dataset
The task dataset (Pernet et al. 2015) included 218 healthy adults (117 males; mean age = 24.1, SD = 7.0). Participants all provided written informed consent prior to participation, in accordance with the Declaration of Helsinki. The experiments were approved by the Local Ethics Committee at the University of Glasgow. All fMRI data were acquired from a Siemens TRIO 3 T MRI scanner using a single-shot gradient-echo EPI sequence (TR = 2000 ms, TE = 30 ms, flip angle = 77°, FOV = 210 × 210 mm, matrix = 70 × 70, voxel size = 3 × 3 × 3.3 mm, 32 slices). In addition to the 310 EPI volumes, a high-resolution 3D T1-weighted sagittal scan was obtained for each subject (voxel size = 1.0 × 1.0 × 1.0 mm, matrix = 256 × 256 × 192). Each run consisted of 10 min and 20 s block design with forty 8-s long blocks of either vocal (20 blocks) or nonvocal (20 blocks) sounds. The vocal or nonvocal blocks were intermixed randomly with 20 blocks of silence. Subjects were scanned while passively listening to the stimuli and keeping their eyes closed. Other details of the data collection and task design can be found elsewhere (Pernet et al. 2015).
Macaque Dataset I and II
Macaque dataset I included 2 rhesus monkeys (Macaca mulatta, 1 male, age 6 years, 6.4 kg; 1 female, age 7 years, 4.5 kg), which was collected from the Nathan Kline Institute (NKI) for Psychiatric Research. All methods and procedures were approved by the NKI Institutional Animal Care and Use Committee (IACUC) protocol. MRI images were acquired using a Siemens Tim Trio 3 T MRI scanner with an 8-channel surface coil adapted for the monkeys’ head. Structural MRI images were acquired using T1-weighted images (0.5-mm isotropic voxel, TE = 3.87 ms, TR = 2500 ms, TI = 1200 ms, flip angle = 8°). All functional images were acquired utilizing a gradient echo EPI sequence (TR = 2000 ms, TE = 16.6 ms, flip angle = 45°, 1.5 × 1.5 × 2 mm voxels, 32 slices, FOV = 96 × 96 mm). For each macaque, 8 resting-state scans (10 min for each scan) from 2 anesthetized sessions were collected with monocrystalline iron oxide ferumoxytol (MION).
Macaque dataset II included 2 male rhesus macaques (M. mulatta, 1 male, age 5 years, 8.6 kg; 1 male, age 5 years, 7.6 kg), which was collected from the Oregon Health and Science University. Animal procedures were in accordance with the National Institutes of Health guidelines on the ethical use of animals and were approved by the Oregon National Primate Research Center IACUC. MRI images were acquired using a Siemens Tim Trio 3 T MRI scanner with a 15-channel coil adapted for the monkeys’ head. Structural MRI images were obtained using T1-weighted images (0.5-mm isotropic voxel, TE = 3.33 ms, TR = 2600 ms, TI = 900 ms, flip angle = 8 degrees). All functional data were acquired using a gradient echo EPI sequence (TR = 2070 ms, TE = 25 ms, flip angle = 90 degrees, 1.5 × 1.5 × 1.5 mm voxels, 32 slices, FOV = 96 × 96 mm). For each macaque, eight 30-min anesthetized scans were acquired with MION. Other details of the data collection can be found in previous reports of the datasets (Xu et al. 2018).
Data Processing
CoRR-HNU Dataset
Resting-state fMRI data of the 30 subjects in this dataset were processed using the procedures previously described (Yeo et al. 2011; Mueller et al. 2013; Wang et al. 2015; Stoecklein et al. 2020). The following steps were performed: 1) slice timing correction (SPM2; Wellcome Department of Cognitive Neurology, London, UK), 2) rigid body correction for head motion with the FSL package, 3) normalization for global mean signal intensity across runs, and 4) band-pass temporal filtering (0.01–0.08 Hz), head motion regression, whole-brain signal regression, and ventricular and white matter signal regression.
Structural data were processed using FreeSurfer version 5.3.0. Surface mesh representations of the cortex from each individual subject’s structural images were reconstructed and registered to a common spherical coordinate system. The structural and functional images were aligned using boundary-based registration within the FsFast software package (http://surfer.nmr.mgh.harvard.edu/fswiki/FsFast). The preprocessed resting-state blood oxygen level–dependent (BOLD) fMRI data were then aligned to the common spherical coordinate system via sampling from the middle of the cortical ribbon in a single interpolation step. FMRI data of each individual were registered to the FreeSurfer cortical surface template (fsaverage6) that consists of 40 962 vertices in each hemisphere. A 6-mm full-width half-maximum (FWHM) smoothing kernel was then applied to the fMRI data in the surface space.
MSC Dataset
Resting-state fMRI data and structural data of the 10 subjects in this dataset were preprocessed identically to the CoRR-HNU dataset.
Human-Voice Dataset
Conventional task-evoked activation maps in this dataset were estimated using FSL’s FEAT (https://fsl.fmrib.ox.ac.uk/fsl/fslwiki/FEAT). After slice timing, rigid body correction and high-pass temporal filtering (100 s), task-induced BOLD responses were modeled by convolving the double-gamma hemodynamic response function with the experimental design. Structural data of the 218 subjects in this dataset were preprocessed identically to the CoRR-HNU dataset. The task-evoked activation maps of each individual were also projected to fsaverage6.
Macaque Datasets
The procedure of the structural data was similar with that of the human datasets but was edited manually during the tissue segmentation and the surface reconstruction. After generating the native white matter and pial surfaces by using FreeSurfer, we then registered the native surfaces to a hybrid left–right template surface (Yerkes19 macaque template; Donahue et al. 2016).
Resting-state fMRI data were processed by slice timing correction, motion correction and bias field correction (for Macaque dataset II), band-pass temporal filtering (0.01–0.1 Hz), same as the procedures used in previous studies (Xu et al. 2018; Xu et al. 2019a). Head-motion parameters, white-matter, ventricular, and whole-brain signals were linearly regressed out. We then transformed the denoised functional images into the corresponding anatomical images and then into the native mid-thickness surface. A 4-mm FWHM smoothing kernel was then applied on the native surface. The smoothed data were downsampled to the 10 k (10 242 vertices) Yerkes19 template surface. More details about the preprocessing procedure of the macaque datasets can be found in the previous report (Xu et al. 2018).
Generating Masks and Regions of Interest for AC and VC
For the human data, the AC mask was described in our previous paper (Ahveninen et al. 2016) and the VC mask was from the published V1–V3 VC mask (Benson et al. 2014). The left auditory, right auditory, left and right visual masks included 2155 vertices, 1984 vertices, 2810 vertices, and 2810 vertices, respectively. The cortical surface was downsampled to 1175 regions of interests (ROIs) that were approximately uniformly distributed across the 2 hemispheres (Yeo et al. 2011; Mueller et al. 2013).
For the macaque data, the AC and VC masks were extracted from the Markov’s cytoarchitectonic cortical parcellation (Supplementary Fig. S1) (Markov et al. 2012). The AC consisted of Core, Lateral Belt (LB), Medial Belt (MB), caudal-part, and rostral-part Parabelt (PBc and PBr) areas. The VC consisted of V1, V2, and V3 parcels. The left auditory, right auditory, and left visual masks included 266 vertices, 246 vertices, 1684 vertices, respectively. The cortical surface was downsampled to 1112 uniformly distributed ROIs, which were generated using similar methods as for the human data.
To compare interindividual variability between the primary and the nonprimary ACs in humans, we adapted the auditory regions from Glasser’s multimodal parcellation (Supplementary Fig. S2A) (Glasser et al. 2016). We identified parcels in the AC that show relatively clear correspondence to the core-belt–parabelt model. The A1 area in the parcellation corresponds to the core area. The anterior, posterior, and LB areas in the parcellation may correspond to the belt area in the core-belt–parabelt model. The A4 and A5 in the parcellation may correspond to the parabelt areas. Similarly, we applied the Markov’s auditory parcellation (Supplementary Fig. S2C) to identify primary and nonprimary auditory areas in the macaque brain. The parcellation has defined the core auditory area. Both LB and MB in the parcellation were used to define the belt areas. Parabelt caudal and rostral parts in the parcellation were used to define the parabelt area.
Estimating Interindividual Variability of Resting-State Functional Connectivity Within the AC and VC
BOLD fMRI signal time courses were extracted from the AC and VC masks, respectively. Functional connectivity profiles were obtained by computing Pearson’s correlation between time courses of the vertices within each mask and time courses of 1175 vertices (or 1112 vertices for macaques) covering the whole cerebral cortex. The profile for a given vertex i could be denoted as  , where
  , and
, and  is a 1 × 1175 (or 1112 for macaques) vector, s indicates the subject, v indicates the session, and N indicates the number of vertices within the masks.
  subjects were collected in each dataset, where
  in the CoRR-HNU dataset,
  in the MSC dataset,
  in the Macaque dataset.
  sessions were scanned for each subject, where
  in the CoRR-HNU dataset,
  in the MSC dataset,
  in the Macaque dataset.
For a given vertex i, the intrasubject variance of each subject was estimated using the average dissimilarity maps derived from all pairs of sessions of each subject:
 |
where  and
and  represents the mean across all pairs of sessions. The intrasubject variance was then averaged across all subjects within any 1 dataset:
 |
where  represents the mean across all subjects. The intersubject similarity map of each session was derived from the average correlation maps across all pairs of subjects.
 |
where p, q = 1, 2, … S (p ≠ q) and  represents the mean across all pairs of subjects. To estimate interindividual variability, the similarity map of each session was inverted (by subtraction from 1) and then the intrasubject variance was regressed out using a general linear model (GLM). The residual map could be regarded as the interindividual variability in resting-state functional connectivity:
 |
where the  and the
  are parameters determined by the GLM. The final interindividual variability map was obtained by averaging the interindividual variability of each session across all sessions:
 |
where  represents the mean across all sessions.
Estimating Interindividual Variability of Task Activation Within the AC
The task activation z-value maps derived from the Human-voice dataset were extracted from the same AC mask that was used for resting-state functional connectivity variability. The SD of the z values for each task contrast across all 218 subjects was calculated to estimate interindividual variance, whereas the average z-value map was estimated by averaging task activation z-value maps across all subjects. Normalization (z-score) was then applied to both the SD map and the mean z-value map derived from all subjects within the AC mask. The normalized mean z-value map was regressed out from the normalized interindividual SD map to remove its dependence on the mean z-value. The resulting residual map may be considered the interindividual variability of the task fMRI data.
Controlling for the Effects of Anatomical Variability
Sulcal depth and cortical thickness measurements were calculated using FreeSurfer. The sulcal depth estimated by FreeSurfer is the integrated dot product of the movement vector with the surface normal during inflation. It highlights large-scale geometry as deep regions consistently move outward and have a positive value, whereas superficial regions move inward and have a negative value. Interindividual variability in sulcal depth and cortical thickness was estimated vertex-wise using intraclass correlation (ICC) with the intrasubject variance regression. Pearson’s correlation coefficient was calculated between functional variability and anatomical variability across the AC (Mueller et al. 2013; Stoecklein et al. 2020).
To estimate the effect of anatomical variability on functional variability, we regressed out cortical thickness and sulcal depth from the intersubject variability in functional connectivity by using the GLM (Supplementary Fig. S4) (Xu et al. 2019a).
 |
where  is the intersubject variability in functional connectivity,
  and “
and “ represent anatomical variability of the cortical thickness and sulcal depth, and
  and
and  are GLM coefficients.
Seed-Based Functional Connectivity Analysis in the Low- and High-Variability Auditory Regions
In order to visualize the differences of the functional connectivity patterns between seed in the high-variability region and seed in the low-variability region, we selected 2 juxtaposed seeds in the AC: one of them located in the low-variability region around HG (MNI coordinate: −60, −18, 1) and another located in the high-variability region in superior temporal gyrus (STG) (MNI coordinate: −62, −18, −2). We estimated the seed-based functional connectivity maps for every single individual by using Pearson’s product moment correlation. We then converted them to z-maps using Fisher’s r-to-z transformation and averaged the z-maps across all 30 subjects.
Statistical Analysis
Wilcoxon rank-sum tests were used to compare the functional variability between the AC and the VC and between the left and right ACs. To test the potential impact of spatial dependence between neighboring vertices on correlation analysis, we performed a repeated (n = 1000) random sampling of 7% of the vertices and computed the correlation coefficient on the subsets of the vertices. For each subset, the Durbin–Watson test was performed to evaluate the spatial dependence (https://mathworks.com/help/stats/dwtest.html). In all spatial correlations, the values of the Durbin–Watson statistic were close to 2, with P values > 0.05, indicating no significant spatial autocorrelation in the subsets. Correlation coefficients were z-transformed and averaged across the 1000 iterations.
Visualization
All results were projected on the FreeSurfer cortical surface template “fsaverage” for visualization purposes. The VC was cut along the calcarine fissure and flattened using the FreeSurfer command (mris_flatten).
Data and Code Availability
The CoRR-HNU dataset is publicly available through Consortium for Reliability and Reproducibility Project (http://fcon_1000.projects.nitrc.org/indi/CoRR/html/hnu_1.html). The MSC dataset is publicly available through OpenfMRI (https://openfmri.org/dataset/ds000224/). The Human-voice dataset is also publicly available through OpenfMRI (https://openfmri.org/dataset/ds000158/). MATLAB codes that support the findings of this study are available from the corresponding authors upon request.
Results
Substantial Intersubject Variability in the Human and Macaque AC
Functional connectivity, and its individual variability, was estimated in human AC using a resting-state fMRI dataset that consists of 30 young healthy adults (the CoRR-HNU dataset; Zuo et al. 2014), 15 females, age 24 ± 2.41 years). Each subject underwent 10 scanning sessions (10-min resting-state fMRI each session, i.e., 100-min fMRI data per subject, see Materials and Methods) over approximately 1 month. For each vertex in the AC, its connectivity with all other vertices in the cerebral cortex was calculated using the data of each session and then averaged across 10 sessions. Intersubject variability of functional connectivity was quantified at each vertex based on the dissimilarity of the seed-based connectivity maps between subjects, using the strategy described in Mueller et al. 2013. Specifically, to control for the impact of noise and other technical confounds, intersubject variability in connectivity was corrected by linearly regressing out the mean intrasubject variability (Mueller et al. 2013), which was quantified in each subject based on the variation of connectivity maps across 10 sessions. We replicated the previous finding of intersubject variability in functional connectivity in the human brain, which indicated high variability in the association cortices but low variability in the visual and sensorimotor areas (Fig. 1A).
Figure 1.
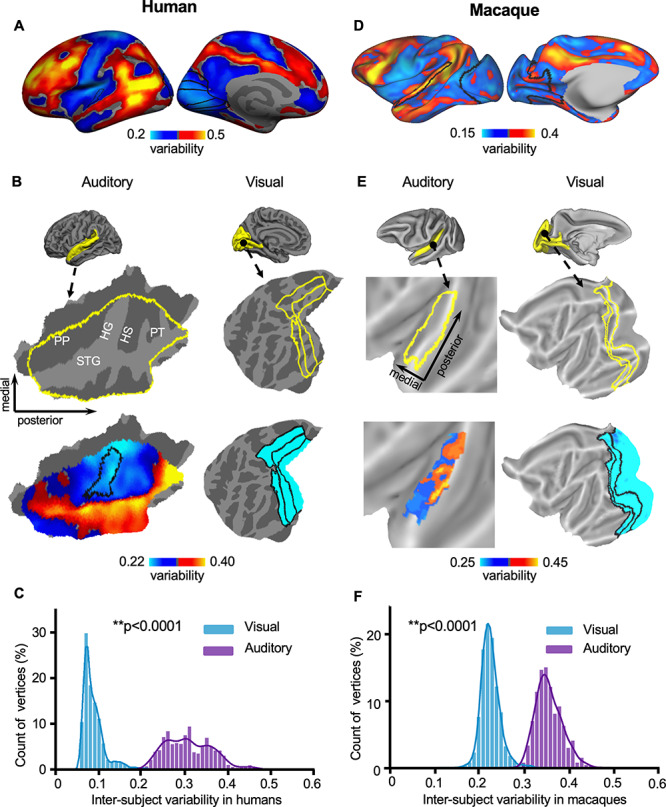
Interindividual variability in the AC is significantly larger than that in the VC in both humans and macaques. (A) Interindividual variability in functional connectivity derived from the CoRR-HNU dataset (N = 30) is shown in the human cortical surface. (B) The AC (left column) and the VC (right column) are displayed as magnified flattened patches. Interindividual variability in AC and VC is plotted. Variability is much larger in the AC than in the VC. (C) Histograms of intersubject variability in the AC (purple bars) and VC (blue bars). The AC shows significantly higher intersubject variability than the VC (P < 0.0001, Wilcoxon rank-sum test). (D) Interindividual variability in functional connectivity derived from the macaque dataset (N = 4) is shown in the macaque cortical surface. Variability in macaques demonstrates the similar principle of the spatial distribution with that in humans. (E) Interindividual variability is shown in the macaque AC and VC. In macaques, AC also demonstrates much greater variability than VC. (F) Histograms of variability show that AC (purple bars) is more variable than VC (blue bars, P < 0.0001, Wilcoxon rank-sum test) in macaques. PT: planum temporale; PP: planum polare.
Focusing on the AC, we found that intersubject variability is relatively low in HG but much greater laterally in the STG, which could be near the human homolog of monkey parabelt areas (Fig. 1B). To quantify intersubject variability in the primary and nonprimary auditory areas, we identified auditory areas in the cortical parcellation provided by Glasser et al. 2016 (see methods) and quantified variability in the core area (0.229 ± 0.011, mean ± SD), the belt areas (0.243 ± 0.016, mean ± s.d), and the parabelt areas (0.294 ± 0.041, mean ± SD) (Supplementary Fig. S2B). Individual variability in the core area is significantly lower than that in the belt areas (2-sample t-test, t485 = −8.49, P < 0.001) and that in the parabelt areas (2-sample t-test, t524 = −15.42, P < 0.001). Intersubject variability in the belt areas is also lower than that in the parabelt areas (2-sample t-test, t811 = −22.16, P < 0.001). The gradient of intersubject variability suggests that the nonprimary auditory areas may be more variable across individuals than the primary auditory areas. For comparison purposes, we quantified intersubject variability in the VC (Fig. 1B). Critically, we found that intersubject variability in the AC is significantly larger than that in the VC (Fig. 1C, P < 0.0001, Wilcoxon rank-sum test; the curves represent fitted data using a kernel distribution).
We then investigated intersubject variability in functional connectivity across 4 macaque monkeys. Two subjects were scanned for eight 10-min fMRI runs under anesthesia (see Materials and Methods) and the other 2 subjects were scanned for eight 30-min fMRI runs under anesthesia (Xu et al. 2018). We used same amount of data from each subject (8 × 10 min). The procedure for evaluating intersubject variability in macaque is identical to the procedure for the human data as described above (see Materials and Methods). We found that interindividual variability in macaque monkeys demonstrated the similar principal of the spatial distribution with that in humans, that is, associated areas in the frontal, parietal, and temporal lobes show marked interindividual variability, whereas primary areas such as sensorimotor and VCs demonstrate low variability. Note that the color scale of variability has been scaled differently for 2 species so the gradient within each species can be better appreciated (Fig. 1D). Importantly, the macaque auditory areas showed substantial intersubject variability (Fig. 1E), which is significantly higher than that in the VC (Fig. 1F, P < 0.0001, Wilcoxon rank-sum test). However, using anatomically defined core, belt and parabelt regions (see Materials and Methods), we did not find significant differences in functional variability among these auditory regions in the macaque brain (Supplementary Fig. S2D). Two subjects had longer data (8 × 30 min); however, including all data did not change the results (Supplementary Fig. S3).
To better understand how AC regions with low variability and high variability may differ in their connectivity profiles, we placed 2 juxtaposed seeds in the human AC and 2 seeds in the macaque AC (Fig. 2). The 2 seeds are very close to each other, but one is located in the low-variability region and the other in the high-variability region. Resting-state functional connectivity analysis indicated that the seed in the low-variability area is strongly connected to the sensorimotor cortex, whereas the nearby seed in the high-variability area shows strong connectivity to the frontal lobe in both species. Functional connectivity profiles of the 2 juxtaposed seeds show only modest correlation in humans (spatial correlation r = 0.297) and weak correlation in macaques (spatial correlation r = 0.049). These distinct connectivity patterns suggest that auditory regions with low variability may be involved in the primary information processing, whereas regions with high variability might be involved in higher-order association processing in the frontal lobe such as language functions in humans. Thus, interindividual variability in functional connectivity may reflect the hierarchical functional organization in the AC.
Figure 2.
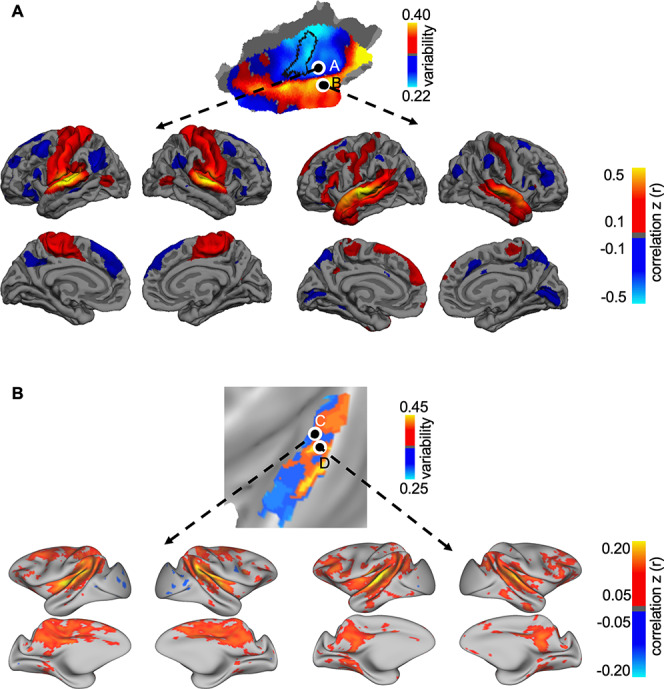
Auditory regions with low variability and high variability show distinct functional connectivity patterns in both humans and macaques. (A) Two seeds were placed in the human AC, one in the regions showing low interindividual variability (seed A) and the other in the region showing high variability (seed B). Group-level functional connectivity maps were derived using these 2 seeds. Although the 2 seeds were very close to each other, the seed in the low variability region is strongly connected to the sensorimotor cortex, whereas the seed in the high variability region shows strong connectivity to the inferior frontal gyrus and temporal pole. The 2 maps only showed a moderate correlation (spatial correlation r = 0.297). (B) Group-level functional connectivity maps were estimated using 2 juxtaposed seeds in the macaque brain, one in the region with low variability (seed C) and the other in the region with high variability (seed D). The seed in the low-variability region is connected to the dorsal sensorimotor regions. In contrast, the seed in the high-variability region is functionally connected to the lateral frontal lobe. The 2 maps showed a very weak correlation (spatial correlation r = 0.049).
Lateralization of Interindividual Variability in the AC
One of the important functions of the human AC is speech processing, which is left lateralized at the population level but varies across individuals. Here, we investigated whether ACs in 2 hemispheres show similar levels of individual variability, or if one hemisphere is more variable than the other. Intersubject variability in functional connectivity was quantified in the left and right ACs using the CoRR-HNU dataset (Fig. 3A). While both hemispheres showed similar spatial distributions of intersubject variability with low variability in HG and high variability near the STG, variability is much greater (P < 0.001, Wilcoxon rank-sum test) in the left AC than in the right AC (Fig. 3B). These observations imply that the left AC may be more involved in higher-order functional processing than the right AC.
Figure 3.
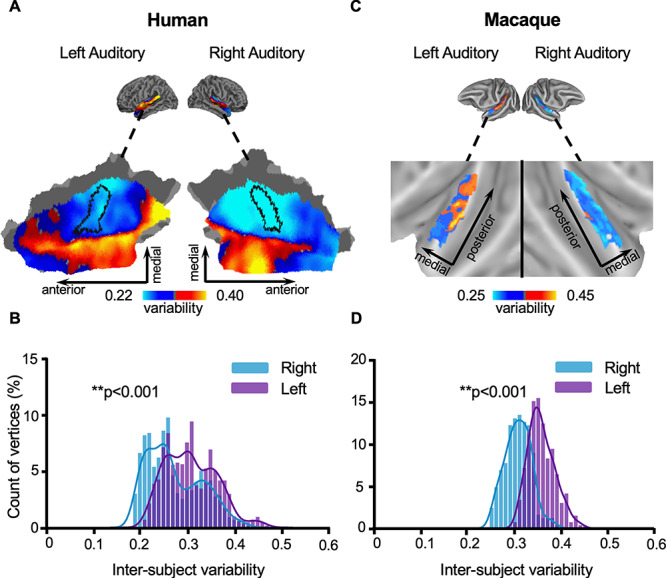
Interindividual variability in the AC shows significant lateralization in both humans and macaques, with the left AC being more variable than the right. (A) Spatial distribution of intersubject variability in the left and right ACs of humans. Values below the mean within both left and right AC are shown in cool colors, whereas values above the global mean are shown in warm colors. Variability appears to be higher in the left AC than in the right AC. (B) Histograms of intersubject variability in the left and right ACs of humans show significantly higher interindividual variability in the left AC (purple bars) than in the right AC (blue bars, P < 0.001, Wilcoxon rank-sum test). (C) Spatial distribution of variability in the left and right ACs of macaques (D) Histograms of intersubject variability in the left and right ACs of macaques also show significant left lateralization (P < 0.001, Wilcoxon rank-sum test).
We next investigated whether interindividual variability is lateralized in the macaque AC. Strikingly, in macaques, left AC also demonstrated significantly greater variability than right AC (Fig. 3C,D, P < 0.001, Wilcoxon rank-sum test), indicating the lateralization pattern observed in the human AC might have an evolutionary trace.
Replication of the Variability Analyses in an Independent Dataset
We replicated the findings of the auditory–visual comparison of the interindividual variability and lateralization of the variability in the AC in an independent dataset (MSC dataset) (Gordon et al. 2017), which included 10 healthy young adults (5 females, age = 29.1 ± 3.3 years). Each subject underwent 10 scanning sessions (30-min resting state fMRI each session, see Materials and Methods) on 10 separate days. Although the MSC datasets and CoRR-HNU dataset differ in the subjects’ ethnicities and scanning parameters, we found that the spatial distribution of intersubject variability in the AC was highly replicable (Pearson correlation r = 0.836, P < 0.0001, see Fig. 4A). We also found that interindividual variability of the AC is significantly greater than that in the VC (P < 0.001, Wilcoxon rank-sum test, see Fig. 4B) The left lateralization of the interindividual variability of the ACs was also successfully replicated in the MSC dataset (P < 0.001, Wilcoxon rank-sum test, see Fig. 4C,D).
Figure 4.
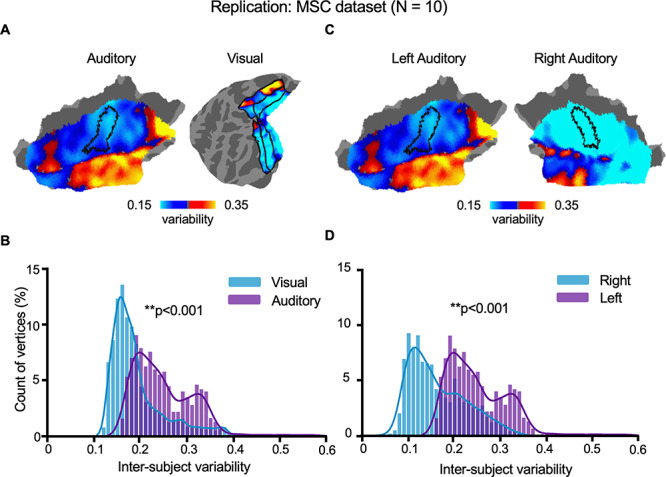
The greater variability of auditory than VC and left lateralization in the AC were replicated in an independent dataset. The main findings derived from the CoRR-HNU dataset (N = 30) were replicated in an independent human dataset (MSC Dataset, N = 10) with different scanning parameters and subjects’ ethnicities. Interindividual variability of the AC derived from the 2 datasets was highly similar (correlation r = 0.836, P < 0.0001). Furthermore, we replicated the findings that (A, B) variability in the AC is greater than that in the VC (P < 0.001, Wilcoxon rank-sum test) and (C, D) variability in the left AC is significantly greater than that in the right AC (P < 0.001, Wilcoxon rank-sum test).
Intersubject Variability in Task-Evoked Activations in the Human AC
Recent studies have indicated that individual differences in resting state connectivity are related to individual differences in task-evoked activity (Tavor et al. 2016). Here, we examined whether the spatial distribution of individual variability in the AC could also be observed in task-evoked activity. Intersubject variability in task-evoked fMRI activations was assessed in the AC using the Human-voice dataset (N = 218, see Materials and Methods). Subjects were scanned while passively listening to vocal and nonvocal stimuli (Pernet et al. 2015). Intersubject variability was estimated as the SD of the z-values from task activation across all subjects, with the mean z-values regressed out. Interestingly, we also found low intersubject variability in HG and higher variability in the lateral STG (i.e., the possible human homolog of the monkey parabelt area). Furthermore, task fMRI variability of both vocal and nonvocal stimulus were significantly correlated with resting-state functional connectivity variability (Fig. 5A,B, for nonvocal stimulus, r = 0.504, P < 0.0001; Fig. 5C, for vocal stimulus, r = 0.502, P < 0.0001). Moreover, interindividual variability in task-evoked fMRI activations in ACs also showed left lateralization. Left AC demonstrated significantly greater variability in task-evoked activity than right AC (Fig. 5B,C, for both stimuli, P < 0.001, Wilcoxon rank-sum test).
Figure 5.
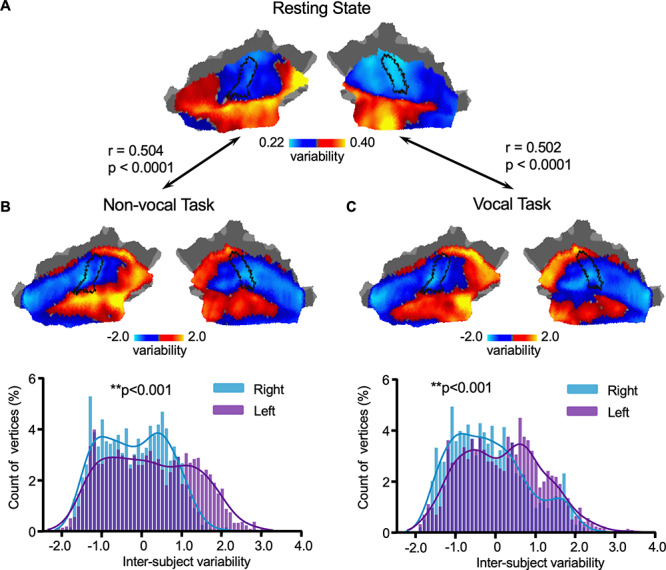
Interindividual variability in task-evoked activations in the AC shows the same principle of the spatial distribution as individual variability in functional connectivity. Intersubject variability in task-evoked fMRI activations (Human-voice dataset, N = 218) was assessed in the AC. Variability was estimated as the SD of the z-values from task activation across all subjects, with the average z-values regressed out. Interindividual variability estimated at rest (A) and variability estimated using task activations based on nonvocal (B) and vocal (C) auditory stimuli, show the same principle of the spatial distribution, with low intersubject variability near HG (indicated by a black curve) but higher variability in the lateral superior temporal cortex (i.e., the likely human parabelt area). Variability derived from task activations is correlated with the variability estimated at rest (r = 0.504, P < 0.0001 for nonvocal auditory stimuli and r = 0.502, P < 0.0001 for vocal auditory stimuli). Moreover, interindividual variability in task-evoked activations in the ACs also show significant left lateralization. The histograms of variability estimated using both tasks (B, C) indicate that the left AC (purple bars) show significantly higher variability than the right AC (blue bars, P < 0.001, Wilcoxon rank-sum test).
Relationship Between Functional and Anatomical Variability in the AC
Anatomical variability in the human AC has been well recognized in the literature. We therefore investigated how functional variability may be related to known anatomical variability. Intersubject variability in sulcal depth and cortical thickness was assessed using ICC, with intrasubject variance properly accounted for (Mueller et al. 2013). We found that variability in functional connectivity showed a moderate correlation with variability in sulcal depth (Fig. 6, r = 0.36, P < 0.0001), but not with cortical thickness (r = −0.04, P = 0.084). To further examine the effect of anatomical variability on functional variability, we regressed out anatomical variability from the map of intersubject variability in functional connectivity. The regressed map was highly similar to the original map (Supplementary Fig. S4A, spatial correlation r = 0.931, P < 0.001) and the left lateralization of intersubject variability remained prominent (Supplementary Fig. S4B, P < 0.001, Wilcoxon rank-sum test).
Figure 6.
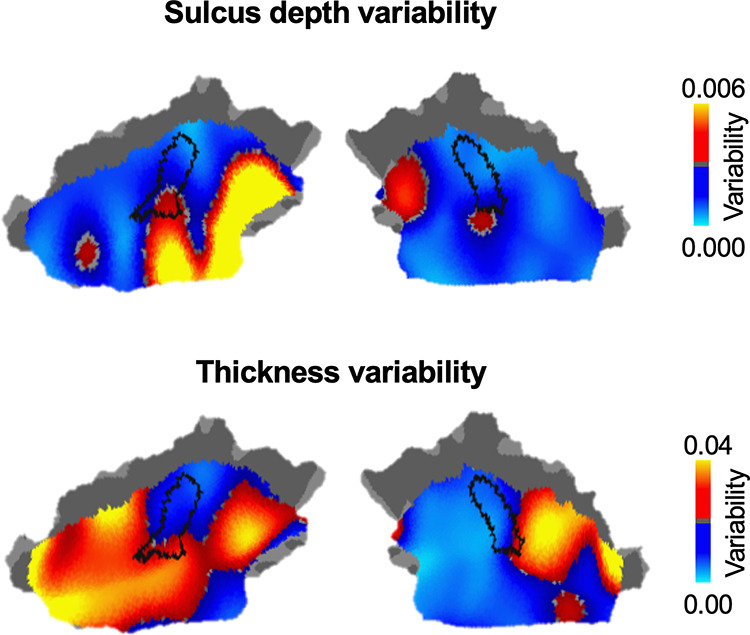
Functional Variability in the human AC is moderately associated with variability in sulcal depth, but not cortical thickness. Interindividual variability in sulcal depth (upper row) and cortical thickness (bottom row) was assessed using ICC, with intraindividual variance properly accounted for. Variability in functional connectivity is moderately associated with variability in sulcal depth (r = 0.36, P < 0.0001), but not with cortical thickness (r = −0.04, P = 0.084).
Control Analysis of Macaque Sample Size
There were only 4 subjects in the macaque dataset, whereas the human datasets consisted of much more subjects. To examine whether 4 subjects are sufficient for estimating intersubject variability in functional connectivity, we randomly selected 4 human subjects from the CoRR-HNU dataset (N = 30) and re-estimated interindividual variability in both the cerebral cortex and the AC. This procedure of random selection was repeated 100 times. Interindividual variability derived from 4 subjects showed high consistency to the map derived from the full sample (Fig. 7, the cerebral cortex: Pearson correlation r = 0.801, Bootstrap 95% confidence interval [0.746, 0.841]; the AC: Pearson correlation r = 0.793, Bootstrap 95% confidence interval [0.641, 0.876]). These results suggested that interindividual variability can be robustly estimated with a sample size of 4. Given that the amount of fMRI data acquired from each macaque monkey was very high (80 min for 2 subjects and 240 min for the other 2 subjects), the sample of 4 monkeys should be sufficient for estimating intersubject variability.
Figure 7.
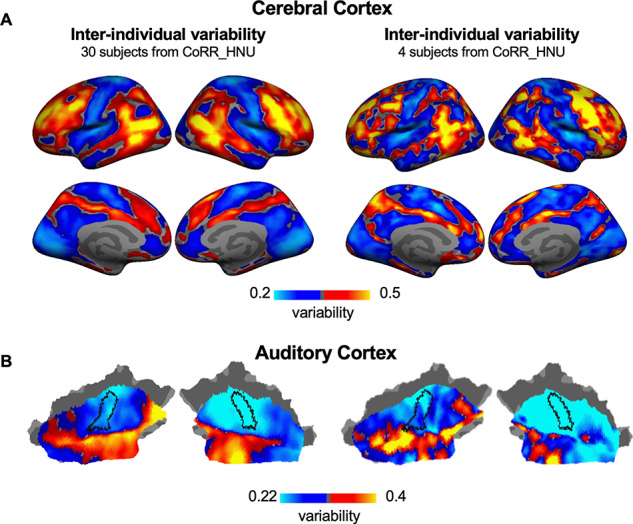
Interindividual variability can be robustly estimated using a small sample. Due to the limited sample size of the macaque dataset (N = 4), it is necessary to investigate whether a small sample can be used to estimate individual variability in functional connectivity. Bootstrapped subsampling was performed to randomly select 4 subjects from the CoRR-HNU dataset to evaluate individual variability in (A) the cerebral cortex and (B) the AC and the procedure was repeated 100 times. Variability derived from 4 subjects (right column) is highly similar to that derived from 30 subjects (left column) in both the cerebral cortex (r = 0.801, Bootstrap 95% confidence interval [0.746, 0.841]) and the AC (r = 0.793, Bootstrap 95% confidence interval [0.641, 0.876]), suggesting that interindividual variability can be robustly estimated using a small sample.
Discussion
Here, using resting-state and task-based fMRI, we examined the functional variability in AC in humans and macaques. Regions near the primary ACs demonstrated lower interindividual variability than nonprimary areas. Compared with VC, AC demonstrated much greater interindividual variability in functional connectivity. In this sense, ACs were more similar to higher-order association than VCs, in both humans and macaques. Furthermore, in both primate species, the left AC varied more than the right AC, which could be related to the lateralization of higher auditory–vocal communication processes. The spatial distribution of interindividual variability in AC function could also be observed using task fMRI data in humans, confirming that nonprimary AC areas are more variable than primary AC areas. These results may help future studies pursuing better ways to examine auditory and communication qualities in individual subjects.
Functional Hierarchy of ACs
Our previous work demonstrates that the individual variability of functional connectivity increases from sensory to association areas (Mueller et al. 2013), consistent with the evolutionary expansion, developmental expansion, and hemispheric specialization of different functions and areas (Wang et al. 2015). The gradient of intersubject variability in the primate brain may thus reflect the hierarchy of functional processing. Focusing on the human AC, our present results demonstrate in 2 independent datasets that functional connectivity is significantly more variable in the lateral part of the AC in the STG than in areas close to the medial HG (Figs 1 and 4). This transition of variability was also observed in task fMRI data (Fig. 5). These observations suggest that functional complexity may abruptly increase near the crest of STG. More detailed studies using our fcMRI method, combined with novel data-driven AC mapping methods (Moerel et al. 2013; Norman-Haignere et al. 2015; Kell and McDermott 2019), could help better elucidate the exact functional hierarchy in the human AC, which has been so far difficult to specify.
The replicability and within-subject consistency of mapping results has often been poorer in nonprimary than primary AC areas in studies using more traditional fMRI localizer designs as well (Moerel et al. 2014). However, many of these previous findings also reflect the lack of designs that work equally well in different parts of AC, which are sensitive to differing stimulation and task parameters. For example, tonotopic mapping likely produces low SNR in nonprimary ACs where the majority of neurons have broad tuning properties (Phillips et al. 1994). Notably, this also increases the variability of responses within subjects, a bias that was carefully controlled in the present analysis. The present fcMRI results, thus, cannot be explained by regional differences in SNR only.
Auditory Versus Visual Cortices
An intriguing finding of the present study is that, although basic perceptual processes and their cortical substrates vary in the visual domain as well (Farkas et al. 2018), ACs appeared to be significantly more variable across individuals than comparable hierarchical levels of VC, both in humans and macaques. Notably, neurophysiological studies in other species suggest that ACs are preceded by a larger number of precortical processing steps than comparable cortical stages of visual processing (Masterton 1992; King and Nelken 2009). Even in the primary input areas, AC neurons have highly multidimensional activation preferences (Chambers et al. 2014), which could support complex object representations rather than simple feature representations only (Nelken 2004). FcMRI studies in humans demonstrate that ACs show a larger proportion of distant versus local connectivity than comparable levels of VC (Mueller et al. 2013). These kinds of observations have sparked a hypothesis that early human ACs constitute a higher-level processing center than early VCs (or somatosensory cortices) (Nelken et al. 2003). Our present fcMRI findings in humans and macaques are consistent with this theoretical premise.
Functional Laterality
Our results suggest significantly greater individual variability of fcMRI patterns in the left than right hemisphere in both humans and macaques. This finding is in line with the known lateralization of speech reception in humans, as well as with the relative expansion of left versus right superior temporal cortex that is prominent in humans (Geschwind and Levitsky 1968) but present in apes and monkeys, too (Galaburda et al. 1978). Our finding is also in line with language task-based studies, which report very large individual variability of left AC activations, comparable to that in frontal cortices (Burton et al. 2001; for alternative interpretations, see Bonte et al. 2013). Notably, the variability of left AC function has been reported to correlate with idiosyncrasies of not only fundamental perceptual styles (Farkas et al. 2018) but also of voice (Postma-Nilsenová and Postma 2013) and speech production processes (Franken et al. 2017). Given the potential of fcMRI as a predictor of cognitive abilities (Finn et al. 2015), future studies on how the functional variability of left AC at rest is related to the individuality of our speech processing and production capabilities are clearly warranted.
Interspecies Comparison: Evolution and Individual Development
Previous architectonic studies suggest that although largely homologous AC subregions are found in all primates, the degree of individual variability and complexity are larger in great apes and humans than in monkeys (Hackett et al. 2001). It is thus tempting to conjecture that the human ACs are uniquely complex, also in terms of the patterns of their individual variability. This speculation receives indirect support from previous work which indicated AC surface area expanded more than VC area during human brain evolution (Van Essen and Glasser 2014), which show indices of larger interspecies expansion of certain higher AC than VC areas. It is also noteworthy that, even when the account of language evolution is disregarded, humans differ from other primates more prominently in auditory than visual cognitive skills such as working memory (Scott et al. 2012). However, our data provided strong evidence that the degree of functional variability of monkey brain function, similarly to humans, is greater in the AC than VC and, importantly, is also greater in the left than right AC. The existence of such human-like cortical distributions of individual variability could reflect the neurobiological substrate for processing of complex auditory signals that has evolved to speech processing in humans.
According to recent studies, individual variability in functional connectivity demonstrates similar patterns in neonates than in adults, specifically when it comes to the primary areas of cortex (Gao et al. 2014; Xu et al. 2019b; Stoecklein et al. 2020). However, some brain regions, especially in higher cognitive networks, show a developmental shift toward greater variability of functional connectivity in adults than in neonates (Gao et al. 2014; Xu et al. 2019b; Stoecklein et al. 2020). In other words, at the whole-brain scale, high individual variability in adulthood appears to be most typical in association regions that mature slowly and are highly plastic. Here, we found evidence of analogous hierarchically distribution of interindividual variability among subregions of ACs. Regions with low variability overlapped with medial aspects of superior temporal cortex, which have been previously shown to be specializing on more basic physical features such as sound frequency (Wessinger et al. 2001; Dick et al. 2012; Moerel et al. 2014). Such basic information processing systems are relatively matured already in neonates and they may be less susceptible to environmental factors. In contrast, the more lateral aspects of ACs, which showed higher individual variability, might be specialized in higher-order functions, such as speech and music listening, which may be susceptible to developmental environment, such as education and our exposure to external stimuli.
Limitations
Functional variability could be confounded by co-registration errors in areas such as HG whose folding patterns vary across subjects, as a higher degree of convolution can lead to lower fidelity of intersubject alignment (Van Essen 2005). Therefore, we regressed out sulcal depth variability, which comprises variability due to alignment errors, from the functional variability map. We found that the overall pattern of functional connectivity variability remained stable after regression. It is also noteworthy that the hierarchy of individual variability within ACs themselves differs from that predicted by the variability of folding patterns. Of the areas within superior temporal cortex, HG was functionally least variable although its folding patterns vary substantially across subjects (for a review, see Moerel et al. 2014), whereas the functionally highly variable STG is considered to be a stable anatomical landmark for surface-based intersubject alignment (Coalson et al. 2018). Most importantly, the differences between AC and VC found in the human brain were highly consistent to those found in the macaque, who do not have a HG.
A limitation is also that our task-based analysis is based to a single dataset that used vocal and nonvocal stimuli; future work based on a broader selection of auditory tasks is thus warranted. It is also noted that human AC subareas might be smaller than those in the VCs, which could have affected the comparison of intersubject variability between the AC and the VC. This topic could be studied in the future using ultra-high-field fMRI techniques that allow for submillimeter voxel sizes.
Another limitation of interspecies comparisons is that, unlike humans, the macaques were under anesthesia during fMRI acquisitions for practical reasons (Xu et al. 2019a). Further explorations are therefore needed to gain a better understanding about how the functional variability in AC is related to consciousness.
Finally, to limit the possible impact of acoustical scanner noise on AC functional connectivity, we estimated intrasubject variability based on repeated scans and used it as a regressor. This concern is also mitigated by recent fcMRI evidence of feature-topographic functional connectivity patterns in early human ACs, which are similarly present in normally hearing (Cha et al. 2016) and congenitally deaf individuals (Striem-Amit et al. 2016), a set of findings that is difficult to explain by acoustical noise fluctuations. At the same time, here, the constant background acoustic stimulation should have increased the consistency of activation patterns in ACs, as compared with VC, not vice versa.
Conclusion
Our results demonstrate that in both humans and macaques, functional variability of ACs is 1) greater near the nonprimary than primary areas, 2) greater than in comparable visual areas, and 3) greater in the left than right hemisphere. These results could have implications for understanding the evolution of advanced auditory functions in humans.
Funding
National Key Research and Development Program of China (grant 2016YFC0105502, 2016YFC1306303, and 2019YFB2204904); National Natural Science Foundation of China (grant 81790652, 81790650, 81527901, 81790654, and 81671285); National Institutes of Health (grant R01NS091604, P50MH106435, R01DC016765, R01DC017991, R01DC016915, 1R21MH121831, and 5K01MH111802); and Shenzhen International Cooperative Research Project (grant GJHZ20180930110402104).
Notes
We would like to thank the investigative teams from the Nathan Kline Institute (C. Schroeder, M.P. Milham, A. Falchier, S. Colcombe, G. Linn, D. Ross, R.C. Craddock), Oregon Health and Science University (E.L. Sullivan, E. Feczko, J. Bagley, E. Earl, O. Miranda-Domingue, D. Fair), as well as the funding agencies that made their work possible (Nathan Kline Institute: National Institutes of Health; Oregon Health and Science University: National Institutes of Health, National Institute on Deafness and Other Communication Disorders, and National Institute of Mental Health). We thank the National Center for Protein Sciences at Peking University for assistance with MRI data processing tools. Conflict of Interest: The authors have no conflicts of interest to declare.
Supplementary Material
References
- Aboitiz F. 2018. A brain for speech. Evolutionary continuity in primate and human auditory-vocal processing. Front Neurosci. 12:174. [DOI] [PMC free article] [PubMed] [Google Scholar]
- Ahveninen J, Chang W-T, Huang S, Keil B, Kopco N, Rossi S, Bonmassar G, Witzel T, Polimeni JR. 2016. Intracortical depth analyses of frequency-sensitive regions of human auditory cortex using 7T fMRI. Neuroimage. 143:116–127. [DOI] [PMC free article] [PubMed] [Google Scholar]
- Allen EJ, Burton PC, Olman CA, Oxenham AJ. 2017. Representations of pitch and timbre variation in human auditory cortex. J Neurosci. 37:1284–1293. [DOI] [PMC free article] [PubMed] [Google Scholar]
- Angulo-Perkins A, Aube W, Peretz I, Barrios FA, Armony JL, Concha L. 2014. Music listening engages specific cortical regions within the temporal lobes: differences between musicians and non-musicians. Cortex. 59:126–137. [DOI] [PubMed] [Google Scholar]
- Arcadi AC. 1996. Phrase structure of wild chimpanzee pant hoots: patterns of production and interpopulation variability. Am J Primatol. 39:159–178. [DOI] [PubMed] [Google Scholar]
- Arsenault JS, Buchsbaum BR. 2015. Distributed neural representations of phonological features during speech perception. J Neurosci. 35:634–642. [DOI] [PMC free article] [PubMed] [Google Scholar]
- Belin P. 2006. Voice processing in human and non-human primates. Philos Trans R Soc Lond B Biol Sci. 361:2091–2107. [DOI] [PMC free article] [PubMed] [Google Scholar]
- Benson NC, Butt OH, Brainard DH, Aguirre GK. 2014. Correction of distortion in flattened representations of the cortical surface allows prediction of V1-V3 functional organization from anatomy. PLoS Comput Biol. 10:e1003538. [DOI] [PMC free article] [PubMed] [Google Scholar]
- Bonte M, Frost MA, Rutten S, Ley A, Formisano E, Goebel R. 2013. Development from childhood to adulthood increases morphological and functional inter-individual variability in the right superior temporal cortex. Neuroimage. 83:739–750. [DOI] [PubMed] [Google Scholar]
- Burton MW, Noll DC, Small SL. 2001. The anatomy of auditory word processing: individual variability. Brain Lang. 77:119–131. [DOI] [PubMed] [Google Scholar]
- Cha K, Zatorre RJ, Schonwiesner M. 2016. Frequency selectivity of voxel-by-voxel functional connectivity in human auditory cortex. Cereb Cortex. 26:211–224. [DOI] [PMC free article] [PubMed] [Google Scholar]
- Chambers AR, Hancock KE, Sen K, Polley DB. 2014. Online stimulus optimization rapidly reveals multidimensional selectivity in auditory cortical neurons. J Neurosci. 34:8963–8975. [DOI] [PMC free article] [PubMed] [Google Scholar]
- Cheung SW, Nagarajan SS, Schreiner CE, Bedenbaugh PH, Wong A. 2005. Plasticity in primary auditory cortex of monkeys with altered vocal production. J Neurosci. 25:2490–2503. [DOI] [PMC free article] [PubMed] [Google Scholar]
- Coalson TS, Van Essen DC, Glasser MF. 2018. The impact of traditional neuroimaging methods on the spatial localization of cortical areas. Proc Natl Acad Sci U S A. 115:E6356–E6365. [DOI] [PMC free article] [PubMed] [Google Scholar]
- Dick F, Tierney AT, Lutti A, Josephs O, Sereno MI, Weiskopf N. 2012. In vivo functional and myeloarchitectonic mapping of human primary auditory areas. J Neurosci. 32:16095–16105. [DOI] [PMC free article] [PubMed] [Google Scholar]
- Donahue CJ, Sotiropoulos SN, Jbabdi S, Hernandez-Fernandez M, Behrens TE, Dyrby TB, Coalson T, Kennedy H, Knoblauch K, Van Essen DC. 2016. Using diffusion tractography to predict cortical connection strength and distance: a quantitative comparison with tracers in the monkey. J Neurosci. 36:6758–6770. [DOI] [PMC free article] [PubMed] [Google Scholar]
- Farkas D, Denham SL, Winkler I. 2018. Functional brain networks underlying idiosyncratic switching patterns in multi-stable auditory perception. Neuropsychologia. 108:82–91. [DOI] [PubMed] [Google Scholar]
- Finn ES, Shen X, Scheinost D, Rosenberg MD, Huang J, Chun MM, Papademetris X, Constable RT. 2015. Functional connectome fingerprinting: identifying individuals using patterns of brain connectivity. Nat Neurosci. 18:1664. [DOI] [PMC free article] [PubMed] [Google Scholar]
- Fischl B, Sereno MI. 2018. Microstructural parcellation of the human brain. Neuroimage. 182:219–231. [DOI] [PMC free article] [PubMed] [Google Scholar]
- Franken MK, Acheson DJ, McQueen JM, Eisner F, Hagoort P. 2017. Individual variability as a window on production-perception interactions in speech motor control. J Acoust Soc Am. 142:2007. [DOI] [PubMed] [Google Scholar]
- Galaburda AM, LeMay M, Kemper TL, Geschwind N. 1978. Right-left asymmetrics in the brain. Science. 199:852–856. [DOI] [PubMed] [Google Scholar]
- Gao W, Elton A, Zhu H, Alcauter S, Smith JK, Gilmore JH, Lin W. 2014. Intersubject variability of and genetic effects on the brain's functional connectivity during infancy. J Neurosci. 34:11288–11296. [DOI] [PMC free article] [PubMed] [Google Scholar]
- Geschwind N, Levitsky W. 1968. Human brain: left-right asymmetries in temporal speech region. Science. 161:186–187. [DOI] [PubMed] [Google Scholar]
- Ghazanfar AA, Santos LR. 2003. Primates as auditory specialists. In: Ghazanfar AA, editor. Primate audition. Ethology and neurobiology. Boca Raton (FL): CRC Press, pp. 1–12. [Google Scholar]
- Glasser MF, Coalson TS, Robinson EC, Hacker CD, Harwell J, Yacoub E, Ugurbil K, Andersson J, Beckmann CF, Jenkinson M et al. 2016. A multi-modal parcellation of human cerebral cortex. Nature. 536:171–178. [DOI] [PMC free article] [PubMed] [Google Scholar]
- Gordon EM, Laumann TO, Gilmore AW, Newbold DJ, Greene DJ, Berg JJ, Ortega M, Hoyt-Drazen C, Gratton C, Sun H. 2017. Precision functional mapping of individual human brains. Neuron. 95:791–807. e797. [DOI] [PMC free article] [PubMed] [Google Scholar]
- Griffiths TD, Warren JD. 2002. The planum temporale as a computational hub. Trends Neurosci. 25:348–353. [DOI] [PubMed] [Google Scholar]
- Hackett TA, Preuss TM, Kaas JH. 2001. Architectonic identification of the core region in auditory cortex of macaques, chimpanzees, and humans. J Comp Neurol. 441:197–222. [DOI] [PubMed] [Google Scholar]
- Herholz SC, Zatorre RJ. 2012. Musical training as a framework for brain plasticity: behavior, function, and structure. Neuron. 76:486–502. [DOI] [PubMed] [Google Scholar]
- Hill J, Dierker D, Neil J, Inder T, Knutsen A, Harwell J, Coalson T, Van Essen D. 2010. A surface-based analysis of hemispheric asymmetries and folding of cerebral cortex in term-born human infants. J Neurosci. 30:2268–2276. [DOI] [PMC free article] [PubMed] [Google Scholar]
- Kaas JH. 2006. Evolution of the neocortex. Curr Biol. 16:R910–R914. [DOI] [PubMed] [Google Scholar]
- Kell AJE, McDermott JH. 2019. Invariance to background noise as a signature of non-primary auditory cortex. Nat Commun. 10:3958. [DOI] [PMC free article] [PubMed] [Google Scholar]
- King AJ, Nelken I. 2009. Unraveling the principles of auditory cortical processing: can we learn from the visual system? Nat Neurosci. 12:698–701. [DOI] [PMC free article] [PubMed] [Google Scholar]
- Liu H, Stufflebeam SM, Sepulcre J, Hedden T, Buckner RL. 2009. Evidence from intrinsic activity that asymmetry of the human brain is controlled by multiple factors. Proc Natl Acad Sci U S A. 106:20499–20503. [DOI] [PMC free article] [PubMed] [Google Scholar]
- Lu T, Wang X. 2004. Information content of auditory cortical responses to time-varying acoustic stimuli. J Neurophysiol. 91:301–313. [DOI] [PubMed] [Google Scholar]
- Lumaca M, Kleber B, Brattico E, Vuust P, Baggio G. 2019. Functional connectivity in human auditory networks and the origins of variation in the transmission of musical systems. Elife. 8:e48710. [DOI] [PMC free article] [PubMed] [Google Scholar]
- Markov NT, Ercsey-Ravasz M, Ribeiro Gomes A, Lamy C, Magrou L, Vezoli J, Misery P, Falchier A, Quilodran R, Gariel M. 2012. A weighted and directed interareal connectivity matrix for macaque cerebral cortex. Cereb Cortex. 24:17–36. [DOI] [PMC free article] [PubMed] [Google Scholar]
- Masterton RB. 1992. Role of the central auditory system in hearing: the new direction. Trends Neurosci. 15:280–285. [DOI] [PubMed] [Google Scholar]
- Mesgarani N, David SV, Fritz JB, Shamma SA. 2008. Phoneme representation and classification in primary auditory cortex. J Acoust Soc Am. 123:899–909. [DOI] [PubMed] [Google Scholar]
- Moerel M, De Martino F, Formisano E. 2014. An anatomical and functional topography of human auditory cortical areas. Front Neurosci. 8:225. [DOI] [PMC free article] [PubMed] [Google Scholar]
- Moerel M, De Martino F, Santoro R, Ugurbil K, Goebel R, Yacoub E, Formisano E. 2013. Processing of natural sounds: characterization of multipeak spectral tuning in human auditory cortex. J Neurosci. 33:11888–11898. [DOI] [PMC free article] [PubMed] [Google Scholar]
- Mueller S, Wang D, Fox MD, Yeo BT, Sepulcre J, Sabuncu MR, Shafee R, Lu J, Liu H. 2013. Individual variability in functional connectivity architecture of the human brain. Neuron. 77:586–595. [DOI] [PMC free article] [PubMed] [Google Scholar]
- Nelken I. 2004. Processing of complex stimuli and natural scenes in the auditory cortex. Curr Opin Neurobiol. 14:474–480. [DOI] [PubMed] [Google Scholar]
- Nelken I, Fishbach A, Las L, Ulanovsky N, Farkas D. 2003. Primary auditory cortex of cats: feature detection or something else? Biol Cybern. 89:397–406. [DOI] [PubMed] [Google Scholar]
- Norman-Haignere S, Kanwisher NG, McDermott JH. 2015. Distinct cortical pathways for music and speech revealed by hypothesis-free voxel decomposition. Neuron. 88:1281–1296. [DOI] [PMC free article] [PubMed] [Google Scholar]
- Pernet CR, McAleer P, Latinus M, Gorgolewski KJ, Charest I, Bestelmeyer PE, Watson RH, Fleming D, Crabbe F, Valdes-Sosa M et al. 2015. The human voice areas: spatial organization and inter-individual variability in temporal and extra-temporal cortices. Neuroimage. 119:164–174. [DOI] [PMC free article] [PubMed] [Google Scholar]
- Phillips DP, Semple MN, Calford MB, Kitzes LM. 1994. Level-dependent representation of stimulus frequency in cat primary auditory cortex. Exp Brain Res. 102:210–226. [DOI] [PubMed] [Google Scholar]
- Poeppel D, Guillemin A, Thompson J, Fritz J, Bavelier D, Braun AR. 2004. Auditory lexical decision, categorical perception, and FM direction discrimination differentially engage left and right auditory cortex. Neuropsychologia. 42:183–200. [DOI] [PubMed] [Google Scholar]
- Postma-Nilsenová M, Postma E. 2013. Auditory perception bias in speech imitation. Front Psychol. 4:826. [DOI] [PMC free article] [PubMed] [Google Scholar]
- Ressel V, Pallier C, Ventura-Campos N, Diaz B, Roessler A, Avila C, Sebastian-Galles N. 2012. An effect of bilingualism on the auditory cortex. J Neurosci. 32:16597–16601. [DOI] [PMC free article] [PubMed] [Google Scholar]
- Salmi R, Hammerschmidt K, Doran-Sheehy DM. 2014. Individual distinctiveness in call types of wild western female gorillas. PLoS One. 9:e101940. [DOI] [PMC free article] [PubMed] [Google Scholar]
- Scott BH, Mishkin M, Yin P. 2012. Monkeys have a limited form of short-term memory in audition. Proc Natl Acad Sci U S A. 109:12237–12241. [DOI] [PMC free article] [PubMed] [Google Scholar]
- Sereno M, Dale A, Reppas J, Kwong K, Belliveau J, Brady T, Rosen B, Tootell R. 1995. Borders of multiple visual areas in humans revealed by functional magnetic resonance imaging. Science. 268:803–804. [DOI] [PubMed] [Google Scholar]
- Seung S. 2012. Connectome: how the brain’s wiring makes us who we are. New York: Houghton Mifflin Harcourt Publishing Company. [Google Scholar]
- Shtyrov Y, Kujala T, Ahveninen J, Tervaniemi M, Alku P, Ilmoniemi RJ, Näätänen R. 1998. Background acoustic noise and the hemispheric lateralization of speech processing in the human brain: magnetic mismatch negativity study. Neurosci Lett. 251:141–144. [DOI] [PubMed] [Google Scholar]
- Stoecklein S, Hilgendorff A, Li M, Forster K, Flemmer AW, Galie F, Wunderlich S, Wang D, Stein S, Ehrhardt H et al. 2020. Variable functional connectivity architecture of the preterm human brain: impact of developmental cortical expansion and maturation. Proc Natl Acad Sci U S A. 117:1201–1206. [DOI] [PMC free article] [PubMed] [Google Scholar]
- Striem-Amit E, Almeida J, Belledonne M, Chen Q, Fang Y, Han Z, Caramazza A, Bi Y. 2016. Topographical functional connectivity patterns exist in the congenitally, prelingually deaf. Sci Rep. 6:29375. [DOI] [PMC free article] [PubMed] [Google Scholar]
- Tavor I, Jones OP, Mars R, Smith S, Behrens T, Jbabdi S. 2016. Task-free MRI predicts individual differences in brain activity during task performance. Science. 352:216–220. [DOI] [PMC free article] [PubMed] [Google Scholar]
- Tervaniemi M, Hugdahl K. 2003. Lateralization of auditory-cortex functions. Brain Res Rev. 43:231–246. [DOI] [PubMed] [Google Scholar]
- Van Essen DC. 2005. A population-average, landmark-and surface-based (PALS) atlas of human cerebral cortex. Neuroimage. 28:635–662. [DOI] [PubMed] [Google Scholar]
- Van Essen DC, Glasser MF. 2014. In vivo architectonics: a cortico-centric perspective. Neuroimage. 93(Pt 2):157–164. [DOI] [PMC free article] [PubMed] [Google Scholar]
- Wang D, Buckner RL, Fox MD, Holt DJ, Holmes AJ, Stoecklein S, Langs G, Pan R, Qian T, Li K. 2015. Parcellating cortical functional networks in individuals. Nat Neurosci. 18:1853. [DOI] [PMC free article] [PubMed] [Google Scholar]
- Wang D, Buckner RL, Liu H. 2014. Functional specialization in the human brain estimated by intrinsic hemispheric interaction. J Neurosci. 34:12341–12352. [DOI] [PMC free article] [PubMed] [Google Scholar]
- Wessinger CM, VanMeter J, Tian B, Van Lare J, Pekar J, Rauschecker JP. 2001. Hierarchical organization of the human auditory cortex revealed by functional magnetic resonance imaging. J Cogn Neurosci. 13:1–7. [DOI] [PubMed] [Google Scholar]
- Xu T, Falchier A, Sullivan EL, Linn G, Ramirez JS, Ross D, Feczko E, Opitz A, Bagley J, Sturgeon D. 2018. Delineating the macroscale areal organization of the macaque cortex in vivo. Cell Rep. 23:429–441. [DOI] [PMC free article] [PubMed] [Google Scholar]
- Xu T, Sturgeon D, Ramirez JS, Froudist-Walsh S, Margulies DS, Schroeder CE, Fair DA, Milham MP. 2019a. Inter-individual variability of functional connectivity in awake and anesthetized rhesus monkeys. Biol Psychiatry Cogn Neurosci Neuroimaging. 4(6):543–553. [DOI] [PMC free article] [PubMed] [Google Scholar]
- Xu Y, Cao M, Liao X, Xia M, Wang X, Jeon T, Ouyang M, Chalak L, Rollins N, Huang H et al. 2019b. Development and emergence of individual variability in the functional connectivity architecture of the preterm human brain. Cereb Cortex. 29:4208–4222. [DOI] [PMC free article] [PubMed] [Google Scholar]
- Yeo BT, Krienen FM, Sepulcre J, Sabuncu MR, Lashkari D, Hollinshead M, Roffman JL, Smoller JW, Zollei L, Polimeni JR et al. 2011. The organization of the human cerebral cortex estimated by intrinsic functional connectivity. J Neurophysiol. 106:1125–1165. [DOI] [PMC free article] [PubMed] [Google Scholar]
- Zatorre RJ, Evans AC, Meyer E, Gjedde A. 1992. Lateralization of phonetic and pitch discrimination in speech processing. Science. 256:846–849. [DOI] [PubMed] [Google Scholar]
- Zuo X-N, Anderson JS, Bellec P, Birn RM, Biswal BB, Blautzik J, Breitner JC, Buckner RL, Calhoun VD, Castellanos FX. 2014. An open science resource for establishing reliability and reproducibility in functional connectomics. Sci Data. 1:140049. [DOI] [PMC free article] [PubMed] [Google Scholar]
Associated Data
This section collects any data citations, data availability statements, or supplementary materials included in this article.
Supplementary Materials
Data Availability Statement
The CoRR-HNU dataset is publicly available through Consortium for Reliability and Reproducibility Project (http://fcon_1000.projects.nitrc.org/indi/CoRR/html/hnu_1.html). The MSC dataset is publicly available through OpenfMRI (https://openfmri.org/dataset/ds000224/). The Human-voice dataset is also publicly available through OpenfMRI (https://openfmri.org/dataset/ds000158/). MATLAB codes that support the findings of this study are available from the corresponding authors upon request.