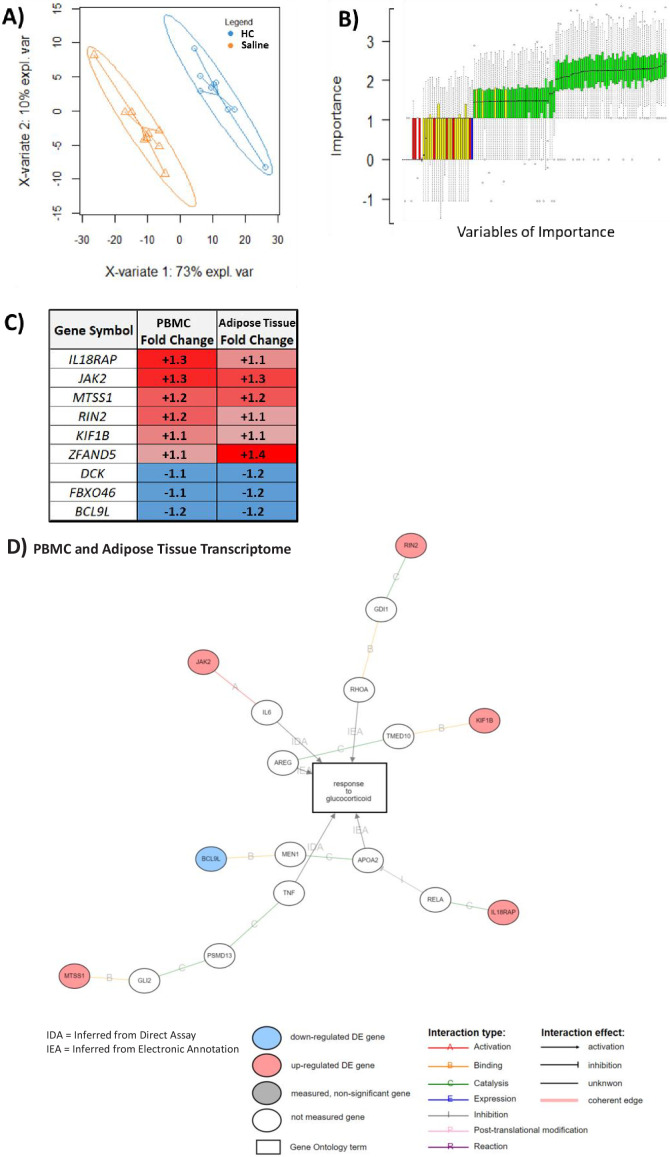
Figure 4. An overlapping gene set in peripheral blood mononuclear cell (PBMC) and adipose tissue transcriptome can be used to classify glucocorticoid (GC) response.
These analyses were performed to depict the common predictive genes in PBMCs and adipose tissue. (A) Partial least squares discriminant analysis (PLSDA) showing complete separation of hydrocortisone (HC) infusion (GC exposure, blue points) from saline infusion (GC withdrawal, orange points) using 271 of 965 PBMC transcripts confirmed as robust in the hypernetwork by analysis of dissimilarity. X-variates 1 and 2: PLSDA components; expl. var: explained variance. (B) BORUTA feature selection identifies variables (genes) of importance in classification using a Random Forest approach to model experimental background noise (green: confirmed classification; yellow: tentative classification: red: rejected classification; blue: ‘shadow’ variable modeling experimental noise). Of 271 transcripts initially used, 59 were identified as important (confirmed [green] or tentative [yellow]) in separating GC exposure from GC withdrawal, as well as having the same direction fold change in both PBMC and adipose tissue transcriptomic data sets. (C) Predictive genes that are significantly differentially expressed between GC exposure and GC withdrawal in both PBMC and adipose tissue transcriptomes and display fold change in the same direction in both tissues (n = 9). (D) Association of predictive genes (six out of nine) with GC response through gene ontology. Data demonstrates the presence of a robust transcriptomic profile predicting GC response in two independent tissues.


