
Fig. 1.
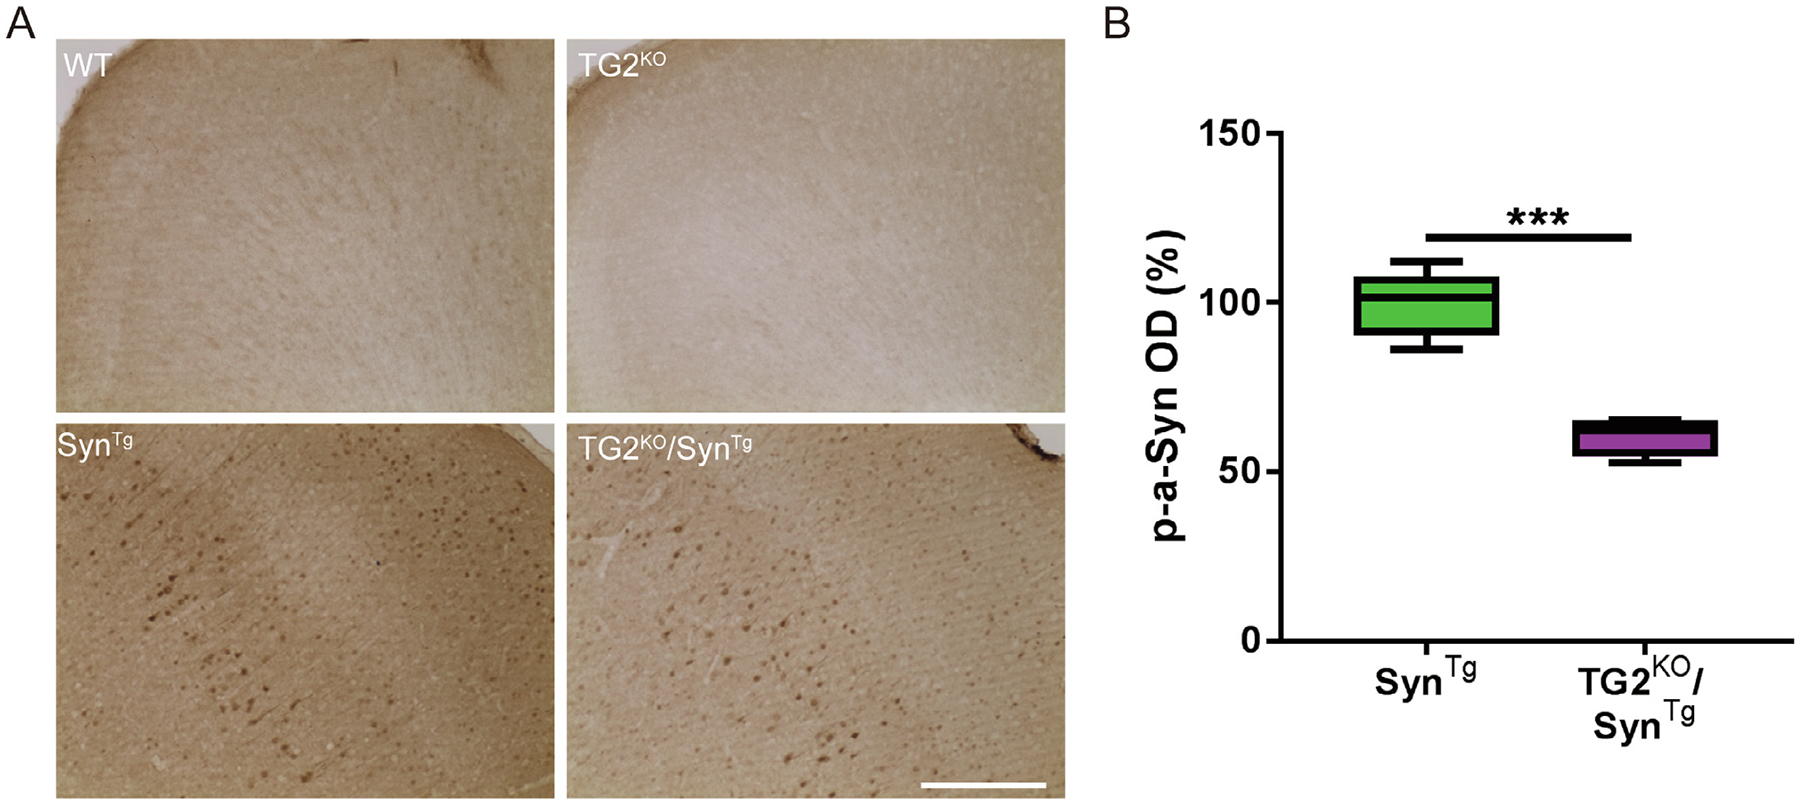
TG2 deletion decreases the formation of phosphorylated α-Syn in the mouse brain. (A) Representative images of p-α-Syn staining in the cortex of mice. (B) Quantification of p-α-Syn staining intensity in (A) (n: SynTg = 6; TG2KO/SynTg = 5). In the box-plots, the bottom and top of the box are the first and third quartiles, respectively, and the whiskers above and below the box indicate the 95th and 5th percentiles. The median is indicated as a horizontal line. ***P < 0.001, two-tailed unpaired t test. Scale bar = 50 μm.