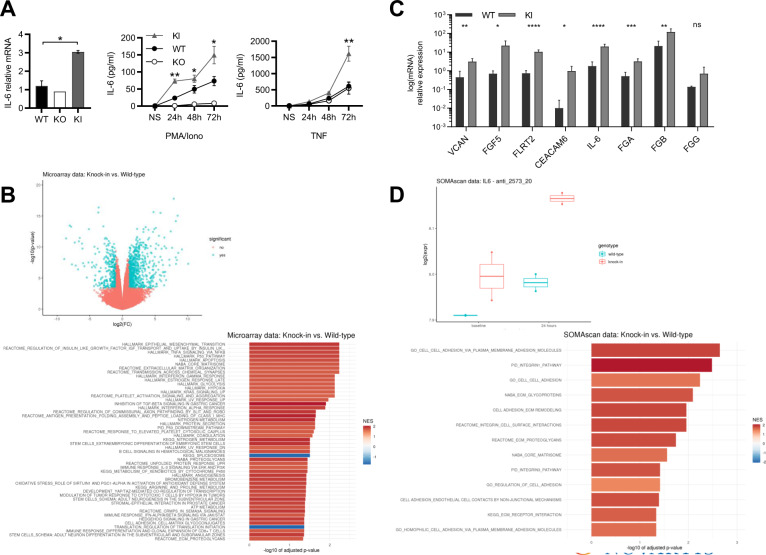
Fig. 4. CARD10 cleavage impacts IL-6 and extracellular matrix components.
A IL-6 mRNA levels measured by RT-PCR (left), 72h-time course of released IL-6 protein levels measured upon P/I (50 µg/ml/1 μM) (middle) or TNF (10 ng/ml) (right) stimulation. Data represent means ± SD of triplicates for two clones of each cell line (N = 3). Statistical analyses were carried out using GraphPad Prism software. Differences among groups were assessed using one-tailed Student’s t tests. P < 0.05 was considered to be statistically significant. B Upper panel, Volcano plot of differential mRNA expression in A549-WT and KI cells; microarray probe sets with an absolute log2 fold change of ≥ 1 and a false discovery rate-adjusted p ≤ 0.01 are colored in blue. Lower panel, Gene set enrichment analysis of the data shown in the upper panel. Shown are the top 50 of 69 gene sets significant at a false discovery rate < 0.05. NES Normalized Enrichment Score. Highly significant pathways were (i) cancer (p53, KRAS) (ii) inflammation (NF-κB, TNF), (iii) cancer-related processes (extracellular matrix (ECM), apoptosis, and angiogenesis), with a particular enrichment of gene sets linked to ECM regulation (matrisome, ECM organization, proteoglycans, cell adhesion-matrix glycogonjugates, and ECM proteoglycans). C Relative quantitative PCR measurement of eight selected mRNAs contributing to ECM regulation signatures at basal level in A549-WT or KI: Versican (VCAN), Fibroblast growth factor 5 (FGF5), Fibronectin Leucine Rich Transmembrane Protein 2 (FLRT2), CEA Cell Adhesion Molecule 6 (CEACAM6), Interleukin-6 (IL-6), and fibrinogen genes FGA, FGB, and FGG). Means ± SD of triplicates for two clones of each cell line are shown (N = 2). Statistical analyses were carried out as described in (A). Microarray values for the eight leading edge mRNAs (Fig. 4C) are shown in Supplementary Fig. 8. D Upper panel, Box plot of IL-6 protein levels as measured by SomaScan (SOMAmer anti_2573_20) in A549-WT and KI cells, at baseline and after a 24 h stimulation with P/I. Lower panel, Gene set enrichment analysis of longitudinal SomaScan data comparing the effects over time in A549-WT and KI cells. A selection of 124 gene sets related to ECM regulation was used. Shown are the 13 gene sets significant at a false discovery rate < 0.05; NES Normalized Enrichment Score.

