

Abstract
Sorafenib is a first-line molecular-target drug for advanced hepatocellular carcinoma (HCC), but its clinical effects are still limited. In this study we identify Quiescin sulfhydryl oxidase 1 (QSOX1) acting as a cellular pro-oxidant, specifically in the context of sorafenib treatment of HCC. QSOX1 disrupts redox homoeostasis and sensitizes HCC cells to oxidative stress by inhibiting activation of the master antioxidant transcription factor NRF2. A negative correlation between QSOX1 and NRF2 expression was validated in tumor tissues from 151 HCC patients. Mechanistically, QSOX1 restrains EGF-induced EGFR activation by promoting ubiquitination-mediated degradation of EGFR and accelerating its intracellular endosomal trafficking, leading to suppression of NRF2 activity. Additionally, QSOX1 potentiates sorafenib-induced ferroptosis by suppressing NRF2 in vitro and in vivo. In conclusion, the data presented identify QSOX1 as a novel candidate target for sorafenib-based combination therapeutic strategies in HCC or other EGFR-dependent tumor types.
Keywords: QSOX1, HCC, ROS, Antioxidant, Ferroptosis
Abbreviations: HCC, hepatocellular carcinoma; QSOX1, Quiescin sulfhydryl oxidase 1; NRF2, Nuclear factor E2-related factor 2; EGFR, Epidermal growth factor receptor; ROS, reactive oxygen species; KEAP1, Kelch-like ECH-associated protein 1; ARE, antioxidant reactive element; NADPH, nicotinamide adenine dinucleotide phosphate; SOD1, superoxide dismutase 1; SOD2, Superoxide dismutase; [Mn], mitochondrial; CAT, Catalase; GCLC, Glutamate-cysteine ligase catalytic subunit; NQO1, NAD(P)H dehydrogenase [quinone]; HO-1, Heme oxygenase 1; SLC7A11, solute carrier family 7 member 11; GSH, glutathione; NAC, N-acetyl-l-cysteine; ΔΨm, mitochondrial membrane potential; H2O2, hydrogen dioxide; SFN, sulforaphane; AT, alkaloid trigonelline; TCGA, The Cancer Genome Altas; OS, overall survival; Fer-1, ferrostatin-1; Necro, necrosulfonamide
Graphical abstract

Highlights
-
•
QSOX1 impairs the antioxidant capacity of HCC cells by inhibiting NRF2 activation.
-
•
QSOX1 inhibits NRF2 activation by accelerating EGFR signaling termination.
-
•
QSOX1 promotes sorafenib-induced ferroptosis in HCC.
-
•
QSOX1 is a potential biomarker for adjuvant sorafenib treatment in HCC patients.
1. Introduction
Hepatocellular carcinoma (HCC) is a leading cause of cancer-related deaths worldwide [1]. Patients with unresectable advanced stage HCC have a poor prognosis [2]. Currently, small-molecule multi-kinase inhibitors, such as sorafenib, lenvatinib and regorafenib, as well as immune checkpoint inhibitors, have been approved by the US Food and Drug Administration for treatment of advanced HCC [[3], [4], [5]]. Unfortunately, the clinical benefits of these drugs are limited. A better understanding of the drug-resistant mechanisms underlying the biology of HCC and the identification of novel molecular targets is of central importance for establishing more effective treatments.
Sorafenib is a first-line molecular-target drug with an established survival benefit for HCC. Sorafenib inhibits Raf, VEGF, PDGF and c-Kit signaling resulting in anti-proliferative and anti-angiogenic effects with enhanced apoptosis [2]. However, the acquired or intrinsic resistance of cancer cells to apoptosis can limit the induction of apoptotic cell death by sorafenib. Recently, sorafenib was identified as an inducer of ferroptosis, a newly described form of regulated cell death [6,7]. Distinct from apoptosis and necrosis, ferroptosis is characterized by lipid peroxidation that relies on reactive oxygen species (ROS) generation and iron availability [8]. Ferroptostic events such as GSH depletion, ferrous iron (Fe2+) induction and increasing lipid ROS generation have been frequently observed in sorafenib-treated HCC cells [9,10]. Therefore, promoting sorafenib-induced ferroptosis may represent a novel therapeutic avenue for better treatment of hepatocellular carcinoma.
An increased intrinsic and adaptive antioxidant capacity helps cancer cells survive oxidative damage [11]. Nuclear factor E2-related factor 2 (NRF2) is a master transcriptional factor that transcriptionally regulates a pool of antioxidant enzyme genes whose protein products help control important biological processes linked to the reduction of ROS and defense against oxidative stress [[12], [13], [14]]. Under normal conditions, NRF2 is constitutively present at low levels in the cytoplasm due to KEAP1-mediated ubiquitination and proteasomal degradation. In response to oxidative stress, cytoplasmic NRF2 is stabilized, it translocates to the nucleus where it binds to antioxidant reactive elements (ARE) present in cytoprotective target genes and promotes their transcription. In addition to the canonical KEAP1-mediated regulation, NRF2 expression and activation is also controlled by a KEAP1-independent- PI3K-AKT-dependent mechanism [15]. It has been reported that in non-small-cell lung cancer cells with EGFR gene mutations, NRF2 can be constitutively activated through continuous activation of EGFR signaling [16]. In HCC, NRF2 is frequently found to be up-regulated and activated in tumor tissues and its expression is associated with malignant phenotypes that show a poor prognosis [17]. Because of its central role in regulation of cell antioxidant capacity, NRF2 is a key factor for protection of HCC cells from ferroptotic cell death. Thus, targeting NRF2 may represent a potential strategy to overcome resistance of sorafenib-induced ferroptosis and enhance tumor therapy.
Quiescin sulfhydryl oxidase 1 (QSOX1) is a disulfide catalyst that oxidizes thiols during protein folding and reduces oxygen to hydrogen peroxide as a byproduct [18]. QSOX1 plays a role during disulfide bond formation in a variety of proteins and is also involved in various cancer-related processes such as autophagy and extracellular matrix modulation [19]. QSOX1 mainly localizes to the Golgi apparatus and intracellular vesicles, suggesting a potential role in intracellular vesicle transport. In a previous study we identified QSOX1 as a tumor suppressor in HCC [20]. We found that QSOX1 can inhibit EGFR signaling and suppress the invasive and metastatic capacity of HCC cells. However, the broader molecular mechanisms underlying the antitumor effects of QSOX1 in HCC remain to be identified. Here, we investigated the potential mechanism of QSOX1 impairment of the antioxidative capacity and promotion of ferroptosis in HCC cells in the context of sorafenib treatment.
2. Results
2.1. QSOX1 reduces cellular antioxidant capacity and therefore sensitizes HCC cells to oxidative stress
To investigate potential biological processes involving QSOX1 and oxidative stress that could impact HCC, we first downloaded and analyzed relevant mRNA-sequence data from the LIHC data set (Cbioportal) of TCGA database as described in Supplementary Material and Methods. Gene Set Enrichment Analysis (GSEA) identified QSOX1 as generally associating with oxidation-reduction process, oxidoreductase activity, and lipid oxidation (Fig. 1a). We specifically focused on oxidation-reduction process and then asked if QSOX1 expression could be linked to the regulation of redox homoeostasis in HCC. The effect of QSOX1 levels on redox balance in HCC cells was then explored using a QSOX1 overexpression system and lentivirus-mediated knockdown (Fig. S1). We first examined the subsequent effect on the nicotinamide adenine dinucleotide phosphate (NADPH) and glutathione (GSH) systems that represent important guardians for maintaining cell redox homoeostasis. QSOX1 over-expression in MHCC97H cells (MHCC97H/QSOX1 cells) resulted in significantly decreased ratios of NADPH/NADP+ and GSH/GSSG (Fig. 1b and c). By contrast, QSOX1 knockdown in Hep3B cells (Hep3B/shQSOX1 cells) led to increased ratios suggesting that QSOX1 can alter the redox balance in HCC cells by shifting towards oxidation. To determine whether redox changes caused by QSOX1 is accompanied by ROS accumulation, we tested intracellular ROS levels in the HCC cells with QSOX1 overexpression or knockdown. Since endogenic ROS are mainly produced in mitochondria, we also tested mitochondrial ROS levels in these cells. We found both intracellular ROS levels and mitochondrial ROS levels in MHCC97H/QSOX1 cells were elevated significantly as compared to controls, and this phenotype could be reversed by addition of antioxidant N-acetyl-l-cysteine (NAC) (Fig. 1d–f and Fig. S1). By contrast, both intracellular total and mitochondrial ROS levels in Hep3B/shQSOX1 cells were found significantly reduced as compared with controls. We further examined potential changes in mitochondrial membrane potential (ΔΨm) in these cells to determine if mitochondrial function was impaired by the elevated ROS. MHCC97H/QSOX1 cells showed a decreased ΔΨm as compared to controls as revealed by a higher proportion of cells with depolarized mitochondria, whereas Hep3B/shQSOX1 cells showed an increased ΔΨm (Fig. 1g). NAC treatment restored the decreased ΔΨm associated with QSOX1 overexpression in MHCC97H cells. The disruptive effects of QSOX1 on ΔΨm also were observed visually via JC-1 staining (Fig. S1). These results suggest that QSOX1 raises ROS levels and thus damages ΔΨm in HCC cells. We further hypothesized that QSOX1 may act to limit the antioxidant capacity of HCC cells and thus sensitize these cells to damage by ROS. In support of this hypothesis, MHCC97H/QSOX1 cells showed an impaired cellular antioxidant capacity as compared to controls, whereas Hep3B/shQSOX1 exhibited an enhanced antioxidant capacity (Fig. 1h). We then treated HCC cells with hydrogen dioxide (H2O2) and found that HCC cells with QSOX1 overexpression were more sensitive to H2O2 treatment than controls, while HCC cells with QSOX1 knockdown were more resistant to H2O2 treatment (Fig. 1i and Fig. S2). Taken together, these results strongly suggest that QSOX1 expression impairs antioxidant capacity, disrupts the redox balance of HCC cells and sensitizes them to oxidative stress-induced damage.
Fig. 1.

QSOX1 disturbs cellular redox homoeostasis, impairs cellular antioxidant capacity and sensitizes HCC cells to oxidative stress. (a) GSEA plots of genes in high QSOX1 expression group compared with low QSOX1 expression group. High-rank gene sets are shown with the enrichment score, normalized enrichment score (NES) and nominal P valve. (b) NADPH/NADP+ ratio and (c) GSH/GSSH ratio were measured in the indicated cells. (d-e) Intracellular ROS of the indicated cells were stained by CM-H2DCFDA and determined by flow cytometry (FCM). (f) Mitochondrial ROS were stained by MitoSOX Red and measured by fluorescence microplate reader. The fold changes of ROS levels relative to controls were shown. (g) The cells with depolarized mitochondria are represented as the cells that have lost ΔΨm. The proportions of the cell with depolarized mitochondria in the indicated cells are shown. For NAC treatment in d, f and g, MHCC97H/QSOX1 cells were pre-treated with 100 nM NAC for 24 h before collection. (h) Total antioxidant capacity in the indicated cells was detected. (i) Cell death was determined in the indicated cell with treatment of the incremental doses of H2O2 for 24 h. All data are representative of three independent experiments with similar results and presented as the mean ± SEM. *, p < 0.05, **, p < 0.01, ***, p < 0.001. (For interpretation of the references to colour in this figure legend, the reader is referred to the Web version of this article.)
2.2. QSOX1 impairs antioxidant capacity of HCC cells by suppressing NRF2 activation
Because NRF2 is a recognized “master regulator” of the cellular antioxidant response, we sought to determine if QSOX1 might negatively impact NRF2 expression and activation in HCC. NRF2 protein levels were significantly lower in MHCC97H/QSOX1 cells as compared to controls, whereas NRF2 levels were increased in Hep3B/shQSOX1 cells (Fig. 2a). While protein levels were altered, no significant change in Nfe2l2 steady state mRNA expression was found in either setting (Fig. S3), suggesting that a post-transcriptional control mechanism may contribute to the reduced NRF2 protein levels linked to QSOX1 expression. We then sought to determine if QSOX1could effect NRF2 protein stability. The NRF2 protein was found to have a shorter half-life in MHCC97H/QSOX1 cells, and by contrast was more prolonged in Hep3B/shQSOX1 when compared to their control counterparts (Fig. 2b). Furthermore, we could show that NRF2 was more ubiquitinated in MHCC97H/QSOX1 than in control cells. By contrast, the ubiquitination of NRF2 was attenuated in Hep3B/shQSOX1 cells as compared to controls (Fig. 2c).
Fig. 2.

QSOX1 impairs antioxidant capacity of HCC cells by suppressing NRF2 activation. (a) NRF2 expression levels in the whole cell lysate from the indicated cells were assessed using Western blot. (b) The half-life of NRF2 in HCC cells with QSOX1 overexpression or knockdown was assayed. Cells were incubated with 20 μg/mL cycloheximide (CHX) and lysed at indicated time points followed by Western blot. (c) Ubiquitination of NRF2 was enhanced by QSOX1 overexpression and was attenuated by QSOX1 knockdown. The cells were lysed and immunoprecipitated with anti-NRF2 antibody followed by Western blot analysis with anti-ubiquitin antibody. (d-e) QSOX1 promoted the translocation of NRF2 from cytoplasm to nucleus in HCC cells. NRF2 location in the indicated cells was observed using fluorescent microscopy. Green: NRF2; Blue: DAPI. Scale bar: 50 μm. The NRF2 expression levels in cytoplasmic fraction and nuclear fraction from the indicated cells were analyzed using Western blot. (f) The mRNA expression of the indicated antioxidant genes targeted by NRF2 was detected with qRT-PCR in the indicated cells. The number shown in the heatmap mean the transcript levels normalized by those of cells transduced with empty vector. (g-h) Intracellular ROS, mitochondrial ROS and proportion of the cells with depolarized mitochondria were measured in the indicated cells. For SFN and AT treatment, MHCC97H/QSOX1 cells and Hep3B/shQSOX1 cells were treated with 5 μM SFN and 0.5 μM AT for 24 h before collection, respectively. All data are representative of three independent experiments with similar results and presented as the mean ± SEM. *, p < 0.05, **, p < 0.01, ***, p < 0.001. (For interpretation of the references to colour in this figure legend, the reader is referred to the Web version of this article.)
We then analyzed the effect of QSOX1 on the nuclear translocation of NRF2 and examined mRNA levels of a series of NRF2 target genes involved in regulation of redox balance. Data from immunofluorescence staining showed that the nuclear NRF2 staining signal was markedly weaker in the MHCC97H/QSOX1 cells than in vector-control counterparts, whereas the nuclear NRF2 signal was stronger in the Hep3B/shQSOX1 cells as compared to controls (Fig. 2d and e). These results were validated by immunoblotting of cytoplasmic and nuclear protein extracts. In line with these findings, overexpression of QSOX1 in MHCC97H cells significantly decreased mRNA levels of some important NRF2 target antioxidant genes (Fig. 2f). Conversely, QSOX1 knockdown in Hep3B cells increased mRNA levels of these antioxidant enzymes. Fig. 2d and e showed that the loss/gain of NRF2 in cytosolic and nuclear fractions were similar whether in MHCC97H/QSOX1 or Hep3B/shQSOX1. That suggests that the differences in the nuclear protein content are due to the differential degradation of the NRF2 protein.
Finally, we sought to determine if NRF2 mediated the QSOX1 effects seen on redox homoeostasis in HCC cells. Treatment with the NRF2 activator sulforaphane (SFN) blocked the increased intracellular and mitochondrial ROS levels, and reduced the decline in ΔΨm caused by QSOX1 overexpression in MHCC97H cells (Fig. 2g). By contrast, treatment with the NRF2 inhibitor alkaloid trigonelline (AT) reversed the decreased intracellular and mitochondrial ROS, and increased ΔΨm that resulted from QSOX1 knockdown in the Hep3B cells (Fig. 2h). In summary, QSOX1 appears to facilitate the degradation of NRF2 protein, reduce its nuclear translocation and inhibit functional NRF2 activation and thereby reduce the antioxidant capacity of HCC cells.
QSOX1 levels negatively correlate with NRF2 levels in HCC tissues, and in combination expression of the two proteins represent a robust predictor for HCC prognosis.
To investigate the expression of QSOX1 in HCC tissues and non-tumorous hepatic tissues, mRNA expression levels of QSOX1 were assessed in 95 pairs of tumoral and matched peritumoral tissues from HCC patients who had undergone hepatectomy in our hospital. A Waterfall plot is shown in Fig. 3a. It demonstrates that QSOX1 mRNA levels in tumor tissues from 48% (46/95) of the HCC patients were decreased by twofold as compared to corresponding peritumoral tissues. Only 25% (24/95) of the patient samples showed twofold up-regulation as compared to the corresponding peritumoral tissues. In general, QSOX1 mRNA expression levels in tumor tissues were significantly lower than those in the peritumoral tissues (Fig. 3a). These results were additionally validated by analysis of the TCGA database (Fig. S4). The QSOX1 protein expression levels in tumor tissues were also reduced as compared to their non-tumorous counterparts (Fig. 3b).
Fig. 3.

QSOX1 expression negatively correlates with NRF2 expression in HCC tissues, and in combination represent a better predictor for HCC prognosis. (a) The mRNA expression levels of QSOX1 were detected in 95-paired tumor and peritumoral tissues from HCC patients by qRT-PCR. Left: waterfall plots presented the log2-transformed fold change of QSOX1 mRNA (T/N = − [(CTQSOX1 - CTGAPDH) of HCC - (CTQSOX1 - CTGAPDH) of peritumor]). Right: paired QSOX1 mRNA expression in tumor and non-tumorous tissues was compared using paired Student's t-test. (b) The expression levels of QSOX1 in paired tumor and peritumoral tissues from 4 HCC patients was compared using Western blot. (c) Representative IHC figures of QSOX1 and NRF2 expression patterns in the indicated groups are shown. Scale bar: 500 μm. (d) QSOX1 and NRF2 expression levels in 151 paired HCC and peritumoral samples were respectively compared by Student's t-test. (e) In total 151 HCC samples, the percentages of tumor tissues with high or low NRF2 expression levels in those with high or low QSOX1 expression levels are shown, and the correlation between QSOX1 and NRF2 expression was analyzed using Pearson χ2 test. (f) High tumor NRF2 levels and (g) low tumor QSOX1 levels were significantly related to poor overall survival in HCC patients. (h) Combination of low QSOX1 and high NRF2 levels showed poor overall survival among all groups. The median IHC score of tumor QSOX1 or NRF2 levels was used as cut off for classification of high and low expression groups. **, p < 0.01.
To further confirm a correlation between QSOX1 and NRF2 in HCC patient tissues, IHC staining for QSOX1 and NRF2 was performed in 151 paired tumor and peritumoral tissue samples from the HCC patient cohort (Detailed patient information is provided in Supplementary materials). QSOX1 staining was found mainly in the cytoplasm of both HCC cells and peritumoral hepatocytes, whereas NRF2 was primarily expressed in the nucleus of HCC cells, and in a few nuclei of peritumoral hepatocytes (Fig. 3c and Fig. S4). Based on IHC scoring, the QSOX1 levels in tumor tissues were significantly lower than those found in the peritumoral tissues, whereas the NRF2 levels in tumor tissues were significantly higher than those seen in peritumoral tissues (Fig. 3d). Using median IHC score as cut off for both tumor QSOX1 and NRF2 levels, HCC patients were stratified into four groups as indicated in Fig. 3c. Representative figures of QSOX1 and NRF2 expression patterns in tumor tissues from the four groups are shown in Fig. 3c. Fig. 3e demonstrates that 62% of the tumor tissue samples showing lower QSOX1 levels tended to express higher NRF2 levels, while 59% of the tumor tissue specimens showing higher QSOX1 exhibited lower NRF2 expression (χ2 = 6.52). Moreover, we could show that increased QSOX1 mRNA expression was negatively associated with specific NRF2 target antioxidant genes in liver hepatocellular carcinoma (LIHC) expression data taken from the TCGA database (Fig. S4). These results strongly suggest that QSOX1 expression is negatively correlated with NRF2 in HCC tissues.
Finally, Kaplan-Meier analyses for overall survival (OS) was performed on the 151 HCC patient samples using the subgroup classification described above. Consistent with previous studies, patients with high tumor tissue NRF2 levels had a markedly shorter OS than those with low NRF2 levels (Fig. 3f) (14). Patients with high QSOX1 tumor tissue levels had a significantly prolonged OS as compared to patients with low QSOX1 levels (Fig. 3g). Importantly, we found that patients with low QSOX1 levels combined with high NRF2 levels in their tumor tissues had the shortest OS among all four groups, while those with high QSOX1 combined with low NRF2 levels in their tumor tissues had the longest OS (Fig. 3h). In conclusion, tumor QSOX1 and NRF2 levels when used together may represent a valuable predictor for the prognosis of HCC patients who have undergone HCC curative resection.
2.3. QSOX1 attenuates NRF2 activation partially by restraining EGFR signaling
The physical interaction between KEAP1 and NRF2 can be disrupted by proteins that contain a ETGE or ETGE-like KEAP1-binding motif, resulting in modulation of KEAP1-dependent regulation of NRF2 activation [21]. There is no ETGE or ETGE-like motif present in QSOX1 (Fig. S5). Further, we could not demonstrate interaction between QSOX1 and KEAP1 or p62 by co-IP (Fig. S5). Our previous work had suggested that QSOX1 could inhibit EGFR signaling in HCC cells [20]. Several studies have also linked EGFR signaling to activation of NRF2 [16]. We hypothesized that QSOX1 may act to suppress NRF2 activation by inhibiting EGFR signaling. To test this hypothesis, we used an activator of EGFR signaling (EGF) to stimulate MHCC97H/QSOX1 cells, and treated Hep3B/shQSOX1 cells with the EGFR inhibitor gefitinib. As shown in Fig. 4a, when EGF was absent, QSOX1 overexpression in MHCC97H cells resulted in decreased phosphorylated EGFR (p-EGFR), and reduced total cellular and nuclear NRF2 protein levels. These results suggest that QSOX1 can inhibit both EGFR and NRF2 activity. When EGF was administrated to MHCC97H/QSOX1 cells and vector control cells, an increase in both total cellular and nuclear NRF2 expression levels was observed with increasing p-EGFR. By contrast, p-EGFR and total cellular and nuclear NRF2 expression levels were significantly elevated in Hep3B/shQSOX1 cells as compared to the controls in the absence of gefitinib. Addition of gefitinib which blocks EGFR signaling, effectively reversed the NRF2 protein levels caused by QSOX1 knockdown in the Hep3B cells (Fig. 4b). These data suggest that QSOX1 may suppress NRF2 activation by restraining EGFR signaling.
Fig. 4.

QSOX1 inhibits NRF2 activation by limiting EGFR signaling. (a-b) Western blot revealed protein expression levels of EGFR, p-EGFR and NRF2 in whole cell lysate or nuclear fraction from the indicated cells. For EGF treatment, MHCC97H/QSOX1 cells were pre-treated with 100 ng/mL EGF for 24 h before collection. For gefitinib treatment, Hep3B/shQSOX1 cells were pre-treated with 10 μM gefitinib for 4 h before collection. (c-d) QSOX1 reduced EGFR protein stability after EGF stimulation in HCC cells. The indicated cells were pre-starved overnight with DMEM containing 1% FBS and then stimulated with 20 μg/mL CHX. Cells were collected at indicated time points (minute) for subsequent Western blot analysis. (e-f) QSOX1 reduced the intensity and duration of EGF-induced EGFR signaling activation. All cells were pre-starved overnight as described in (c-d) and then treated with 100 ng/mL EGF for the indicated period. The expression levels of EGFR, p-EGFR and NRF2 were determined using Western blot at the indicated time points (e left and f left) and were quantified using densitometry (e right and f right). Student's t tests were used to compare the means of two groups. All data are representative of three independent experiments with similar results and presented as the mean ± SEM. *, p < 0.05, **, p < 0.01, ***, p < 0.001.
We next attempted to identify the mechanism by which QSOX1 affects EGFR in HCC cells. Steady state EGFR mRNA levels were not consistent with EGFR protein levels measured in the MHCC97H/QSOX1 cells or Hep3B/shQSOX1 cells (Fig. S5), suggesting a potential post-transcriptional regulation mechanism for the reduced EGFR protein expression caused by QSOX1 expression. EGFR signaling is triggered by the binding of epidermal growth factor (EGF). A negative feedback governed by ligand-induced lysosomal degradation of EGFR helps ensure signal termination has been previously identified [22].
We then analyzed the stability of EGFR protein in the MHCC97H/QSOX1 and Hep3B/shQSOX1 cell lines. QSOX1 overexpression reduced the half-life of EGFR protein as compared to control (Fig. 4c). By contrast, QSOX1 knockdown markedly prolonged the half-life of EGFR protein as compared to control (Fig. 4d). These data suggest that QSOX1 promotes EGFR degradation in HCC cells. We subsequently investigated the effects of QSOX1 on both the duration and intensity of EGF-induced EGFR signaling. Stimulation of MHCC97H/QSOX1 cells by EGF resulted in a slight early increase in p-EGFR, followed by a rapid decline in signaling as well as attenuation of NRF2 levels as compared to controls (Fig. 4e). By contrast, stimulation of Hep3B/shQSOX1 cells with EGF led to a rapid robust increase in p-EGFR, with a longer duration of EGFR signaling, as well as a slower decline in NRF2 levels as compared to control (Fig. 4f). Collectively, these data suggest that QSOX1 promotes EGF-induced EGFR degradation and therefore reduces the intensity and duration of EGF-induced EGFR signaling, thereby suppressing the activity of downstream NRF2.
2.4. QSOX1 promotes ubiquitination of EGFR and accelerates EGFR endosome trafficking after EGF-induced EGFR internalization
Ubiquitination is a critical signal required for EGFR sorting into multi-vesicular endosomes and lysosomal degradation [23]. To determine if QSOX1 could increase the ubiquitination of EGFR and thus promote EGF-induced EGFR lysosomal degradation, ubiquitination analyses were performed in MHCC97H/QSOX1 and Hep3B/shQSOX1. EGFR showed higher ubiquitination levels in MHCC97H/QSOX1 cells as compared to control cells. Levels of ubiquitinated EGFR were reduced in the Hep3B/shQSOX1 cells as compared to controls (Fig. 5a). These results suggest that increased QSOX1 levels may actively promote EGFR lysosomal degradation in HCC cells. We next used co-IP assays to investigate a physical interaction between QSOX1 and EGFR. Antibody to EGFR was able to pull down endogenous QSOX1 from both MHCC97H and Hep3B cells, but only following EGF stimulation (Fig. 5b). This observation was further confirmed by immunofluorescence staining where cytoplasmic co-localization of QSOX1 and EGFR was observed only after EGF stimulation (Fig. 5c).
Fig. 5.

QSOX1 promotes ubiquitination of EGFR and accelerates EGF-induced EGFR endosome trafficking. (a) The ubiquitination level of EGFR in the indicated cells was analyzed. The HCC cells were incubated with or without 10 μM MG-132 for 4 h and then lysed to immunoprecipitate with anti-EGFR antibody followed by western blotting with an anti-ubiquitin antibody. (b) QSOX1 interacted with EGFR after EGF stimulation. MHCC97H and Hep3B cells were pre-starved overnight with DMEM containing 1% FBS and then incubated with or without 100 ng/mL EGF for 15 min. Cells were lysed to immunoprecipitate with anti-EGFR antibody followed by Western blot analysis with an anti-QSOX1 antibody. (c) Representative immunofluorescence staining showed co-localization of QSOX1 and EGFR in MHCC97H cells. The cells were pre-starved and treated with or without 100 ng/mL EGF. Green: EGFR. Red: QSOX1. Blue: DAPI. Scale bar: 20 μm (d-g) Immunofluorescence shows co-localization between EGFR and Rab5 or Rab7, respectively. The indicated cells were pre-starved and then stimulated with EGF as in b, followed by immunofluorescence staining at indicated time points. Cells were costained with anti-EGFR (Red) and -Rab5 (Green, d and f) or -Rab7 (Green, e and g) antibodies. The co-localization of EGFR and Rab5 or Rab7 were quantified using Mander's coefficient and results were showed in the histogram. Data from Independent 3 random fields containing at least 50 cells were presented. Scale bar: 10 μm. All data presented as the mean ± SEM.*, p < 0.05, **, p < 0.01, ***, p < 0.001. (For interpretation of the references to colour in this figure legend, the reader is referred to the Web version of this article.)
We next investigated how QSOX1 affects EGF-induced intracellular trafficking of EGFR from early endosomes to late endosomes in HCC cells by using co-immunofluorescent staining of EGFR with early (Rab5) and late endosome markers (Rab7). As shown in Fig. 5d and e, at 30-min after EGF stimulation, the majority of EGFR was co-localized with Rab5 rather than Rab7 in all the cells tested, suggesting that QSOX1 does not affect the EGF-induced internalization of EGFR and subsequent trafficking to early endosomes. However, at 90-min after EGF stimulation, we observed significantly more co-localization of EGFR with Rab7 in the MHCC97H/QSOX1 cells than in the controls, where EGFR signal was generally associated with Rab5 (Fig. 5f and g). By contrast, Fig. 5f and g shows that at 120-min after EGF stimulation of Hep3B/shQSOX1 cells, more EGFR was found co-localized with Rab5 than Rab7, as compared to controls, while in the control cells more co-localization of EGFR and Rab7 was observed. In addition, the cytoplasmic co-localization of QSOX1 with Rab5 and Rab7 in HCC cells confirmed that QSOX1 localized to the endosomes, which supports its role in EGFR endosome trafficking (Fig. S6). Taken together, these data strongly suggest that QSOX1 enhances EGFR endosome trafficking from early to late endosome after EGF-induced internalization and promoting lysosomal degradation of the receptor in HCC cells.
2.5. QSOX1 promotes sorafenib-induced ferroptosis by downregulating NRF2 in HCC cells
Recently, NRF2 was found to promote resistance to sorafenib-induced ferroptosis [10]. We speculated whether QSOX1 might also enhance sorafenib-induced ferroptosis through modulation of NRF2 and thus improve the anticancer effects of sorafenib. In the context of sorafenib treatment, we found that QSOX1 overexpression resulted in an increased death or reduced viability of MHCC97H cells as compared to vector cells, whereas QSOX1 knock down resulted in less death or increased viability of Hep3B cells as compared to shNT cells (Fig. 6a and Fig. S7). These data suggest that QSOX1 may enhance the sensitivity of HCC cells to sorafenib treatment. We further investigated the effect of QSOX1 on EGFR and NRF2 expression in the context of sorafenib treatment. The combination of QSOX1 overexpression and sorafenib treatment led to a more pronounced decline of p-EGFR and NRF2 levels in the MHCC97H cells than was seen with sorafenib treatment alone (Fig. 6b). By contrast, QSOX1 knockdown partly recovered p-EGFR and NRF2 levels which were reduced by the sorafenib treatment in Hep3B cells. These results suggest that QSOX1 may cooperate with sorafenib to suppress EGFR/NRF2 signaling in HCC cells.
Fig. 6.

QSOX1 promotes sorafenib-induced ferroptosis by inhibiting NRF2 in HCC cells. (a) The indicated cells were treated with increasing doses of sorafenib for 24 h and the cell death was measured. (b) The expression of EGFR, p-EGFR and NRF2 were assayed by Western blot in the indicated cells, untreated or treated with 5 μM sorafenib for 24 h. (c) Indicated cells were treated with or without 5 μM sorafenib for 24 h in the presence of different cell death inhibitors (Fer-1: Ferrostatin-1 5 μM; DFO: Deferoxamine 50 μM; ZVAD: ZVAD-FMK 10 μM; Necro: Necrosulfonamide 1 μM). Cell death was measured using cytotoxicity LDH assay. (d) Indicated cells were untreated or treated with 5 μM sorafenib for 24 h. Cells were lysed and GSH content measured. (e-h) Indicated cells were treated without or with 5 μM sorafenib for 24 h. Cells were collected, and flow cytometry was used to detect (e-f) Fe2+ levels and (g-h) lipid peroxides. For SFN and AT treatment in d-h, 5 μM SFN and 0.5 μM AT were used for 24 h. All data are representative of three independent experiments with similar results and presented as the mean ± SEM. *, p < 0.05, **, p < 0.01, ***, p < 0.001.
To investigate the type of cell death associated with increased QSOX1 expression and sorafenib treatment, we evaluated the effect of the ferroptosis inhibitors Ferrostatin-1 and Deferoxamine, the apoptosis inhibitor ZVAD-FMK, and the necroptosis inhibitor Necrosulfonamide on the cell death seen. Fig. 6c shows that for all tested cells (MHCC97H/QSOX1, Hep3B/shQSOX1 and their control counterparts), only Ferrostatin-1 and Deferoxamine were able to protect cells from sorafenib-induced cell death. ZVAD-FMK and Necrosulfonamide had no significant effect on the sorafenib-induced cell death as previously reported [10]. These data suggest that sorafenib causes HCC cell death mainly by inducing ferroptosis and QSOX1 may enhance the antitumor effects of sorafenib by regulating ferroptosis. GSH depletion, increased intracellular Fe2+ and lipid peroxidation are recognized hallmarks of ferroptosis [24]. To confirm whether QSOX1 could promote sorafenib-induced ferroptosis via NRF2 downregulation, we measured these three effects in HCC cells with QSOX1 overexpression, or knockdown, after sorafenib administration. We found significant GSH depletion after sorafenib treatment in MHCC97H control cells. Overexpression of QSOX1, however, resulted in further decreased GSH levels, that could be restored by the NRF2 activator SFN (Fig. 6d). Conversely, knockdown of QSOX1 partly blocked the GSH depletion that resulted from sorafenib treatment in Hep3B cells. This effect could be reversed by application of NRF2 inhibitor AT (Fig. 6d). Labile iron (Fe2+) is an important source of hydroxyl radical formation and can initiate lipid peroxidation through the Fenton reaction [25]. We found that both overexpression and knockdown of QSOX1 did not affect intracellular Fe2+ content in the HCC cells (Fig. 6e and f). However, the combination of QSOX1 overexpression and sorafenib treatment led to an increased Fe2+ production than that seen with sorafenib treatment alone in the MHCC97H cells. This effect of QSOX1 could be restored by SFN. By contrast, QSOX1 knockdown and sorafenib treatment together resulted in reduced Fe2+ production as compared to sorafenib treatment alone in the Hep3B cells, and this effect could be reversed by AT. These data suggest that QSOX1 may not individually participate in Fe2+ production or iron metabolism but cooperate with sorafenib to regulate Fe2+ production. Furthermore, both sorafenib treatment and QSOX1 overexpression were found to elevate lipid peroxidation in the HCC cells (Fig. 6g and h). QSOX1 overexpression led to a further increase in sorafenib-induced lipid peroxidation in the MHCC97H cells, while QSOX1 knockdown restrained the increase of lipid peroxidation induced by sorafenib in Hep3B cells. These actions of QSOX1 overexpression and knockdown could be reversed respectively by SFN and AT respectively (Fig. 6g and h). Together, these results suggest that QSOX1 may promote sorafenib-induced ferroptosis by suppressing NRF2 activation.
2.6. QSOX1 improves in vivo anti-tumor activity of sorafenib via potentiation of ferroptosis
To test if increased QSOX1 levels could improve the anti-tumor activity of sorafenib in vivo, mouse subcutaneous and orthotopic xenograft models were established. Whether in orthotopic or subcutaneous models, sorafenib treatment was found to be more effective at reducing tumor volume formed by MHCC97H/QSOX1 cells, as compared to control cells (Fig. 7a and b and Fig. S8). IHC staining was performed on the tumor tissues from orthotopic xenograft models. As shown in Fig. 7c and d, the tumor formed by MHCC97H/QSOX1 cells displayed attenuated p-EGFR and nuclear NRF2 expression levels. Furthermore, sorafenib treatment led to reduced p-EGFR and nuclear NRF2 expression in tumor tissues from MHCC97H/QSOX1 cells as compared to vector control tumors. However, both sorafenib and QSOX1 did not affect expression levels of cleaved caspase 3 in tumor tissues (Fig. 7c and d). To observe potential cell ferroptosis, the experimental tumor tissues were stained using two markers of ferroptosis, the lipid ROS product 4-HNE and transferrin receptor (TFRC) [26,27]. Sorafenib treatment resulted in increased 4-HNE and TFRC expression levels in tumors generated the from MHCC97H/QSOX1 cells as compared to vector controls (Fig. 7e and f). These results were consistent with the in vitro findings and demonstrate that QSOX1 can potentiate the anti-tumor activity of sorafenib in vivo through inhibition of the EGFR/NRF2 signaling pathway and promotion of ferroptosis.
Fig. 7.

QSOX1 improves in vivo anti-tumor activity of sorafenib via potentiation of ferroptosis. (a) BALB/c nude mice were orthotopically implanted with 5 mm3 tumor tissues formed by MHCC97H/Vector or MHCC97H/QSOX1 cells. At the 7th day following implantation, mice were administrated with 10 mg/kg sorafenib through i.p. once every other day. On the 28th day after implantation, the mice were sacrificed, and livers dissected and tumor volume was measured via caliper. (b) Representative magnetic resonance images of tumors in each group on the 28th day were shown. The representative IHC images and statistical results of (c-d) QSOX1, p-EGFR, NRF2, and cleaved caspase 3, (e) 4-HNE and (f) TFRC in tumor tissues from indicated orthotopic nude mice models are shown. Cleaved caspase 3 in all tested groups were negative. Scale bar: 100 μm. All data are presented as the mean ± SEM. *, p < 0.05, **, p < 0.01, ***, p < 0.001.
To investigate the potential clinical significance of tumor QSOX1 in the context of adjuvant sorafenib treatment after hepatectomy in HCC patients, an independent cohort of 199 HCC patients (136 in the control group and 63 in the group that had received adjuvant sorafenib treatment after hepatectomy) was analyzed. Detailed patient information is provided in Supplementary materials. The patients with adjuvant sorafenib treatment tended to have prolonged OS as compared to those without sorafenib treatment (Fig. 8a). This difference did not reach statistical significance, probably due to the limited number of cases. The patients were further classified into the four subgroups using median IHC score as cut off for tumor QSOX1, and whether they had received adjuvant sorafenib treatment as division standard: low QSOX1 without sorafenib (n = 66); low QSOX1 with sorafenib (n = 39); high QSOX1 without sorafenib (n = 70); high QSOX1 with sorafenib (n = 24). Interestingly, we found the patients with high tumor QSOX1 expression, but not with low tumor QSOX1 expression, significantly benefited from adjuvant sorafenib treatment (Fig. 8b–d). These data suggest that QSOX1 may serve as a potential biomarker for selecting optimal HCC patients for adjuvant sorafenib treatment after hepatectomy.
Fig. 8.

High tumor QSOX1 expression predicts better response to postoperative adjuvant sorafenib therapy. (a) Overall survival (OS) of HCC patients, who had received (n = 63) or not received (n = 136) adjuvant sorafenib therapy after hepatectomy, were compared using Kaplan-Mier analysis. (b-d) OS of indicated subgroups were compared using Kaplan-Mier analysis. (e) A scheme for the roles of QSOX1 on the regulation of EGFR/NRF2 signaling and sorafenib-induced ferroptosis in the context of HCC.
3. Discussion
ROS plays a dual role in the carcinogenesis and development of malignant tumors. In the initiation phase, ROS contributes to tumor generation by promoting DNA mutations [28]. During tumor progression increased ROS is thought to disadvantage tumor growth. Targeting ROS- represents a potential therapeutic strategy, but the intrinsic antioxidant capacity of tumors allows them to cope with oxidative stress and enhances their drug-resistance. In HCC, some antioxidant enzyme genes have been found to be overexpressed in tumor tissues and to confer resistance to sorafenib [13,14]. In this study, we demonstrated a previously unknown function of QSOX1 that effectively impairs the antioxidant capacity of HCC cells and thus increases their sensitivity to oxidative stress. These findings provide a mechanistic basis for previous observations by our group identifying QSOX1 as a potential tumor suppressor in HCC [20]. Parallel studies have suggested that QSOX1 may also act as a pro-oncogenic gene that promotes malignant phenotypes in some types of cancer [29,30]. This apparent contradiction may arise from the types of cancers studied, or differing effects on specific tumor microenvironments (TME) or disease-related context.
It is well established that NRF2 is protective and helps maintain survival of the malignant cells under the highly oxidative environment found in the TME [31]. In the present study, we demonstrate that QSOX1 can inhibit NRF2 activation resulting in a reduced cellular antioxidant capacity of HCC cells. A negative relationship between tumor QSOX1 and NRF2 levels was then validated in a cohort of tumor tissues taken from patients with hepatitis B-related HCC. Tumor QSOX1 and NRF2 levels separately represent independent prognostic factors for overall survival of HCC patients. We show here that the combination of these two factors dramatically improves their prognostic value for HCC patients.
NRF2 and its natural protein inhibitor KEAP1 are often found to be overexpressed, mutated or constitutively activated in different tumor types [32,33]. It has been reported that the somatic mutation rates of Keap1 or Nfe2l2 in HCC are 8% and 6.4% respectively, which is associated with constitutive activation of NRF2 in HCC cells [34,35]. The mutation rate of Keap1 or Nfe2l2 was not measured in the cohort of 151 patients described here, but 50% (76/151) of the HCC patients displayed high tumor NRF2 expression levels. A recent report by Yang et al. found that NRF2 was strongly expressed in 67.3% (181/269) of tumor tissues from a cohort of 269 HCC patients [17]. The difference between the low mutation rate of Keap1 or Nfe2l2, and high NRF2 activity in HCC tissues suggests that additional mechanisms are important in regulating NRF2 apart from the KEAP1-NRF2 axis. In the present study, we found that QSOX1 negatively regulates NRF2 protein expression and activation in HCC cell lines, but not through transcriptionally inhibiting NRF2 mRNA. QSOX1 lacks DLG and ETGE motifs in its sequence and a physical interaction between QSOX1 and KEAP1 also could not be shown. QSOX1 appears to regulate NRF2 expression not directly by KEAP1, but through other mechanisms, which remain to be identified.
The process of lysosomal degradation of activated EGFR represents an important mechanism that helps restrain persistent and excessive activation of EGFR signaling. The ubiquitination of EGFR is a necessary signal for this degradation process [23]. We further observed that QSOX1 interacts with EGFR and promotes the ubiquitination and following endosomal trafficking of EGFR in HCC cells. These actions of QSOX1 result in a rapid degradation of EGFR in the cytoplasm after activation by EGF. Importantly, the extracellular domain of EGFR is rich in cysteines that may be catalyzed to form disulfide bonds which is required for high affinity binding and signal transduction. Enzymatically, QSOX1 was shown to introduce disulfide bonds into proteins with a high efficiency and to prefer protein substrates rather than small mono- and di-thiol containing molecules [18,36,37]. Therefore, it is possible that QSOX1 interacts with EGFR and catalyzes the sulfhydryl of EGFR to form disulfide bonds resulting in regulation of EGFR function and signaling. However, no such studies have been reported yet. This issue remains to be investigated in more detail in future. In addition, it was well known that p62 is a multifunctional ubiquitin binding protein that participates in both the ubiquitin proteasome system (UPS) and autophagy lysosome system protein degradation process. In our study, we observed that QSOX1 did not affect p62 protein expression, and QSOX1 did not interact with p62 (Fig. S5). However, we can not rule out the possibility that p62 acts as a scaffold or adaptor protein to participate in trafficking and degradation process of EGFR.
Increasing evidence suggests that ferroptosis plays a critical role in cancer development, drug resistance and immunotherapy [38]. Sorafenib has been shown to induce ferroptosis by indirectly blocking system xc- activity resulting in GSH depletion [39]. The transcription factor NRF2 acts to promote resistance to ferroptosis through several mechanisms. A previous study has found that sorafenib can suppress NRF2 activation in renal carcinoma cells [40], however, other studies have shown that sorafenib can also promote NRF2 expression in liver cancer cells [10,41]. Thus, the actions of sorafenib appear to be somewhat controversial or potentially context dependent. Our results suggest that sorafenib decreases NRF2 expression levels in HCC cells. It is also possible that sorafenib treatment may initially inhibit NRF2 activity in cancer cells, that is followed by an adaptive increase in antioxidant capacity as a survival mechanism. We have shown here that QSOX1 can cooperate with sorafenib to cause an enhanced decline of NRF2 resulting in increased ferroptosis of HCC cells. Data from an orthotopic mouse model used here further suggest that QSOX1 can act with sorafenib to inhibit HCC progression through promotion of ferroptosis.
In conclusion, our study has identified a complex biologic network linking QSOX1 in the regulation of redox homoeostasis in the context of HCC. The results demonstrate that QSOX1 can impair the antioxidant capacity of HCC cells through inhibition of NRF2 activation. QSOX1 interacts with EGFR to enhance its ligand-induced endosomal transfer and lysosomal degradation leading to rapid termination of EGFR signaling and moderation of NRF2 activation (Fig. 8e). QSOX1 can cooperate with sorafenib leading to enhanced ferroptosis of HCC cells and may thus represent a novel therapeutic strategy to overcome drug resistance for HCC patients or other EGFR-dependent tumor types.
4. Materials and methods
4.1. Patient samples and follow-up
A HCC cohort of 151 patients who had received curative liver resection from January 2009 to January 2010 in Zhongshan Hospital, Fudan University, were randomly selected and follow-up documented. Criteria of inclusion and exclusion: (1) no systemic or local treatments were received before liver resection, (2) no extrahepatic metastasis were found before liver resection, (3) the pathologic diagnosis of all patients was HCC, (4) all patients received curative liver resection, (5) no infectious evidence or other inflammatory conditions except for viral hepatitis, (6) all patients had complete clinicopathologic information. All cases were followed to June 30, 2016, with a median follow-up of 52.3 months (range from 0.2 to 95.6 months). OS was defined as the date from resection to either death or the last date of follow-up. The data were censored at the last follow-up for living patients. Detailed clinicopathologic characteristics are provided in Supplementary Table 1.
To measure the mRNA expression of QSOX1 in tissue samples from HCC patients, another cohort of 95 HCC patients were enrolled according to the same criteria above. Paired tumor tissues and adjacent non-tumoral tissues were obtained for further analysis.
An additional cohort of 199 HCC patients (136 in the control group that not received adjuvant sorafenib treatment and 63 in the group that received adjuvant sorafenib treatment after curative liver resection) was used to analyze the association between QSOX1 expression and the response to sorafenib therapy. These patients were enrolled from January 2009 to January 2013 in Zhongshan Hospital, Fudan University. The patients received sorafenib treatment at a dose of 400 mg twice a day and therapy interruptions were permitted for severe drug-related adverse effects. The patients were followed to June 30, 2018, with a median follow-up of 52.15 months (range from 10.2 to 91.8 months).
All clinical specimens were collected from patients enrolled after obtained informed consent in accordance with a protocol approved by the Ethics Committee of Zhongshan Hospital, Fudan University.
4.2. Plasmids and lentiviral infection
Human lentiviral shRNA against human QSOX1 was designed as previously described [20]. pLenO-DCE-puro vector was used for QSOX1 overexpression. The primers used were: Forward- TAGAGCTAGCGAATTCATGAGGAGGTGCAACAGC and Reverse- TCGCGGCCGCGGATCCTCAAATAAGCTCAGGTCCC. MHCC97H cells stably overexpressing QSOX1 and Hep3B cells with stably knockdown of QSOX1 were established by lentiviral infection. Briefly, the QSOX1 and QSOX1 shRNA oligos were purified, reannealed, and then cloned into lentiviral vectors. Lentiviruses were generated by transfecting 10 μg lentiviral expressing vectors pLenO-DCE-puro-QSOX1, pLenO-DCE-puro-vehicle, pLKO.1-shQSOX1, pLKO.1 shNT, together with 5 μg packaging vector psPAX2 and 7.5 μg envelope plasmid pMD2.G into 293 T cells. The viral-containing supernatant of 293T cells was collected after 72 h of transfection. Indicated cells were infected with the supernatants together with 5 μg/mL polybrene and cultured for another 48 h–72 h. Medium with 5 μg/mL puromycin (Invitrogen, USA) was used to select for cells stably overexpressing or knockdown of QSOX1. The effectiveness of overexpression or knockdown was verified by immunoblotting with anti-QSOX1 antibody.
4.3. Cell lines and cell culture
The human HCC cell line MHCC97H was established in the Liver Cancer Institute, Zhongshan Hospital, Fudan University. The human HCC cell line Hep3B was purchased from the cell bank of the Chinese Academy of Science, Shanghai, China. All the cells were cultured in Dulbecco's modified Eagle's medium (DMEM) (HyClone, USA) supplemented with 10% fetal bovine serum (FBS, Invitrogen, USA) and grew at 37 °C and 5% CO2 in the incubator.
4.4. Measurement of GSH/GSSG ratio, NADPH/NADP+ ratio and total antioxidant capacity assay
-
(1)
The measurement of GSH/GSSG ratio was assessed using GSH and GSSG Assay Kit (S0053, Beyotime, China) according the manufacturer's instructions as described previously [42]. Briefly, 1 × 10⁶ cells cultured in DMEM were collected and lysed at 4 °C. GSSG in cell lysate was reduced to GSH by glutathione reductase and the GSH formed could cause a continuous reduction of 2-nitrobenzoic acid (DTNB) to 5-thio-2-nitrobenzoic acid (TNB). The concentration of TNB reflected the amount of GSH and could be measured at 420 nm spectrophotometrically. The results were normalized by protein concentration of each sample.
-
(2)
The measurement of NADPH/NADP+ ratio was determined using a NADP+/NADPH Assay Kit with WST-8 (S0179, Beyotime, China) according the manufacturer's instructions as described previously [42]. In brief, 1 × 10⁶ cells cultured in DMEM were collected and lysed by 3 frozen-thaw cycles. Lysate sample was then separated into two portions. One portion was heated at 60 °C to deplete NADP+ (only NADPH left) while the other portion was left on ice as unheated sample (containing both NADP+ and NADPH). NADP+ could be reduced into NADPH in the Working buffer and the NADPH formed further reduced WST-8 to formazan. The orange product (formazan) was then measured at 450 nm spectrophotometrically. The NADPH/NADP+ ratio was calculated using following formula: (intensity of heated sample)/(intensity of unheated sample – intensity of heated sample). The results were normalized by protein concentration of each sample.
-
(3)
Total antioxidant capacity assay was performed with the Total Antioxidant Capacity Assay Kit with a Rapid ABTS method (S0121, Beyotime, China) according the manufacturer's instructions as described previously [17]. Briefly, 1 × 10⁶ cells cultured in DMEM were collected and lysed by 3 frozen-thaw cycles. Anti-oxidative macromolecules, micromolecules and enzymes contribute to total antioxidant capacity, which could reduce the oxygen radical form of 2,2′-azino-bis(3-ethylbenzthiazoline-6-sulfonic acid (ABTS+) to ABTS. The green product (ABTS+) could represent the total antioxidant capacity and was then measured at 734 nm spectrophotometrically. The results were normalized by protein concentration of each sample.
4.5. Detection of intracellular ROS, mitochondrial ROS, mitochondrial membrane potential
Intracellular reactive oxygen species (ROS) were detected as described previously [43]. In brief, 1 × 10⁶ cells were incubated with 10 μM CM-H2DCFDA (C6827, Invitrogen, USA) for 30 min at 37 °C. Cells were washed 3 times with PBS, harvested and suspended in serum-free medium followed by fluorescence observation or flow cytometric analysis (Ex: 488 nm/Em: 510–555 nm).
For mitochondrial ROS detection as previously described [17], 1 × 10⁴ cells/well were plated onto 96-well plate (black with clear bottom). 48 h later, the cells were incubated with 5 μM MitoSOX Red Mitochondrial Superoxide Indicator (M36008, Invitrogen, USA) for 30 min at 37 °C. Cells were then washed with PBS for 3 times. The fluorescence were read at 510/580 nm of Ex/Em using a fluorescence microplate reader.
Mitochondrial membrane potential (ΔΨm) were measured as previously described [43]. 1 × 10⁶ cells were incubated with 200 nM TMRE (#13296, Cell signaling, USA) for 15 min at 37 °C. Cells were washed 3 times with PBS, harvested and suspended in serum-free medium followed by flow cytometric analysis. In healthy cells, TMRE accumulates in the mitochondria of cells. For the cells losing ΔΨm, TMRE cannot accumulate in the mitochondria. The TMRE negative pattern is defined as depolarized mitochondria, which represents low ΔΨm. Another method, JC-1 staining, was also used to observe visually ΔΨm of cells [44]. 1 × 10⁴ cells/well were plated onto 96-well plate (black with clear bottom). 48 h later, cells were stained with JC-1 kit (C2006, Beyotime, China) according to the manufacture's protocol and observed with fluorescence microscope (Olympus, Japan).
4.6. Cell viability analysis
Cells were plated in 96-well plate at the density of 5 × 10³ per well and were allowed to attach for 24 h. To analyze the effects of H2O2 (323381, Sigma, USA) and sorafenib (#8705, Cell Signaling Technology, USA) on cell viability, indicated doses of hydrogen dioxide or sorafenib were added to the cells and incubated continually for 24 h. Cell viability was measured using a CCK-8 assay kit (CK04, Dojindo, Japan) according the manufacturer's instructions as previously described [10].
4.7. Cell death analysis
Cells were plated in 96-well plate at the density of 1 × 10⁴ per well and were allowed to attach for 24 h 5 μM Sorafenib (Cell Signaling Technology, USA), 5 μM ferrostatin-1 (S7243, Selleck, USA), 50 μM deferoxamine (S5742, Selleck, USA), 10 μM Z-VAD(OMe)-FMK (HY-16658, MedChemExpress, USA) or 1 μM Necrosulfonamide (HY-100573, MedChemExpress, USA)were added to the cells as indicated in Figure legends and incubated for 24 h. The cells were harvested and Cytotoxicity LDH assays were performed using the Cytotoxicity LDH assay kit (CK12, Dojindo, Japan) according the manufacturer's instructions as previously described [45].
4.8. Immunohistochemistry analysis
A paraffin embedded HCC tissue microarray was constructed and IHC analysis was performed as described previously [46]. The antibodies used for IHC staining were anti-QSOX1 (1:100, Proteintech Group, China) and anti-NRF2 (1:100, Santa Cruz, USA). Two independent pathologists blinded to the clinical data evaluated the QSOX1 and NRF2 IHC staining using a histological score (H-score) approach. Staining intensity was categorized as follows: 0 (-); 1 (+); 2(++) and 3(+++). The average percentage of positively stained cells was scored as follows: 0 (<5%); 1 (5–25%); 2 (26–50%); 3 (51–75%) and 4 (76–100%). The final scores were obtained by multiplying the staining intensity scores with staining proportion scores, ranging from 0 to 12. The median H-scores of QSOX1 and NRF2 were used, respectively, as cutoff to separate them into low and high expression subgroups.
4.9. Analysis of cell ferroptosis in vitro
-
(1)
The measurement of glutathione (GSH) content: Briefly, 1 × 10⁶ cell lysates were determined using a commercial GSH and GSSG Assay Kit (S0053, Beyotime, China) according the manufacturer's instructions as described above [42].
-
(2)
The measurement of intracellular Fe2+ content: The experiments were performed as described previously [47]. Briefly, 1 × 10⁶ cells were washed with cold PBS for 3 times, collected, suspended and incubated with 1 μM ferrous iron probe FerroOrange (F374, Dojindo, Japan) for 15min followed by flow cytometric analysis (Ex: 561 nm/Em: 570–620 nm).
-
(3)
Lipid peroxidation analysis: The experiments were performed as described previously [42]. Briefly, 1 × 10⁶ cells were incubated with 5 μM BODIPY-C11 (D3861, Invitrogen, USA) for 30 min at 37 °C. Cells were washed 3 times with PBS, harvested and suspended in serum-free medium followed by flow cytometric analysis (Ex: 488 nm/Em: 510–555 nm).
For treatment of sorafenib (5 μM), sulforaphane (5 μM, S4441, Sigma, USA) or alkaloid trigonelline (0.5 μM, T5509, Sigma, USA), cells were treated by these agents for another 24 h before the measurement.
4.10. Immunoblotting, co-IP, and ubiquitination analysis
Whole cell extracts were dispersed in RIPA Lysis and Extraction Buffer (89901, Thermo Scientilic, USA) containing 1% Protease and Phosphatase Inhibitor Cocktail (78446, Thermo Scientilic, USA) on ice. Immunoblotting was performed with primary antibody against QSOX1 (1:1000, Abcam, USA), NRF2 (1:1000, Cell Signaling Technology, USA), EGFR (1:1000, Cell Signaling Technology, USA), phospho-EGFR (1:1000, Cell Signaling Technology, USA), KEAP1 (1:1000, Cell Signaling Technology, USA), or Ubiquitin (1:500, Cell Signaling Technology, USA). To prepare cytoplasmic and nuclear extracts, Nuclear and Cytoplasmic Extraction Reagents (78833, Thermo Scientific, USA) was used according the manufacturer's instructions. Anti-GAPDH (1:5000, Cell Signaling Technology, USA) and anti-Lamin B1 (1:100, Santa Cruz, USA) served as internal reference for whole-cell extracts and nuclear extracts, respectively. For co-IP, cell extracts were prepared using Cell lysis buffer (P0013, Beyotime, China). Lysates incubated with co-IP antibodies against NRF2 (1:1000, Cell Signaling Technology, USA), EGFR (1:1000, Cell Signaling Technology, USA) rotationally at 4 °C overnight. On the second day, the antibodies were pulled down with 20 μL Protein A Magnetic Beads (#73778, Cell Signaling Technology, USA) at room temperature for 20 min. All the experiments were performed for at least three times independently.
4.11. Quantitative reverse transcription PCR (qRT-PCR)
Briefly, tissue and cell samples were lysed to obtain total RNA by RNAiso Plus (9109, Takara, Japan) and then cDNA was synthesized using an RT reagent Kit with gDNA Eraser (RR047, Takara, Japan). 1 μg of total RNA were used for each qRT-PCR reaction, performed with TB Green (RR420, Takara, Japan) on an ABI Prism 7500 Sequence Detection system (Applied Biosystems, USA). Gene expression relative to GAPDH was calculated with the comparative ΔΔCt method. All the primer sequences used are provided in Supplementary Table 2.
4.12. Bioinformatics
mRNA sequence data for HCC patients were downloaded from LIHC data set (Cbioportal) of TCGA database. A total 372 patients from the database were divided into high QSOX1 group and low QSOX1 group according to the median QSOX1 expression. C5 gene oncology gene set served as input. The online “Co-expression” module in Cbioportal database was used to analyze the correlation between QSOX1 and indicated antioxidant genes. Detailed patient information is provided in Supplementary Table 3. A total of 11337 genes were found to be significantly related with QSOX1.
4.13. Immunofluorescence and confocal microscopy analysis
To observe the localization of NRF2 in cells, cells were plated on glass coverslips and fixed with 4% paraformaldehyde for 15 min and then blocked with 5% BSA for 1 h at room temperature. Immunofluorescence was performed by incubating with antibodies against NRF2 (1:100, Proteintech Group, China) 4 °C overnight. On the second day, cells were incubated with Goat Anti-Rabbit IgG H&L (Alexa Fluor® 488) antibodies (1:1000, Invitrogen, USA) for 1 h at room temperature. Nuclei were counterstained using 4ʹ,6-diamidino-2-phenylindole (DAPI) for 5 min. The cells were observed using a fluorescence microscope (Olympus, Japan). For detection of EGFR and Rab5 or Rab7 colocalization, cells were plated on glass coverslips and starved with DMEM containing 1% BSA for 24 h before stimulating with 100 ng/mL EGF (sc-4552, Santa Cruz, USA). At several time points after EGF stimulation, the cells were fixed with 4% paraformaldehyde for 15 min and then blocked with 5% BSA for 1 h at room temperature. The antibodies used were anti-EGFR Alexa Fluor® 488 Conjugate (1:100, Cell Signaling Technology, USA), anti-Rab5 (1:100, Santa Cruz, USA) and anti-Rab7 (1:100, Abcam, USA). The fluorescence signals were obtained using an epifluorescence microscope (Zeiss, Germany) with a laser-scanning confocal imaging system. To evaluate EGFR and Rab5 or Rab7 co-localization, co-localization analysis was performed using the co-localization module of the ImageJ software from 3 random fields, each of which contained at least 50 cells, as previously described [48].
4.14. Animal studies
Male 6-week-old BALB/c nude mice were purchased from Charles River Company (Shanghai, China). For subcutaneous mouse model, 5 × 10⁶ MHCC97H vector control cells or MHCC97H/QSOX1 cells were implanted into right flanks subcutaneously. At the 7th day following implantation, the mice bear with MHCC97H vector control cells or MHCC97H/QSOX1 cells respectively were randomly separated into two groups: one group were treated with vehicle (0.9% NaCl i.p., once every other day) and another group sorafenib (10 mg/kg i.p., once every other day) for two weeks. Tumors were measured once every other day and the tumor volume were calculated using the formula length × width2 × Π/6. On the 21st day after implantation, mice were sacrificed and the tumors were removed. For orthotopic mouse model, 5 × 10⁶ MHCC97H vector control cells or MHCC97H/QSOX1 cells were first implanted into right flanks subcutaneously. 14 days after implantation, tumors were dissected and cut into cubes (1 mm3) under aseptic conditions. Single cubes were subsequently implanted into the right lobe of liver parenchyma of 6-week-old BALB/c nude mice (Day 0). At the 7th day following implantation, mice bearing MHCC97H vector control cells or MHCC97H/QSOX1 cells were randomly separated into two groups: one group were treated with vehicle (0.9% NaCl i.p., once every other day) and the second group sorafenib (10 mg/kg i.p., once every other day) for 21 days. At the end of therapy (Day 28th), mice received magnetic resonance examination with CG NOVILA 7.0T system (Shanghai Chenguang Medical Technologies CO., LTD, China). Then mice were sacrificed and tumors were dissected and tumor volumes were calculated using the formula length × width2 × Π/6. Tumors were fixed with 4% paraformaldehyde followed by IHC analysis. Antibodies for mouse IHC analysis: QSOX1 (1:100), NRF2 (1:100), phospho-EGFR (1:100), PCNA (1:100), 4 Hydroxynonenal (1:100) and TFRC (1:100). All animal care and experimental protocols were performed in accordance with Shanghai Medical Experimental Animal Care Commission guidelines.
4.15. Statistics
Statistical analyses were performed using SPSS software (23.0; IBM) and the Prism software program (GraphPad 7 Software). Quantitative variables were analyzed by the t-test or Pearson's correlation test; and the Pearson χ2 test was used to compare qualitative variables. Kaplan-Meier analysis was performed to compare OS and DFS between patients in different groups and statistical p values were generated by the Cox-Mantel log-rank test. Log-rank test was used to compare patients' survival between subgroups. Data are presented as mean ± standard error of mean (SEM). Two-tailed p values < 0.05 were considered significant.
Declaration of interests
The authors declare that they have no known competing financial interests or personal relationships that could have appeared to influence the work reported in this paper.
Funding information
This work was supported by grants from the China National Natural Science Foundation (81272733, 82073208), the “973” State Key Basic Research Program of China (2014CB542101), Shanghai International Science and Technology Collaboration Program (18410721900) and Program for Outstanding Academic Leader in Minhang District, Shanghai (201709).
Declaration of competing interest
The authors declare no conflict of interest.
Acknowledgements
We thank Mr. He Jun and Mr. Tao Shiliang from Shanghai Chenguang Medical Technologies Co., LTD for their help on mice in vivo magnetic resonance examination.
Footnotes
Supplementary data to this article can be found online at https://doi.org/10.1016/j.redox.2021.101942.
Contributor Information
Jialei Sun, Email: 16211210052@fudan.edu.cn.
Chenhao Zhou, Email: chzhou17@fudan.edu.cn.
Yue Zhao, Email: yue.zhao@uk-koeln.de.
Xiaofei Zhang, Email: michang2004@163.com.
Wanyong Chen, Email: 16111210035@fudan.edu.cn.
Qiang Zhou, Email: 18111210074@fudan.edu.cn.
Bo Hu, Email: bohu1120@hotmail.com.
Dongmei Gao, Email: gao.dongmei@zs-hospital.sh.cn.
Lisa Raatz, Email: Lisa.raatz@uk-koeln.de.
Zhefang Wang, Email: zhefang.wang@uk-koeln.de.
Peter J. Nelson, Email: Peter.Nelson@med.uni-muenchen.de.
Yuchao Jiang, Email: beibeijyc@gmail.com.
Ning Ren, Email: ren.ning@zs-hospital.sh.cn.
Christiane J. Bruns, Email: Christiane.bruns@uk-koeln.de.
Haijun Zhou, Email: zhou.haijun@zs-hospital.sh.cn.
Appendix
Table 1.
Clinicopathologic characteristics of 151 HCC patients.
| Characteristics | Patients |
|
|---|---|---|
| Number (%) | ||
| Age, years | ≤50 | 65(43.0) |
| >50 | 86(57.0) | |
| Gender | Female | 21(13.9) |
| Male | 130(86.1) | |
| HbsAg | Negative | 26(17.2) |
| Positive | 125(82.8) | |
| AFP, ng/ml | ≤20 | 52(34.4) |
| >20 | 99(65.6) | |
| CEA, ng/ml | ≤5 | 140(92.7) |
| >5 | 11(7.3) | |
| CA19-9, U/ml | ≤36 | 117(77.5) |
| >36 | 34(22.5) | |
| ALT, U/L | ≤40 | 89(58.9) |
| >40 | 62(41.1) | |
| AST, U/L | ≤37 | 108(71.5) |
| >37 | 43(28.5) | |
| γ-GT, U/L | ≤54 | 64(42.4) |
| >54 | 87(57.6) | |
| Ascites | Absent | 142(94.0) |
| Present | 9(6.0) | |
| Liver cirrhosis | No | 27(17.9) |
| Yes | 124(82.1) | |
| Tumor number | Single | 126(83.4) |
| Multiple | 25(16.6) | |
| Tumor size, cm | ≤5 | 77(51) |
| >5 | 74(49) | |
| Tumor encapsulation | Complete | 79(52.3) |
| None | 72(47.7) | |
| Tumor differentiation | I-II | 92(60.9) |
| III-IV | 59(39.1) | |
| Microvascular invasion | Absent | 86(57.0) |
| Present | 65(43.1) | |
| Child classification | A | 141(93.4) |
| B + C | 10(6.7) | |
| BCLC stage | 0 + A | 74(49.0) |
| B + C | 77(51.0) | |
| TMN stage | I + II | 113(74.8) |
| III + IV | 38(25.2) | |
Table 2.
Primer sequences for PCR.
| Gene | Forward Primer | Reverse Primer |
|---|---|---|
| QSOX1 | TGGTCTAGCCACAACAGGGTCAAT | TGTGGCAGGCAGAACAAAGTTCAC |
| NRF2 | TCCTACACCAACGCCTTTCCG | TGTGGGCAACCTGGGAGTAG |
| SOD1 | AGGGCATCATCAATTTCGAGC | GCCCACCGTGTTTTCTGGA |
| SOD2 | AACCTCAGCCCTAACGGTG | AGCAGCAATTTGTAAGTGTCCC |
| CAT | GTGAACTGTCCCTACCGTGC | AGGGCAGAAGGCTGTTGTTC |
| GCLC | TTAGGCTGTCCTGGGTTCAC | TCGCTCCTCCCGAGTTCTAT |
| NQO1 | GCTGGTTTGAGCGAGTGTTC | GCCTTCTTACTCCGGAAGGG |
| HO-1 | CAAGGAGAGCCCAGTCTTCG | TCTTGCACTTTGTTGCTGGC |
| SLC7A11 | CCATGAACGGTGGTGTGTT | GACCCTCTCGAGACGCAAC |
Table 3.
Clinicopathologic characteristics of 372 HCC patients from TCGA database.
| Characteristics | Patients |
||
|---|---|---|---|
| Number (%) | |||
| Age, years | ≤50 | 79 (21.2) | |
| >50 | 293 (78.8) | ||
| Gender | Female | 121 (67.5) | |
| Male | 251 (32.5) | ||
| Race | White | 183 (49.2) | |
| Asian | 160 (43.0) | ||
| Black or African American | 17 (4.6) | ||
| N/A | 10 (2.7) | ||
| American Indian or Alaska Native | 2 (0.5) | ||
| OS Status | Living | 241 (64.8) | |
| Deceased | 131 (35.2) | ||
| Cancer type | Hepatocellular carcinoma | 369 (99.2) | |
| Fibrolamellar carcinoma | 3 (0.8) | ||
Appendix A. Supplementary data
The following are the Supplementary data to this article:
Fig. S1.

Fig. S2.

Fig. S3.
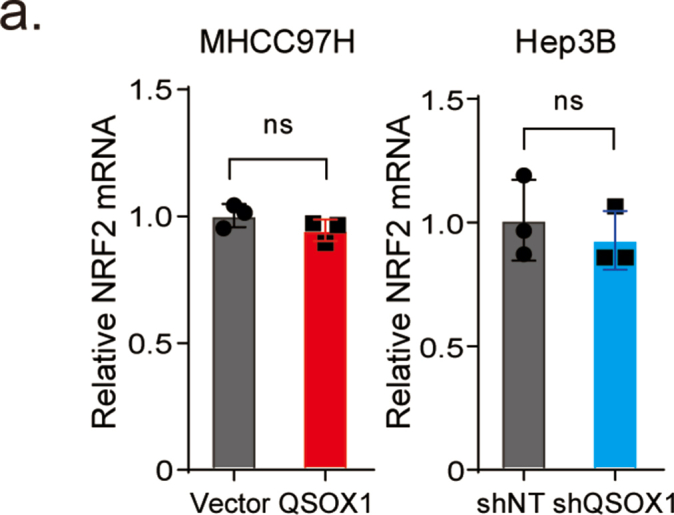
Fig. S4.

Fig. S5.

Fig. S6.

Fig. S7.

Fig. S8.

References
- 1.Bray F., Ferlay J., Soerjomataram I. Global cancer statistics 2018: GLOBOCAN estimates of incidence and mortality worldwide for 36 cancers in 185 countries. CA A Cancer J. Clin. 2018;68:394–424. doi: 10.3322/caac.21492. [DOI] [PubMed] [Google Scholar]
- 2.Forner A., Llovet J.M., Bruix J. Hepatocellular carcinoma. Lancet. 2012;379:1245–1255. doi: 10.1016/S0140-6736(11)61347-0. [DOI] [PubMed] [Google Scholar]
- 3.Llovet J.M., Ricci S., Mazzaferro V. Sorafenib in advanced hepatocellular carcinoma. N. Engl. J. Med. 2008;359:378–390. doi: 10.1056/NEJMoa0708857. [DOI] [PubMed] [Google Scholar]
- 4.Kudo M., Finn R.S., Qin S. Lenvatinib versus sorafenib in first-line treatment of patients with unresectable hepatocellular carcinoma: a randomised phase 3 non-inferiority trial. Lancet. 2018;391:1163–1173. doi: 10.1016/S0140-6736(18)30207-1. [DOI] [PubMed] [Google Scholar]
- 5.Bruix J., Qin S., Merle P. Regorafenib for patients with hepatocellular carcinoma who progressed on sorafenib treatment (RESORCE): a randomised, double-blind, placebo-controlled, phase 3 trial. Lancet. 2017;389:56–66. doi: 10.1016/S0140-6736(16)32453-9. [DOI] [PubMed] [Google Scholar]
- 6.Lachaier E., Louandre C., Godin C. Sorafenib induces ferroptosis in human cancer cell lines originating from different solid tumors. Anticancer Res. 2014;34:6417–6422. [PubMed] [Google Scholar]
- 7.Louandre C., Ezzoukhry Z., Godin C. Iron-dependent cell death of hepatocellular carcinoma cells exposed to sorafenib. Int. J. Canc. 2013;133:1732–1742. doi: 10.1002/ijc.28159. [DOI] [PubMed] [Google Scholar]
- 8.Dixon S.J., Lemberg K.M., Lamprecht M.R. Ferroptosis: an iron-dependent form of nonapoptotic cell death. Cell. 2012;149:1060–1072. doi: 10.1016/j.cell.2012.03.042. [DOI] [PMC free article] [PubMed] [Google Scholar]
- 9.Sun X., Niu X., Chen R. Metallothionein-1G facilitates sorafenib resistance through inhibition of ferroptosis. Hepatology. 2016;64:488–500. doi: 10.1002/hep.28574. [DOI] [PMC free article] [PubMed] [Google Scholar]
- 10.Sun X., Ou Z., Chen R. Activation of the p62-Keap1-NRF2 pathway protects against ferroptosis in hepatocellular carcinoma cells. Hepatology. 2016;63:173–184. doi: 10.1002/hep.28251. [DOI] [PMC free article] [PubMed] [Google Scholar]
- 11.Trachootham D., Alexandre J., Huang P. Targeting cancer cells by ROS-mediated mechanisms: a radical therapeutic approach? Nat. Rev. Drug Discov. 2009;8:579–591. doi: 10.1038/nrd2803. [DOI] [PubMed] [Google Scholar]
- 12.Rojo de la Vega M., Chapman E., Zhang D.D. NRF2 and the hallmarks of cancer. Canc. Cell. 2018;34:21–43. doi: 10.1016/j.ccell.2018.03.022. [DOI] [PMC free article] [PubMed] [Google Scholar]
- 13.Xu I.M., Lai R.K., Lin S.H. Transketolase counteracts oxidative stress to drive cancer development. Proc. Natl. Acad. Sci. U. S. A. 2016;113:E725–E734. doi: 10.1073/pnas.1508779113. [DOI] [PMC free article] [PubMed] [Google Scholar]
- 14.Lee D., Xu I.M., Chiu D.K. Induction of oxidative stress through inhibition of thioredoxin reductase 1 is an effective therapeutic approach for hepatocellular carcinoma. Hepatology. 2019;69:1768–1786. doi: 10.1002/hep.30467. [DOI] [PMC free article] [PubMed] [Google Scholar]
- 15.Rojo A.I., Rada P., Mendiola M. The PTEN/NRF2 axis promotes human carcinogenesis. Antioxidants Redox Signal. 2014;21:2498–2514. doi: 10.1089/ars.2014.5843. [DOI] [PMC free article] [PubMed] [Google Scholar]
- 16.Yamadori T., Ishii Y., Homma S. Molecular mechanisms for the regulation of Nrf2-mediated cell proliferation in non-small-cell lung cancers. Oncogene. 2012;31:4768–4777. doi: 10.1038/onc.2011.628. [DOI] [PubMed] [Google Scholar]
- 17.Yang C., Tan Y.X., Yang G.Z. Gankyrin has an antioxidative role through the feedback regulation of Nrf2 in hepatocellular carcinoma. J. Exp. Med. 2016;213:859–875. doi: 10.1084/jem.20151208. [DOI] [PMC free article] [PubMed] [Google Scholar]
- 18.Thorpe C., Hoober K.L., Raje S. Sulfhydryl oxidases: emerging catalysts of protein disulfide bond formation in eukaryotes. Arch. Biochem. Biophys. 2002;405:1–12. doi: 10.1016/S0003-9861(02)00337-5. [DOI] [PubMed] [Google Scholar]
- 19.Ilani T., Alon A., Grossman I. A secreted disulfide catalyst controls extracellular matrix composition and function. Science. 2013;341:74–76. doi: 10.1126/science.1238279. [DOI] [PubMed] [Google Scholar]
- 20.Zhang X.F., Wang J., Jia H.L. Core fucosylated glycan-dependent inhibitory effect of QSOX1-S on invasion and metastasis of hepatocellular carcinoma. Cell Death Dis. 2019;5:84. doi: 10.1038/s41420-019-0164-8. [DOI] [PMC free article] [PubMed] [Google Scholar]
- 21.Suzuki T., Yamamoto M. Molecular basis of the Keap1-Nrf2 system. Free Radic. Biol. Med. 2015;88:93–100. doi: 10.1016/j.freeradbiomed.2015.06.006. [DOI] [PubMed] [Google Scholar]
- 22.Sebolt-Leopold J.S., Herrera R. Targeting the mitogen-activated protein kinase cascade to treat cancer. Nat. Rev. Canc. 2004;4:937–947. doi: 10.1038/nrc1503. [DOI] [PubMed] [Google Scholar]
- 23.Haglund K., Dikic I. The role of ubiquitylation in receptor endocytosis and endosomal sorting. J. Cell Sci. 2012;125:265–275. doi: 10.1242/jcs.091280. [DOI] [PubMed] [Google Scholar]
- 24.Stockwell B.R., Friedmann Angeli J.P., Bayir H. Ferroptosis: a regulated cell death nexus linking metabolism, redox biology, and disease. Cell. 2017;171:273–285. doi: 10.1016/j.cell.2017.09.021. [DOI] [PMC free article] [PubMed] [Google Scholar]
- 25.Hassannia B., Vandenabeele P., Vanden Berghe T. Targeting ferroptosis to iron out cancer. Canc. Cell. 2019;35:830–849. doi: 10.1016/j.ccell.2019.04.002. [DOI] [PubMed] [Google Scholar]
- 26.Badgley M.A., Kremer D.M., Maurer H.C. Cysteine depletion induces pancreatic tumor ferroptosis in mice. Science. 2020;368:85–89. doi: 10.1126/science.aaw9872. [DOI] [PMC free article] [PubMed] [Google Scholar]
- 27.Feng H., Schorpp K., Jin J. Transferrin receptor is a specific ferroptosis marker. Cell Rep. 2020;30:3411–3423. doi: 10.1016/j.celrep.2020.02.049. e3417. [DOI] [PMC free article] [PubMed] [Google Scholar]
- 28.Zhao Y., Hu X., Liu Y. ROS signaling under metabolic stress: cross-talk between AMPK and AKT pathway. Mol. Canc. 2017;16:79. doi: 10.1186/s12943-017-0648-1. [DOI] [PMC free article] [PubMed] [Google Scholar]
- 29.Sung H.J., Ahn J.M., Yoon Y.H. Quiescin sulfhydryl oxidase 1 (QSOX1) secreted by lung cancer cells promotes cancer metastasis. Int. J. Mol. Sci. 2018;19 doi: 10.3390/ijms19103213. [DOI] [PMC free article] [PubMed] [Google Scholar]
- 30.Katchman B.A., Antwi K., Hostetter G. Quiescin sulfhydryl oxidase 1 promotes invasion of pancreatic tumor cells mediated by matrix metalloproteinases. Mol. Canc. Res. 2011;9:1621–1631. doi: 10.1158/1541-7786.MCR-11-0018. [DOI] [PubMed] [Google Scholar]
- 31.Saito T., Ichimura Y., Taguchi K. p62/Sqstm1 promotes malignancy of HCV-positive hepatocellular carcinoma through Nrf2-dependent metabolic reprogramming. Nat. Commun. 2016;7:12030. doi: 10.1038/ncomms12030. [DOI] [PMC free article] [PubMed] [Google Scholar]
- 32.Lu K., Alcivar A.L., Ma J. NRF2 induction supporting breast cancer cell survival is enabled by oxidative stress-induced DPP3-KEAP1 interaction. Canc. Res. 2017;77:2881–2892. doi: 10.1158/0008-5472.CAN-16-2204. [DOI] [PMC free article] [PubMed] [Google Scholar]
- 33.Lignitto L., LeBoeuf S.E., Homer H. Nrf2 activation promotes lung cancer metastasis by inhibiting the degradation of Bach1. Cell. 2019;178:316–329. doi: 10.1016/j.cell.2019.06.003. e318. [DOI] [PMC free article] [PubMed] [Google Scholar]
- 34.Guichard C., Amaddeo G., Imbeaud S. Integrated analysis of somatic mutations and focal copy-number changes identifies key genes and pathways in hepatocellular carcinoma. Nat. Genet. 2012;44:694–698. doi: 10.1038/ng.2256. [DOI] [PMC free article] [PubMed] [Google Scholar]
- 35.Cleary S.P., Jeck W.R., Zhao X. Identification of driver genes in hepatocellular carcinoma by exome sequencing. Hepatology. 2013;58:1693–1702. doi: 10.1002/hep.26540. [DOI] [PMC free article] [PubMed] [Google Scholar]
- 36.Greulich H., Kaplan B., Mertins P. Functional analysis of receptor tyrosine kinase mutations in lung cancer identifies oncogenic extracellular domain mutations of ERBB2. Proc. Natl. Acad. Sci. U. S. A. 2012;109:14476–14481. doi: 10.1073/pnas.1203201109. [DOI] [PMC free article] [PubMed] [Google Scholar]
- 37.Abe Y., Odaka M., Inagaki F. Disulfide bond structure of human epidermal growth factor receptor. J. Biol. Chem. 1998;273:11150–11157. doi: 10.1074/jbc.273.18.11150. [DOI] [PubMed] [Google Scholar]
- 38.Friedmann Angeli J.P., Krysko D.V., Conrad M. Ferroptosis at the crossroads of cancer-acquired drug resistance and immune evasion. Nat. Rev. Canc. 2019;19:405–414. doi: 10.1038/s41568-019-0149-1. [DOI] [PubMed] [Google Scholar]
- 39.Dixon S.J., Patel D.N., Welsch M. Pharmacological inhibition of cystine-glutamate exchange induces endoplasmic reticulum stress and ferroptosis. Elife. 2014;3 doi: 10.7554/eLife.02523.001. [DOI] [PMC free article] [PubMed] [Google Scholar]
- 40.Chakraborty S., Balan M., Flynn E. Activation of c-Met in cancer cells mediates growth-promoting signals against oxidative stress through Nrf2-HO-1. Oncogenesis. 2019;8:7. doi: 10.1038/s41389-018-0116-9. [DOI] [PMC free article] [PubMed] [Google Scholar]
- 41.Houessinon A., François C., Sauzay C. Metallothionein-1 as a biomarker of altered redox metabolism in hepatocellular carcinoma cells exposed to sorafenib. Mol. Canc. 2016 May 16;15(1):38. doi: 10.1186/s12943-016-0526-2. [DOI] [PMC free article] [PubMed] [Google Scholar]
- 42.Cao J., Chen X., Jiang L. DJ-1 suppresses ferroptosis through preserving the activity of S-adenosyl homocysteine hydrolase. Nat. Commun. 2020;11(1):1251. doi: 10.1038/s41467-020-15109-y. [DOI] [PMC free article] [PubMed] [Google Scholar]
- 43.Du J., Zhou Y., Li Y. Identification of Frataxin as a regulator of ferroptosis. Redox Biol. 2020;32:101483. doi: 10.1016/j.redox.2020.101483. [DOI] [PMC free article] [PubMed] [Google Scholar]
- 44.Huang Q., Zhan L., Cao H. Increased mitochondrial fission promotes autophagy and hepatocellular carcinoma cell survival through the ROS-modulated coordinated regulation of the NFKB and TP53 pathways. Autophagy. 2016;12(6):999–1014. doi: 10.1080/15548627.2016.1166318. [DOI] [PMC free article] [PubMed] [Google Scholar]
- 45.Kapralov A.A., Yang Q., Dar H.H. Redox lipid reprogramming commands susceptibility of macrophages and microglia to ferroptotic death. Nat. Chem. Biol. 2020;16(3):278–290. doi: 10.1038/s41589-019-0462-8. [DOI] [PMC free article] [PubMed] [Google Scholar]
- 46.Ju H., Lu Y., Wu Q. Disrupting G6PD-mediated Redox homeostasis enhances chemosensitivity in colorectal cancer. Oncogene. 2017;36(45):6282–6292. doi: 10.1038/onc.2017.227. [DOI] [PMC free article] [PubMed] [Google Scholar]
- 47.Tomita K., Fukumoto M., Itoh K. MiR-7-5p is a key factor that controls radioresistance via intracellular Fe(2+) content in clinically relevant radioresistant cells. Biochem. Biophys. Res. Commun. 2019;518(4):712–718. doi: 10.1016/j.bbrc.2019.08.117. [DOI] [PubMed] [Google Scholar]
- 48.Al-Akhrass H., Naves T., Vincent F. Sortilin limits EGFR signaling by promoting its internalization in lung cancer. Nat. Commun. 2017;8(1):1182. doi: 10.1038/s41467-017-01172-5. [DOI] [PMC free article] [PubMed] [Google Scholar]