Abstract
Background
Anthropometric measurements are simple and reachable tools for self-evaluating and screening patients with a high risk of obstructive sleep apnea (OSA). However, the accumulated relationship of obesity on the anthropometric characteristics of OSA is not well understood. The aim of the study was to show the time-dependent trend of OSA patients and compare overall and regional anthropometric between two ethnicities.
Methods
A cumulative meta-analysis was performed to assess obesity metrics in patients with and without OSA between Asians and Caucasians. We searched PubMed, Web of Science, Embase, and Scopus up to Jun 2020. Included studies used body mass index (BMI), neck circumference (NC), waist circumference (WC) and waist-to-hip ratio (WHR) as measures of anthropometric features in the adult OSA population and controls, utilized in-lab polysomnography or home sleep testing with apnea-hypopnea index (AHI) or respiratory disturbance index (RDI) classification, reported ethnicity/race, and were published in English. Any studies lacking one of these criteria or sufficient data were excluded.
Results
Forty studies with a total of 19,142 subjects were investigated. Comparison of changes between patients with and without OSA showed that OSA patients had a higher BMI [mean difference (MD) 3.12, 95% confidence interval (CI): 2.51–3.73], NC (MD 3.10, 95% CI: 2.70–3.51), WC (MD 9.84, 95% CI: 8.42–11.26) and waist-hip ratio (MD 0.04, 95% CI: 0.03–0.05) than the control subjects. The accumulated time-dependent increase in population with OSA was significantly apparent with all anthropometric features. BMI increased from 2000 (MD 0.50) to 2012 (MD 3.08–3.48) and remained stable afterwards (MD 2.70–3.17), NC increased from 2000 (MD 0.40) to 2013 (MD 3.09) and remained stable afterwards too (MD 3.06–3.21). WC increased from 2000 (MD 2.00) to 2012 (MD 9.37–10.03) and also remained stable afterwards (MD 8.99–9.84). WHR was stable from 2000 to 2004 with an MD of 0.01 and then stable from 2007 onwards with an increased MD of 0.03–0.04. Compared with Caucasian patients, Asian patients had lower obesity relevant variates.
Conclusions
BMI, NC, WC and WHR are associated with OSA in both ethnic groups. Anthropometry for overall and regional obesity could facilitate differentiation of patients with OSA from individuals without OSA by ethnicity.
Keywords: Obstructive sleep apnea (OSA), anthropometric parameters, obesity, ethnicity, cumulative meta-analysis
Introduction
Obstructive sleep apnea (OSA) is one of the most common multifactorial and heterogeneous sleep breathing disorders, characterized by partial and complete upper airway collapsibility, nocturnal hypoxia and disturbed awakenings (1). Overweight and obese populations are more likely to develop OSA (2). Obese patients with OSA are at higher risk of cardiovascular events and metabolic syndromes than non-obese patients with OSA (3,4). Importantly, there may be a genetic predisposition for OSA shown by an increased risk in families of OSA patients, and higher OSA prevalence in nonobese Asian patients compared to their white counterparts (5). Previous studies show that Caucasians with OSA are more obese while Asians have more craniofacial bony restrictions (6,7). Furthermore, Asian patients are more likely to develop more severe OSA than Caucasians with similar body mass index (BMI) levels (6,7). Current findings have demonstrated that the degree of obesity tends to have a greater influence on Asian patients with OSA than Caucasians (8). Early epidemiological data shows that a similar prevalence of OSA was found in Asian and western countries (9).
However, as of today, the prevalence of obesity is increasing rapidly among Asian countries with altered lifestyle and dietary aspects (10). Additionally, different types of fat distribution such as central and peripheral obesity may lead to the development of OSA in varying degrees. Obesity and fat distribution are the main factors contributing to ethnic differences in OSA prevalence and presentation. Global and regional adiposity can easily be measured by BMI, neck circumference (NC), waist circumference (WC) and waist-hip ratio (WHR). The combination of measurements may show the detailed obesity patterns among individuals with OSA. The cumulative analysis of anthropometric data provided an objective assessment to investigate changes in overall and regional obesity between two ethnic populations with OSA groups in relation to time, regardless of apnea-hypopnea index (AHI) classification [measured by overnight polysomnography (PSG) and dependent on sex and age]. Thus, it is necessary to re-evaluate the correlations and differences of multiple anthropometric features in populations with and without OSA between Asians and Caucasians. The purpose of the study was to elucidate whether different ethnic populations share common risk characteristics on anthropometric obesity-associated measurements in OSA patients. This would improve the understanding of etiology and heterogeneity of overweight and obese OSA in relation with ethnicity.
We present the following article/case in accordance with the PRISMA reporting checklist (available at http://dx.doi.org/10.21037/jtd-20-1799).
Methods
Search strategy
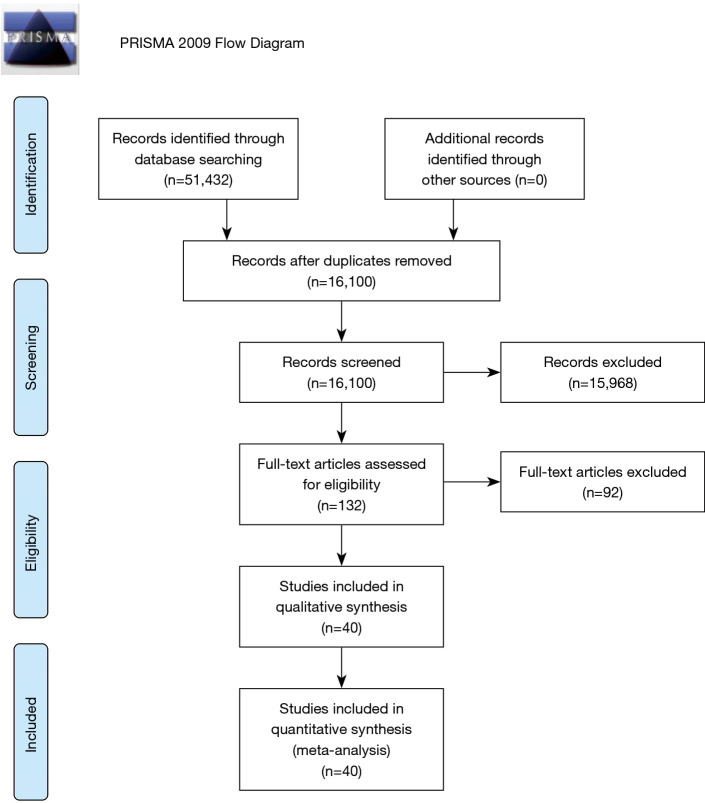
Two investigators independently searched the articles in the databases (PubMed, Web of Science, Embase, and Scopus). The reference lists of eligible studies and relevant papers were also manually searched and reviewed. Search terms included “sleep apnea”, “body mass index”, “neck circumference”, “waist circumference”, “waist-hip ratio”, “obesity”, “body fat distribution” and “anthropometry”. For example, the search strategy used in PubMed was (“sleep apnea”) AND (“body mass index” OR “neck circumference” OR “waist circumference” OR “waist-hip ratio” OR “obesity” OR “anthropometry” OR “body fat distribution”). Searching date was from January 1, 1964 to June 23, 2020. Firstly, we found 16,100 articles (after duplications excluded), and then excluded 92 articles by reading the title and abstract on the basis of study design, as detailed in the exclusion criteria. Finally, 40 articles were left after reading the whole article (Figure 1). A similar search strategy was applied to the other databases.
Figure 1.
Flow diagram of data collection.
Inclusion and exclusion
Inclusion criteria: (I) researched study (randomized controlled trials and retrospective study) comparing OSA (AHI ≥5 events/h) with non-OSA subjects (AHI <5 events/h); (II) primary outcome (BMI) with any secondary outcomes (NC, WC and WHR); (III) standard PSG or home sleep testing with results of AHI or respiratory disturbance index (RDI) classification; (IV) reports of race/ethnicity; (V) only be published in English.
Exclusion criteria: (I) review, case report; (II) was not divided into OSA and control group; (III) insufficient data in the articles (lack standard deviation, number of subjects and so on); (IV) craniofacial deformity, bariatric surgery and pregnant women; (V) investigations that do not use AHI <5 for non-OSA subjects
Data collection
Two authors independently reviewed the identified abstracts and selected articles. The third reviewer addressed the discrepancies. For each selected publication, the following baseline and study characteristics were extracted: first author, publication year, country, participant characteristics in the study, and the concluded baseline characteristics of these studies (Table 1). Efficacy outcome measures included BMI, WC, NC and waist-hip ratio.
Table 1. Characteristics of selected studies and subjects with and without obstructive sleep apnea.
| Study | Country | OSA/non-OSA (N) | Age (year) | BMI (kg/m2) | NC (cm) | WC (cm) | WHR (cm) | AHI (events/h) |
|---|---|---|---|---|---|---|---|---|
| Ip et al. 2000, (11) | China | 30/30 | 43.6/41.9 | 27.0/26.5 | 38.9/38.5 | 91.9/89.9 | 0.91/0.90 | 35.70/1.80 |
| Udwadia et al. 2004, (12) | India | 93/157 | 48.3/47.8 | 30.8/26.7 | 41.7/38.9 | 109.7/98.8 | 0.96/0.95 | AHI ≥5/AHI <5 |
| Ip et al. 2004, (13) | China | 74/31 | 48.2/42.7 | 27.2/23.1 | 34.7/33.1 | 85.5/77.4 | 0.85/0.83 | AHI ≥5/AHI <5 |
| Kim et al. 2004, (14) | Korea | 160/327 | 50.8/48.8 | 26.6/24.5 | NA | NA | 0.88/0.86 | 18.67/1.26 |
| Yucel et al. 2005, (15) | Turkey | 47/24 | 49.0/46.0 | 33.0/34.1 | 39.3/37.4 | NA | NA | 29.60/2.10 |
| Julià-Serdà et al. 2006, (16) | Spain | 115/92 | 51.2/45.9 | 32.6/29.7 | 43.5/40.6 | 111.4/102.5 | NA | 46.00/3.00 |
| Sharma et al. 2007, (17) | India | 40/80 | 42.3/42.6 | 29.8/25.3 | 39.3/36.1 | 106.9/92.7 | 1.00/0.85 | 32.60/0.85 |
| Martinez-Rivera et al. 2008, (18) | Spain | 124/68 | 53.0/49.5 | 31.4/31.0 | 42.5/40.5 | 106.3/100.7 | 0.98/0.94 | 38.90/4.95 |
| Nakagawa et al. 2008, (19) | Japan | 93/18 | 47.2/43.8 | 29.2/23.8 | NA | 97.7/86.7 | NA | 36.00/2.40 |
| Jelic et al. 2010, (20) | USA | 38/33 | 38.0/37.0 | 35.0/30.0 | NA | 43.0/38.0 | 0.93/0.88 | 36.00/1.00 |
| Angelico et al. 2010, (21) | Italy | 178/48 | 53.6/49.8 | 32.1/29.2 | NA | 110.0/101.2 | 0.97/0.94 | 31.40/1.50 |
| Yusoff et al. 2010, (22) | Malaysia | 128/161 | 45.4/42.5 | 29.4/25.5 | 40.0/37.4 | NA | NA | AHI ≥5/AHI <5 |
| Chen et al. 2011, (23) | China | 786/249 | 46.3/40.4 | 27.9/23.9 | 40.8/37.4 | NA | NA | 43.01/1.60 |
| Kawaguchi et al. 2011, (24) | Japan | 189/30 | 53.8/44.8 | 27.3/23.1 | 40.3/36.8 | 91.8/78.3 | NA | 32.60/2.00 |
| Ugur et al. 2011, (25) | Turkey | 73/24 | 51.6/47.4 | 32.4/29.0 | 41.3/40.5 | 110.8/102.3 | NA | 35.40/3.60 |
| Soylu et al. 2012, (26) | Turkey | 431/68 | 51.9/42.5 | 32.2/26.9 | 43.0/37.7 | 113.4/96.0 | NA | 36.45/2.27 |
| Lubrano et al. 2012, (27) | Italy | 104/67 | 50.2/42.0 | 43.4/35.7 | NA | 129.2/111.5 | 0.98/0.96 | 27.22/1.54 |
| Lin et al. 2012, (28) | China | 113/45 | 48.1/47.0 | 22.2/22.4 | NA | 81.4/80.0 | 0.94/0.94 | 27.00/3.20 |
| Li et al. 2012, (29) | China | 14/14 | 39.4/42.8 | 26.5/26.6 | 46.6/45.4 | NA | NA | 54.30/2.29 |
| Kim et al. 2013, (30) | Korea | 400/438 | 58.0/54.7 | 25.6/24.3 | NA | 84.9/79.7 | NA | AHI ≥5/AHI <5 |
| Apaydin et al. 2013, (31) | Turkey | 67/20 | 51.8/47.4 | 31.6/27.4 | 41.0/30.0 | 109.7/98.5 | 0.99/0.94 | 47.60/2.40 |
| Kang et al. 2014, (32) | Korea | 316/67 | 44.0/48.4 | 26.8/23.1 | 38.1/34.4 | 94.5/83.5 | NA | 35.80/2.00 |
| Liu et al. 2014, (33) | China | 130/19 | 50.5/48.7 | 28.0/24.4 | 39.3/36.2 | NA | NA | 30.90/3.20 |
| Lim et al. 2014, (34) | Korea | 120/31 | 45.4/38.1 | 23.2/24.5 | 39.5/36.9 | 95.5/86.5 | 0.94/0.88 | 34.00/1.85 |
| Shen et al. 2015, (35) | China | 196/104 | 53.5/54.5 | 27.3/26.8 | NA | NA | 0.87/0.86 | 21.00/2.00 |
| Luz et al. 2016, (36) | Brazil | 39/25 | 48.0/36.0 | 28.8/24.1 | 39.9/35.5 | 100.8/86.5 | NA | 9.00/1.30 |
| Xu et al. 2016, (37) | China | 2,422/561 | 43.7/39.3 | 26.3/23.7 | 39.8/36.2 | 96.0/85.7 | 0.95/0.90 | 39.43/1.50 |
| Wang et al. 2016, (38) | China | 1,289/600 | 58.2/54.7 | 25.4/24.0 | 38.9/37.4 | NA | 0.96/0.93 | 19.20/1.63 |
| Duong-Quy et al. 2016, (39) | Vietnam | 52/30 | 54.0/54.2 | 23.9/21.6 | 35.2/32.4 | 87.0/78.6 | NA | 25.61/3.03 |
| Cao et al. 2016, (40) | China | 192/56 | 53.4/49.6 | 25.8/24.2 | NA | NA | 0.93/0.90 | AHI ≥5/AHI <5 |
| Shi et al. 2017, (41) | China | 43/43 | 43.0/51.6 | 29.2/25.5 | 42.1/38.6 | NA | NA | 59.60/1.40 |
| Tseng et al. 2017, (42) | China | 40/80 | 52.5/53.1 | 27.0/24.3 | NA | 95.1/87.3 | NA | 33.40/0.01 |
| Amin et al. 2017, (43) | UK | 54/51 | 56.1/52.9 | 32.3/28.9 | 40.1/38.1 | 110.2/101.1 | 1.01/0.99 | AHI ≥5/AHI <5 |
| Unal et al. 2019, (44) | Turkey | 437/72 | 49.3/39.4 | 30.9/25.9 | NA | 107.9/91.7 | 0.63/0.55 | 28.90/2.15 |
| Ragia et al. 2019, (45) | Greece | 144/32 | 53.2/47.6 | 35.4/30.3 | 44.3/39.6 | 120.7/104.7 | NA | AHI ≥5/AHI <5 |
| Bauters et al. 2019, (46) | Belgium | 816/993 | 57.6/54.7 | 34.0/25.2 | 39.3/36.1 | 99.6/90.8 | NA | AHI ≥5/AHI <5 |
| Tażbirek et al. 2019, (47) | Poland | 31/19 | 49.4/47.1 | 35.7/33.1 | 46.2/43.0 | 119.6/116.3 | NA | 45.00/2.16 |
| Kohno et al. 2019, (48) | Japan | 30/20 | 61.0/56.9 | 27.6/21.8 | 39.9/36.1 | 96.4/80.5 | 0.96/0.90 | 33.12/4.70 |
| Xu et al. 2019, (49) | China | 3,737/775 | 43.1/38.0 | 27.0/23.6 | 40.0/36.4 | 96.8/85.8 | NA | 40.20/1.70 |
| Zheng et al. 2019, (50) | China | 124/31 | 53.2/44.9 | 28.5/27.3 | 39.8/38.7 | NA | 0.98/0.94 | AHI ≥5/AHI <5 |
Values are presented as number or mean in obstructive sleep apnea/controls. BMI, body mass index; NC, neck circumference; WC, waist circumference; WHR, waist-hip ratio; AHI, apnea-hypopnea index; NA, not available.
Ethical statement
The authors are accountable for all aspects of the work in ensuring that questions related to the accuracy or integrity of any part of the work are appropriately investigated and resolved. Ethical approval and consent to participate was not applicable for this study.
Statistical analysis
We pooled data and used mean deviation (MD), with 95% confidence interval (CI) for continuous outcomes: BMI, NC, WC and waist-hip ratio. We used a fixed-effect model if there was no considerable heterogeneity among studies. We used a random-effects model if the I2 statistic was above 50% and Cochran’s Q statistic had a P value ≤0.1. Subgroup analyses were performed to compare BMI, WC, NC and waist-hip ratio grouped by the ethnicities (Asian and Caucasian). Cumulative meta-analyses were performed to test the time-dependent effects of obesity on the incidence of OSA. Funnel plots were used to screen for potential publication bias. Trim and fill method was used to address high publication bias. All statistical analyses were carried out with R 3.6.1.
Results
The meta-analysis included 40 eligible studies involving 19,142 subjects. Studies were published up to 2020, and were conducted in 15 countries [China (11,13,23,28,29,33,35,37,38,40-42,49,50), Japan (19,24,48), India (12,17), Korea (14,30,32,34), Malaysia (22), Vietnam (39), Turkey (15,25,26,31,44), Spain (16,18), United States (20), Italy (21,27), Brazil (36), United Kingdom (43), Greece (45), Belgium (46), Poland (47)].
Body mass index
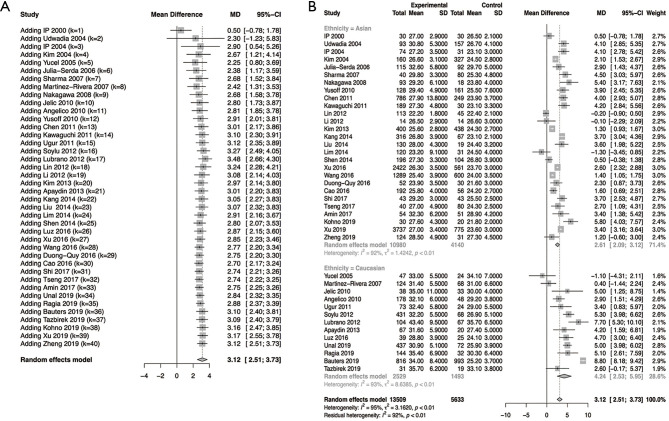
For BMI results, we included 40 studies involving a total of 19,142 subjects (13,509 OSA subjects and 5,633 non-OSA subjects). The results of randomized effects model showed that OSA patients had a higher BMI than non-OSA subjects (MD 3.12, 95% CI: 2.51–3.73, I2=95%). The subgroup analysis indicated that the Asian population (MD 2.61, 95% CI: 2.09–3.12, I2=92%) had trends of a lower BMI than the Caucasian population (MD 4.24, 95% CI: 2.53–5.95). Cumulative BMI was also found to increase with time from 2000 (MD 0.50, 95% CI: −0.78 to 1.78) to 2019 (MD 2.84–3.12). The study in 2000 could be an outlier, but then from 2004 to 2019, BMI rose from 2.30–2.90 to 2.84–3.12 (Figure 2).
Figure 2.
The forest plot for body mass index (BMI) in cumulative meta-analysis of patients with obstructive sleep apnea (OSA) compared to controls without OSA (A), and the forest plot for BMI in meta-analysis of subjects with and without OSA between Asian and Caucasian (B). MD, mean difference; SD, standard deviation; CI, confidence interval.
Neck circumference
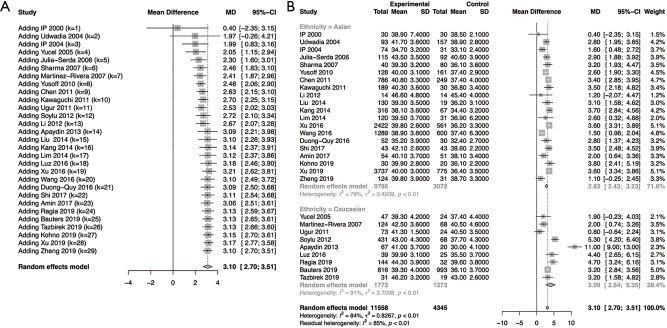
To test the differences of NC, we included in 30 studies [China (11,13,23,29,33,37,38,41,49,50), Japan (24,48), India (12,17), Korea (32,34), Malaysia (22), Vietnam (39), Turkey (15,25,26,31), Spain (16,18), Italy (27), Brazil (36), United Kingdom (43), Greece (45), Belgium (46), Poland (47)] with a total of 15,903 patients (11,558 OSA subjects and 4,345 non-OSA subjects), the results of randomized effects model demonstrated that OSA patients had a higher NC than non-OSA subjects (MD 3.10, 95% CI: 2.70–3.51, I2=84%). The subgroup analysis indicated that Asians (MD 2.83, 95% CI: 2.43, 3.23, I2=78%) had trends of a lower NC than Caucasians (MD 3.99, 95% CI: 2.64–5.35). Like BMI, cumulative NC was found to increase with time, from 2000 (MD 0.40) to 2019 (MD 3.10–3.17) with a steady increase from 2004 (MD 1.97–1.99) to 2013 (MD 3.09). However, cumulative NC appears stable from 2013 to 2019 with an MD range of 3.06–3.21 (Figure 3).
Figure 3.
The forest plot for neck circumference (NC) in cumulative meta-analysis of patients with obstructive sleep apnea (OSA) compared to controls without OSA (A), and the forest plot for NC in meta-analysis of subjects with and without OSA between Asian and Caucasian (B). MD, mean difference; SD, standard deviation; CI, confidence interval.
Waist circumference
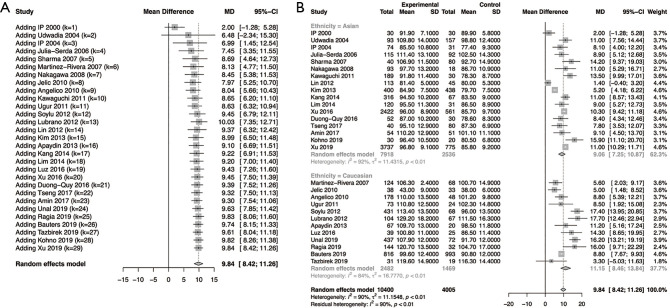
For WC, we included in 29 studies [China (11,13,28,37,42,49), Japan (19,24,48), India (12,17), Korea (30,32,34), Vietnam (39), Turkey (25,26,31,44), Spain (16,18), United State (20), Italy (21,27), Brazil (36), United Kingdom (43), Greece (45), Belgium (46), Poland (47)] involving a total of 14,405 subjects (10,400 OSA subjects and 4,005 non-OSA subjects). The results of randomized effects model showed that OSA patients had a higher WC than non-OSA subjects (MD 9.84, 95% CI: 8.42–11.26, I2=90%). The subgroup analysis indicated that Asians (M 9.06, 95% CI: 7.25–10.87, I2=92%) had trends of a lower WC than Caucasians (MD 11.15, 95% CI: 8.46–13.84, I2=84%). WC was also found to increase with time, from 2000 (MD 2.00) to 2019 (MD 9.61–9.84) with a steady increase between 2004 (MD 6.48–6.99) to 2012 (MD 9.37–10.03), after which it appears stable (MD 8.99–9.84) (Figure 4).
Figure 4.
The forest plot for waist circumference (WC) in cumulative meta-analysis of patients with obstructive sleep apnea (OSA) compared to controls without OSA (A), and the forest plot for WC in meta-analysis of subjects with and without OSA between Asian and Caucasian (B). MD, mean difference; SD, standard deviation; CI, confidence interval.
Waist-hip ratio
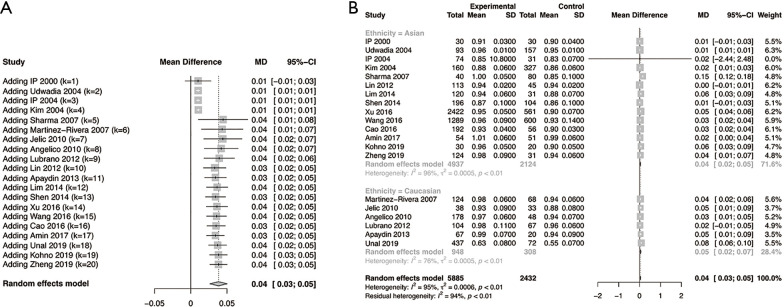
To test the differences of waist-hip ratio, we included in 20 studies (11-14,17,18,20,21,27,28,31,34,35,37,38,40,43,44,48,50) with a total of 8,317 patients (5,885 OSA subjects and 2,432 non-OSA subjects), the results of randomized effects model demonstrated that OSA patients had a higher WHR than non-OSA subjects (MD 0.04, 95% CI 0.03–0.05, I2=96%). The subgroup analysis indicated that Asians (MD 0.04, 95% CI: 0.02–0.05, I2=76%) had trends of a lower WHR than Caucasians (MD 0.05, 95% CI: 0.02–0.07, I2=77%). WHR has a trend unlike the other anthropometric features. From 2000 to 2004, WHR has an MD of 0.01. In 2007, this rose to 0.04 and until 2019 has remained stable at 0.03–0.04 (Figure 5).
Figure 5.
The forest plot for waist to hip ratio (WHR) in cumulative meta-analysis of patients with obstructive sleep apnea (OSA) compared to controls without OSA (A), and the forest plot for WHR in meta-analysis of subjects with and without OSA between Asian and Caucasian (B). MD, mean difference; SD, standard deviation; CI, confidence interval.
Publication bias
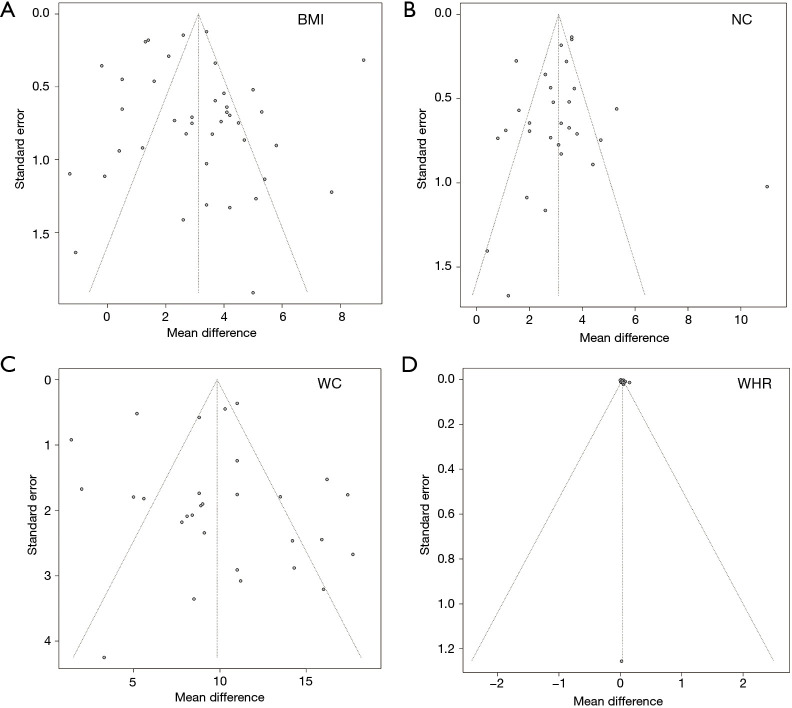
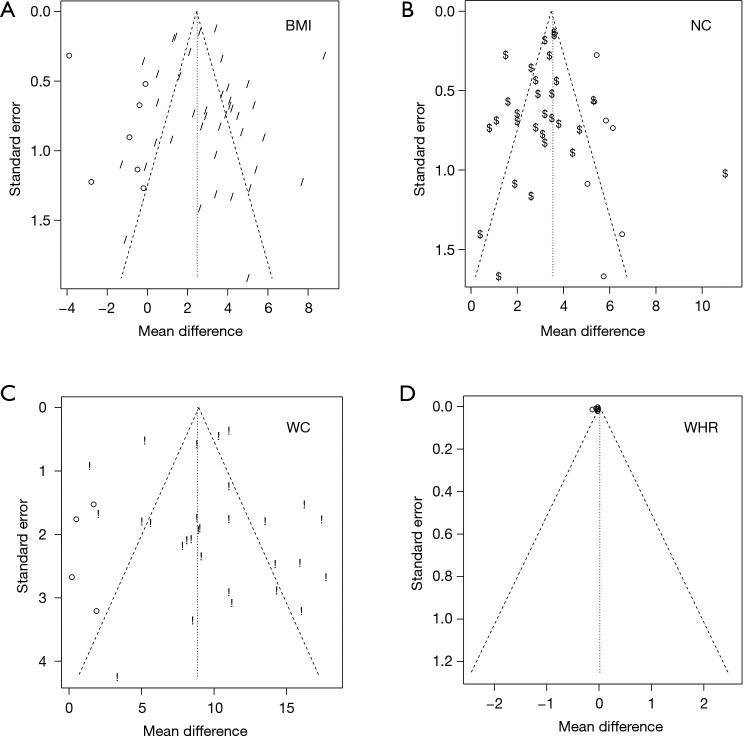
There was publication bias in the studies included in the meta-analysis (Figure 6). Trim and fill methods were used for addressing the high publication bias (Figure 7), and the results showed that BMI (MD 2.480, 95% CI: 1.802–3.157), NC (MD 3.541, 95% CI: 3.115–3.967), WC (MD 8.857, 95% CI: 7.434–10.279), and waist-hip ratio (MD 0.014, 95% CI: 0.002–0.026) also had significantly higher values in OSA patients than controls.
Figure 6.
Funnel plots for body mass index (BMI), neck circumference (NC), waist circumference (WC), waist to hip ratio (WHR) in meta-analysis.
Figure 7.
Funnel plots of trim and fill method for body mass index (BMI), neck circumference (NC), waist circumference (WC), waist to hip ratio (WHR).
Discussion
To our knowledge, we are the first to analyze the time-dependent trend of the anthropometric obesity-related measures in OSA population using a cumulative meta-analysis. We extended previous observations on the relationship between OSA and obesity-related measurements, providing new data that characterize the changes of the anthropometric measures of obesity between Asians and Caucasians with OSA. Cho et al. only found NC is associated with OSA (51). No difference was found among BMI, WC and WHR in Asians and Caucasians with OSA compared to normal controls. Their study did not demonstrate the association and ethic differences of these parameters, possibly due to publication bias (51). In our study, ethnic differences in these measures changed due to their time-dependence. General obesity and body fat distribution measured by BMI, NC, WC, and WHR show significant differences between patients with OSA and controls both between the two ethnic groups.
Our data shows that BMI becomes more strongly related to OSA from 2000 to 2019 (Figure 2). Higher levels of obesity were found in Caucasian OSA subjects compared to controls than Asians. Caucasian patients with OSA still tend to be more obese compared with Asians. Our results agreed with current findings indicating that Asians with OSA have a lower degree of BMI than Caucasians when age and AHI were controlled, but still suffering much upper airway narrowing (8). Caucasians with OSA exhibit a less severe presence of sleep apnea than Asians with a matching BMI. Mayer et al. demonstrated that overall, OSA patients with a lower BMI may have higher degrees of abnormal upper airway structure compared to obese OSA patients (52). Obesity is one of main factors of upper airway collapsibility, which affects the pathogenesis of OSA among the ethnic groups to some extent. Flegal et al. suggested BMI is useful as a predictor for risk and incidence of all-cause mortality (53). Peppard et al. indicated that a 10% weight gain was linked with approximately 32% increase in AHI, as measured by polysomnography (54). However, the criteria for overweight and obesity defined by World Health Organization (WHO) among Asians with BMI (23 and 25 kg/m2, respectively) are lower, compared to the cut-offs used for Caucasians (25 and 30 kg/m2, respectively), which make it challenging to compare as expected (55). Deurenberg et al. found that Asians has 3–5% more body fat for the same BMI compared to Caucasians, and 3–4 points lower BMI for the same body fat compared to Caucasians (56). Thus, discrepancies of generic obesity classification across ethnicities might underestimate its prevalence and effect in the Asian OSA population.
However, anthropometric traits can vary across individuals depending on different obesity phenotypes (56). BMI is used to reflect overall obesity levels of individuals and may poorly capture body composition due to ethnic differences. Body adiposity measured the by ultrasound, magnetic resonance imaging (MRI), computed tomography (CT) and dual energy X-ray absorptiometry (DEXA) can reflect the size and amount of the soft fat tissue accurately. Unfortunately, it also involves the requirement of professional equipment, specialists and high medical expenses. Fat deposition assessed by NC, WC and WHR rather than BMI alone should be considered when compared the overweight and obese state, as those measures are easy to measure and could indirectly show characterization of obesity in detail.
NC showed a strong relation with time. NC saw an increase in OSA patients compared to non-OSA controls, which is consistent with the classic OSA subject being observed to have a thick neck. Caucasians have a larger NC than Asians, which is consistent with the previous findings (57). Increased neck size in adults, reflecting increased volume of cervical adipose tissue, places a heavy burden on the upper airway and increases its collapsibility (58). It directly narrows the diameter of upper airways and aggravates sleep apnea. Previous studies used NC as a predictor of risk and incidence of developing OSA (59). Degache et al. found there is a significant difference between NC among different AHI groups, indicating NC is associated with the severity of OSA (60). Sakakibara et al. suggested NC is associated with positional changes when head posture changes. Weight loss helps decrease fat deposition surrounding the neck, which reduces upper airway collapse and AHI (61). Weight loss helps decrease fat deposition surrounding the neck, which reduces upper airway collapse and AHI (62).
Like BMI and NC, WC also showed a time-dependent increase. WC showed a significant difference between OSA and non-OSA subjects. A positive correlation was found between WC and OSA. Caucasians have a larger WC than Asian. However, Chen et al. found that there is stronger relationship between BMI and WC with graded OSA severity among the Chinese than other ethnic groups (63). The increasing abdominal fat determined by WC has been attributed to differences in patients with and without OSA (63). The incrementation in abdominal fat lowers end-expiratory lung volumes, which reduces the pharyngeal longitudinal tension induced by the lungs and trachea (64,65). This aggravates AHI, particularly in the supine position.
WHR increased with time, but unlike the other anthropometric parameters, rather shifting in stable set point than steadily increasing up to a stable plateau. WHR differed between individuals with and without OSA. It seems that Asian and Caucasian patients shared similar body shape. Two main body type identifications such as central or peripheral obesity are commonly accepted. Central obesity is closely associated with OSA. Central obesity was defined as a waist circumference ≥90 centimeters (cm) for males and ≥80 cm for females (66). Central obesity was also defined as a WHR more than or equal to 0.9 for males and 0.85 for females, according to the WHO guidelines for identifying the risk of metabolic complications (67). Visual inspection of body types is used in clinical practice, which is known to mainly classify to apple- and pear- types. However, there are no reference values and cutoff points for predicted risk of OSA in relation to WHR. Apple- and pear-body shapes have different associations with risk for cardiovascular events. Sangkum et al. suggested that stop-bang questionnaire with body type detection (e.g., central obesity) improves the accuracy of detecting high-risk OSA (68). Recently, Santos et al. showed the combination of global and/or regional obesity related measures did not help identify high suspicions of OSA (69).
In conclusion, OSA patients with higher measures of anthropometric features are common in Asian and Caucasian populations in the general community and in sleep clinics. However, BMI, NC, WC and WHR are objective parameters for exhibiting obesity patterns in OSA. Anthropometric abnormalities in these parameters between obese Asians and Caucasians with OSA are shown in our study. Comprehensive obesity-related measurements (BMI, NC, WC and WHR) give additional insight to the profile of obesity and body fat distribution both in Asian and Caucasian population. These findings have implications for screening of obese patients with OSA in different ethnicities. Self-evaluation and re-assessment of disease severity is needed after apparent weight loss in obesity-related OSA patients.
Limitations of study
The limitations of this meta-study were showed as following: firstly, most studies included were retrospective studies, which meant that the results were inconclusive, and could not prove the causal relationship between obesity and OSA. Secondly, high heterogeneities of results were seen in our study, which could be due to various designs of studies, wide population distribution, and long-time span (2000–2019). To address high heterogeneities, we conducted subgroup, and cumulative meta-analyses, respectively. Fourthly, we used AHI <5 to classify subjects as non-OSA. Other studies used AHI <10, AHI <15 or no/mild OSA group (0< AHI <15) as the control group were excluded. It is argued that AHI <5 alone is not sufficient to identify non-OSA subjects from the OSA population. Heinzer et al. found that using different scoring criteria (i.e., AHI ≥15 or AHI with symptoms or comorbidities) is more significantly clinically relevant to OSA identification, suggesting that the definition of sleep-disordered breathing should be improved (70). Lastly, the cumulative effects of time-dependence on obesity metrics, and the trends of lower obesity relevant variates in Asian patients could not be statistically certified.
Supplementary
The article’s supplementary files as
Acknowledgments
Funding: We acknowledge support from the German Research Foundation (DFG) and the Open Access Publication Fund of Charité-Universitätsmedizin Berlin. TP received partial support from the Russian Federation Government (grant No. 075-15-2019-1885).
Ethical Statement: The authors are accountable for all aspects of the work in ensuring that questions related to the accuracy or integrity of any part of the work are appropriately investigated and resolved.
Footnotes
Reporting Checklist: The authors have completed the PRISMA reporting checklist. Available at http://dx.doi.org/10.21037/jtd-20-1799
Conflicts of Interest: All authors have completed the ICMJE uniform disclosure form (available at http://dx.doi.org/10.21037/jtd-20-1799). The authors have no conflicts of interest to declare.
References
- 1.Dempsey JA, Veasey SC, Morgan BJ, et al. Pathophysiology of sleep apnea. Physiol Rev 2010;90:47-112. 10.1152/physrev.00043.2008 [DOI] [PMC free article] [PubMed] [Google Scholar]
- 2.Romero-Corral A, Caples SM, Lopez-Jimenez F, et al. Interactions between obesity and obstructive sleep apnea: implications for treatment. Chest 2010;137:711-9. 10.1378/chest.09-0360 [DOI] [PMC free article] [PubMed] [Google Scholar]
- 3.Ramar K, Caples SM. Cardiovascular consequences of obese and non-obese obstructive sleep apnea. Med Clin North Am 2010;94:465-78. 10.1016/j.mcna.2010.02.003 [DOI] [PMC free article] [PubMed] [Google Scholar]
- 4.Gaines J, Vgontzas AN, Fernandez-Mendoza J, et al. Obstructive sleep apnea and the metabolic syndrome: The road to clinically-meaningful phenotyping, improved prognosis, and personalized treatment. Sleep Med Rev 2018;42:211-9. 10.1016/j.smrv.2018.08.009 [DOI] [PMC free article] [PubMed] [Google Scholar]
- 5.Young T, Skatrud J, Peppard PE. Risk factors for obstructive sleep apnea in adults. JAMA 2004;291:2013-6. 10.1001/jama.291.16.2013 [DOI] [PubMed] [Google Scholar]
- 6.Li KK, Powell NB, Kushida C, et al. A comparison of Asian and white patients with obstructive sleep apnea syndrome. Laryngoscope 1999;109:1937-40. 10.1097/00005537-199912000-00007 [DOI] [PubMed] [Google Scholar]
- 7.Li KK, Kushida C, Powell NB, et al. Obstructive sleep apnea syndrome: a comparison between Far-East Asian and white men. Laryngoscope 2000;110:1689-93. 10.1097/00005537-200010000-00022 [DOI] [PubMed] [Google Scholar]
- 8.Lee RW, Vasudavan S, Hui DS, et al. Differences in craniofacial structures and obesity in Caucasian and Chinese patients with obstructive sleep apnea. Sleep 2010;33:1075-80. 10.1093/sleep/33.8.1075 [DOI] [PMC free article] [PubMed] [Google Scholar]
- 9.Lee W, Nagubadi S, Kryger MH, et al. Epidemiology of Obstructive Sleep Apnea: a Population-based Perspective. Expert Rev Respir Med 2008;2:349-64. 10.1586/17476348.2.3.349 [DOI] [PMC free article] [PubMed] [Google Scholar]
- 10.Leong WB, Arora T, Jenkinson D, et al. The prevalence and severity of obstructive sleep apnea in severe obesity: the impact of ethnicity. J Clin Sleep Med 2013;9:853-8. 10.5664/jcsm.2978 [DOI] [PMC free article] [PubMed] [Google Scholar]
- 11.Ip MS, Lam KS, Ho C, et al. Serum leptin and vascular risk factors in obstructive sleep apnea. Chest 2000;118:580-6. 10.1378/chest.118.3.580 [DOI] [PubMed] [Google Scholar]
- 12.Udwadia ZF, Doshi AV, Lonkar SG, et al. Prevalence of sleep-disordered breathing and sleep apnea in middle-aged urban Indian men. Am J Respir Crit Care Med 2004;169:168-73. 10.1164/rccm.200302-265OC [DOI] [PubMed] [Google Scholar]
- 13.Ip MS, Lam B, Tang LC, et al. A community study of sleep-disordered breathing in middle-aged Chinese women in Hong Kong: prevalence and gender differences. Chest 2004;125:127-34. 10.1378/chest.125.1.127 [DOI] [PubMed] [Google Scholar]
- 14.Kim J, In K, Kim J, et al. Prevalence of sleep-disordered breathing in middle-aged Korean men and women. Am J Respir Crit Care Med 2004;170:1108-13. 10.1164/rccm.200404-519OC [DOI] [PubMed] [Google Scholar]
- 15.Yucel A, Unlu M, Haktanir A, et al. Evaluation of the upper airway cross-sectional area changes in different degrees of severity of obstructive sleep apnea syndrome: cephalometric and dynamic CT study. AJNR Am J Neuroradiol 2005;26:2624-9. [PMC free article] [PubMed] [Google Scholar]
- 16.Julià-Serdà G, Pérez-Peñate G, Saavedra-Santana P, et al. Usefulness of cephalometry in sparing polysomnography of patients with suspected obstructive sleep apnea. Sleep Breath 2006;10:181-7. 10.1007/s11325-006-0073-y [DOI] [PubMed] [Google Scholar]
- 17.Sharma SK, Kumpawat S, Goel A, et al. Obesity, and not obstructive sleep apnea, is responsible for metabolic abnormalities in a cohort with sleep-disordered breathing. Sleep Med 2007;8:12-7. 10.1016/j.sleep.2006.06.014 [DOI] [PubMed] [Google Scholar]
- 18.Martinez-Rivera C, Abad J, Fiz JA, et al. Usefulness of truncal obesity indices as predictive factors for obstructive sleep apnea syndrome. Obesity (Silver Spring) 2008;16:113-8. 10.1038/oby.2007.20 [DOI] [PubMed] [Google Scholar]
- 19.Nakagawa Y, Kishida K, Kihara S, et al. Nocturnal reduction in circulating adiponectin concentrations related to hypoxic stress in severe obstructive sleep apnea-hypopnea syndrome. Am J Physiol Endocrinol Metab 2008;294:E778-84. 10.1152/ajpendo.00709.2007 [DOI] [PubMed] [Google Scholar]
- 20.Jelic S, Lederer DJ, Adams T, et al. Vascular inflammation in obesity and sleep apnea. Circulation 2010;121:1014-21. 10.1161/CIRCULATIONAHA.109.900357 [DOI] [PMC free article] [PubMed] [Google Scholar]
- 21.Angelico F, del Ben M, Augelletti T, et al. Obstructive sleep apnoea syndrome and the metabolic syndrome in an internal medicine setting. Eur J Intern Med 2010;21:191-5. 10.1016/j.ejim.2010.03.006 [DOI] [PubMed] [Google Scholar]
- 22.Yusoff MF, Baki MM, Mohamed N, et al. Obstructive sleep apnea among express bus drivers in Malaysia: important indicators for screening. Traffic Inj Prev 2010;11:594-9. 10.1080/15389588.2010.505255 [DOI] [PubMed] [Google Scholar]
- 23.Chen R, Xiong KP, Lian YX, et al. Daytime sleepiness and its determining factors in Chinese obstructive sleep apnea patients. Sleep Breath 2011;15:129-35. 10.1007/s11325-010-0337-4 [DOI] [PubMed] [Google Scholar]
- 24.Kawaguchi Y, Fukumoto S, Inaba M, et al. Different impacts of neck circumference and visceral obesity on the severity of obstructive sleep apnea syndrome. Obesity (Silver Spring) 2011;19:276-82. 10.1038/oby.2010.170 [DOI] [PubMed] [Google Scholar]
- 25.Ugur KS, Ark N, Kurtaran H, et al. Subcutaneous fat tissue thickness of the anterior neck and umbilicus in patients with obstructive sleep apnea. Otolaryngol Head Neck Surg 2011;145:505-10. 10.1177/0194599811410272 [DOI] [PubMed] [Google Scholar]
- 26.Soylu AC, Levent E, Sarıman N, et al. Obstructive sleep apnea syndrome and anthropometric obesity indexes. Sleep Breath 2012;16:1151-8. 10.1007/s11325-011-0623-9 [DOI] [PubMed] [Google Scholar]
- 27.Lubrano C, Saponara M, Barbaro G, et al. Relationships between body fat distribution, epicardial fat and obstructive sleep apnea in obese patients with and without metabolic syndrome. PLoS One 2012;7:e47059. 10.1371/journal.pone.0047059 [DOI] [PMC free article] [PubMed] [Google Scholar]
- 28.Lin QC, Zhang XB, Chen GP, et al. Obstructive sleep apnea syndrome is associated with some components of metabolic syndrome in non-obese adults. Sleep Breath 2012;16:571-8. 10.1007/s11325-011-0544-7 [DOI] [PubMed] [Google Scholar]
- 29.Li Y, Lin N, Ye J, et al. Upper airway fat tissue distribution in subjects with obstructive sleep apnea and its effect on retropalatal mechanical loads. Respir Care 2012;57:1098-105. 10.4187/respcare.00929 [DOI] [PubMed] [Google Scholar]
- 30.Kim NH, Lee SK, Eun CR, et al. Short sleep duration combined with obstructive sleep apnea is associated with visceral obesity in Korean adults. Sleep 2013;36:723-9. 10.5665/sleep.2636 [DOI] [PMC free article] [PubMed] [Google Scholar]
- 31.Apaydin M, Ayik SO, Akhan G, et al. Carotid intima-media thickness increase in patients with habitual simple snoring and obstructive sleep apnea syndrome is associated with metabolic syndrome. J Clin Ultrasound 2013;41:290-6. 10.1002/jcu.22040 [DOI] [PubMed] [Google Scholar]
- 32.Kang HH, Kang JY, Ha JH, et al. The associations between anthropometric indices and obstructive sleep apnea in a Korean population. PLoS One 2014;9:e114463. 10.1371/journal.pone.0114463 [DOI] [PMC free article] [PubMed] [Google Scholar]
- 33.Liu KH, Chu WC, To KW, et al. Mesenteric fat thickness is associated with increased risk of obstructive sleep apnoea. Respirology 2014;19:92-7. 10.1111/resp.12164 [DOI] [PubMed] [Google Scholar]
- 34.Lim YH, Choi J, Kim KR, et al. Sex-specific characteristics of anthropometry in patients with obstructive sleep apnea: neck circumference and waist-hip ratio. Ann Otol Rhinol Laryngol 2014;123:517-23. 10.1177/0003489414526134 [DOI] [PubMed] [Google Scholar]
- 35.Shen P, Han Y, Cai B, et al. Decreased levels of serum nesfatin-1 in patients with obstructive sleep apnea syndrome. Sleep Breath 2015;19:515-22. 10.1007/s11325-014-1039-0 [DOI] [PubMed] [Google Scholar]
- 36.Luz GP, Guimarães TM, Weaver TE, et al. Impaired sustained attention and lapses are present in patients with mild obstructive sleep apnea. Sleep Breath 2016;20:681-7. 10.1007/s11325-015-1279-7 [DOI] [PubMed] [Google Scholar]
- 37.Xu H, Guan J, Yi H, et al. Elevated low-density lipoprotein cholesterol is independently associated with obstructive sleep apnea: evidence from a large-scale cross-sectional study. Sleep Breath 2016;20:627-34. 10.1007/s11325-015-1262-3 [DOI] [PubMed] [Google Scholar]
- 38.Wang L, Cai A, Zhang J, et al. Association of obstructive sleep apnea plus hypertension and prevalent cardiovascular diseases: A cross-sectional study. Medicine (Baltimore) 2016;95:e4691. 10.1097/MD.0000000000004691 [DOI] [PMC free article] [PubMed] [Google Scholar]
- 39.Duong-Quy S, Hua-Huy T, Tran-Mai-Thi HT, et al. Study of Exhaled Nitric Oxide in Subjects with Suspected Obstructive Sleep Apnea: A Pilot Study in Vietnam. Pulm Med 2016;2016:3050918. 10.1155/2016/3050918 [DOI] [PMC free article] [PubMed] [Google Scholar]
- 40.Cao Z, Zhang P, He Z, et al. Obstructive sleep apnea combined dyslipidemia render additive effect on increasing atherosclerotic cardiovascular diseases prevalence. Lipids Health Dis 2016;15:98. 10.1186/s12944-016-0267-7 [DOI] [PMC free article] [PubMed] [Google Scholar]
- 41.Shi J, Piao J, Liu B, et al. Obstructive sleep apnea increases systolic and diastolic blood pressure variability in hypertensive patients. Blood Press Monit 2017;22:208-12. 10.1097/MBP.0000000000000259 [DOI] [PubMed] [Google Scholar]
- 42.Tseng PH, Lee PL, Hsu WC, et al. A Higher Proportion of Metabolic Syndrome in Chinese Subjects with Sleep-Disordered Breathing: A Case-Control Study Based on Electrocardiogram-Derived Sleep Analysis. PLoS One 2017;12:e0169394. 10.1371/journal.pone.0169394 [DOI] [PMC free article] [PubMed] [Google Scholar]
- 43.Amin A, Ali A, Altaf QA, et al. Prevalence and Associations of Obstructive Sleep Apnea in South Asians and White Europeans with Type 2 Diabetes: A Cross-Sectional Study. J Clin Sleep Med 2017;13:583-9. 10.5664/jcsm.6548 [DOI] [PMC free article] [PubMed] [Google Scholar]
- 44.Unal Y, Ozturk DA, Tosun K, et al. Association between obstructive sleep apnea syndrome and waist-to-height ratio. Sleep Breath 2019;23:523-9. 10.1007/s11325-018-1725-4 [DOI] [PubMed] [Google Scholar]
- 45.Ragia G, Archontogeorgis K, Simmaco M, et al. Genetics of Obstructive Sleep Apnea: Vitamin D Receptor Gene Variation Affects Both Vitamin D Serum Concentration and Disease Susceptibility. Omics 2019;23:45-53. 10.1089/omi.2018.0184 [DOI] [PubMed] [Google Scholar]
- 46.Bauters FA, Hertegonne KB, De Buyzere ML, et al. Phenotype and Risk Burden of Sleep Apnea: A Population-Based Cohort Study. Hypertension 2019;74:1052-62. 10.1161/HYPERTENSIONAHA.119.13452 [DOI] [PubMed] [Google Scholar]
- 47.Tażbirek M, Potoczny J, Strójwąs K, et al. Anthropometric Factors in the Assessment of Obstructive Sleep Apnea Risk in Patients with Metabolic Syndrome. Adv Exp Med Biol 2019;1160:35-41. 10.1007/5584_2019_376 [DOI] [PubMed] [Google Scholar]
- 48.Kohno A, Kitamura Y, Kato S, et al. Displacement of the hyoid bone by muscle paralysis and lung volume increase: the effects of obesity and obstructive sleep apnea. Sleep 2019;42:zsy198. 10.1093/sleep/zsy198 [DOI] [PMC free article] [PubMed] [Google Scholar]
- 49.Xu H, Zhao X, Shi Y, et al. Development and validation of a simple-to-use clinical nomogram for predicting obstructive sleep apnea. BMC Pulm Med 2019;19:18. 10.1186/s12890-019-0782-1 [DOI] [PMC free article] [PubMed] [Google Scholar]
- 50.Zheng C, Song H, Wang S, et al. Serum Uric Acid Is Independently Associated with Risk of Obstructive Sleep Apnea-Hypopnea Syndrome in Chinese Patients with Type 2 Diabetes. Dis Markers 2019;2019:4578327. 10.1155/2019/4578327 [DOI] [PMC free article] [PubMed] [Google Scholar]
- 51.Cho JH, Choi JH, Suh JD, et al. Comparison of Anthropometric Data Between Asian and Caucasian Patients With Obstructive Sleep Apnea: A Meta-Analysis. Clin Exp Otorhinolaryngol 2016;9:1-7. 10.21053/ceo.2016.9.1.1 [DOI] [PMC free article] [PubMed] [Google Scholar]
- 52.Mayer P, Pépin JL, Bettega G, et al. Relationship between body mass index, age and upper airway measurements in snorers and sleep apnoea patients. Eur Respir J 1996;9:1801-9. 10.1183/09031936.96.09091801 [DOI] [PubMed] [Google Scholar]
- 53.Flegal KM, Kit BK, Orpana H, et al. Association of all-cause mortality with overweight and obesity using standard body mass index categories: a systematic review and meta-analysis. JAMA 2013;309:71-82. 10.1001/jama.2012.113905 [DOI] [PMC free article] [PubMed] [Google Scholar]
- 54.Peppard PE, Young T, Palta M, et al. Longitudinal study of moderate weight change and sleep-disordered breathing. JAMA 2000;284:3015-21. 10.1001/jama.284.23.3015 [DOI] [PubMed] [Google Scholar]
- 55.Expert Consultation WHO. Appropriate body-mass index for Asian populations and its implications for policy and intervention strategies. Lancet. 2004;363:157-63. Erratum in: Lancet. 2004 Mar 13;363(9412):902. 10.1016/S0140-6736(03)15268-3 [DOI] [PubMed] [Google Scholar]
- 56.Deurenberg P, Deurenberg-Yap M, Guricci S. Asians are different from Caucasians and from each other in their body mass index/body fat per cent relationship. Obes Rev 2002;3:141-6. 10.1046/j.1467-789X.2002.00065.x [DOI] [PubMed] [Google Scholar]
- 57.Sutherland K, Keenan BT, Bittencourt L, et al. A Global Comparison of Anatomic Risk Factors and Their Relationship to Obstructive Sleep Apnea Severity in Clinical Samples. J Clin Sleep Med 2019;15:629-39. 10.5664/jcsm.7730 [DOI] [PMC free article] [PubMed] [Google Scholar]
- 58.Shelton KE, Woodson H, Gay S, et al. Pharyngeal fat in obstructive sleep apnea. Am Rev Respir Dis 1993;148:462-6. 10.1164/ajrccm/148.2.462 [DOI] [PubMed] [Google Scholar]
- 59.Davies RJ, Ali NJ, Stradling JR. Neck circumference and other clinical features in the diagnosis of the obstructive sleep apnoea syndrome. Thorax 1992;47:101-5. 10.1136/thx.47.2.101 [DOI] [PMC free article] [PubMed] [Google Scholar]
- 60.Degache F, Sforza E, Dauphinot V, et al. Relation of central fat mass to obstructive sleep apnea in the elderly. Sleep 2013;36:501-7. 10.5665/sleep.2532 [DOI] [PMC free article] [PubMed] [Google Scholar]
- 61.Sakakibara H, Tong M, Matsushita K, et al. Cephalometric abnormalities in non-obese and obese patients with obstructive sleep apnoea. Eur Respir J 1999;13:403-10. 10.1183/09031936.99.13240399 [DOI] [PubMed] [Google Scholar]
- 62.Fredheim JM, Rollheim J, Sandbu R, et al. Obstructive sleep apnea after weight loss: a clinical trial comparing gastric bypass and intensive lifestyle intervention. J Clin Sleep Med 2013;9:427-32. 10.5664/jcsm.2656 [DOI] [PMC free article] [PubMed] [Google Scholar]
- 63.Chen X, Wang R, Lutsey PL, et al. Racial/ethnic differences in the associations between obesity measures and severity of sleep-disordered breathing: the Multi-Ethnic Study of Atherosclerosis. Sleep Med 2016;26:46-53. 10.1016/j.sleep.2015.06.003 [DOI] [PMC free article] [PubMed] [Google Scholar]
- 64.Tagaito Y, Isono S, Remmers JE, et al. Lung volume and collapsibility of the passive pharynx in patients with sleep-disordered breathing. J Appl Physiol (1985) 2007;103:1379-85. 10.1152/japplphysiol.00026.2007 [DOI] [PubMed] [Google Scholar]
- 65.Owens RL, Malhotra A, Eckert DJ, et al. The influence of end-expiratory lung volume on measurements of pharyngeal collapsibility. J Appl Physiol (1985) 2010;108:445-51. 10.1152/japplphysiol.00755.2009 [DOI] [PMC free article] [PubMed] [Google Scholar]
- 66.Cornier MA, Després JP, Davis N, et al. Assessing adiposity: a scientific statement from the American Heart Association. Circulation 2011;124:1996-2019. 10.1161/CIR.0b013e318233bc6a [DOI] [PubMed] [Google Scholar]
- 67.Nishida C, Ko GT, Kumanyika S. Body fat distribution and noncommunicable diseases in populations: overview of the 2008 WHO Expert Consultation on Waist Circumference and Waist-Hip Ratio. Eur J Clin Nutr 2010;64:2-5. 10.1038/ejcn.2009.139 [DOI] [PubMed] [Google Scholar]
- 68.Sangkum L, Klair I, Limsuwat C, et al. Incorporating body-type (apple vs. pear) in STOP-BANG questionnaire improves its validity to detect OSA. J Clin Anesth 2017;41:126-31. 10.1016/j.jclinane.2016.12.019 [DOI] [PMC free article] [PubMed] [Google Scholar]
- 69.Santos RB, Silva WA, Parise BK, et al. Accuracy of global and/or regional anthropometric measurements of adiposity in screening sleep apnea: the ELSA-Brasil cohort. Sleep Med 2019;63:115-21. 10.1016/j.sleep.2019.04.020 [DOI] [PubMed] [Google Scholar]
- 70.Heinzer R, Vat S, Marques-Vidal P, et al. Prevalence of sleep-disordered breathing in the general population: the HypnoLaus study. Lancet Respir Med 2015;3:310-8. 10.1016/S2213-2600(15)00043-0 [DOI] [PMC free article] [PubMed] [Google Scholar]
Associated Data
This section collects any data citations, data availability statements, or supplementary materials included in this article.
Supplementary Materials
The article’s supplementary files as


