

Abstract
The ability of neural stem cells (NSCs) to switch between quiescence and proliferation is crucial for brain development and homeostasis. Increasing evidence suggests that variants of histone lysine methyltransferases including KMT5A are associated with neurodevelopmental disorders. However, the function of KMT5A/Pr‐set7/SETD8 in the central nervous system is not well established. Here, we show that Drosophila Pr‐Set7 is a novel regulator of NSC reactivation. Loss of function of pr‐set7 causes a delay in NSC reactivation and loss of H4K20 monomethylation in the brain. Through NSC‐specific in vivo profiling, we demonstrate that Pr‐set7 binds to the promoter region of cyclin‐dependent kinase 1 (cdk1) and Wnt pathway transcriptional co‐activator earthbound1/jerky (ebd1). Further validation indicates that Pr‐set7 is required for the expression of cdk1 and ebd1 in the brain. Similar to Pr‐set7, Cdk1 and Ebd1 promote NSC reactivation. Finally, overexpression of Cdk1 and Ebd1 significantly suppressed NSC reactivation defects observed in pr‐set7‐depleted brains. Therefore, Pr‐set7 promotes NSC reactivation by regulating Wnt signaling and cell cycle progression. Our findings may contribute to the understanding of mammalian KMT5A/PR‐SET7/SETD8 during brain development.
Keywords: Drosophila, neural stem cell, Pr‐set7, quiescence, reactivation
Subject Categories: Chromatin, Epigenetics, Genomics & Functional Genomics; Neuroscience; Regenerative Medicine
Histone monomethyl transferase Pr‐set7 is required for Drosophila neural stem cells to exit from quiescence. Pr‐set7 promotes stem cell reactivation by upregulating the cell cycle regulator Cdk1 and the Wnt pathway transcriptional co‐activator Ebd1.
Introduction
Stem cells have the ability to undergo proliferation, differentiation, and quiescence. The balance between these states is crucial for neurogenesis and regeneration. In the adult mammalian brains, most neural stem cells (NSCs) remain in quiescence, a mitotically dormant state (Morshead et al, 1994; Doetsch et al, 1999). Quiescent NSCs can re‐enter cell cycle (termed reactivation) to generate new neurons in response to various physiological stimuli, such as injury, the presence of nutrients, and physical exercise (Ahn & Joyner, 2005; Lugert et al, 2010; Wang et al, 2011; Daynac et al, 2013; Faiz et al, 2015; Daynac et al, 2016; Kawai et al, 2017; Otsuki & Brand, 2017, 2020; Ding et al, 2020). Conversely, the proliferation capacity of NSCs is greatly reduced upon stress, anxiety, and old age (Lucassen et al, 2010). Dysregulation of NSC quiescence and reactivation would severely affect tissue homeostasis. While excessive reactivation depletes NSC pools, failure of reactivation leads to defects in neurogenesis (Cheung & Rando, 2013; Braun & Jessberger, 2014). Therefore, it is of great importance to understand the mechanisms controlling the NSC quiescence and reactivation.
Drosophila larval brain NSCs, also known as neuroblasts, have emerged as an excellent in vivo model to study molecular mechanisms underlying NSC quiescence and reactivation. At the end of embryogenesis, Drosophila NSCs in the central nervous system shrink in size and enter quiescence (Truman & Bate, 1988; Ito & Hotta, 1992; Britton & Edgar, 1998). The quiescence entry is regulated by a combined function of temporal identity factors, the spatial control homeobox genes, and a homeodomain differentiation factor Prospero (Pros; Isshiki et al, 2001; Tsuji et al, 2008; Lai & Doe, 2014; Otsuki & Brand, 2019). Notably, only 25% of quiescent NSCs arrest in the G0 stage, while the majority of quiescent NSCs (75%) are in the G2 stage (Otsuki & Brand, 2018). Quiescent NSCs extend their primary protrusions toward the neuropil until they begin to divide (Truman & Bate, 1988; Tsuji et al, 2008; Chell & Brand, 2010) and appear to use this microtubule enriched structure to directly contact the neuropil (Deng et al, 2020). After about 24 h, quiescent NSCs re‐enter the cell cycle to resume neurogenesis in response to feeding (Truman & Bate, 1988; Ito & Hotta, 1992; Britton & Edgar, 1998). During the reactivation, NSCs appear to lose the protrusion either through retraction (Otsuki & Brand, 2018) or by segregating the protrusion into the ganglion mother cell following their first asymmetric division (Bostock et al, 2020). Dietary amino acids are sensed by the fat body, functional equivalence of mammalian liver, and adipose tissue (Colombani et al, 2003), which signals blood–brain barrier (BBB) glial cells to produce and secrete insulin‐like peptides (dILPs) dILP2 and dILP6. dILPs diffuse directly to the underlying NSCs, activate the insulin/PI3K/Akt pathway, and drive NSC reactivation (Britton & Edgar, 1998; Chell & Brand, 2010; Sousa‐Nunes et al, 2011; Speder & Brand, 2014). In mammalian brains, insulin‐like growth factor (IGF‐1) produced by astroglial cells acts locally to promote NSC proliferation in response to brain injury (Ye et al, 2004; Yan et al, 2006; Mairet‐Coello et al, 2009). Besides the insulin/PI3K/Akt pathway, the Hippo pathway maintains NSC quiescence by inactivating Yorkie (Ding et al, 2016; Poon et al, 2016). This pathway is inactivated in response to dietary amino acids and is negatively regulated by an E3 ubiquitin ligase CRL4Mahj (Ly et al, 2019). Furthermore, NSC reactivation also requires intrinsic factors including spindle matrix proteins Chromator (Li et al, 2017), Hsp83/Hsp90 (Huang & Wang, 2018), striatin‐interacting phosphatase and kinase (STRIPAK) family proteins (Gil‐Ranedo et al, 2019), and Mini spindles‐dependent microtubule growth (Deng et al, 2020).
KMT5A/Pr‐set7/SETD8 is the sole histone H4 Lys 20 monomethyltransferase (H4K20me1) (Nishioka et al, 2002). Pr‐set7 and H4K20me1 play critical roles in maintaining genome stability, DNA repair and replication, cell cycle regulation, and chromatin compaction (Beck et al, 2012). Although H4K20me1 has been extensively studied as an epigenetic mark, its function in gene regulation remains uncertain, as it correlates with both gene expression and repression (Nishioka et al, 2002; Karachentsev et al, 2005; Trojer et al, 2007; Oda et al, 2009). Pr‐set7/H4K20me1 can, directly and indirectly, promote chromatin condensation (Trojer et al, 2007; Oda et al, 2009) and loss of pr‐set7 suppresses the variegation phenotype in Drosophila, indicating the role of Pr‐set7 functions as a gene silencer (Karachentsev et al, 2005). On the other hand, genome‐wide analysis reveals that Pr‐set7 and H4K20me1 highly correlate with transcriptional activation (Talasz et al, 2005; Vakoc et al, 2006; Barski et al, 2007; Wang et al, 2008; Cui et al, 2009; Wakabayashi et al, 2009). Increasing evidence suggests that variants of histone lysine methyltransferases including KMT5A are associated with neurodevelopmental disorders (Wickramasekara & Stessman, 2019). However, the function of KMT5A/Pr‐set7/SETD8 in the central nervous system is not well established.
Here, we show that Drosophila Pr‐set7 is required for NSC reactivation through regulating Wnt signaling and cell‐cycle progression. Loss of pr‐set7 results in defects of NSC reactivation including failure to incorporate EdU and retaining their cellular extensions. Moreover, H4K20me1 was lost in pr‐set7‐depleted larval brains. Through targeted DNA adenine methyltransferase (Dam) identification (TaDa)‐based in vivo profiling, we demonstrate that Pr‐set7 binds to the promoter region of cell‐cycle regulator cdk1 and Wnt pathway transcriptional and co‐activator earthbound1/Jerky (Ebd1) in NSCs. Further in vivo analysis indicates that Pr‐set7 promotes the expression of Cdk1 and Ebd1 in NSCs. Finally, overexpression of Cdk1 and Ebd1 significantly suppresses reactivation defects resulted from pr‐set7 loss of function. Therefore, Pr‐set7 promotes the expression of cell‐cycle regulator Cdk1 and Wnt Signaling pathway.
Results
Isolation of pr‐set7 loss‐of‐function allele with NSC reactivation defects
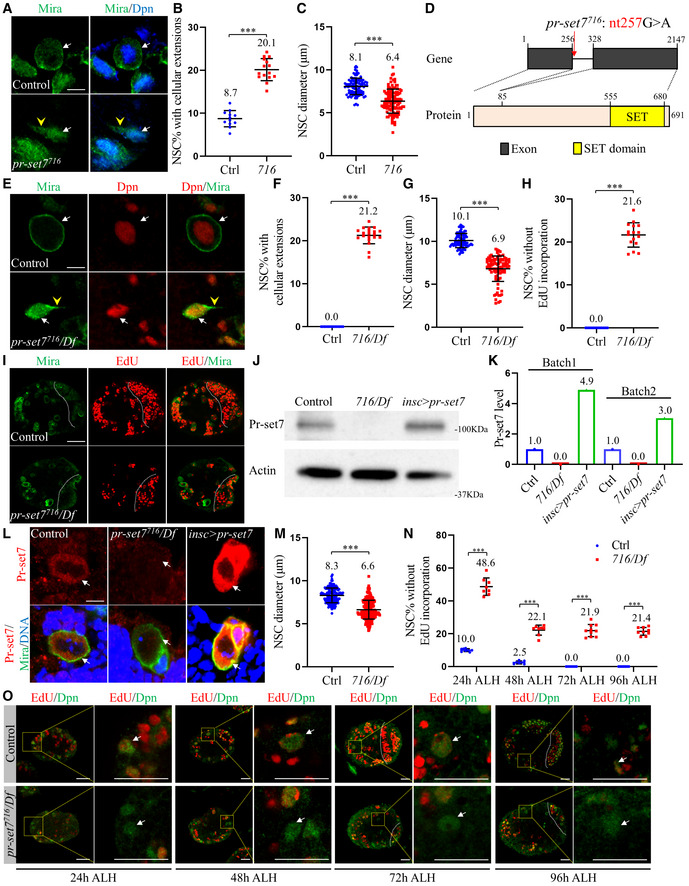
To identify novel regulators of NSC reactivation and homeostasis, we carried out a genetic screen on chromosome 3R in a collection of ethyl methane sulfonate (EMS)‐induced mutations (Ly et al, 2019) and isolated a new allele of pr‐set7, pr‐set7716. At 24 h ALH, the majority of control NSCs were reactivated with a diameter of 8.1 ± 1.0 µm (Fig 1A and C), and only 8.7 ± 1.9% of NSCs retained cellular extensions (Fig 1A and B). However, at 24 h ALH the NSC diameter of pr‐set7716 was 6.4 ± 1.4 µm (Fig 1A and C) and 20.1 ± 2.6% of NSCs exhibited cellular extensions (Fig 1A and B). These observations suggested that pr‐set7716 NSCs displayed defects in NSC reactivation. Genetic mapping and molecular sequencing experiments indicated that Pr‐set7716 contained a point mutation (nucleotides # 257 G to A) at the splice donor site in the intron, presumably resulting in a truncated pr‐set7 due to retaining of the intron that contains a premature stop codon (TAG) at 282 nucleotides (Fig 1D). Drosophila Pr‐set7 contains a conserved SET domain that is responsible for its methyl transferase activity, at the carboxyl‐terminus (Fig 1D) (Brustel et al, 2011). pr‐set7716 might lose its methyl transferase function as a result of the putative truncation. Homozygous pr‐set7716 larvae are semi‐lethal at the early larval stage, with few survived to the second instar larval stage, presumably due to additional mutations in this strain. To eliminate the effect of a potential second‐site mutation in pr‐set7716, we examined hemizygotes pr‐set7716/Df(3R)ED5644 (BDSC#9090), which survived to late third instar stages. At 96 h after larval hatching (ALH), all NSCs in the central brain showed round morphology without cellular extensions, indicating that all of them were reactivated (Fig 1E and F). However, at this time point, there were still 21.2 ± 1.9% of NSCs from hemizygous pr‐set7716/Df(3R)ED5644 displayed cellular extensions (Fig 1E and F). At 96 h ALH, all NSCs (Fig 1H and I) were proliferative and incorporated 5‐ethynyl‐2′‐deoxyuridine (EdU). By contrast, 21.6 ± 2.8% of pr‐set7716/Df(3R)ED5644 NSCs failed to incorporate EdU at 96 h ALH (Fig 1H and I). These observations suggested that pr‐set7 mutant NSCs failed to reactivate even at late larval stages. Consistent with these observations, at 24 h ALH, the NSC diameter of hemizygous pr‐set7716/Df(3R)ED5644 (Fig 1M; 6.6 ± 1.1 µm) was much smaller than that of control NSCs (Fig 1M; 8.3 ± 0.9 µm). Moreover, at 96 h ALH, the size of pr‐set7716/Df(3R)ED5644 NSCs remained much smaller (Fig 1G, 6.8 ± 1.5 µm) than that of control NSCs (Fig 1G, 10.1 ± 0.8 µm). These observations indicate that a significant number of NSCs failed to exit quiescence even at late larval stages upon loss of pr‐set7. We generated anti‐Pr‐set7 antibodies against its 412‐691 aa at the C‐terminal region including the SET domain and detected Pr‐set7 protein at the predicted size of 100 kDa in control larval brain extracts (Fig 1J; Karachentsev et al, 2005). Pr‐set7 levels in Western blot were reduced to 0% in hemizygous pr‐set7716/Df(3R)ED5644 larval brains at 72 h ALH (Fig 1K). Furthermore, Pr‐set7 detected by immunostaining in control NSCs was completely absent in hemizygous pr‐set7716/Df(3R)ED5644 larval brains (Fig 1L). These observations indicate that pr‐set7716 appears to generate a truncation without its SET domain. Therefore, pr‐set7716/Df(3R)ED5644 is likely a strong loss‐of‐function allele without methyltransferase activity. Therefore, we used pr‐set7716/Df(3R)ED5644, which was referred to as pr‐set7 mutant, for most of our subsequent analyses in this study. We examined the pr‐set7 heterozygous larval brains (pr‐set7716/+) and found that it had no NSC reactivation defects and was indistinguishable from the “wild‐type” control yw (Fig EV1A and B). Therefore, yw is used as a control throughout this study.
Figure 1. Pr‐set7 is required for NSC reactivation.
-
ALarval NSCs of control (ctrl; yw) and pr‐set7716 (716) at 24 h ALH were stained for Deadpan (Dpn) and Miranda (Mira).
-
B, CQuantifications of cellular extensions (B) and NSC diameters (C) for genotypes in (A). In (B), n = 1055, 12 brain lobes [BL] for control; n = 1000, 15 BL for pr‐set7716. In (C), n = 101 for control; n = 112 for pr‐set7716.
-
DA schematic representation of the pr‐set7716 mutation. pr‐set7716 contains a G to A point mutations at 831 nucleotides (nt). Drosophila Pr‐set7 contains a SET domain (in yellow), which is required for its methyl transferase activity.
-
ELarval NSCs of control (ctrl; yw) and pr‐set7716/Df(3R)ED5644 (716/Df) at 96 h ALH were labeled with Dpn and Mira.
-
F, GQuantifications of cellular extensions (F) and NSC diameters (G) for genotypes in (E). In (F), n = 1488, 15 BL for control; n = 2014, 20 BL for pr‐set7716/Df. In (G), n = 92 for control; n = 93 for pr‐set7716/Df.
-
HQuantifications of EdU incorporation for genotypes in (I). Control, n = 1365, 16 BL; pr‐set7716/Df, n = 1006, 16 BL.
-
ILarval brains of control (ctrl; yw) and pr‐set7716/Df at 96 h ALH were labeled with Dpn and EdU.
-
J, KWestern blot and quantification analysis of larval brain extracts of control (ctrl; yw), pr‐set7716/Df, and UAS‐pr‐set7 induced with insc‐Gal4 at 72 h ALH (n = 2 as biological replicates). Blots were probed with anti‐Pr‐set7 antibody or anti‐Actin antibody (loading control). Pr‐set7 levels were normalized against actin intensity.
-
LLarval NSCs of control (ctrl; yw), pr‐set7716/Df, and UAS‐pr‐set7 induced with insc‐Gal4 at 72 h ALH were stained for Pr‐set7, Mira, and DNA.
-
M, NQuantifications of NSC diameters (M) at 24 h ALH and EdU incorporation (N) for genotypes in (O). In (M), n = 152 for control; n = 129 for pr‐set7716/Df. In (N), for control, n = 601, 13 BL at 24 h ALH; n = 988, 14 BL at 48 h ALH; n = 813, 9 BL at 72 h ALH and n = 829, 10 BL at 96 h ALH. For pr‐set7716/Df, n = 566, 12 BL at 24 h ALH; n = 808, 13 BL at 48 h ALH; n = 1032, 10 BL at 72 h ALH and n = 825, 9 BL at 96 h ALH.
-
OLarval brains of control (ctrl; yw) and pr‐set7716/Df at 24, 48, 72, and 96 h ALH were labeled with Dpn and EdU.
Data information: Quantification data are presented in as mean ± SD (B, C, F, G, H, M, N). n numbers in (B, F, H, N) were total NSCs counted with total brain lobes measured, while each brain lobe considered as one biological replicate. Yellow dotted boxes indicate the region of zoomed‐in images (O). White arrows point to NSCs and yellow arrowheads point to cellular extensions of NSCs. The central brain is to the left of white dotted lines (I, O). Statistical analyses were done comparing two different genotypes using Mann–Whitney test (B, C, F, G, H, M, N). ***P < 0.001. Scale bars, 5 μm (A, E, L), 15 μm (O), 30 μm (I).
Source data are available online for this figure.
Figure EV1. Loss of pr‐set7 resulted in defects of NSC reactivation.
- Larval brains of control (ctrl; yw), and pr‐set7716/+ at 24 h were 48, 72, and 96 h ALH were labeled with Deadpan (Dpn), Miranda (Mira), and EdU.
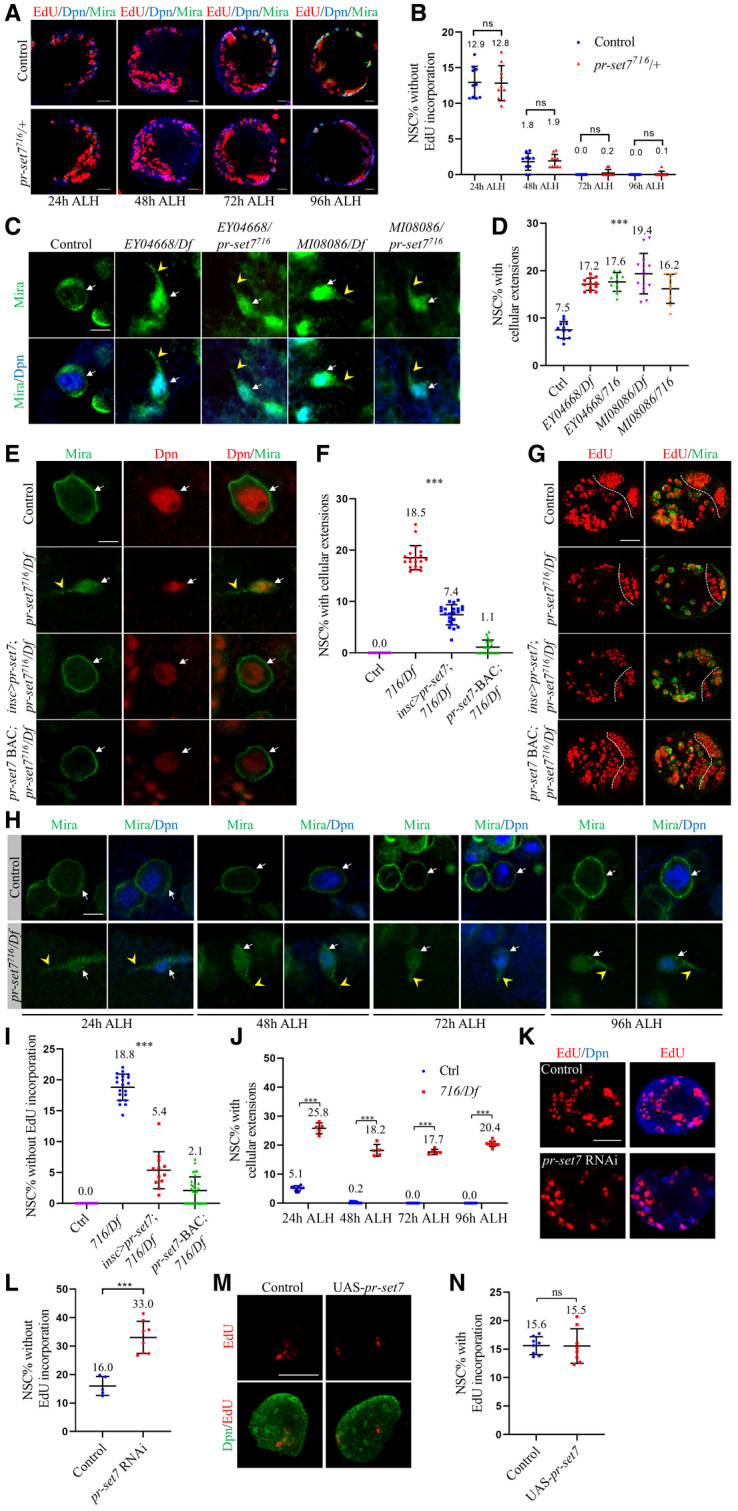
- Quantifications of EdU incorporation in (A). As for percentage of NSCs without EdU incorporation, for control, 12.9 ± 2.2%, n = 870, 10 BL at 24 h ALH; 1.8 ± 1.2%, n = 888, 10 BL at 48 h ALH; 0 ± 0%, n = 872, 10 BL at 72 h ALH, and 0 ± 0%, n = 877, 10 BL at 96 h ALH. For pr‐set7716/+, 12.8 ± 2.5%, n = 862, 10 BL at 24 h ALH; 1.9 ± 0.9%, n = 883, 10 BL at 48 h ALH; 0.2 ± 0.5%, n = 868, 10 BL at 72 h ALH and 0.1 ± 0.4%, n = 881, 10 BL at 96 h ALH.
- Larval NSCs of control (ctrl; yw), pr‐set7EY04668/Df(3R)ED5644 (EY04668/Df), pr‐set7EY04668/pr‐set7716 (EY04668/pr‐set7716), pr‐set7MI08086/Df(3R)ED5644 (MI08086/Df), pr‐set7MI08086/pr‐set7716 (MI08086/pr‐set7716) at 24 h ALH were stained for Dpn and Mira.
- Quantifications of cellular extensions for genotypes in (C). Control: n = 931, 12 BL; EY04668/Df: n = 883, 12 BL; EY04668/pr‐set7716: n = 544, 11 BL; MI08086/Df: n = 764, 13 BL and MI08086/pr‐set7716: n = 654, 10 BL.
- Larval NSCs of control (ctrl; yw), pr‐set7716/Df(3R)ED5644 (716/Df), pr‐set7716/Df with UAS‐pr‐set7 induced with insc‐Gal4, and pr‐set7716/Df with pr‐set7‐BAC at 96 h ALH were stained for Dpn and Mira.
- Quantifications of cellular extensions for genotypes in (E). Control: n = 827, 10 BL; 716/Df: n = 1270, 20 BL; pr‐set7716/Df with UAS‐pr‐set7 induced with insc‐Gal4: n = 1420, 22 BL and pr‐set7716/Df with pr‐set7‐BAC: n = 1351, 20 BL.
- Larval brains of control (ctrl; yw), pr‐set7716/Df(3R)ED5644 (Df), pr‐set7716/Df with UAS‐pr‐set7 induced with insc‐Gal4, and pr‐set7716/Df with pr‐set7‐BAC at 96 h ALH were labeled with Mira and EdU.
- Larval NSCs of control (ctrl; yw) and pr‐set7716/Df at 24, 48, 72, and 96 h ALH were stained for Dpn and Mira.
- Quantifications of EdU incorporation in (G). Control: n = 800, 10 BL; 716/Df: n = 1224, 20 BL; pr‐set7716/Df with UAS‐pr‐set7 induced with insc‐Gal4: n = 1189, 18 BL and pr‐set7716/Df with pr‐set7‐BAC: n = 1466, 30 BL.
- Quantifications of cellular extensions in (H). For control, n = 889, 15 BL at 24 h ALH; n = 1402, 17 BL at 48 h ALH; n = 1707, 21 BL at 72 h ALH and n = 1445, 16 BL at 96 h ALH. For pr‐set7716/Df, n = 425, 9 BL at 24 h ALH; n = 725, 9 BL at 48 h ALH; n = 716, 10 BL at 72 h ALH and n = 1880, 20 BL at 96 h ALH.
- Larval brains of control (UAS‐dicer2) and pr‐set7 RNAi (NIG #3307R‐3) under insc‐Gal4 at 24 h ALH were labeled for Dpn and EdU.
- Quantifications of EdU incorporation in (K). Control: n = 406, 9 BL; pr‐set7 RNAi: n = 597, 13 BL.
- Larval brains of control (UAS‐dicer2) and UAS‐pr‐set7 under insc‐Gal4 at 6 h ALH were labeled for Dpn and EdU.
- Quantifications of EdU incorporation in (M). Control: n = 475, 8 BL; UAS‐pr‐set7: n = 466, 8 BL.
Data information: Data are presented in (B, D, F, I, J, L, N) as mean ± SD. n numbers in (B, D, F, I, J, L, N) were total NSCs counted with total brain lobes measured, while each brain lobe was considered as one biological replicate. White arrows point to NSCs and yellow arrowheads point to cellular extensions of NSCs (C, E, H). The central brain is to the left of white dotted lines (G). Statistical analyses were done comparing two different genotypes using Mann–Whitney test (B, J, L, N). Statistical analyses were done comparing among different genotypes using ordinary one‐way ANOVA (D, F, I). ***P < 0.001. Scale bars, 15 μm (A), 5 μm (C, E, H), 30 μm (G, K, M).
Next, we examined other allelic combinations among pr‐set7716, other putative loss‐of‐function alleles of pr‐set7 or Df(3R)ED5644. pr‐set7EY04668 (BDSC#15761) contains a P‐element insertion at the 3’UTR, 1023 bp downstream of the stop codon (Bellen et al, 2004), while in pr‐set7MI08086(BDSC#44742) a P‐element is inserted 394 bp upstream of start codon (Venken et al, 2011). Consistently, all other trans‐heterozygotes or hemizygotes of pr‐set7 mutant alleles we have tested displayed similar NSC reactivation defects. At 24 h ALH, almost all wild‐type control NSCs were reactivated with only 7.5 ± 1.8% of NSCs exhibited cellular extension (Fig EV1C and D). However, in pr‐set7EY04668/Df(3R)ED5644 (17.2 ± 1.3%), pr‐set7EY04668/pr‐set7716 (17.6 ± 2.0%), pr‐set7MI08086/ Df(3R)ED5644 (19.4 ± 4.3%), and pr‐set7MI08086/pr‐set7716 (16.2 ± 3.1%), significantly more NSCs still retained cellular extensions at 24 h ALH (Fig EV1C and D).
To further validate the role of Pr‐set7 in NSC reactivation, we generated transgenic UAS‐Pr‐set7 expressing a full‐length Pr‐set7. At 72 h ALH at 29°C, all control NSCs was reactivated without cellular extensions (Fig EV1E and F) and they all incorporated EdU (Fig EV1G and I). At the same condition, 18.5 ± 2.4% of pr‐set7 NSCs showed cellular extensions (Fig EV1E and F). Similarly, 18.8 ± 2.1% of NSCs with hemizygous pr‐set7 were EdU‐negative at the same stage (Fig EV1G and I). Expression of pr‐set7 under insc‐Gal4 partially rescued the reactivation defects observed in pr‐set7 NSCs at 72 h ALH at 29°C; cellular extensions were only observed in 7.4 ± 2.0% of NSCs (Fig EV1E and F) and only 5.4 ± 3.0% of NSCs failed to incorporate EdU (Fig EV1G and I). This partial rescue was likely due to insufficient expression level of Pr‐set7 in quiescent NSCs under insc‐Gal4. Therefore, we generated a genomic rescue construct “pr‐set7 BAC”, using CH322‐129L5, a 19.3 kb bacterial artificial chromosome (BAC) containing the pr‐set7 gene region and its regulatory elements. pr‐set7‐BAC essentially rescued NSC reactivation defects of pr‐set7 mutant; Almost all pr‐set7 NSCs with pr‐set7‐BAC were reactivated, with only 1.1 ± 1.4% (Fig EV1E and F) of them displayed cellular extensions and 2.1 ± 2.2% (Fig EV1G and I) of them lacked EdU incorporation. Taken together, these results indicate that Pr‐set7 is required for NSC reactivation.
To further monitor at which stage Pr‐set7 is required for NSC reactivation, we performed the time‐course analysis at 24, 48, 72, and 96 h ALH. At 24 h ALH, the vast majority of control NSCs were reactivated and only 5.1 ± 0.9% of NSCs contained cellular extensions (Fig EV1H and J). By contrast, 25.8 ± 1.9% of pr‐set7 NSCs possessed cellular extensions at the same time point (Fig EV1H and J). Consistently, at 24 h ALH, most control NSCs re‐entered the cell cycle, with only 10.0 ± 0.9% of them lacking EdU incorporation (Fig 1N and O). In comparison, 48.6 ± 5.3% of pr‐set7 NSCs failed to incorporate EdU at 24 h ALH (Fig 1N and O). This finding suggests that loss of pr‐set7 impairs NSC reactivation at the early larval stage. At 48 h ALH, nearly all control NSCs were reactivated, as only 0.2 ± 0.3% (Fig EV1H and J) of them retained cellular extensions and 2.5 ± 0.9% (Fig 1N and O) were EdU‐negative. By contrast, cellular extensions and failure of EdU incorporation were observed in 18.2 ± 2.1% (Fig EV1H and J) and 22.1 ± 3.1% (Fig 1N and O) of pr‐set7 NSCs, respectively. At 72 h and 96 h ALH, all control NSCs lost cellular extensions (Fig EV1H and J) and incorporated with EdU (Fig 1N and O). However, even at late larval stages, a significant portion of pr‐set7 NSCs still exhibited cellular extensions, with 17.7 ± 0.9% at 72 h ALH and 20.4 ± 0.9% at 96 h ALH (Fig EV1H and J). Similarly, 21.9 ± 3.7% and 21.4 ± 2.4% of pr‐set7 NSCs lacked EdU incorporation at 72 h and 96 h ALH, respectively (Fig 1N and O).
To confirm that Pr‐set7 functions in the NSCs, we knocked down pr‐set7 in NSCs under the control of insc‐Gal4, an NSC‐specific driver. At 24 hours ALH at 29°C, 16.0 ± 3.3% (Fig EV1K and L) of control NSCs lacked EdU incorporation. By contrast, pr‐set7 RNAi (NIG #3307R‐3) under insc‐Gal4 resulted in a failure to incorporate EdU in 33.0 ± 5.6% (Fig EV1K and L) of NSCs at the same condition. This indicates that Pr‐set7 could function in NSCs to promote their reactivation. Furthermore, total NSC numbers per brain lobe in control (75.2 ± 5.4, n = 13 BL) and pr‐set7 716/Df brains (77.9 ± 7.0, n = 13 BL) at 48 h ALH were similar, suggesting that NSC survival is unlikely affected in the pr‐set7 mutant. When pr‐set7 was overexpressed under insc‐Gal4 at 6 h ALH at 29°C, 15.5 ± 3.0% incorporated EdU, similar to that of control NSCs (Fig EV1M and N; 15.6 ± 1.6%). Therefore, Pr‐set7 overexpression could not induce precocious cell‐cycle re‐entry.
Taken together, Pr‐set7 is required for the initiation of NSC reactivation.
Pr‐set7 levels increase along with NSC reactivation
Given that Pr‐Set7 is required for NSC reactivation, we examined the expression pattern of Pr‐set7 in the larval brain in a time‐course analysis. At 0 h ALH, the level of Pr‐set7 in control brains was nearly absent and increased significantly at 24 h ALH and 48 h ALH (Fig 2A and B). Pr‐set7 was observed mainly in the cytoplasm in NSCs, probably due to the low amount of Pr‐set7 in the nucleus of NSCs. This observation is consistent with previous findings that Pr‐set7 contains a nuclear localization signal (NLS) and displays both cytoplasmic and nuclear localization in Drosophila S2 cells (Zouaz et al, 2018). Pr‐set7 was undetectable in pr‐set7 mutant NSCs at both 24 h ALH and 48 h ALH (Fig 2A and B). As shown earlier, Pr‐set7 was absent in pr‐set7 mutant NSCs at 72 h ALH, while it was upregulated upon Pr‐set7 overexpression in the brain (Fig 1L), indicating that the anti‐Pr‐set7 antibodies were specific. These observations suggest that Pr‐set7 levels increase along with NSC reactivation.
Figure 2. Pr‐set7 levels increase with NSC reactivation and is required for H4K20me1 in larval brains.
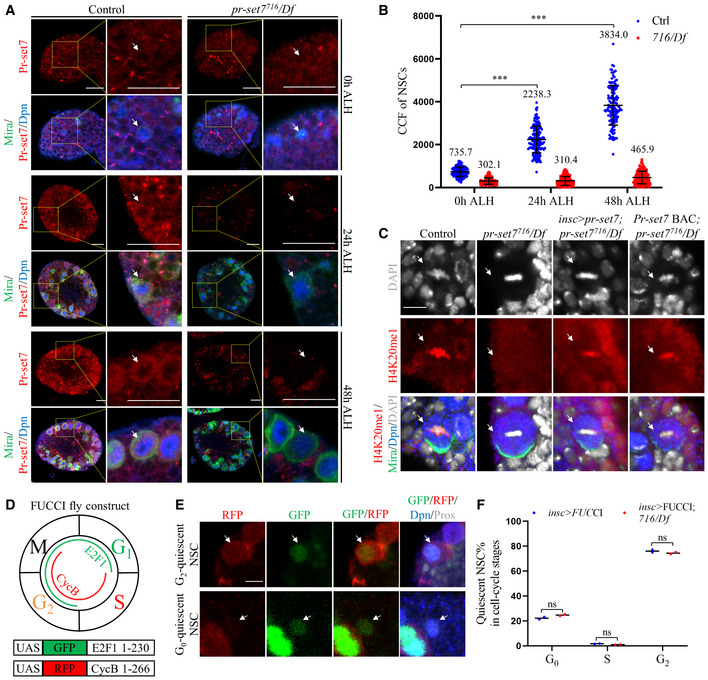
- Larval NSCs of control (ctrl; yw) and pr‐set7716/Df(3R)ED5644 (716/Df) at 0, 24 and 48 h ALH were stained for Pr‐set7, Dpn, and Mira. Yellow dotted boxes, zoomed‐in area.
- Quantifications of the corrected total cell fluorescence (CCF) for genotypes in (A). CCF = Integrated Density – (area of selected cell × mean fluorescence of background readings). At 0 h ALH, CCFs were 735.7 ± 220.7 (n = 168) for control, 302.1 ± 150.0 (n = 160) for 716/Df. At 24 h ALH, CCFs were 2238.3 ± 628.4 (n = 158) for control, 310.4 ± 207.1 (n = 113) for 716/Df. At 48 h ALH, CCFs were 3834.0 ± 924.2 (n = 124) for control, 465.9 ± 295.0 (n = 126) for 716/Df. Data are presented as mean ± SD. Statistical analyses were done comparing between the CCFs at later time points with the CCFs for control at 0 h ALH using Mann–Whitney test. ***P < 0.001.
- Larval NSCs of control (ctrl; yw), pr‐set7716/Df, pr‐set7716/Df with UAS‐pr‐set7 induced with insc‐Gal4, and pr‐set7716/Df with pr‐set7‐BAC at 24 h ALH were stained for H4K20me1, Dpn, Mira, and DAPI. Control: n = 108; pr‐set7716/Df: n = 87; pr‐set7716/Df with UAS‐pr‐set7 induced with insc‐Gal4: n = 167 and pr‐set7716/Df with pr‐set7‐BAC: n = 104.
- A schematic representation of the FUCCI.
- Larval NSCs with FUCCI constructs induced with insc‐Gal4 at 24 h were stained for GFP, RFP, Dpn, and Prospero (Pros).
- Quantifications of quiescent NSCs in different cell‐cycle stages from FUCCI flies (induced with insc‐Gal4) in control (and insc‐Gal4 > FUCCI) and pr‐set7716/Df. Quiescent NSCs of insc‐Gal4 > FUCCI: 76.1 ± 1.5% in G2, 1.7 ± 0.2% in S and 22.2 ± 1.3% in G0 (n = 343). Quiescent NSCs of insc‐Gal4 > FUCCI; pr‐set7716/Df: 74.4 ± 1.0% in G2, 0.9 ± 0.2% in S and 24.7 ± 0.8% in G0 (n = 344).
Data information: Quantification data are presented in as mean ± SD (B, F). Statistical analyses were done comparing two different genotypes using Mann–Whitney test (B, F). ns: non‐significant. White arrows point to NSCs. Scale bars, 5 μm (C, E), 15 μm (A).
H4K20 monomethylation is lost in pr‐set7 mutant NSCs
Pr‐Set7, essential for cell proliferation, is a histone methyltransferase that specifically monomethylates histone H4 lysine 20 (K20; Nishioka et al, 2002; Couture et al, 2005; Xiao et al, 2005; Oda et al, 2009). To investigate whether the expression patterns of H4K20me1 is associated with the increase of Pr‐set7 during NSC reactivation, we examined the H4K20me1 level at 0 h and 24 h ALH. As shown in Fig EV2, EV3, EV4, EV5A–C, at 0 h ALH, the level of H4K20me1 in control brains and NSCs was nearly absent. At this stage, H4K20me1 could only be clearly detected in mitotic NSCs with condensed chromosomes, likely due to the insensitivity of anti‐H4K20me1 antibody to the weak signal. By contrast, at 24 h ALH, H4K20me1 levels in both NSCs and brain lobes were increased significantly and its nuclear staining could also be detected in interphase NSCs (Fig EV2, EV3, EV4, EV5A–C). Therefore, the increased H4K20me1 level was associated with the increased Pr‐set7 level during NSC reactivation. We then sought to examine whether H4K20me1 was lost in pr‐set7 mutant brains. At 24 h ALH, all mitotic NSCs were H4K20me1‐positive (Fig 2C). By contrast, only 11.5% of mitotic NSCs from pr‐set7 mutant contained H4K20me1 (Fig 2C). The remaining H4K20me1 in pr‐set7 mutant might be due to the maternal component, as it was completely lost in the third instar larval stage (Fig EV2D). The loss of H4K20 monomethylation could be well restored upon expression of either UAS‐pr‐set7 under insc‐Gal4 (Fig 2C; H4K20me1 in 86.8% mitotic NSCs) or the genomic pr‐set7‐BAC (Fig 2C; H4K20me1 in 95.2% mitotic NSCs). These data suggest that the H4K20 monomethylation is lost in pr‐set7 mutant larval brains.
Figure EV2. H4K20me1 is lost upon pr‐set7 depletion in the larval brain.
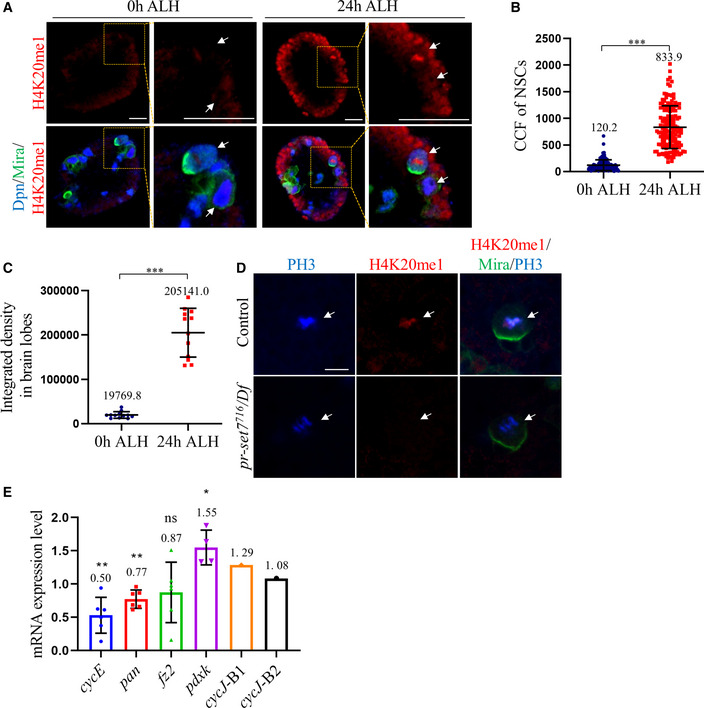
- Larval brains of control (ctrl; yw) at 0 h and 24 h ALH were stained for H4K20me1, Deadpan (Dpn) and Miranda (Mira).
- Quantifications of the corrected total cell fluorescence (CCF) for genotypes in (A). CCF = Integrated Density – (area of selected cell × mean fluorescence of background readings). At 0 h ALH, CCFs were 120.2 ± 100.5 (n = 131, 12 BL). At 24 h ALH, CCFs were 833.9 ± 400.5 (n = 148, 12 BL).
- Quantifications of brain integrated density in (A). At 0 h ALH, integrated density was 19769.8 ± 7383.7 (n = 12 BL). At 24 h ALH, integrated density was 205141.0 ± 55002.6 (n = 12 BL).
- Larval brains of control (ctrl; yw) and pr‐set7716/Df(3R)ED5644 (Df) at 96 h ALH were stained for PH3, H4K20me1, and Mira.
- qPCR analysis of cycE, pan, fz2, pdxk, and cycJ in larval brains of control (ctrl; yw) and pr‐set7716/Df(3R)ED5644 (716/Df) at 24 h ALH. Statistical analyses were performed by comparing between control (GAPDH1, GAPDH2, Tbp1, and Rpl32) and pr‐set7716/Df, using Mann–Whitney test. The mRNA levels of control were normalized to 1. For mRNA levels in pr‐set7716/Df, cycE: 0.50 ± 0.27 (n = 6); pan: 0.77 ± 0.14 (n = 6); fz2: 0.87 ± 0.45 (n = 6); pdxk: 1.55 ± 0.26 (n = 4); cycJ: 1.18 ± 0.14 (n = 2) with two replicates—cycJ‐B1 (first batch): 1.29 and cycJ‐B2 (second batch): 1.08. All replicates are biological.
Data information: Data are presented in (B, C, E) as mean ± SD. n numbers in (B) were total NSCs counted with total brain lobes measured, while each NSC was considered as one biological replicate. White arrows point to NSCs (A, D). Yellow dotted boxes indicate the region of zoomed‐in images (A). Statistical analyses were done comparing between two different genotypes using Mann–Whitney test (B, C, E). ns: non‐significant, *P < 0.05, **P < 0.01, ***P < 0.001 Scale bars, 15 μm (A), 5 μm (D).
Figure EV3. Cdk1 functions downstream of Pr‐set7 and is both necessary and sufficient for NSC reactivation on fed condition.
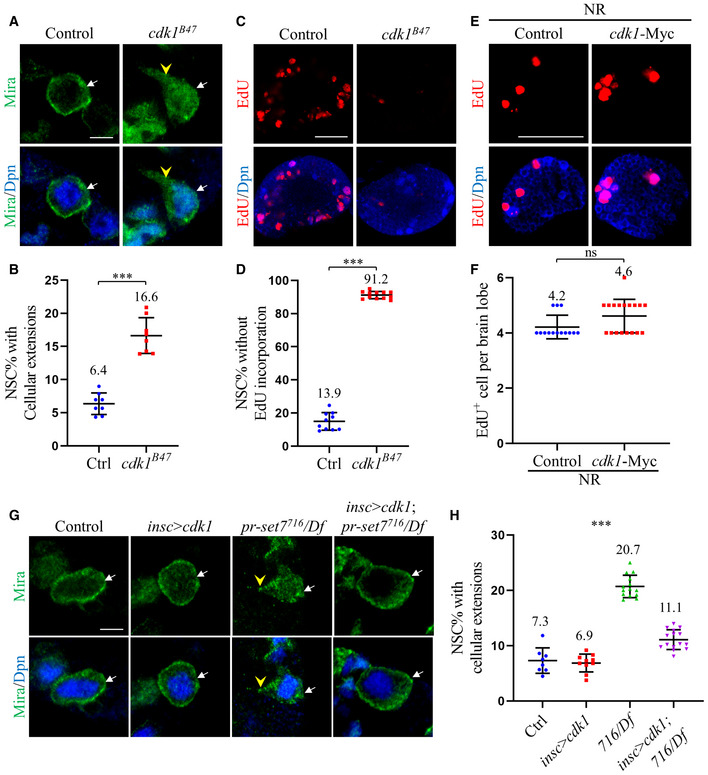
- Larval NSCs of control (ctrl; yw) and cdk1B47 at 24 h ALH were stained for Deadpan (Dpn) and Miranda (Mira).
- Quantifications of cellular extensions in (A). Control: n = 708, 8 BL; cdk1B47: n = 668, 8 BL.
- Larval brains of control (ctrl; yw) and cdk1B47 at 24 h ALH were labeled with Dpn and EdU.
- Quantifications of NSC without EdU incorporation in (C). Control: n = 697, 9 BL; cdk1B47: n = 759, 12 BL.
- Larval brains of control (UAS‐dicer2) and UAS‐cdk1‐Myc under insc‐Gal4 fed with sucrose‐only food (NR) at 24 h ALH were labeled with Dpn and EdU.
- Quantifications of EdU incorporation in (E). Control, 4.2 ± 0.4 (n = 14) EdU+ cells / brain hemisphere at 24 h ALH. cdk1‐Myc, 4.6 ± 0.6 (n = 18) EdU+ cells / brain hemisphere at 24 h ALH.
- Larval brains of control (ctrl; yw), cdk1‐myc overexpression under insc‐Gal4 (insc > cdk1‐myc), pr‐set7716/Df(3R)ED5644 (716/Df), and pr‐set7716/Df with cdk1‐myc induced with insc‐Gal4 at 24 h ALH were stained with Dpn and Mira.
- Quantifications of cellular extensions in (G). n = 735, 8 BL for control; n = 858, 10 BL for insc > cdk1; n = 1154, 14 BL for pr‐set7716/Df and n = 1380, 15 BL for pr‐set7716/Df with cdk1‐Myc induced with insc‐Gal4.
Data information: Data are presented in (B, D, F, H) as mean ± SD. n numbers in (B, D, H) were total NSCs counted with total brain lobes measured, while each brain lobe was considered as one biological replicate. White arrows point to NSCs and yellow arrowheads point to cellular extensions of NSCs (A, G). Statistical analyses were done comparing between two different genotypes using Mann–Whitney test (B, D, F). Statistical analyses were done comparing among different genotypes using ordinary one‐way ANOVA (H). ns: non‐significant; ***P < 0.001. Scale bars, 5 μm (A, G), 30 μm (C, E).
Figure EV4. Ebd1 overexpression partially suppressed NSC reactivation defects in pr‐set7 mutant brains.
-
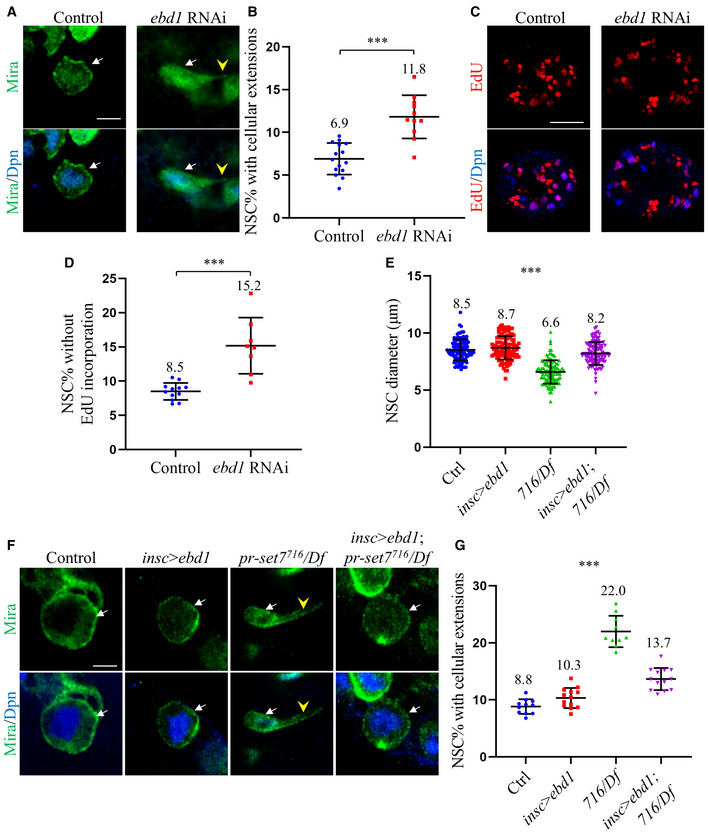
ALarval brains of control (UAS‐dicer2) and ebd1 RNAi (BDSC#35765) under insc‐Gal4 at 24 h ALH were stained for Deadpan (Dpn) and Miranda (Mira).
-
BQuantifications of cellular extensions in (A). Control, 6.9 ± 1.8% (n = 1267, 15 BL) of NSCs showed cellular extensions. ebd1 RNAi, 11.8 ± 2.5% (n = 1039, 11 BL) of NSCs showed cellular extensions.
-
CLarval brains of control (UAS‐dicer2) and ebd1 RNAi (BDSC#35765) under insc‐Gal4 at 24 h ALH were labeled with Dpn and EdU.
-
DQuantifications of NSCs without EdU incorporation for genotypes in (C). Control, 8.5 ± 1.2% (n = 1016, 12 BL); ebd1 RNAi, 15.2 ± 4.1% (n = 683, 8 BL).
-
E, FLarval NSCs of control (ctrl; yw), ebd1 (ebd1‐Flag) overexpression under insc‐Gal4, pr‐set7716/Df(3R)ED5644 (716/Df) and pr‐set7716/Df with ebd1‐Flag induced with insc‐Gal4 at 24 h ALH were stained with Dpn and Mira (F). Quantifications of NSC diameters in (E). Control: n = 109; insc > ebd1: n = 104; pr‐set7716/Df: n = 104 and pr‐set7716/Df with ebd1 induced with insc‐Gal4: n = 114.
-
GQuantifications of cellular extensions in (F). Control: n = 926, 11 BL; insc > ebd1: n = 1089, 13 BL; pr‐set7716/Df: n = 807, 10 BL and pr‐set7716/Df with ebd1 induced with insc‐Gal4: n = 938, 13 BL.
Data information: Data are presented in quantification graphs as mean ± SD (B, D, E, G). n numbers in (B, D, G) were total NSCs counted with total brain lobes measured, while each brain lobe was considered as one biological replicate. White arrows point to NSCs and yellow arrowheads point to cellular extensions of NSCs. Statistical analyses were done comparing two different genotypes using Mann–Whitney test (B, D). Statistical analyses were done comparing among different genotypes using ordinary one‐way ANOVA (E, G). ns: non‐significant; ***P < 0.001. Scale bars, 5 μm (A, F), 30 μm (C).
Figure EV5. Ebd1 is required for NSC reactivation.
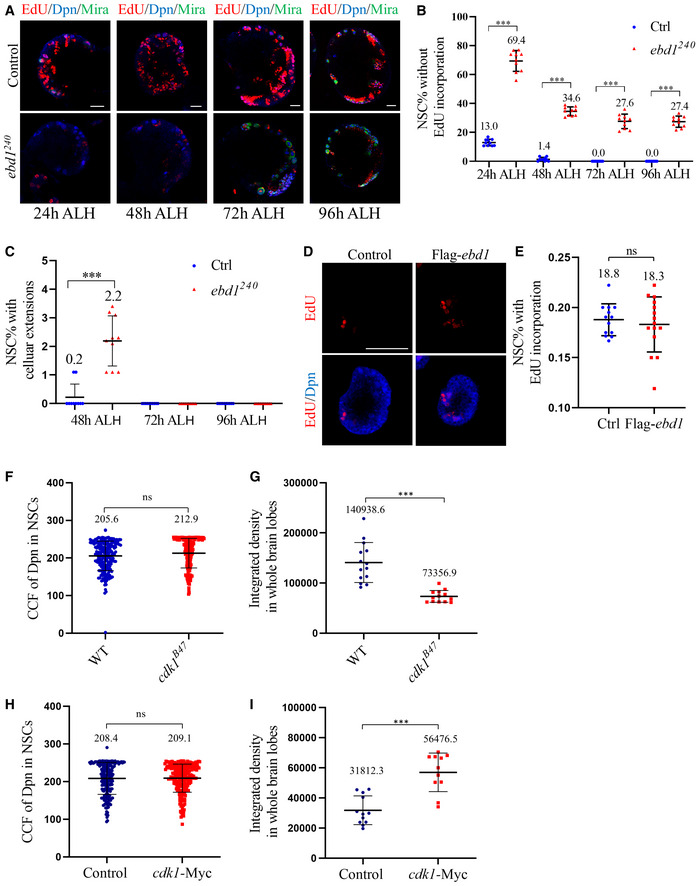
- Larval brains of control (ctrl; yw) and ebd1240 at 24, 48, 72, and 96 h ALH were labeled with Deadpan (Dpn), Miranda (Mira), and EdU.
- Quantifications of EdU incorporation for genotypes in (A). For control, n = 870, 10 BL at 24 h ALH; n = 868, 10 BL at 48 h ALH; n = 872, 10 BL at 72 h ALH and n = 881, 10 BL at 96 h ALH. For ebd1240, n = 808, 10 BL at 24 h ALH; n = 862, 10 BL at 48 h ALH; n = 868, 10 BL at 72 h ALH and n = 872, 10 BL at 96 h ALH.
- Quantifications of EdU incorporation for genotypes in (A) at 48, 72 and 96 h ALH. For control, n = 917, 10 BL at 48 h ALH; n = 970, 10 BL at 72 h ALH and n = 980, 10 BL at 96 h ALH. For ebd1240, n = 918, 10 BL at 48 h ALH; n = 983, 10 BL at 72 h ALH and n = 973, 10 BL at 96 h ALH.
- Larval brains of control (ctrl; UAS‐dicer2) and UAS‐Flag‐ebd1 under insc‐Gal4 at 6 h ALH were labeled for EdU and Dpn.
- Quantifications of EdU incorporation in (D). 18.8 ± 1.6% (n = 517, 13 BL) of control NSCs incorporated EdU, 18.3 ± 2.7% (n = 572, 15 BL) of NSCs with ebd1 overexpression were EdU+.
- Quantifications of the corrected total cell fluorescence (CCF) of Deadpan (Dpn) in genotypes in Fig 6A. CCF = Integrated Density ‐ (Area of selected cell × Mean fluorescence of background readings). CCFs were 205.6 ± 39.1 for control (ctrl; yw; n = 212, 14 BL) and 212.9 ± 39.4 for cdk1B47 (n = 216, 13 BL).
- Quantifications of the integrated density in whole‐brain lobes of Earthbound1 (Ebd1) in genotypes in Fig 6A. Integrated density in whole‐brain lobes were 140938.6 ± 39927.0 for control (n = 14 BL) and 73356.9 ± 11812.3 for cdk1B47 (n = 13 BL).
- Quantifications of the CCF of Dpn in genotypes in Fig 6C. CCFs were 208.4 ± 42.3 for control (n = 213, 12 BL) and 209.1 ± 37.4 for cdk1‐Myc (n = 230, 12 BL).
- Quantifications of the integrated density in whole‐brain lobes of Ebd1 in genotypes in Fig 6C. Integrated density in whole‐brain lobes were 31812.3 ± 9535.1 for control (n = 12 BL) and 56476.5 ± 12799.9 for cdk1‐Myc (n = 12 BL).
Data information: Data are presented in (B, C, E, F, G, H, I) as mean ± SD. n numbers in (B, C, E, F, H) were total NSCs counted with total brain lobes measured. In B, C, E, each brain lobe was considered as one biological replicate. In F, H, each NSC was considered as one biological replicate. Statistical analyses were done comparing between two different genotypes using Mann–Whitney test (B, C, E) or two‐tailed Student's t‐test (F, G, H, I). ns: non‐significant; ***P < 0.001. Scale bars, 15 μm (A), 30 μm (D).
Pr‐set7 is required for the reactivation of both G0‐ and G2‐arrested quiescent NSCs
Drosophila quiescent NSCs arrest in either G0 or G2 quiescent states (Otsuki & Brand, 2018). To explore which population of quiescent NSCs requires Pr‐set7’s function in reactivation, we took the advantage of the fly‐FUCCI system, a dual‐color fluorescent reporter (UAS‐GFP.E2f1.1‐230, UAS‐mRFP1.CycB.1‐266; BDSC#55117) for cell cycle stages (Zielke et al, 2014; Fig 2D). Quiescent NSCs were marked by nuclear Prospero (Pros), as transient Pros expression induces NSC quiescence (Lai & Doe, 2014). G2 quiescent NSCs were positive for GFP, RFP, and nuclear Pros, while G0 quiescent NSCs were marked by GFP and nuclear Pros (Fig 2E). At 24 h ALH, the proportion of G0 and G2 quiescent NSCs in pr‐set7 mutant closely resembled the distribution in control FUCCI brains (Fig 2F), suggesting that the reactivation of both G0 and G2 quiescent NSCs was similarly affected upon loss of pr‐set7. Therefore, we conclude that Pr‐set7 is likely required for the reactivation of both G0 and G2 quiescent NSCs.
Pr‐set7 binds to cdk1 and ebd1 in NSCs in TaDa in vivo profiling
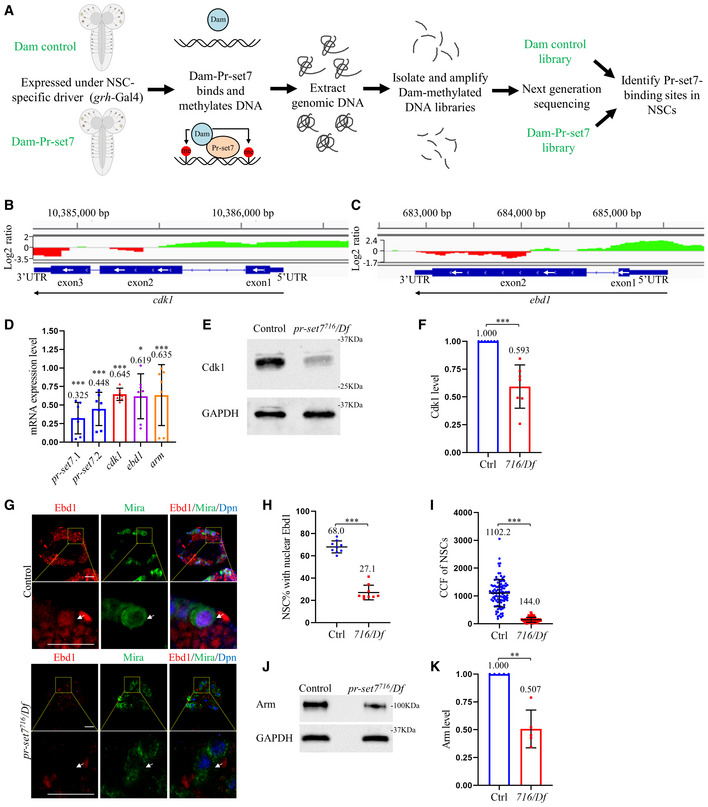
To identify the potential targets of Pr‐set7 in NSCs during reactivation, we performed targeted DNA adenine methyltransferase (Dam) identification (TaDa). TaDa enables cell type‐specific profiling of transcriptome and chromatin binding (Southall et al, 2013). We generated transgenic Dam‐Pr‐set7 and expressed it or Dam alone (as a control) in NSCs under grh‐Gal4 at 24 h ALH. Samples were subjected to next‐generation sequencing (NGS) and bioinformatics analysis (Fig 3A). From two replicates of the DamID analysis, we have identified 7157 binding peaks (with peak score > 50) of Pr‐set7 (Dataset EV1). Wnt pathway co‐activator earthbound1 (ebd1) was identified among top candidates based on peak scores and cdk1 was the top candidate among cyclin‐dependent kinase (CDKs) and cyclins (Fig 3B, C, Appendix Table S1). Based on TaDa profiling, Pr‐set7 binds to the promoter and transcriptional start site of both ebd1 and cdk1, suggesting that Pr‐set7 may positively regulate their gene expression in NSCs (Fig 3B and C). GO analysis on DamID data also suggested that these potential targets were enriched for genes regulating various biological processes and nervous system development (Appendix Table S2).
Figure 3. cdk1 and ebd1 are identified as potential targets of Pr‐set7 in NSC‐specific TaDa in vivo profiling.
-
AA schematic representation of the TaDa analysis performed in Drosophila NSCs.
-
B, CThe binding profile of Pr‐set7 on cdk1 gene region (B) and ebd1 gene region (C) in NSCs. The green peaks represent positive binding and red means no binding, which are based on the log2 ratio between Dam‐Pr‐set7 and Dam control (Y‐axis).
-
DqPCR analysis of pr‐set7, cdk1, ebd1, and arm in larval brains of control (ctrl; yw) and pr‐set7716/Df(3R)ED5644 (716/Df) at 24 h ALH. n = 7 as biological replicates. Statistical analyses were done comparing between control (GAPDH1, GAPDH2, Tbp1, and Rpl32) and pr‐set7716/Df, using Mann–Whitney test. The mRNA levels of control were normalized to 1. Data are presented as mean ± SD calculated from all replicates.
-
EWestern blot analysis of larval brain extracts of control (ctrl; yw) and pr‐set7716/Df at 24 h ALH. Blots were probed with anti‐Cdk1 antibody and anti‐GAPDH1 antibody (loading control).
-
FQuantification of normalized Cdk1 intensity against GAPDH in (E). n = 7 as biological replicates.
-
GLarval NSCs of control (ctrl; yw) and pr‐set7716/Df at 24 h ALH were stained for Ebd1, Dpn, and Mira. Yellow dotted boxes, zoomed‐in area. White arrows point to NSCs.
-
H, IQuantifications of nuclear Ebd1 (H) and the corrected total cell fluorescence (CCF) (I) in genotypes in (G). In (H), n = 756, 9 BL for control; n = 765, 9 BL for pr‐set7716/Df. In (I), CCF = Integrated Density – (Area of selected cell × Mean fluorescence of background readings). CCFs were 1102.2 ± 493.2 (n = 99) for control (ctrl; yw) and 144.0 ± 88.0 (n = 98) for 716/Df.
-
JWestern blot analysis of larval brain extracts of control (ctrl; yw) and pr‐set7716/Df at 24 h ALH. Blots were probed with anti‐Arm antibody or anti‐GAPDH1 antibody (loading control).
-
KQuantification of normalized Arm levels against GAPDH in (J). n = 5 as biological replicates.
Data information: Data are presented in (D, F, H, I, K) as mean ± SD. n numbers in (H) were total NSCs counted with total brain lobes measured, while each brain lobe was considered as one biological replicate. Statistical analyses were done comparing two different genotypes using Mann–Whitney test (D, F, H, I, K). *P < 0.05, **P < 0.01, and ***P < 0.001. Scale bars, 15 μm (G).
Source data are available online for this figure.
Pr‐Set7 is required for the expression of ebd1 and cdk1 in the larval brain
To further validate the DamID results that ebd1 and cdk1 are bound by Pr‐set7, we assessed the mRNA level of ebd1 and cdk1 in pr‐set7 larvae brains. At 24 h ALH, the mRNA levels of pr‐set7 in pr‐set7 mutant brains were decreased to 32.5 ± 21.2% and 44.8 ± 22.3% measured by two different pairs of primers, compared with control brains (Fig 3D). This result suggested an efficient depletion of pr‐set7 in the mutants. Interestingly, at 24 h ALH, the mRNA level of cdk1 in pr‐set7 mutant brains was significantly decreased to 64.5 ± 8.3%, compared with the control (Fig 3D). Next, we examined Cdk1 protein levels in whole‐brain protein extracts by Western blot. Remarkably, Cdk1 protein levels were decreased significantly to 59.3 ± 19.5% in pr‐set7 mutant larval brains, compared with the control brains at 24 h ALH (Fig 3E and F). Taken together, Pr‐set7 binds to cdk1 promoter region and promotes its expression in NSCs.
Similarly, at 24 h ALH, the mRNA level of ebd1 in the pr‐set7 mutant was significantly decreased to 61.9 ± 30.3% of the control (Fig 3D). At 24 h ALH, Ebd1 protein was detected in the nucleus of control NSCs during interphase (Fig 3G–I; 68.0 ± 5.4%). This is consistent with the nuclear localization of Ebd1 in neurons (Benchabane et al, 2011). However, Ebd1 protein in central brains upon pr‐set7 depletion was nearly absent at 24 h ALH, with only 27.1 ± 6.6% of them showed weak nuclear Ebd1 (Fig 3G–I). Ebd1 promotes interaction between the Wnt/Wingless pathway co‐activators β‐catenin/Armadillo (Arm) and T‐cell factor (TCF) and recruitment of β‐catenin to chromatin (Benchabane et al, 2011). Interestingly, in the pr‐set7 mutant, mRNA of arm was reduced to 63.5 ± 44.1% of control at 24 h ALH in the whole larval brain (Fig 3D). Similarly, the protein level of Arm was also significantly decreased to 50.7 ± 17.0% of control at 24 h ALH in whole larval brain extracts (Fig 3J and K). These observations suggest that Pr‐set7 may promote Ebd1 expression to activate Wnt/Wingless signaling.
As H4K20me1 correlates with both gene expression and repression, we wondered whether Pr‐set7 could both promote and repress gene expression. We surveyed a few genes including cyclin E (cycE), pangolin (pan), frizzle 2 (fz2), and pyridoxal kinase (pdxk), and examined the changes of their transcript level in the pr‐set7 mutant brain by qPCR. CycE is not a target of Pr‐set7 in DamID and was selected as it is a cell‐cycle gene. Pan and Fz2 are Wnt signaling components (Brunner et al, 1997; Swarup & Verheyen, 2012). Pan is identified as a potential target of Pr‐set7 in DamID in this study (Appendix Table S1), while fz2 is not. The Pan mammalian homology, Lef‐1/Tcf7 is upregulated by Pr‐set7 in mammalian cells (Li et al, 2011). Pyridoxal kinase (pdxk) was identified as potential Pr‐set7 targets in Drosophila in our DamID analysis (Appendix Table S1), while mammalian pdxk is downregulated by Pr‐set7 in mammalian systems (Congdon et al, 2010). We found that in pr‐set7 mutant brains at 24 h ALH, the mRNA levels of cycE and pan were downregulated, while pdxk was upregulated, compared to the control (Fig EV2E). The mRNA level of fz2 and cyclinJ (cycJ), which were not targets of Pr‐set7 in DamID, had no significant change in pr‐set7 mutant brains (Fig EV2E). Therefore, Pr‐set7 could activate and repress different genes and should not be considered as a sole activator or repressor.
Cdk1 is both necessary and sufficient to promote NSC reactivation on fed condition
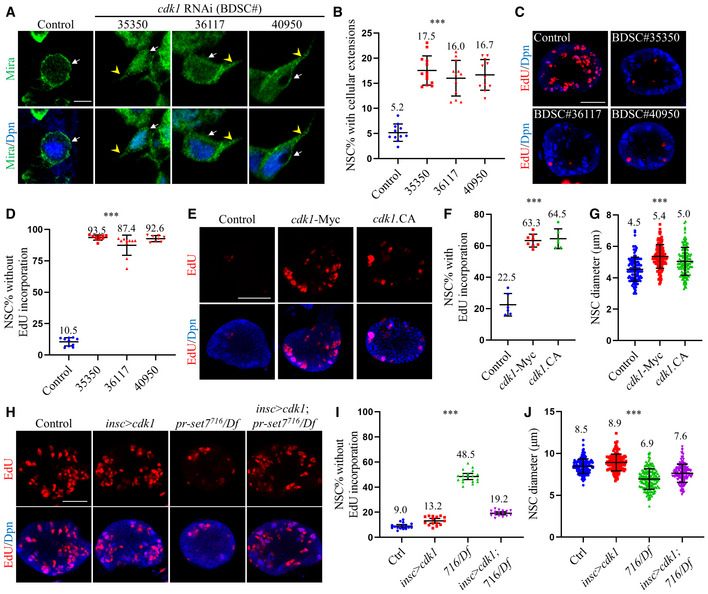
Given that Pr‐set7 promotes the expression of Cdk1 in NSCs, we investigated the role of Cdk1 during NSC reactivation. At 24 h ALH at 29°C, control NSCs were mostly reactivated; Only 5.2 ± 1.7% of them showed cellular process (Fig 4A and B) and 10.5 ± 3.3% of NSCs lacked EdU incorporation (Fig 4C and D). By contrast, in cdk1 RNAi knockdown (BDSC#35350) brains at the same condition, 17.5 ± 2.9% of NSCs showed cellular processes (Fig 4A and B) and 93.5 ± 2.1% of NSCs failed to incorporate EdU (Fig 4C and D). Two other cdk1 RNAi lines (BDSC#36117 and BDSC#40950) showed similar defects of NSC reactivation, as indicated by the significant increase in the number of NSCs retaining cellular extension, concomitant with a dramatic decrease of the number of EdU‐positive NSCs (Fig 4C and D). Next, we examined cdk1B47, an amorphic allele that contains a point mutation at the splice donor site of 5' end of first intron (Clegg et al, 1993). In control brains at 24 h ALH, most NSCs are reactivated with only 6.4 ± 1.6% showed cellular process (Fig EV3A and B). In comparison, 16.6 ± 2.7% of cdk1B47 mutant NSC exhibited cellular extension (Fig EV3A and B). Remarkably, 91.2 ± 2.2% of cdk1B47 mutant NSCs failed to incorporate EdU, compared with 13.9 ± 4.4% of control NSCs (Fig EV3C and D). These observations indicate that Cdk1 is intrinsically required for NSC reactivation.
Figure 4. Cdk1 functions downstream of Pr‐set7 and is both necessary and sufficient for NSC reactivation on fed condition.
-
ALarval brains of control and cdk1 RNAi (BDSC#35350, #36117, and #40950) under insc‐Gal4 at 24 h ALH were stained for Deadpan (Dpn) and Miranda (Mira).
-
BQuantifications of cellular extensions for genotypes in (A). Control: n = 942, 11 BL; BDSC#35350: n = 1056, 13 BL; BDSC#36117: 16.0 ± 3.5% (n = 1059, 12 BL); BDSC#40950: 16.7 ± 3.1% (n = 933, 11 BL).
-
CLarval brains of control and cdk1 RNAi (BDSC#35350, #36117, and #40950) under insc‐Gal4 at 24 h ALH were labeled with Dpn and EdU.
-
DQuantifications of NSCs without EdU incorporation for genotypes in (C). Control: n = 849, 10 BL; BDSC#35350: n = 741, 10 BL; BDSC#36117: 87.4 ± 8.0% (n = 697, 10 BL); BDSC#40950: 92.6 ± 2.4% (n = 621, 8 BL).
-
ELarval brains of control, UAS‐cdk1‐Myc, and UASp‐ cdk1.T14A.Y15F.VFP (cdk1.CA) under insc‐Gal4 at 6 h ALH were labeled with Dpn and EdU.
-
F, GQuantifications of EdU incorporation (F) and NSC diameters (G) for genotypes in (E). In (F), n = 345, 6 BL for control; n = 524, 8 BL for cdk1‐Myc and n = 280, 6 BL for cdk1.CA. In (G), n = 123 for control; n = 135 for cdk1‐Myc and n = 137 for cdk1.CA.
-
HLarval brains of control (ctrl; yw), cdk1‐Myc overexpression under insc‐Gal4, pr‐set7716/Df(3R)ED5644 (716/Df), and pr‐set7716/Df with cdk1‐Myc induced with insc‐Gal4 at 24 h ALH were labeled with Dpn and EdU.
-
I, JQuantifications of EdU incorporation (I) and NSC diameters (J) for genotypes in (H). In (I), n = 1334, 16 BL for control; n = 1299, 15 BL for insc > cdk1; n = 1221, 18 BL for pr‐set7716/Df and n = 1372, 16 BL for pr‐set7716/Df with cdk1‐Myc induced with insc‐Gal4. In (J), n = 153 for control; n = 152 for insc > cdk1; n = 156 for pr‐set7716/Df and n = 159 for pr‐set7716/Df with cdk1‐Myc induced with insc‐Gal4.
Data information: Data were presented in quantification graphs as mean ± SD (B, D, F, G, I, J). n numbers in (B, D, F, I) were total NSCs counted with total brain lobes measured, while each brain lobe was considered as one biological replicate. White arrows point to NSCs and yellow arrowheads point to cellular extensions of NSCs (A). Statistical analyses were done comparing among different genotypes using ordinary one‐way ANOVA (B, D, F, G, I, J). ***P < 0.001. Scale bars, 5 μm (A), 30 μm (C, E, H). Control: insc‐Gal4/+ UAS‐dicer2 in (A–G).
To test whether Cdk1 overexpression is sufficient to trigger NSC reactivation, we overexpressed cdk1‐Myc in NSCs under the control of insc‐Gal4. At 6 h ALH, most control NSCs remained in quiescence and only 22.5 ± 7.2% of NSCs incorporated EdU (Fig 4E and F). NSC diameter was 4.5 ± 0.8 µm at this stage (Fig 4G). By contrast, 63.3 ± 4.1% of NSCs incorporated EdU upon cdk1 overexpression (Fig 4E and F) and NSC diameter was increased significantly to 5.4 ± 0.7 µm (Fig 4G). Cdk1 is negatively regulated by Wee1 and Myt1 via phosphorylation on residues T14 and Y15 (Ayeni et al, 2014). Upon overexpression of Cdk1.T14A.Y15F, an active form of Cdk1 that is unable to be phosphorylated by Wee1 and Myt1, under insc‐Gal4, 64.5 ± 6.3% of NSCs (Fig 4E and F) incorporated EdU and the NSC diameter was increased to 5.0 ± 0.9 µm (Fig 4G). These results suggest that Cdk1 overexpression leads to premature NSC reactivation. However, in the absence of dietary amino acids (sucrose‐only food), Cdk1 overexpression did not have any effect on reactivation (Fig EV3E and F). Taken together, Cdk1 is both necessary and sufficient for NSC reactivation in the presence of dietary amino acids.
Cdk1 overexpression significantly suppresses NSC reactivation defects observed in pr‐set7 mutants
We investigated whether Cdk1 overexpression could suppress NSC quiescence phenotype in pr‐set7 mutant brains. At 24 h ALH, most of control NSCs were reactivated (Fig 4H and I; 9.0 ± 2.4% NSCs without EdU incorporation; Fig EV3G and H; 7.3 ± 2.3% NSCs retain cellular extensions). At 24 h ALH, Cdk1‐Myc overexpression behaved similarly to control with only 13.2 ± 3.4% EdU‐negative NSCs (Fig 4H and I) and 6.9 ± 1.6% retaining cellular extensions (Fig EV3G and H). In pr‐set7 mutant brains, 48.5 ± 4.8% NSCs failed to incorporate EdU (Fig 4H and I) and 20.7 ± 2.0% NSCs retained cellular extensions (Fig EV3G and H). By contrast, in pr‐set7 NSCs with Cdk1 overexpression, only 19.2 ± 2.3% of NSCs did not incorporate EdU (Fig 4H and I) and the percentage of NSCs with cellular extensions was decreased to 11.1 ± 1.8% (Fig EV3G and H). The cell growth defect of pr‐set7 NSCs was also partially suppressed by Cdk1 overexpression, as the diameter was increased to 7.6 ± 1.1 µm (Fig 4J), which is significantly greater than 6.9 ± 1.2 µm (Fig 4J) in the pr‐set7 mutant, but smaller than 8.5 ± 0.9 µm (Fig 4J) and 8.9 ± 1.0 µm (Fig 4J) in control or Cdk1 overexpression alone. This significant suppression strongly supports our conclusion that Pr‐set7 promotes NSC reactivation primarily through upregulating Cdk1 expression.
Wingless pathway transcriptional co‐activator Ebd1 is required for NSC reactivation
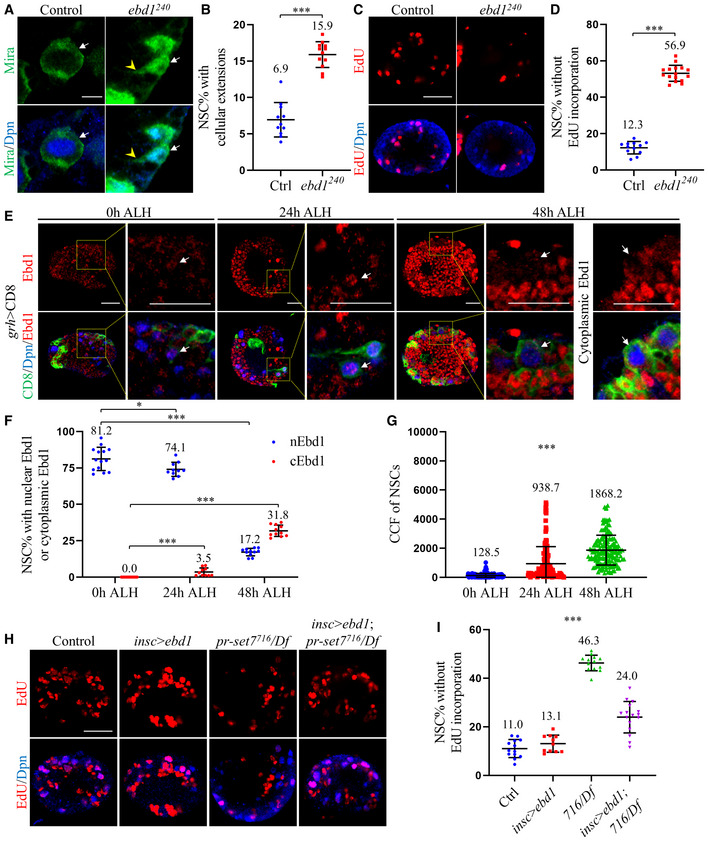
Next, we sought to investigate the function of Ebd1 during NSC reactivation. ebd1240 is a loss‐of‐function allele containing a 2,925 base pair (bp) deletion by a P‐element imprecise excision that removes the N‐terminal (308–3232 bp) part of the gene (Benchabane et al, 2011). At 24 h ALH, most control NSCs were reactivated, with only 6.9 ± 2.4% of them showed cellular extension (Fig 5A and B). In comparison, 15.9 ± 1.8% of ebd1240 NSCs displayed cellular extension (Fig 5A and B). Consistent with this observation, 12.3 ± 3.4% of control NSCs lacked EdU incorporation at 24 h ALH (Fig 5C and D), while 56.9 ± 3.8% of ebd1240 NSCs failed to incorporate EdU (Fig 5C and D). The function of Ebd1 in NSC reactivation was confirmed using ebd1 RNAi knockdown (BDSC#35765) under the insc‐Gal4 driver (Fig EV4A and D). Taken together, these observations indicate that Wnt signaling co‐activator Ebd1 promotes Drosophila NSC reactivation.
Figure 5. Ebd1 promotes NSC reactivation and its overexpression suppresses NSC reactivation defects in pr‐set7 mutants.
-
ALarval NSCs of control (ctrl; yw) and ebd1240 at 24 h ALH were stained for Deadpan (Dpn) and Miranda (Mira).
-
BQuantifications of cellular extensions for genotypes in (A). Control: n = 886, 11 BL; ebd1240: n = 864, 12 BL.
-
CLarval brains of control (ctrl; yw) and ebd1240 at 24 h ALH were labeled with Dpn and EdU.
-
DQuantifications of NSC without EdU incorporation for genotypes in (C). Control: n = 1034, 12 BL; ebd1240: n = 1139, 16 BL.
-
ELarval NSCs of grainyhead (grh) > CD8‐GFP at 0, 24, and 48 h ALH were stained for CD8, Dpn, and Ebd1. Yellow dotted boxes indicate the region of zoomed‐in images.
-
F, GQuantifications of nuclear/cytoplasmic Ebd1 (F) and the corrected total cell fluorescence (CCF) of Ebd1 in NSCs (G) for genotypes in (E). In (F), n = 1044, 14 BL at 0 h ALH; n = 712, 10 BL at 24 h ALH and n = 1122, 11 BL. In (G), CCF = Integrated Density – (area of selected cell × mean fluorescence of background readings). For CCFs of Ebd1, 128.5 ± 140.7 (n = 162) at 0 h ALH, 938.7 ± 1176.8 (n = 150) at 24 h ALH and 1868.2 ± 1025.1 (n = 161) at 48 h ALH.
-
HLarval brains of control (ctrl; yw), ebd1‐Flag overexpression under insc‐Gal4, pr‐set7716/Df(3R)ED5644 (716/Df) and pr‐set7716/Df with ebd1 induced with insc‐Gal4 at 24 h ALH were labeled with Dpn and EdU.
-
IQuantifications of NSCs without EdU incorporation for larval brains in (H). Control: n = 1162, 13 BL; insc > ebd1: n = 997, 11 BL; pr‐set7716/Df: n = 928, 13 BL and pr‐set7716/Df with ebd1 induced with insc‐Gal4: n = 1284, 16 BL.
Data information: Data are presented in (B, D, F, G, I) as mean ± SD. n numbers in (B, D, F, I) were total NSCs counted with total brain lobes measured, while each brain lobe was considered as one biological replicate. White arrows point to NSCs and yellow arrowheads point to cellular extensions of NSCs (A, E). Statistical analyses were done comparing two different genotypes using Mann–Whitney test (B, D, F). For F, statistical analyses were done comparing the percentage at later time points with the ones at 0 h ALH. Statistical analyses were done comparing among different genotypes using ordinary one‐way ANOVA (G, I). ns: non‐significant; *P < 0.05; ***P < 0.001. Scale bars, 5 μm (A), 15 μm (E), 30 μm (C, H).
In order to investigate whether Ebd1 in the NSC is only required for NSC reactivation or maintenance of NSC proliferation status, we performed a time‐course analysis of ebd1240 mutant and examined cellular protrusion of quiescent NSCs. At 48 h ALH, almost all control NSCs were reactivated, with only 0.2 ± 0.5% of them still showed cellular extensions (Fig EV5C). Similarly, only 2.2 ± 0.9% of ebd1240 NSCs still retained cellular extensions at the same time (Fig EV5C). At later time points (72 h and 96 h ALH), all control and ebd1240 NSCs lost their cellular extensions (Fig EV5C). These data suggest that Ebd1 is important for NSC reactivation, but not for preventing NSCs from re‐entering into quiescence at later larval stages. We next examined the EdU incorporation in a time‐course study. At 24 h ALH, only 13.0 ± 2.2% (Fig EV5A and B) of control NSCs lacked EdU incorporation. By contrast, 69.4 ± 7.2% (Fig EV5A and B) of ebd1240 NSCs failed to incorporate EdU at the same time. This observation suggests that NSC reactivation is defective in ebd1240 at early larval stages. At 48 h ALH, most of the control NSCs were reactivated, with only 1.4 ± 1.3% (Fig EV5A and B) of them failed to incorporate EdU. In comparison, for ebd1240 NSCs, 34.6 ± 3.0% of them still failed to incorporate EdU. At later time points, all control NSCs were reactivated with EdU incorporation at 72 h ALH and 96 h ALH (Fig EV5A and B). In contrast, in ebd1240 brains, 27.6 ± 5.0% at 72 h ALH and 27.4 ± 3.9% at 96 h ALH of NSCs failed to incorporate EdU (Fig EV5A and B). These observations suggested that NSCs in the ebd1 mutant were not fully reactivated. Moreover, ebd1 overexpression under insc‐Gal4 at 6 h ALH at 29°C was insufficient to trigger precocious cell cycle re‐entry (Fig EV5D and E).
Ebd1 is transiently localized to the nucleus of quiescent and reactivating NSCs
As Ebd1 is required for NSC reactivation, we sought to examine the level of Ebd1 in the larval brain in a time‐course analysis. Ebd1 was reported to localize in the nucleus of neurons (Benchabane et al, 2011), but its localization pattern in NSCs was unknown. Although the overall level of Ebd1 in the brain was low at 0 h and 24 h ALH, Ebd1 was observed primarily in the nucleus of NSCs (Fig 5E and F; 81.2 ± 8.0% at 0 h ALH; 74.1 ± 4.9% at 24 h ALH). At 48 h ALH, nuclear Ebd1 was only observed in 17.2 ± 2.6% of NSCs and was highly expressed in neurons (Fig 5E and F). Concomitantly, cytoplasmic Ebd1 increased over developmental time; it was nearly undetectable in NSCs at 0 h ALH (0%) and 24 h ALH (3.5 ± 2.8%) and was observed in 31.8 ± 3.9% of NSCs at 48 h ALH. In contrast to decreased nuclear Ebd1 in NSCs, the overall level of Ebd1 in NSCs still increased from 0 h ALH to 48 h ALH (Fig 5E and G). Our observations suggest that nuclear Ebd1 is transiently detected in the nucleus of quiescent and reactivating NSCs and lost following NSC reactivation.
Ebd1 overexpression significantly suppresses NSC reactivation defects observed upon loss of pr‐set7
Given that Ebd1 is required for NSC reactivation, we investigated whether Ebd1 overexpression could suppress NSC reactivation defects observed in pr‐set7 mutant brains. At 24 h ALH, vast majority of control NSCs and Flag‐Ebd1 overexpressing NSCs were reactivated, with only 11.0 ± 3.7% and 13.1 ± 3.5% lacked EdU incorporation (Fig 5H and I). In pr‐set7 mutant, NSC reactivation defects were evident, as 46.3 ± 3.2% (Fig 5H and I) NSCs failed to incorporate EdU. By contrast, in pr‐set7 NSCs with Ebd1 overexpression, the percentages of EdU‐negative NSCs were decreased significantly to 24.0 ± 6.5% (Fig 5H and I). In addition, at 24 h ALH in pr‐set7 mutant with Ebd1 overexpression, NSCs retaining cellular protrusion was significantly decreased to 13.7 ± 1.9%, compared with 22.0 ± 2.8% of NSCs in pr‐set7 (Fig EV4F and G). The rescue was partial, as there were only 8.8 ± 1.3% and 10.3 ± 1.8% of NSCs in control and Ebd1 overexpressing brains retaining cellular extensions at the same condition (Fig EV4F and G). Similar to Cdk1 overexpression, Ebd1 overexpression could partially suppress the cell growth defect of pr‐set7 NSCs. The diameter of pr‐set7 mutant NSCs was 6.6 ± 1.0 µm at 24 h ALH (Fig EV4E). In comparison, the diameter of pr‐set7 NSCs with Ebd1 overexpression was significantly increased to 8.2 ± 1.0 µm (Fig EV4E), very close to the size of control (Fig EV4E; 8.5 ± 0.9 µm) and Ebd1 overexpression alone (Fig EV4E; 8.7 ± 1.0 µm). Taken together, we conclude that Pr‐set7 promotes the expression of Wingless pathway transcriptional co‐activator Ebd1 to facilitate NSC reactivation.
Reciprocal regulations between Cdk1 and Ebd1 in NSCs
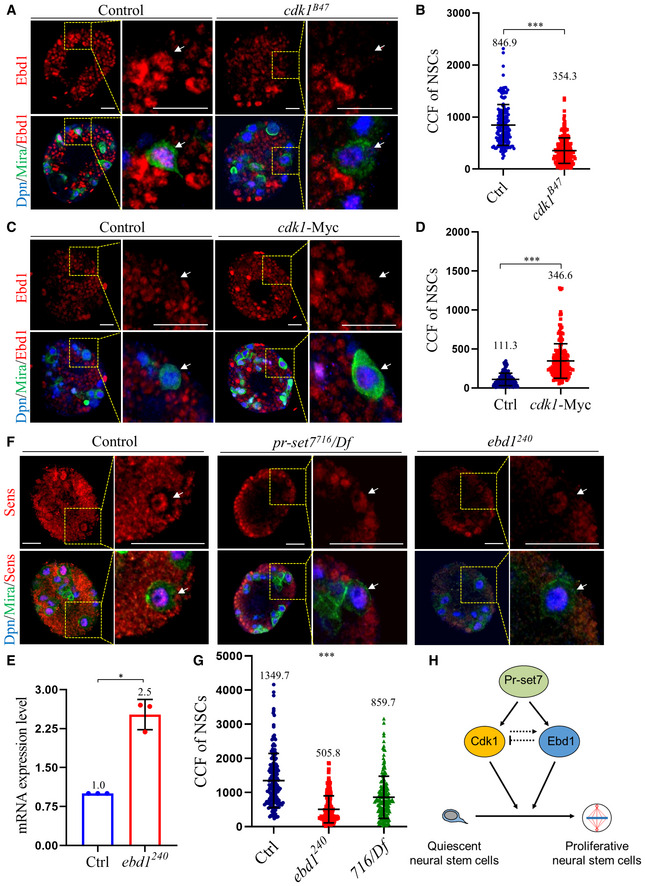
To probe the possible interaction between Ebd1 and Cdk1 during NSC reactivation, we first examined whether Cdk1 regulates Ebd1 in NSCs. When cdk1B47 was depleted, Ebd1 levels in NSCs, as detected by immunostaining, were significantly decreased, compared with that of control NSCs at 24 h ALH (Fig 6A and B). There were no significant changes in the fluorescence intensity of nuclear Dpn, an internal control, in NSCs between the control and the cdk1 B47 mutant (Fig EV5F). The Ebd1 level in the whole larval brain was also significantly decreased in cdk1B47 (Fig EV5G), but not as dramatic as the changes of Ebd1 in NSCs. Next, we examined the levels of Ebd1 upon Cdk1 overexpression in NSCs. At 6 h ALH at 29°C, Ebd1 levels, but not nuclear Dpn, were significantly increased in NSCs and whole brains when cdk1 was overexpressed under insc‐Gal4, as compared with control at the same condition (Fig 6C and D; Fig EV5H and I). Taken together, these results suggest that Cdk1 upregulates Ebd1 levels in NSCs in early larval stages.
Figure 6. A reciprocal regulation between Cdk1 and Ebd1 during NSC reactivation.
-
ALarval NSCs of control (ctrl; yw) and cdk1B47 at 24 h ALH were labeled for Earthbound1 (Ebd1), Deadpan (Dpn), and Miranda (Mira).
-
BQuantifications of the corrected total cell fluorescence (CCF) of Ebd1 in genotypes in (A). CCF = Integrated Density – (Area of selected cell × Mean fluorescence of background readings). CCFs were 846.9 ± 394.2 for control (ctrl; yw; n = 167, 14 BL) and 354.3 ± 245.3 for cdk1B47 (n = 211, 13 BL).
-
C, DLarval NSCs of control (UAS‐dicer2) and UAS‐cdk1‐Myc induced with insc‐Gal4 at 6 h ALH were labeled for Ebd1, Dpn, and Mira. (D) Quantifications of the CCF of Ebd1 in genotypes in (C). CCFs were 111.3 ± 80.2 for control (n = 157, 12 BL) and 346.6 ± 221.1 for cdk1‐Myc (n = 181, 12 BL).
-
EqPCR analysis of cdk1 in larval brains of control (ctrl; yw) and ebd1240 at 24 h ALH. n = 3 as biological replicates. Statistical analyses were done comparing control (GAPDH1, GAPDH2, Tbp1 and Rpl32) and ebd1240, using two‐tailed Student's t‐test. The mRNA levels of control were normalized to 1.
-
F, GLarval NSCs of control (ctrl; yw), ebd1240 and pr‐set7716/Df(3R)ED5644 (716/Df) at 24 h ALH were stained for Senseless (Sens), Dpn, and Mira. (F) Quantifications of the CCF in genotypes in (G). CCFs were 1349.7 ± 792.5 for control (n = 166, 13 BL), 505.8 ± 395.9 for ebd1240 (n = 206, 14 BL), and 859.7 ± 619.0 for 716/Df (n = 174, 13 BL).
-
HA working model. Pr‐Set7 promotes NSC reactivation by positively regulating Cdk1 and Wingless pathway transcriptional co‐activator Ebd1 in NSCs. Cdk1 upregulates Ebd1 in NSCs, while Ebd1 may maintain an equilibrium of Cdk1 level during reactivation.
Data information: Data are presented in (B, D, E, G) as mean ± SD. n numbers in (B, D, G) were total NSCs counted with total brain lobes measured, while each NSC was considered as one biological replicate. White arrows point to NSCs (A, C, F). Yellow dotted boxes indicate the region of zoomed‐in images (A, C, F). Statistical analyses were done comparing between two different genotypes using Mann–Whitney test (B, D) and two‐tailed Student's t‐test (E). Statistical analyses were done comparing among different genotypes using ordinary one‐way ANOVA (G). *P < 0.05; ***P < 0.001. Scale bars, 15 μm (A, C, F).
We then investigated whether Ebd1 potentially regulates Cdk1 in NSCs. As anti‐Cdk1 antibodies did not work for immunofluorescence in the larval brain, we examined the mRNA level of cdk1 upon ebd1 depletion by qPCR. Surprisingly, upon ebd1 depletion in ebd1 240, cdk1 mRNA was upregulated to 250 ± 30% in ebd1 240 brains (Fig 6E). Therefore, Cdk1 and Ebd1 might regulate each other in a negative feedback loop to maintain an equilibrium of Cdk1 and Ebd1 levels during NSC reactivation.
In order to further investigate how the Wingless/Wnt pathway is affected upon loss of pr‐set7 or cdk1, we examined the expression of Senseless (Sens) in pr‐set7 and cdk1 mutants. Sens is a downstream target of the wingless/Wnt pathway (Baig‐Lewis et al, 2007; Swarup & Verheyen, 2012), and therefore, it was used as an indicator of Wnt pathway activity. At 24 h ALH, the levels of Sens in NSCs of ebd1240 (Fig 6F and G) and pr‐set7716/Df (Fig 6F and G) were significantly lower than that of control NSCs. This further indicates that loss of pr‐set7 or ebd1 impairs Wnt pathway activation (Fig 6H).
Discussion
Here, we show that H4K20 monomethyltransferase Pr‐set7/SET8 is required for the reactivation of Drosophila NSCs. Mechanistically, Pr‐set7 promotes the transcription of cell‐cycle regulator cdk1 and Wnt pathway transcriptional co‐activator ebd1, likely via direct binding to their promoter region. Both Cdk1 and Ebd1 are intrinsically required for NSC reactivation and their overexpression significantly suppresses defects of reactivation observed in pr‐set7 mutant NSCs. Therefore, we demonstrate that Pr‐set7, the sole histone H4 K20 methyltransferase, promotes NSC reactivation through regulating Wnt signaling and cell‐cycle progression.
Unlike a well‐established role for di‐ and tri‐methylation of H4K20 (H4K20me2/3) in gene repression (Schotta et al, 2004; Fodor et al, 2010), the role of Pr‐set7 and H4K20me1 in transcriptional regulation remains highly controversial. H4K20me1 caused chromatin condensation, suggesting that it is a repressor mark (Lu et al, 2008; Oda et al, 2009). In mammalian cells, H4K20me1 also recruits L3MBTL1, an H4K20me1 and H4K20me2 reader involved in compacting nucleosomes (Trojer et al, 2007). In support of this notion, Drosophila H4K20me1 was found exclusively in regions without active transcription in Polytene chromosomes (Nishioka et al, 2002) and mouse H4K20me1 was enriched on the inactive X chromosome (Kohlmaier et al, 2004). Furthermore, in Hela cells, loss of pr‐set7 led to upregulation of H4K20me1‐enriched genes (Congdon et al, 2010). However, the genome‐wide analysis provided evidence for the role of H4K20me1 in transcriptional activation (Barski et al, 2007; Wang et al, 2008; Cui et al, 2009). In certain genomic loci of mammalian cells including murine erythroleukemia cells, adipocytes, and HeLa cells, H4K20me1 correlated with gene activation (Talasz et al, 2005; Vakoc et al, 2006; Wakabayashi et al, 2009). In our Tada profiling, we demonstrate that Pr‐set7 binds to the promoter and transcriptional start site of cdk1 and ebd1 and loss of pr‐set7 led to downregulation of cdk1 and ebd1 in NSCs. This result is in line with previous reports that Pr‐set7 is linked to gene activation (Barski et al, 2007; Wang et al, 2008; Cui et al, 2009). We also show that Pr‐set7 could potentially activate and repress different genes in NSCs and should not be considered as a sole activator or repressor. The function of Pr‐set7/H4K20me1 may be loci‐ and cell type‐dependent, as Pr‐set7 binds to different regions of genes, including promoters, introns, exons, 3’UTRs, and 5’UTRs in our TaDa analysis. Besides functioning as Histone H4 methyl transferase, Pr‐set7 also methylates non‐histone protein such as PCNA (Takawa et al, 2012) and P53 (Shi et al, 2007).
We have identified cdk1 as a major target of Pr‐set7 during NSC reactivation through TaDa in vivo profiling. We further show that cdk1 is required for NSC reactivation and is downregulated in the larval brain upon loss of pr‐set7. Unfortunately, we were unable to determine whether monomethylation of H4K20 occurs at the promoter region of cdk1 due to technical issues, as the anti‐H4K20me1 antibody did not work in immunoprecipitation in our experiments. Pr‐set7 might have additional roles in NSC proliferation at a later larval stage and/or preventing NSCs from re‐entering into quiescence because EdU incorporation defects were still observed at later time points between 48 h and 96 h ALH in pr‐set7 mutants, although not as prominent as at 24 h ALH. In addition, cellular protrusions in quiescent NSCs were still retained at 96 h ALH in pr‐set7 mutants, suggesting that pr‐set7 mutants might have failed to re‐enter into the cell cycle at later larval stages. However, this defect is unlikely due to slow proliferating NSCs that have re‐entered into the cell cycle, because proliferating NSCs would have lost cellular protrusions. Given that Cdk1 has an essential role in the cell cycle regulation and its mutants showed a severe phenotype in NSC reactivation, Cdk1 is likely to be involved in all the above aspects of NSC cell‐cycle re‐entry.
Our FUCCI analysis showed that the reactivation of both G2 and G0 quiescent NSCs were impaired upon loss of pr‐set7, likely due to downregulation of cdk1 expression in these NSCs. In Drosophila, G2‐M phase transition is governed by Cdk1 phosphorylation and mitotic Cyclin B (Lee et al, 2001; Lee & Orr‐Weaver, 2003). In G2 quiescent NSCs, Tribbles targets Cdc25String for degradation and maintains the inhibition of Cdk1 (Otsuki & Brand, 2018). Our finding is also consistent with previous reports that Cdk1/Cyclin A promotes the G1‐S transition of larval imaginal eye disc cells (Foley et al, 1999; Foley & Sprenger, 2001). Pr‐set7 has been shown to be phosphorylated by CycB/Cdk1 complex at Ser 29 (S29) residue in human HeLa cells during early mitosis, which results in the removal of Pr‐Set7 from mitotic chromosome without affecting its methyltransferase activity (Wu et al, 2010). Interestingly, the CDK phosphorylation consensus sequence is conserved in Drosophila (Brustel et al, 2011). It is conceivable that Pr‐set7 promotes the expression of Cdk1 to facilitate the NSC reactivation and cell cycle re‐entry, while subsequently Pr‐Set7 may be regulated by Cdk1 during mitosis for cell cycle progression.
We have identified Ebd1 as another important target of Pr‐set7 contributing to NSC reactivation. Ebd1 is a Wnt/Wingless signaling pathway transcriptional co‐activator, and it stabilizes the Arm‐TCF complex and facilitates the recruitment of the complex to chromatin (Benchabane et al, 2011). We found that the Wingless pathway promotes NSC reactivation (Q. Deng, Y.S. Tan, & H. Wang, unpublished data). In this study, our analysis of Ebd1 suggests that activation of the Wingless pathway is required for NSC reactivation. We observed Ebd1 localizes in the nucleus of quiescent and reactivating NSCs. By contrast, nuclear Ebd1 is absent in NSCs at third instar larvae (Benchabane et al, 2011). This observation suggests that Ebd1 expression is developmentally regulated and the Wingless signaling pathway may be transiently activated at the early larval stage during NSC reactivation. We further showed that Pr‐set7 promotes Ebd1 expression to activate Wnt/Wingless signaling, as the expression of Arm/β‐catenin in NSCs in the early larval stage is also dependent on Pr‐set7. In Drosophila wing imaginal discs, Pr‐set7 was also shown to bind to Pan/TCF via a direct protein‐protein interaction and stabilizes this interaction (Yu et al, 2019). In vertebrates, Pr‐set7 monomethylates H4K20 at the TCF‐binding elements, thereby promoting the transcription of Wnt‐activated genes (Brustel et al, 2011). Interestingly, in the Juvenile Rat Hippocampus, Pr‐set7/H4K20me1 promotes Wnt pathway‐related gene expression and ensures proper neurodevelopment (Ke et al, 2014). These studies highlight the importance of the regulation of the Wnt/Wingless pathway by Pr‐Set7 during neural development.
Interestingly, we observed a potential reciprocal regulation between Ebd1 and Cdk1 during NSC reactivation. Ebd1 expression at the early larval stage may depend on Cdk1. There are emerging links between cell cycle regulators and Wnt signaling in both Drosophila and mammals (Davidson & Niehrs, 2010; Kim et al, 2013; Bryja et al, 2017; Chen et al, 2018). For example, in Hela cells, Cdk1 phosphorylates B‐cell CLL/lymphoma 9 (BCL9) to promote mitotic Wnt signaling (Chen et al, 2018). In C. elegans, Cdk1 promotes the release of cortical β‐catenin to facilitate spindle rotation (Kim et al, 2013). Our results suggest that Cdk1 may activate Wnt signaling via upregulating Ebd1 during NSC reactivation.
Recent studies have identified multiple variants in KMT5A in patients who suffer from neurodevelopmental disorders or cancer, including seventeen copy number variation and one missense mutation (Wickramasekara & Stessman, 2019). The expression of KMT5A in the mammalian brain is currently poorly understood. Interestingly, in situ hybridization data from the Allen Mouse Brain Atlas showed that Kmt5a is expressed in the young adult mouse brain. Moreover, the Allen BrainSpan Atlas showed that human KMT5A is expressed in both embryonic and postnatal brains in various brain regions including the hippocampus and prefrontal cortex (Wickramasekara & Stessman, 2019). Our study on Pr‐set7 provides the first in‐depth study on the function of Pr‐set7 during Drosophila brain development. As the association of NSC reactivation defects with neurodevelopment disorders starts to emerge (Ding et al, 2020), future studies are warranted to understand the potential role of mammalian KMT5A/PR‐SET7/SETD8 in NSC proliferation and associated neurodevelopmental disorders.
Materials and Methods
Fly stocks and genetics
The fly strains used in this study were pr‐set7716, UAS‐pr‐set7, pr‐set7 BAC, UAS‐Dam‐Pr‐set7, and UAS‐Dam. ebd1240 and UAS‐ebd1‐Flag were kindly provided by Dr Y Ahmed. The following stocks were obtained from Bloomington Drosophila Stock Center (BDSC): Df(3R)ED5644 (BDSC#9090), pr‐set7EY04668 (BDSC#15761), pr‐set7MI08086(BDSC#44742), FUCCI construct (BDSC#55117), cdk1 RNAi (BDSC#35350, #36117 and #40950), UAS‐cdk1‐Myc (BDSC#6642), UASp‐cdk1.T14A.Y15F.VFP (BDSC# 65394), ebd1 RNAi (BDSC#35765), and cdk1B47 (BDSC#6643). pr‐set7 RNAi (NIG #3307R‐3) was obtained from the National Institute of Genetics (NIG).
All experiments with mutants were carried out at 25°C. For RNAi knockdown or overexpression, Drosophila larvae were shifted from 25°C to 29°C after larval hatching (ALH) to increase the efficiency. As pr‐set7716/+ heterozygous displayed no NSC reactivation defects between 24 h and 96 h ALH and is indistinguishable from the yw control, we have used yw as a control for various mutants in this study.
Immunochemistry
Larvae were dissected in phosphate‐buffered saline (PBS), and larval brains were fixed for 22 min in 0.3% PBS‐Triton (PBT) with 4% EM grade formaldehyde (methanol‐free). After three times washing with 0.3% PBT (10 min each), brain samples were blocked with 3% bovine serum albumin (BSA) in 0.3% PBT for 45 min. Blocked brain samples were incubated with primary antibody diluted in 3% BSA overnight at 4°C. Following two times washing with 0.3% PBT (10 min each), brain samples were incubated with secondary antibodies diluted in 0.3% PBT for 90 min. DNA was labeled by ToPro‐3 (1:5,000, Invitrogen, Cat#: T3605) or DAPI (1:1,500, Molecular Probes, Cat#: D1306). After two more washing with 0.3% PBT (10 min each), larval brains were mounted in Vector shield (Vector Laboratory) for Confocal microscopy. Confocal images were taken by a Zeiss LSM710 Confocal microscope and processed with Adobe Photoshop CS6 for brightness and contrast adjustment.
Primary antibodies used were as follows: guinea pig anti‐Dpn (1:1,000, J Skeath), rat anti‐CD8 (1:250, Invitrogen, Cat#: MCD0800), rabbit anti‐GFP (1:500, Molecular Probes, Cat#: A21311), mouse anti‐Mira (1:40, F. Matsuzaki), rabbit anti‐Pr‐set7 (1:100; generated in this experiment), Rabbit anti‐H4K20me1 (1:50; Millipore, Cat#: 04‐735), and guinea pig anti‐Ebd1 (1:5,000, Y Ahmed).
EdU pulse‐chase analysis
Click‐iT® EdU Alexa Fluor® 555 Imaging Kit (Invitrogen) were used in this experiment. Larvae were fed with standard food supplemented with 0.2 mM (2%) EdU for 4 h before dissection. Then, the dissected larval brains were fixed with 4% EM grade formaldehyde in 0.3% PBT for 22 min, followed by three times washing with 0.3% PBT (10 min each). After washing, EdU was detected by Alexa Fluor azide according to the Click‐iT EdU protocol (Invitrogen). Samples were washed two more times with 0.3% PBT (10 min each) and blocked with 3% BSA for 45 min. Following blocking, larval brains were processed by immunohistochemistry.
Nutritional deprivation of larvae
Within 2 h after larval hatching, larvae were transferred to 5% sucrose and 1% Agar in PBS. Larvae were kept at an appropriate temperature for further analysis.
Quantification of cellular extensions and EdU incorporation
Processed Drosophila larval brains were placed with the dorsal side up on confocal slides. The confocal z‐stacks were taken from the dorsal surface to the deep layers of the larval brains with 3‐µm intervals (24–30 slides per z‐stack). Quantification was carried out using Zen software. The numbers of NSCs with phenotypes such as EdU incorporation and cellular extensions of each brain lobe were counted, and the percentage of each brain lobe was calculated. Each brain lobe was considered as one biological replicate. The final data were shown as mean ± SD calculated from all brain lobes. Total numbers of NSCs counted were also included as n numbers. For example, “n = 1055, 12 brain lobes [BL]” indicates a total of 1,055 NSCs in 12 brain lobes were counted. NSCs without EdU incorporation was quantified at various time points for NSC quiescence blockage/delay phenotype, while NSCs with EdU incorporation at 6 h ALH were quantified to score precocious NSC reactivation phenotype. Minimum six brain lobes were quantified for each sample in this study.
Quantification of the fluorescence intensity and NSC diameters
Images taken by Zeiss LSM710 Confocal microscope were analyzed, and the fluorescence intensity and NSC diameters were measured by ImageJ. Quantifications were performed using the polygon or free hand selection tool in ImageJ to outline NSCs or the whole brain. The corrected total cell fluorescence (CCF) = Integrated Density – (Area of selected cell X Mean fluorescence of background readings). The background was taken in the no‐cell regions near the cell of interest.
Generation of plasmids and transgenic flies
Gateway® BP Clonase® II Enzyme mix (Invitrogen) was used for the generation of entry clone plasmids. cDNA clones were used in this study (Drosophila Genomics Resource Centre [DGRC]). Briefly, genes were amplified by polymerase chain reaction (PCR) first. Then, the amplified fragment was inserted into Gateway vector pDONR221 (Invitrogen) using Gateway BP Clonase II Enzyme mix to generate entry vector pDONR211‐Pr‐Set7. Subsequently, the fragment in the entry vector was inserted into Gateway destination vectors (pUAST) by LR recombination using Gateway LR Clonase II enzyme mix. The plasmids generated were pUAST‐Pr‐set7. Primers used for generating entry clones were as follows:
BP.Pr‐set7.F: GGGG ACA AGT TTG TAC AAA AAA GCA GGC TTC ATGATAATGG TGCGAAGACG A.
BP.Pr‐set7.R: GGGG AC CAC TTT GTA CAA GAA AGC TGG GTC TCAGAA GGCCAACCAA GGATG.
UAS‐Pr‐set7 transgenic flies were generated by standard P‐element‐mediated transformation by BestGenes, Inc.
Drosophila pr‐set7 genomic constructs for genomic rescue
The selection criteria for bacterial artificial chromosomes (BACs) clone are to cover 10,000 bp upstream to 5,000 bp downstream of the genomic region of the gene (pr‐set7). Therefore, Pr‐set7‐BAC (CH322‐129L5) was obtained from the BACPAC Resources Center. To generate transgenic flies, the BAC clone was injected into stock BDSC#8621 yw; P{y[+t7.7] = CaryP}attP1 (chromosome II, 55C4) based on ΦC31‐integrase system by BestGene, Inc.
Generation of anti‐Pr‐set7 antibodies
The C‐terminal coding sequence (encoding 412–691 amino acids) of Pr‐set7 (Pr‐set7‐C) was amplified by PCR and inserted into the vector pMAL‐c2X (In‐Fusion HD Cloning Kit, Clontech). The expression of GST‐Pr‐set7‐C was induced by isopropyl β‐D‐1‐thiogalactopyranoside and purified by amylose resin (NEB). Purified MBP‐Pr‐set7‐C was then injected into one guinea pig and one rabbit, and Pr‐set7‐C antibodies were generated and purified by GenScript (Hong Kong). Primers used for Pr‐set7‐C amplification are as follows:
Pr‐set7.412‐end.MBP.F: AGGATTTCAGAATTCCTGAACCAGCCAAAGCCACAA.
Pr‐set7.412‐end.MBP.R: TTGCCTGCAGGTCGATCAGAAGGCCAACCAAGGATG.
Protein extraction and immunoblotting
Larval brains of proper genotype were dissected in PBS and homogenized in RIPA buffer (50 mM Tris pH 7.5, 150 mM NaCl, 1 mM EDTA, 1% Triton X‐100, 0.5% sodium deoxycholate, 0.1% SDS) containing proteases inhibitors. The amount of brains needed depends on the size of the brain, protein level, and antibody quality. The protein extracts were separated by SDS–PAGE and analyzed by Western blotting.
Blots were probed with the following antibodies: mouse anti‐Actin (1:5,000; MP Biomedicals, Cat#: 08691001), rabbit anti‐GAPDH1 (1:5,000; GeneTex, Cat#: GTX100118), guinea pig anti‐Pr‐set7 (1:1,000; generated in this experiment), rabbit anti‐Cdk1 (1:1,000; Millipore, Cat#: AB3241‐25UL), and mouse anti‐Arm (1:1,000; DSHB, Cat#: N2 7A1).
RNA extraction and qPCR analysis
Larvae were dissected in PBS, and RNA from brains was extracted using TRI reagent (Sigma‐Aldrich) following the manufacturer’s protocol. ProtoScript First Strand cDNA Synthesis kit (New England Biolabs, Inc.) was used for reverse transcription. qPCR was carried out with different primer pairs. The primers used are listed in Appendix Table S3. Results were analyzed using the REST excel file.
TaDa in vivo profiling analysis
To identify in vivo Pr‐set7 target genes, full length of Pr‐set7 was cloned into pUASTattB‐LT3‐NDam vector using In‐Fusion HD Cloning Kit. pUASTattB‐LT3‐NDam was kindly provided by A. Brand. UAS‐Dam‐Pr‐set7 (pUASTattB‐LT3‐NDam‐Pr‐set7) or UAS‐Dam control (pUASTattB‐LT3‐NDam) was expressed under the control of the grh‐Gal4 driver. Eggs were collected within a 6‐h period and raised at 25°C for 24 h till larvae hatched out. Hatched larvae were transferred to 29°C for 24 h before dissection. Genomic DNA of Dam‐Pr‐set7 or Dam control was extracted and amplified as previously described (Ahn & Joyner, 2005). Around 1,500 larval brains were collected for each genotype. The Illumina TruSeq DNA PCR‐free library preparation kit was used to construct libraries based on amplified DNA samples according to the manufacturer’s protocol. The libraries were then sequenced on the Illumina MiSeq equipment. Paired reads (2 × 250 bp) were obtained from Dam‐Pr‐set7 or Dam control library and were aligned with Drosophila melanogaster (dm6) reference genome by Bowtie 2 (Langmead & Salzberg, 2012). The peaks were called by MACS (Zhang et al, 2008), and the nearby gene was annotated using HOMER (Heinz et al, 2010). From two biological replicates performed (namely Original and Replicate), 7,157 overlapping peaks (peak scores ≥ 50) are listed in Appendix Table S1. 2,081 out of 2,876 peaks (72.4%) in the replicate sample were also present in the original set, suggesting the two biological replicates were well correlated.
Statistical analysis
Statistical analysis between two groups was performed by two‐tailed Student’s t‐test or Mann–Whitney test, and a value of P < 0.05 was considered as statistically significant. For three groups and above, one‐way ANOVA was performed and P‐values are calculated. In this work, ns (non‐significant) indicates P > 0.05, * indicates P < 0.05, ** indicates P < 0.01, and *** indicates P < 0.001. All data were shown as mean ± SD.
Author contributions
HW and JH conceptualized the data; JH, MG, QD, SYC, W‐KS, SL, and PT performed methodology; JH and HW wrote the original draft; HW and JH reviewed and edited the manuscript; HW performed the funding acquisition and resources, and supervised the research.
Conflict of Interest
The authors declare that they have no conflict of interest.
Supporting information
Appendix
Expanded View Figures PDF
Dataset EV1
Review Process File
Source Data for Figure 1
Source Data for Figure 3
Acknowledgements
We thank A Brand, F Matsuzaki, C. Doe, Y. Ahmed, J Skeath, the Hybridoma Bank, the Bloomington Drosophila Stock Center, Vienna Drosophila RNAi Center, Drosophila Genomics Resource Center (DGRC) for fly stocks, antibodies, and cDNA clones and Gao F. for technical assistance. This work is supported by the Duke‐NUS Signature Research Program funded by the Ministry of Health (MOH‐000143), Singapore (HW).
EMBO Reports (2021) 22: e50994.
Data availability
Raw and processed sequencing data have been deposited into Gene Expression Omnibus (GEO) database under accession number GSE158764. The DamID data from this publication have been deposited to the Gene Expression Omnibus (GEO) database (https://www.ncbi.nlm.nih.gov/geo/query/acc.cgi?acc=GSE158764) and assigned the identifier GSE158764.
References
- Ahn S, Joyner AL (2005) In vivo analysis of quiescent adult neural stem cells responding to Sonic hedgehog. Nature 437: 894–897 [DOI] [PubMed] [Google Scholar]
- Ayeni JO, Varadarajan R, Mukherjee O, Stuart DT, Sprenger F, Srayko M, Campbell SD (2014) Dual phosphorylation of cdk1 coordinates cell proliferation with key developmental processes in Drosophila . Genetics 196: 197–210 [DOI] [PMC free article] [PubMed] [Google Scholar]
- Baig‐Lewis S, Peterson‐Nedry W, Wehrli M (2007) Wingless/Wnt signal transduction requires distinct initiation and amplification steps that both depend on Arrow/LRP. Dev Biol 306: 94–111 [DOI] [PMC free article] [PubMed] [Google Scholar]
- Barski A, Cuddapah S, Cui K, Roh TY, Schones DE, Wang Z, Wei G, Chepelev I, Zhao K (2007) High‐resolution profiling of histone methylations in the human genome. Cell 129: 823–837 [DOI] [PubMed] [Google Scholar]
- Beck DB, Oda H, Shen SS, Reinberg D (2012) PR‐Set7 and H4K20me1: at the crossroads of genome integrity, cell cycle, chromosome condensation, and transcription. Genes Dev 26: 325–337 [DOI] [PMC free article] [PubMed] [Google Scholar]
- Bellen HJ, Levis RW, Liao G, He Y, Carlson JW, Tsang G, Evans‐Holm M, Hiesinger PR, Schulze KL, Rubin GM et al (2004) The BDGP gene disruption project: single transposon insertions associated with 40% of Drosophila genes. Genetics 167: 761–781 [DOI] [PMC free article] [PubMed] [Google Scholar]
- Benchabane H, Xin N, Tian A, Hafler BP, Nguyen K, Ahmed A, Ahmed Y (2011) Jerky/Earthbound facilitates cell‐specific Wnt/Wingless signalling by modulating beta‐catenin‐TCF activity. EMBO J 30: 1444–1458 [DOI] [PMC free article] [PubMed] [Google Scholar]
- Bostock MP, Prasad AR, Chaouni R, Yuen AC, Sousa‐Nunes R, Amoyel M, Fernandes VM (2020) An immobilization technique for long‐term time‐lapse imaging of explanted Drosophila TISSUES. Front Cell Dev Biol 8: 590094. [DOI] [PMC free article] [PubMed] [Google Scholar]
- Braun SM, Jessberger S (2014) Adult neurogenesis and its role in neuropsychiatric disease, brain repair and normal brain function. Neuropathol Appl Neurobiol 40: 3–12 [DOI] [PubMed] [Google Scholar]
- Britton JS, Edgar BA (1998) Environmental control of the cell cycle in Drosophila: nutrition activates mitotic and endoreplicative cells by distinct mechanisms. Development 125: 2149–2158 [DOI] [PubMed] [Google Scholar]
- Brunner E, Peter O, Schweizer L, Basler K (1997) pangolin encodes a Lef‐1 homologue that acts downstream of Armadillo to transduce the Wingless signal in Drosophila . Nature 385: 829–833 [DOI] [PubMed] [Google Scholar]
- Brustel J, Tardat M, Kirsh O, Grimaud C, Julien E (2011) Coupling mitosis to DNA replication: the emerging role of the histone H4‐lysine 20 methyltransferase PR‐Set7. Trends Cell Biol 21: 452–460 [DOI] [PubMed] [Google Scholar]
- Bryja V, Cervenka I, Cajanek L (2017) The connections of Wnt pathway components with cell cycle and centrosome: side effects or a hidden logic? Crit Rev Biochem Mol Biol 52: 614–637 [DOI] [PMC free article] [PubMed] [Google Scholar]
- Chell JM, Brand AH (2010) Nutrition‐responsive glia control exit of neural stem cells from quiescence. Cell 143: 1161–1173 [DOI] [PMC free article] [PubMed] [Google Scholar]
- Chen J, Rajasekaran M, Xia H, Kong SN, Deivasigamani A, Sekar K, Gao H, Swa HL, Gunaratne J, Ooi LL et al (2018) CDK1‐mediated BCL9 phosphorylation inhibits clathrin to promote mitotic Wnt signalling. EMBO J 37: e99395 [DOI] [PMC free article] [PubMed] [Google Scholar]
- Cheung TH, Rando TA (2013) Molecular regulation of stem cell quiescence. Nat Rev Mol Cell Biol 14: 329–340 [DOI] [PMC free article] [PubMed] [Google Scholar]
- Clegg NJ, Whitehead IP, Williams JA, Spiegelman GB, Grigliatti TA (1993) A developmental and molecular analysis of Cdc2 mutations in Drosophila melanogaster. Genome 36: 676–685 [DOI] [PubMed] [Google Scholar]
- Colombani J, Raisin S, Pantalacci S, Radimerski T, Montagne J, Leopold P (2003) A nutrient sensor mechanism controls Drosophila growth. Cell 114: 739–749 [DOI] [PubMed] [Google Scholar]
- Congdon LM, Houston SI, Veerappan CS, Spektor TM, Rice JC (2010) PR‐Set7‐mediated monomethylation of histone H4 lysine 20 at specific genomic regions induces transcriptional repression. J Cell Biochem 110: 609–619 [DOI] [PubMed] [Google Scholar]
- Couture JF, Collazo E, Brunzelle JS, Trievel RC (2005) Structural and functional analysis of SET8, a histone H4 Lys‐20 methyltransferase. Genes Dev 19: 1455–1465 [DOI] [PMC free article] [PubMed] [Google Scholar]
- Cui K, Zang C, Roh TY, Schones DE, Childs RW, Peng W, Zhao K (2009) Chromatin signatures in multipotent human hematopoietic stem cells indicate the fate of bivalent genes during differentiation. Cell Stem Cell 4: 80–93 [DOI] [PMC free article] [PubMed] [Google Scholar]
- Davidson G, Niehrs C (2010) Emerging links between CDK cell cycle regulators and Wnt signaling. Trends Cell Biol 20: 453–460 [DOI] [PubMed] [Google Scholar]
- Daynac M, Chicheportiche A, Pineda JR, Gauthier LR, Boussin FD, Mouthon MA (2013) Quiescent neural stem cells exit dormancy upon alteration of GABAAR signaling following radiation damage. Stem cell research 11: 516–528 [DOI] [PubMed] [Google Scholar]
- Daynac M, Tirou L, Faure H, Mouthon MA, Gauthier LR, Hahn H, Boussin FD, Ruat M (2016) Hedgehog controls quiescence and activation of neural stem cells in the adult ventricular‐subventricular zone. Stem Cell Reports 7: 735–748 [DOI] [PMC free article] [PubMed] [Google Scholar]
- Deng Q, Tan YS, Chew LY, Wang H (2020) Msps governs acentrosomal microtubule assembly and reactivation of quiescent neural stem cells. bioRxiv 10.1101/2020.01.24.918227 [PREPRINT] [DOI] [PMC free article] [PubMed] [Google Scholar]
- Ding R, Weynans K, Bossing T, Barros CS, Berger C (2016) The Hippo signalling pathway maintains quiescence in Drosophila neural stem cells. Nat Commun 7: 10510 [DOI] [PMC free article] [PubMed] [Google Scholar]
- Ding WY, Huang J, Wang H (2020) Waking up quiescent neural stem cells: Molecular mechanisms and implications in neurodevelopmental disorders. PLoS Genet 16: e1008653 [DOI] [PMC free article] [PubMed] [Google Scholar]
- Doetsch F, Garcia‐Verdugo JM, Alvarez‐Buylla A (1999) Regeneration of a germinal layer in the adult mammalian brain. Proc Natl Acad Sci USA 96: 11619–11624 [DOI] [PMC free article] [PubMed] [Google Scholar]
- Faiz M, Sachewsky N, Gascon S, Bang KW, Morshead CM, Nagy A (2015) Adult neural stem cells from the subventricular zone give rise to reactive astrocytes in the cortex after stroke. Cell Stem Cell 17: 624–634 [DOI] [PubMed] [Google Scholar]
- Fodor BD, Shukeir N, Reuter G, Jenuwein T (2010) Mammalian Su(var) genes in chromatin control. Annu Rev Cell Dev Biol 26: 471–501 [DOI] [PubMed] [Google Scholar]
- Foley E, O'Farrell PH, Sprenger F (1999) Rux is a cyclin‐dependent kinase inhibitor (CKI) specific for mitotic cyclin‐Cdk complexes. Curr Biol 9: 1392–1402 [DOI] [PMC free article] [PubMed] [Google Scholar]
- Foley E, Sprenger F (2001) The cyclin‐dependent kinase inhibitor Roughex is involved in mitotic exit in Drosophila . Curr Biol 11: 151–160 [DOI] [PubMed] [Google Scholar]
- Gil‐Ranedo J, Gonzaga E, Jaworek KJ, Berger C, Bossing T, Barros CS (2019) STRIPAK members orchestrate hippo and insulin receptor signaling to promote neural stem cell reactivation. Cell Rep 27: 2921–2933 [DOI] [PMC free article] [PubMed] [Google Scholar]
- Heinz S, Benner C, Spann N, Bertolino E, Lin YC, Laslo P, Cheng JX, Murre C, Singh H, Glass CK (2010) Simple combinations of lineage‐determining transcription factors prime cis‐regulatory elements required for macrophage and B cell identities. Mol Cell 38: 576–589 [DOI] [PMC free article] [PubMed] [Google Scholar]
- Huang J, Wang H (2018) Hsp83/Hsp90 physically associates with insulin receptor to promote neural stem cell reactivation. Stem Cell Reports 11: 883–896 [DOI] [PMC free article] [PubMed] [Google Scholar]
- Isshiki T, Pearson B, Holbrook S, Doe CQ (2001) Drosophila neuroblasts sequentially express transcription factors which specify the temporal identity of their neuronal progeny. Cell 106: 511–521 [DOI] [PubMed] [Google Scholar]
- Ito K, Hotta Y (1992) Proliferation pattern of postembryonic neuroblasts in the brain of Drosophila melanogaster. Dev Biol 149: 134–148 [DOI] [PubMed] [Google Scholar]
- Karachentsev D, Sarma K, Reinberg D, Steward R (2005) PR‐Set7‐dependent methylation of histone H4 Lys 20 functions in repression of gene expression and is essential for mitosis. Genes Dev 19: 431–435 [DOI] [PMC free article] [PubMed] [Google Scholar]
- Kawai H, Kawaguchi D, Kuebrich BD, Kitamoto T, Yamaguchi M, Gotoh Y, Furutachi S (2017) Area‐specific regulation of quiescent neural stem cells by Notch3 in the adult mouse subependymal zone. J Neurosci 37: 11867–11880 [DOI] [PMC free article] [PubMed] [Google Scholar]
- Ke X, Xing B, Yu B, Yu X, Majnik A, Cohen S, Lane R, Joss‐Moore L (2014) IUGR disrupts the PPARgamma‐Setd8‐H4K20me(1) and Wnt signaling pathways in the juvenile rat hippocampus. Int J Dev Neurosci 38: 59–67 [DOI] [PMC free article] [PubMed] [Google Scholar]
- Kim S, Ishidate T, Sharma R, Soto MC, Conte D Jr, Mello CC, Shirayama M (2013) Wnt and CDK‐1 regulate cortical release of WRM‐1/beta‐catenin to control cell division orientation in early Caenorhabditis elegans embryos. Proc Natl Acad Sci USA 110: E918–927 [DOI] [PMC free article] [PubMed] [Google Scholar]
- Kohlmaier A, Savarese F, Lachner M, Martens J, Jenuwein T, Wutz A (2004) A chromosomal memory triggered by Xist regulates histone methylation in X inactivation. PLoS Biol 2: E171 [DOI] [PMC free article] [PubMed] [Google Scholar]
- Lai SL, Doe CQ (2014). Transient nuclear Prospero induces neural progenitor quiescence. eLife 3: e03363. [DOI] [PMC free article] [PubMed] [Google Scholar]
- Langmead B, Salzberg SL (2012) Fast gapped‐read alignment with Bowtie 2. Nat Methods 9: 357–359 [DOI] [PMC free article] [PubMed] [Google Scholar]
- Lee LA, Elfring LK, Bosco G, Orr‐Weaver TL (2001) A genetic screen for suppressors and enhancers of the Drosophila PAN GU cell cycle kinase identifies cyclin B as a target. Genetics 158: 1545–1556 [DOI] [PMC free article] [PubMed] [Google Scholar]
- Lee LA, Orr‐Weaver TL (2003) Regulation of cell cycles in Drosophila development: intrinsic and extrinsic cues. Annu Rev Genet 37: 545–578 [DOI] [PubMed] [Google Scholar]
- Li S, Koe CT, Tay ST, Tan ALK, Zhang S, Zhang Y, Tan P, Sung WK, Wang H (2017) An intrinsic mechanism controls reactivation of neural stem cells by spindle matrix proteins. Nat Commun 8: 122 [DOI] [PMC free article] [PubMed] [Google Scholar]
- Li Z, Nie F, Wang S, Li L (2011) Histone H4 Lys 20 monomethylation by histone methylase SET8 mediates Wnt target gene activation. Proc Natl Acad Sci USA 108: 3116–3123 [DOI] [PMC free article] [PubMed] [Google Scholar]
- Lu X, Simon MD, Chodaparambil JV, Hansen JC, Shokat KM, Luger K (2008) The effect of H3K79 dimethylation and H4K20 trimethylation on nucleosome and chromatin structure. Nat Struct Mol Biol 15: 1122–1124 [DOI] [PMC free article] [PubMed] [Google Scholar]
- Lucassen PJ, Meerlo P, Naylor AS, van Dam AM, Dayer AG, Fuchs E, Oomen CA, Czeh B (2010) Regulation of adult neurogenesis by stress, sleep disruption, exercise and inflammation: Implications for depression and antidepressant action. Eur Neuropsychopharmacol 20: 1–17 [DOI] [PubMed] [Google Scholar]
- Lugert S, Basak O, Knuckles P, Haussler U, Fabel K, Gotz M, Haas CA, Kempermann G, Taylor V, Giachino C (2010) Quiescent and active hippocampal neural stem cells with distinct morphologies respond selectively to physiological and pathological stimuli and aging. Cell Stem Cell 6: 445–456 [DOI] [PubMed] [Google Scholar]
- Ly PT, Tan YS, Koe CT, Zhang Y, Xie G, Endow S, Deng WM, Yu F, Wang H (2019) CRL4Mahj E3 ubiquitin ligase promotes neural stem cell reactivation. PLoS Biol 17: e3000276 [DOI] [PMC free article] [PubMed] [Google Scholar]
- Mairet‐Coello G, Tury A, DiCicco‐Bloom E (2009) Insulin‐like growth factor‐1 promotes G(1)/S cell cycle progression through bidirectional regulation of cyclins and cyclin‐dependent kinase inhibitors via the phosphatidylinositol 3‐kinase/Akt pathway in developing rat cerebral cortex. J Neurosci 29: 775–788 [DOI] [PMC free article] [PubMed] [Google Scholar]
- Morshead CM, Reynolds BA, Craig CG, McBurney MW, Staines WA, Morassutti D, Weiss S, van der Kooy D (1994) Neural stem cells in the adult mammalian forebrain: a relatively quiescent subpopulation of subependymal cells. Neuron 13: 1071–1082 [DOI] [PubMed] [Google Scholar]
- Nishioka K, Rice JC, Sarma K, Erdjument‐Bromage H, Werner J, Wang Y, Chuikov S, Valenzuela P, Tempst P, Steward R et al (2002) PR‐Set7 is a nucleosome‐specific methyltransferase that modifies lysine 20 of histone H4 and is associated with silent chromatin. Mol Cell 9: 1201–1213 [DOI] [PubMed] [Google Scholar]
- Oda H, Okamoto I, Murphy N, Chu J, Price SM, Shen MM, Torres‐Padilla ME, Heard E, Reinberg D (2009) Monomethylation of histone H4‐lysine 20 is involved in chromosome structure and stability and is essential for mouse development. Mol Cell Biol 29: 2278–2295 [DOI] [PMC free article] [PubMed] [Google Scholar]
- Otsuki L, Brand AH (2017) The vasculature as a neural stem cell niche. Neurobiol Dis 107: 4–14 [DOI] [PubMed] [Google Scholar]
- Otsuki L, Brand AH (2018) Cell cycle heterogeneity directs the timing of neural stem cell activation from quiescence. Science 360: 99–102 [DOI] [PMC free article] [PubMed] [Google Scholar]
- Otsuki L, Brand AH (2019) Dorsal‐ventral differences in neural stem cell quiescence are induced by p57(KIP2)/Dacapo. Dev Cell 49: 293–300 [DOI] [PMC free article] [PubMed] [Google Scholar]
- Otsuki L, Brand AH (2020) Quiescent neural stem cells for brain repair and regeneration: lessons from model systems. Trends Neurosci 43: 213–226 [DOI] [PubMed] [Google Scholar]
- Poon CL, Mitchell KA, Kondo S, Cheng LY, Harvey KF (2016) The hippo pathway regulates neuroblasts and brain size in Drosophila melanogaster. Curr Biol 26: 1034–1042 [DOI] [PubMed] [Google Scholar]
- Schotta G, Lachner M, Sarma K, Ebert A, Sengupta R, Reuter G, Reinberg D, Jenuwein T (2004) A silencing pathway to induce H3–K9 and H4–K20 trimethylation at constitutive heterochromatin. Genes Dev 18: 1251–1262 [DOI] [PMC free article] [PubMed] [Google Scholar]
- Shi X, Kachirskaia I, Yamaguchi H, West LE, Wen H, Wang EW, Dutta S, Appella E, Gozani O (2007) Modulation of p53 function by SET8‐mediated methylation at lysine 382. Mol Cell 27: 636–646 [DOI] [PMC free article] [PubMed] [Google Scholar]
- Sousa‐Nunes R, Yee LL, Gould AP (2011) Fat cells reactivate quiescent neuroblasts via TOR and glial insulin relays in Drosophila . Nature 471: 508–512 [DOI] [PMC free article] [PubMed] [Google Scholar]
- Southall TD, Gold KS, Egger B, Davidson CM, Caygill EE, Marshall OJ, Brand AH (2013) Cell‐type‐specific profiling of gene expression and chromatin binding without cell isolation: assaying RNA Pol II occupancy in neural stem cells. Dev Cell 26: 101–112 [DOI] [PMC free article] [PubMed] [Google Scholar]
- Speder P, Brand AH (2014) Gap junction proteins in the blood‐brain barrier control nutrient‐dependent reactivation of Drosophila neural stem cells. Dev Cell 30: 309–321 [DOI] [PMC free article] [PubMed] [Google Scholar]
- Swarup S, Verheyen EM (2012) Wnt/Wingless signaling in Drosophila . Cold Spring Harb Perspect Biol 4: a007930 [DOI] [PMC free article] [PubMed] [Google Scholar]
- Takawa M, Cho HS, Hayami S, Toyokawa G, Kogure M, Yamane Y, Iwai Y, Maejima K, Ueda K, Masuda A et al (2012) Histone lysine methyltransferase SETD8 promotes carcinogenesis by deregulating PCNA expression. Cancer Res 72: 3217–3227 [DOI] [PubMed] [Google Scholar]
- Talasz H, Lindner HH, Sarg B, Helliger W (2005) Histone H4‐lysine 20 monomethylation is increased in promoter and coding regions of active genes and correlates with hyperacetylation. J Biol Chem 280: 38814–38822 [DOI] [PubMed] [Google Scholar]
- Trojer P, Li G, Sims RJ III, Vaquero A, Kalakonda N, Boccuni P, Lee D, Erdjument‐Bromage H, Tempst P, Nimer SD et al (2007) L3MBTL1, a histone‐methylation‐dependent chromatin lock. Cell 129: 915–928 [DOI] [PubMed] [Google Scholar]
- Truman JW, Bate M (1988) Spatial and temporal patterns of neurogenesis in the central nervous system of Drosophila melanogaster. Dev Biol 125: 145–157 [DOI] [PubMed] [Google Scholar]
- Tsuji T, Hasegawa E, Isshiki T (2008) Neuroblast entry into quiescence is regulated intrinsically by the combined action of spatial Hox proteins and temporal identity factors. Development 135: 3859–3869 [DOI] [PubMed] [Google Scholar]
- Vakoc CR, Sachdeva MM, Wang H, Blobel GA (2006) Profile of histone lysine methylation across transcribed mammalian chromatin. Mol Cell Biol 26: 9185–9195 [DOI] [PMC free article] [PubMed] [Google Scholar]
- Venken KJ, Schulze KL, Haelterman NA, Pan H, He Y, Evans‐Holm M, Carlson JW, Levis RW, Spradling AC, Hoskins RA et al (2011) MiMIC: a highly versatile transposon insertion resource for engineering Drosophila melanogaster genes. Nat Methods 8: 737–743 [DOI] [PMC free article] [PubMed] [Google Scholar]
- Wakabayashi K, Okamura M, Tsutsumi S, Nishikawa NS, Tanaka T, Sakakibara I, Kitakami J, Ihara S, Hashimoto Y, Hamakubo T et al (2009) The peroxisome proliferator‐activated receptor gamma/retinoid X receptor alpha heterodimer targets the histone modification enzyme PR‐Set7/Setd8 gene and regulates adipogenesis through a positive feedback loop. Mol Cell Biol 29: 3544–3555 [DOI] [PMC free article] [PubMed] [Google Scholar]
- Wang YZ, Plane JM, Jiang P, Zhou CJ, Deng W (2011) Concise review: Quiescent and active states of endogenous adult neural stem cells: identification and characterization. Stem Cells 29: 907–912 [DOI] [PMC free article] [PubMed] [Google Scholar]
- Wang Z, Zang C, Rosenfeld JA, Schones DE, Barski A, Cuddapah S, Cui K, Roh TY, Peng W, Zhang MQ et al (2008) Combinatorial patterns of histone acetylations and methylations in the human genome. Nat Genet 40: 897–903 [DOI] [PMC free article] [PubMed] [Google Scholar]
- Wickramasekara RN, Stessman HAF (2019) Histone 4 lysine 20 methylation: a case for neurodevelopmental disease. Biology (Basel) 8: 11 [DOI] [PMC free article] [PubMed] [Google Scholar]
- Wu S, Wang W, Kong X, Congdon LM, Yokomori K, Kirschner MW, Rice JC (2010) Dynamic regulation of the PR‐Set7 histone methyltransferase is required for normal cell cycle progression. Genes Dev 24: 2531–2542 [DOI] [PMC free article] [PubMed] [Google Scholar]
- Xiao B, Jing C, Kelly G, Walker PA, Muskett FW, Frenkiel TA, Martin SR, Sarma K, Reinberg D, Gamblin SJ et al (2005) Specificity and mechanism of the histone methyltransferase Pr‐Set7. Genes Dev 19: 1444–1454 [DOI] [PMC free article] [PubMed] [Google Scholar]
- Yan YP, Sailor KA, Vemuganti R, Dempsey RJ (2006) Insulin‐like growth factor‐1 is an endogenous mediator of focal ischemia‐induced neural progenitor proliferation. Eur J Neuorsci 24: 45–54 [DOI] [PubMed] [Google Scholar]
- Ye P, Popken GJ, Kemper A, McCarthy K, Popko B, D'Ercole AJ (2004) Astrocyte‐specific overexpression of insulin‐like growth factor‐I promotes brain overgrowth and glial fibrillary acidic protein expression. J Neurosci Res 78: 472–484 [DOI] [PubMed] [Google Scholar]
- Yu Y, Liu L, Li X, Hu X, Song H (2019) The histone H4K20 methyltransferase PR‐Set7 fine‐tunes the transcriptional activation of Wingless signaling in Drosophila . J Genet Genomics 46: 57–59 [DOI] [PubMed] [Google Scholar]
- Zhang Y, Liu T, Meyer CA, Eeckhoute J, Johnson DS, Bernstein BE, Nusbaum C, Myers RM, Brown M, Li W et al (2008) Model‐based analysis of ChIP‐Seq (MACS). Genome Biol 9: R137 [DOI] [PMC free article] [PubMed] [Google Scholar]
- Zielke N, Korzelius J, van Straaten M, Bender K, Schuhknecht GFP, Dutta D, Xiang J, Edgar BA (2014) Fly‐FUCCI: A versatile tool for studying cell proliferation in complex tissues. Cell Rep 7: 588–598 [DOI] [PubMed] [Google Scholar]
- Zouaz A, Fernando C, Perez Y, Sardet C, Julien E, Grimaud C (2018) Cell‐cycle regulation of non‐enzymatic functions of the Drosophila methyltransferase PR‐Set7. Nucleic Acids Res 46: 2834–2849 [DOI] [PMC free article] [PubMed] [Google Scholar]
Associated Data
This section collects any data citations, data availability statements, or supplementary materials included in this article.
Supplementary Materials
Appendix
Expanded View Figures PDF
Dataset EV1
Review Process File
Source Data for Figure 1
Source Data for Figure 3
Data Availability Statement
Raw and processed sequencing data have been deposited into Gene Expression Omnibus (GEO) database under accession number GSE158764. The DamID data from this publication have been deposited to the Gene Expression Omnibus (GEO) database (https://www.ncbi.nlm.nih.gov/geo/query/acc.cgi?acc=GSE158764) and assigned the identifier GSE158764.