Abstract
In mouse oocytes, acentriolar MTOCs functionally replace centrosomes and act as microtubule nucleation sites. Microtubules nucleated from MTOCs initially assemble into an unorganized ball‐like structure, which then transforms into a bipolar spindle carrying MTOCs at its poles, a process called spindle bipolarization. In mouse oocytes, spindle bipolarization is promoted by kinetochores but the mechanism by which kinetochore–microtubule attachments contribute to spindle bipolarity remains unclear. This study demonstrates that the stability of kinetochore–microtubule attachment is essential for confining MTOC positions at the spindle poles and for limiting spindle elongation. MTOC sorting is gradual and continues even in the metaphase spindle. When stable kinetochore–microtubule attachments are disrupted, the spindle is unable to restrict MTOCs at its poles and fails to terminate its elongation. Stable kinetochore fibers are directly connected to MTOCs and to the spindle poles. These findings suggest a role for stable kinetochore–microtubule attachments in fine‐tuning acentrosomal spindle bipolarity.
Keywords: kinetochore, microtubule, MTOC, oocyte, spindle
Subject Categories: Cell Adhesion, Polarity & Cytoskeleton; Cell Cycle
Stable kinetochore–microtubule attachments are required for confining MTOC positions at the spindle poles and for limiting spindle elongation during meiosis I in mouse oocytes.

Introduction
Spindle bipolarity is a prerequisite for chromosome segregation. In animal somatic cells, two centrosomes act as major microtubule nucleation sites and provide a spatial cue for bipolar spindle formation. In contrast, in acentrosomal cells, such as oocytes, a bipolar spindle forms without canonical centrosomes (Bennabi et al, 2016; Dumont and Desai, 2012; Howe and FitzHarris, 2013; Mogessie et al, 2018; Ohkura, 2015; Radford et al, 2017; Reber and Hyman, 2015). In mouse oocytes, acentriolar microtubule organizing centers (MTOCs) functionally replace centrosomes and serve as major microtubule nucleation sites (Blerkom, 1991; Clift and Schuh, 2015; Maro et al, 1985; Schuh and Ellenberg, 2007). The cytoplasm of oocytes initially carries many MTOCs, which are relocated around chromosomes upon nuclear envelope breakdown (NEBD). Microtubule nucleation from MTOCs leads to the assembly of an apolar microtubule‐based structure called a microtubule ball, which then elongates into a bipolar‐shaped spindle. Concomitant with the spindle elongation, MTOCs are sorted and relocated into the forming spindle poles (Clift and Schuh, 2015; Schuh and Ellenberg, 2007). These processes establish a bipolar‐shaped spindle carrying MTOCs at its two poles.
Spindle elongation and MTOC sorting, two characteristic processes involved in spindle bipolarization, require the concerted action of microtubule regulators (Letort et al, 2019), including the plus‐end‐directed microtubule motor Kif11 (Mailhes et al, 2004; Schuh and Ellenberg, 2007), the microtubule bundle stabilizer HURP (Breuer et al, 2010), the spindle pole‐focusing factor NuMA (Kolano et al, 2012), the minus end‐directed microtubule motor HSET (Bennabi et al, 2018), the intra‐spindle microtubule assembly factor augmin (Watanabe et al, 2016), and the Ndc80 complex (which recruits the antiparallel microtubule crosslinker Prc1 to kinetochores in an oocyte‐specific manner) (Yoshida et al, 2020). Despite increasing knowledge about the molecular mechanisms involved in establishing spindle bipolarity, how spindle elongation and MTOC sorting are precisely controlled remains unclear. The mechanism of spindle bipolarity is important to understand as its instability is a hallmark of error‐prone human oocytes (Haverfield et al, 2017; Holubcová et al, 2015).
Kinetochore–microtubule attachment contributes to the integrity of spindle bipolarity. In centrosomal mitotic cells, the disruption of kinetochore–microtubule attachments can perturb spindle bipolarity, which is pronounced when centrosomal functions are impaired (Lončarek et al, 2007; Moutinho‐Pereira et al, 2013; O’Connell et al, 2009; Toso et al, 2009). In mouse oocytes, mutations and knockdowns that perturb kinetochore–microtubule attachment are often associated with spindle bipolarity defects (Gui and Homer, 2013; Sun et al, 2010, 2011; Woods et al, 1999). However, the precise manipulation of the stability of kinetochore–microtubule attachments has not been comprehensively tested. Unlike somatic cells, where sister kinetochore biorientation and entry to metaphase abruptly stabilize kinetochore–microtubule attachments, in oocytes, the stabilization of kinetochore–microtubule attachment is gradual throughout prometaphase and metaphase (Brunet et al, 1999; Davydenko et al, 2013; Kitajima et al, 2011; Yoshida et al, 2015). How the stabilization of kinetochore–microtubule attachment affects the dynamics of spindle elongation and MTOC sorting has not been quantitatively analyzed.
In this study, we show that the stability of kinetochore–microtubule attachments is required to confine MTOCs at spindle poles and to limit spindle elongation. Our quantitative analysis demonstrates that MTOC sorting is a gradual process. During metaphase, while the majority of MTOCs are positioned at the poles of the bipolar‐shaped spindle, a small population of MTOCs are found in the central region of the spindle until they are eventually sorted to the poles. Reducing the stability of kinetochore–microtubule attachments with a phospho‐mimetic form of Ndc80, a major microtubule‐anchoring protein at kinetochores, causes defects in restricting MTOCs at the spindle poles and in terminating spindle elongation. Stable kinetochore fibers (K‐fibers) are directly connected to MTOCs and to spindle poles. These results suggest the role for stable kinetochore–microtubule attachments in restricting MTOC position and in limiting spindle elongation.
Result and discussion
MTOC sorting is gradual and frequently leaves small MTOCs in the central region of the bipolar‐shaped spindle
To investigate acentrosomal spindle assembly during meiosis I, we used high‐resolution imaging of MTOCs in mouse oocytes. To visualize the dynamics of MTOCs, we tagged the MTOC marker Cep192 (Clift and Schuh, 2015) with mNeonGreen (mNG‐Cep192). We introduced RNAs encoding mNG‐Cep192 and the chromosome marker H2B‐mCherry into mouse oocytes at the germinal vesicle (GV, prophase I‐like) stage and induced meiotic maturation in vitro. The dynamics of MTOCs and chromosomes were recorded with a confocal microscope throughout meiosis I (Movie EV1). We reconstructed the datasets into 3D and manually determined the axis of the spindle at every time point. Side views of the spindle were used to visualize the distribution of MTOCs and chromosomes along the forming spindle axis (Fig 1A). Quantitative analysis showed that the MTOCs gradually moved toward the poles of the bipolarizing spindle until 6 h after NEBD, which coincided with the gradual chromosome congression toward the spindle equator (Fig 1B–D). These observations are consistent with previous reports (Breuer et al, 2010; Clift and Schuh, 2015). We found that even in bipolar‐shaped spindles during metaphase (4–6 h after NEBD; Figs 1E and EV1A), a small population of MTOCs were frequently positioned in the middle region of the spindle (Fig 1A and B). These “central MTOCs” were observed in 79% of oocytes at early metaphase (4 h after NEBD, n = 21) and in 47% of oocytes at mid‐metaphase (6 h, n = 21). Central MTOCs were observed with another MTOC marker mEGFP‐Cdk5rap2 (Fig EV1B). Immunostaining of the MTOC marker pericentrin confirmed the presence of central MTOCs during metaphase (Fig 1F). These observations indicate that MTOC sorting is gradual and continues even in the bipolar‐shaped spindle during metaphase.
Figure 1. Establishment of 4D quantitative analysis for MTOC dynamics.
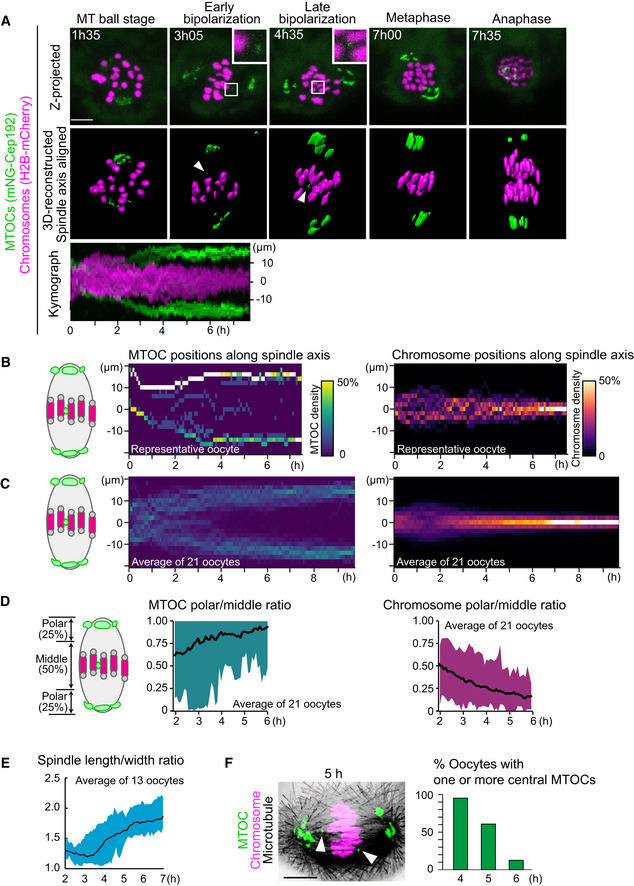
- Live imaging of MTOC dynamics during meiosis I. Z‐projection images (top) show MTOCs (mNG‐Cep192, green) and chromosomes (H2B‐mCherry, magenta). Central MTOCs are magnified (squares). 3D‐reconstructed spindles are aligned with the spindle axis (middle). Central MTOCs are indicated with arrowheads. Time in h:mm. The kymograph (bottom) shows projected signals on the spindle axis for all time points.
- Density maps of MTOCs (left) and chromosomes (right) along the spindle axis in a representative oocyte. The color represents the percentage of MTOCs or chromosome volumes, respectively, coded from dark (0%) to white (50% or more of the total volume).
- Average density maps of 21 oocytes mapped as in (B). Data from six independent experiments are used.
- Dynamics of MTOC sorting and chromosome congression. Ratio of MTOCs (left) or chromosomes (right) in the polar region versus those in the middle region of the spindle are plotted over time.
- Dynamics of spindle elongation. The spindle was visualized with EGFP‐Map4 (Fig EV1). The length/width ratio of the spindle was measured after 3D reconstruction (n = 13 oocytes from three independent experiments).
- Percentage of oocytes carrying one or more MTOCs in the middle region of the spindle. Oocytes were fixed and stained for MTOCs (pericentrin, green), chromosomes (Hoechst33342, magenta), and microtubules (α‐tubulin, gray). n = 21, 28, 24 oocytes. A representative oocyte fixed at 5 h after NEBD is shown. Arrowheads indicate central MTOCs.
Data information: Time after NEBD. Mean ± SD are shown. Scale bars, 10 μm. See also Movie EV1.
Source data are available online for this figure.
Figure EV1. Central MTOCs in the bipolar‐shaped spindle.
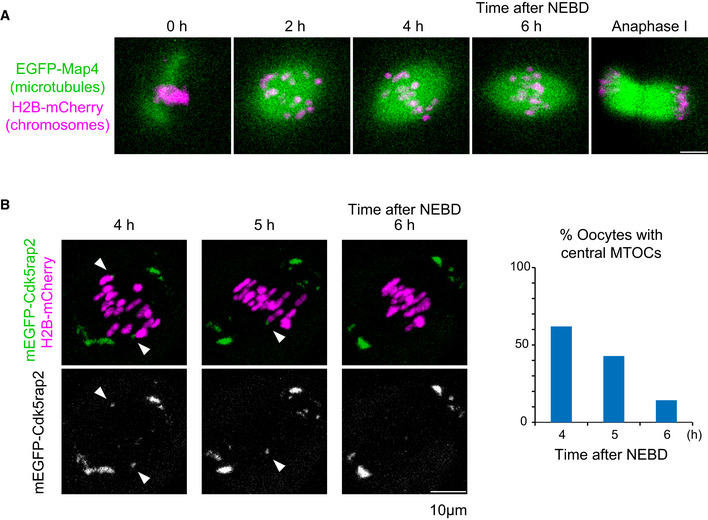
- Live imaging of oocytes expressing EGFP‐Map4 (microtubules, green) and H2B‐mCherry (chromosomes, magenta).
- Live imaging of oocytes expressing mEGFP‐Cdk5rap2 (microtubules, green) and H2B‐mCherry (chromosomes, magenta). Arrowheads indicate central MTOCs. The frequency of oocytes carrying central MTOCs is shown (n = 21 oocytes).
Data information: Scale bars, 10 μm.
Source data are available online for this figure.
A majority of central MTOCs originate from polar regions of the forming spindle
To investigate the origin of central MTOCs, we recorded 4D datasets at a higher temporal resolution to track the dynamics of individual MTOCs (Fig 2A). We selected central MTOCs that were positioned in the middle of the spindle later than 4 h after NEBD and retrospectively analyzed their trajectories during prometaphase (Fig 2B). This analysis revealed that a majority of central MTOCs originated from the poles of the bipolar spindle (n = 21/32, Fig 2C and D). These MTOCs spent substantial periods of time in the middle region of the spindle (an average of 69 min and a maximum of 210 min; n = 21; Fig 2C, Movie EV2) and then relocated either to the original (n = 13/21) or to the opposite pole (n = 8/21, Fig 2E and F). We found that a substantial number of the central MTOCs exhibited correlated motions with a closely positioned kinetochore (< 2 μm) for considerable periods of time up to 60.5 min (Fig EV2, EV3, EV4, EV5, Movies EV3 and EV4), suggesting that central MTOCs can attach to kinetochores. Consistent with this idea, we observed microtubules linking central MTOCs to a closely positioned kinetochore at early metaphase (Fig EV3A). Close positioning of central MTOCs did not significantly affect the stability of kinetochore–microtubule attachments (Fig EV3B) and the levels of phosphorylated Ser55 of Ndc80 (Fig EV3C), a phosphorylation that destabilizes kinetochore–microtubule attachment (Cheeseman et al, 2006; DeLuca et al, 2006). After showing correlated motions with a kinetochore, the MTOCs eventually moved to the original pole or the opposite pole (Fig EV2, EV3, EV4, EV5, Movies EV3 and EV4). These results suggest that central MTOCs can undergo a dynamic cycle of attachment and detachment to kinetochores. These observations indicate that MTOC sorting is highly asynchronous and includes active exchanges of MTOCs between the two forming spindle poles.
Figure 2. Central MTOCs originate from spindle poles.
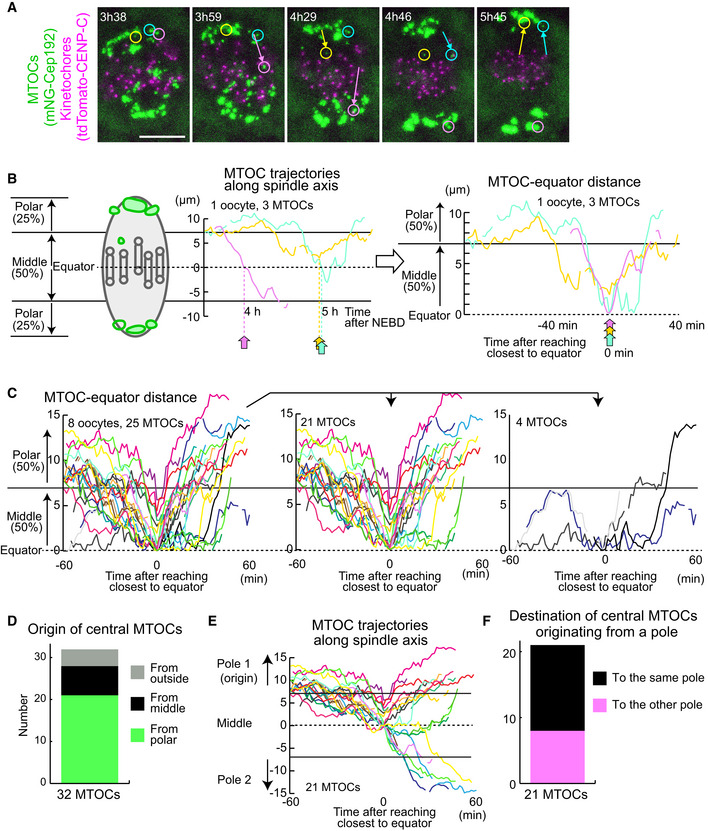
- Live imaging of MTOC and kinetochore dynamics. MTOCs (mNG‐Cep192, green) and kinetochores (tdTomato‐CENP‐C, magenta) in B6D2F1 oocytes are shown. Time in h:mm after NEBD. Circles indicate central MTOCs, which are positioned in the middle region of the spindle later than 4 h after NEBD. Arrows indicate displacement of the MTOCs. Scale bar, 10 μm.
- Tracking analysis of central MTOCs. In the left graph, the positions of central MTOCs in (A) along the spindle axis are shown over time. MTOC positions were used to calculate distance to the spindle equator. In the right graph, lines showing temporal changes in MTOC‐equator distance are aligned based on the time when the MTOC reached a position closest to the spindle equator. Horizontal lines at 7 and at −7 μm denote the thresholds used for the definition of the middle and polar regions of the spindle.
- Central MTOCs originate from spindle poles and transiently stay in the middle region of the spindle. As in (B), the trajectories of central MTOCs (n = 25 MTOCs of 8 oocytes from three independent experiments) were analyzed and their temporal changes in MTOC–equator distance are shown (Left graph). Central MTOCs were categorized into two groups: (1) ones that came from polar regions of the spindle (n = 21, middle graph) and (2) others that stayed in the middle region throughout the period before reaching a position closest to the equator (n = 4, right graph).
- Origin of central MTOCs. Origins were categorized based on the results shown in (C). Note that 7 central MTOCs came from outside of the spindle and are not included in (C).
- Destination of central MTOCs. The tracks of central MTOCs that originated from polar regions were used (n = 21 MTOCs). The pole of origin was defined as Pole 1, while the other pole was defined as Pole 2. MTOC positions along the spindle axis (positive values for those closer to Pole 1) over time are shown. Horizontal lines at 7 and at −7 μm denote the thresholds used for the definition of the middle and polar regions of the spindle. Note that central MTOCs moved back to the original pole (Pole 1) or switched their positions to the opposite pole (Pole 2).
- Destination of central MTOCs that originated from a polar region was categorized as in (E).
Data information: See also Movie EV2.
Source data are available online for this figure.
Figure EV2. Central MTOCs can be positioned close to kinetochores.
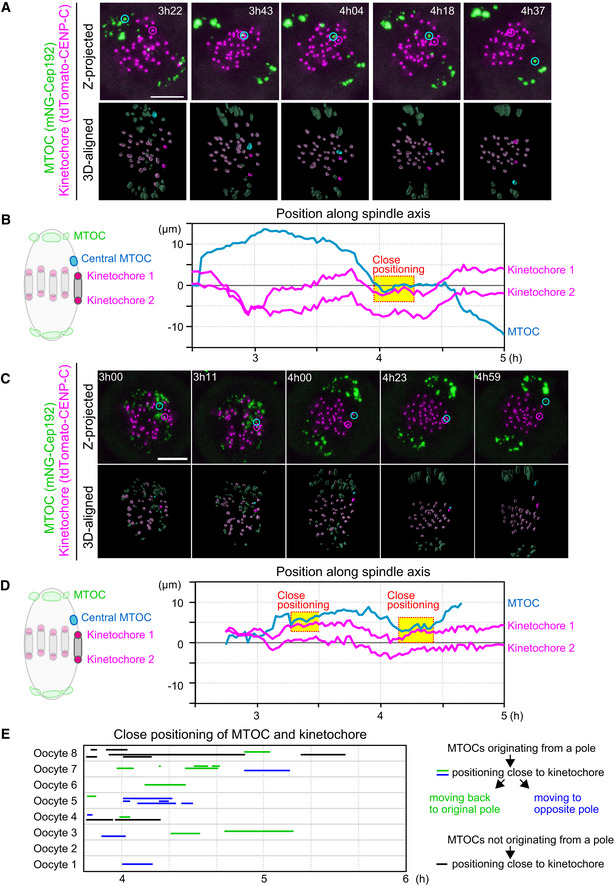
- Live imaging of MTOC and kinetochore dynamics. Z‐projected and 3D‐reconstructed images for MTOCs (mNG‐Cep192, green) and kinetochores (tdTomato‐CENP‐C, magenta) are shown. The 3D‐reconstructed images are aligned based on the spindle axis, with highlights on an MTOC and a pair of kinetochores. Time in h:mm after NEBD. Scale bar, 10 μm. Cyan circles follow an MTOC in the middle of the spindle. Magenta circles follow a kinetochore that transiently positions close to the MTOC.
- Tracking of MTOCs and kinetochores. The positions of MTOCs (cyan) and kinetochores (magenta), which are highlighted in (A), along the spindle axis are shown over time. Time after NEBD. Dotted boxes represent periods when the kinetochore‐MTOC distance was < 2 μm.
- Another example of the image dataset acquired from the experiment shown in (A). Images are presented as in (A).
- The dataset shown in (C) was analyzed and presented as in (B).
- Close positioning of MTOCs and kinetochores is frequently observed. Lines indicate periods when oocytes exhibited close positioning of MTOCs and kinetochores (< 2 μm). We categorized kinetochore‐proximal MTOCs into three groups: (1) MTOCs that originated from a pole, positioned close to a kinetochore, and then moved back to the original spindle pole (green), (2) MTOCs that originated from a pole, positioned close to a kinetochore, and then moved to the opposite spindle pole (blue) and, (3) MTOCs that did not originate from spindle poles and are positioned close to the kinetochore (black).
Data information: See also Movies EV3 and EV4.
Source data are available online for this figure.
Figure EV3. Relationship between central MTOCs and kinetochores.
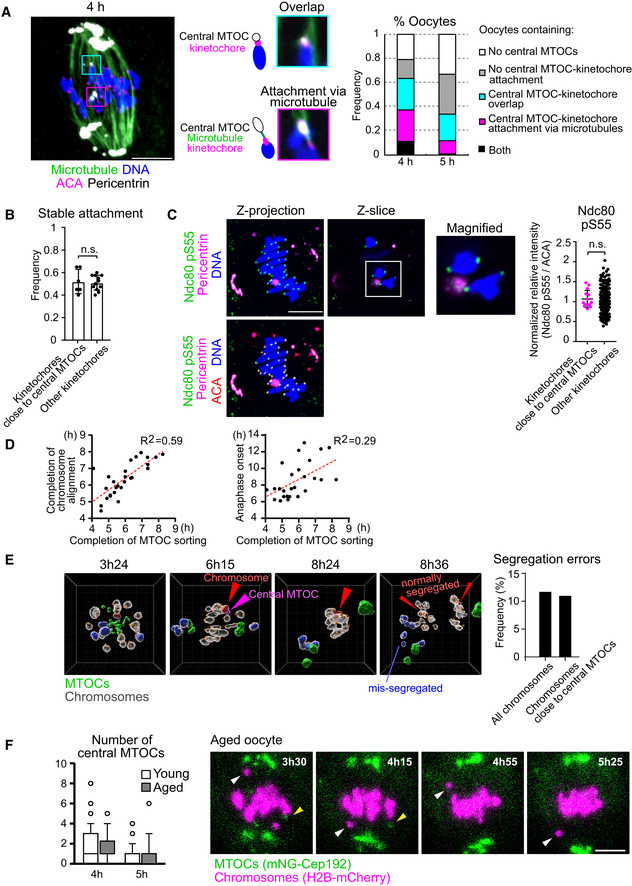
- Central MTOCs can attach to kinetochores. Oocytes at 4 h and 5 h after NEBD were treated with a cold buffer for 5 min before fixation. Cold‐stable microtubules were visualized by immunostaining oocytes for microtubules (α‐tubulin, green), kinetochores (ACA, magenta), pericentrin (gray) and chromosomes (Hoechst33342, blue). Z‐projection images and magnified z‐slices are shown. The frequency of oocytes containing central MTOC–kinetochore attachment and/or overlap is shown (n = 19, 18 oocytes from three independent experiments). Scale bar, 10 μm.
- Close positioning of central MTOCs does not affect stable kinetochore–microtubule attachment. Kinetochores were categorized into two groups: (1) ones that were positioned close to central MTOCs (< 1 μm) and (2) others. The frequency of stable end‐on microtubule attachment on each category is shown (n = 12, 6 oocytes from three independent experiments). Mean ± SD are shown. n.s., not significant by two‐tailed Student’s t‐test.
- Close positioning of central MTOCs does not affect phosphorylated Ser55 of Ndc80. Kinetochores were categorized into two groups: (1) ones that positioned close to central MTOCs (< 1 μm) and (2) others. Relative intensities of phospho‐Ser55 to ACA signals were calculated (n = 266, 14 kinetochores of 7 oocytes from three independent experiments). Mean ± SD are shown. n.s., not significant by two‐tailed Student’s t‐test. Scale bar, 10 μm.
- Temporal correlation of MTOC sorting with chromosome alignment and anaphase onset. Oocytes expressing mNG‐Cep192 and H2B‐SNAP labeled with SNAP‐Cell 647‐SiR or H2B‐mCherry were monitored by live imaging (n = 27 from seven independent experiments). The timings of the removal of all central MTOCs, chromosome alignment, and anaphase onset were determined. Correlation coefficients are shown. Time after NEBD (h).
- Close positioning of central MTOCs and chromosomes does not predict chromosome segregation errors. Oocytes expressing H2B‐SNAP labeled with SNAP‐Cell 647‐SiR (chromosomes), tdTomato‐CENP‐C (kinetochores), and mNG‐Cep192 (MTOCs) were cultured in the presence of 60 nM nocodazole and monitored by live imaging. Images were reconstructed in 3D. MTOCs are shown in green. A central MTOC that transiently positioned close to a chromosome is shown in magenta. This chromosome (shown in red) underwent normal segregation at anaphase. Chromosomes that underwent segregation errors are shown in blue. Other chromosomes are shown in gray. Kinetochore positions are marked with orange spheres. The frequency of segregation errors are shown. All chromosomes (n = 760 chromosomes of 38 oocytes) and chromosomes that positioned close to central MTOCs (n = 9 from 8 oocytes). The unit of the grid is 5 μm. Time after NEBD (h:mm). See also Movie EV5.
- Central MTOCs do not predict chromosome segregation errors in aged oocytes. Oocytes were collected from young (2‐month‐old) and naturally aged mice (17–22 months old). Oocytes expressing mNG‐Cep192 and H2B‐mCherry were monitored by live imaging. The number of central MTOCs was determined at 4 and 5 h after NEBD (n = 40, 22 from three independent experiments). Boxes and whiskers show 25–75 and 10–90 percentiles, respectively. Images for a representative aged oocyte exhibiting prematurely separated chromosomes (white arrowhead) are shown. Yellow arrowheads indicate central MTOCs. Time after NEBD (h:mm). Scale bar, 10 μm.
Source data are available online for this figure.
Figure EV4. Ndc80 phospho‐mutants modify kinetochore–microtubule attachment stability.
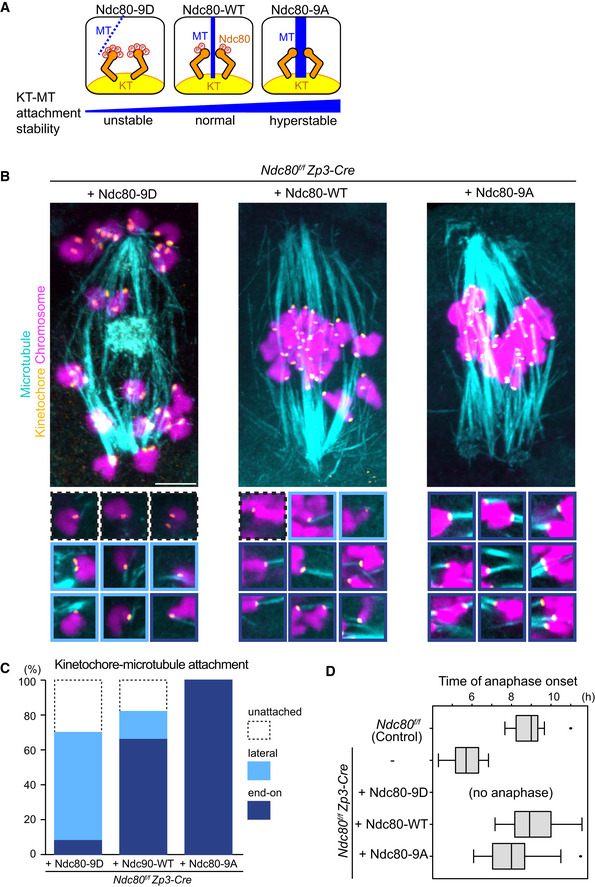
- Schematic representation of kinetochore–microtubule attachment. Phosphorylation levels of the Ndc80 complex at the kinetochore are a determinant of the stability of kinetochore (KT)‐microtubule (MT) attachments. High phosphorylation levels allow unstable attachments such as lateral attachments. Low phosphorylation levels promote stable attachments such as end‐on attachments. Phospho‐mimetic and phospho‐deficient forms of Ndc80 (S4, S5, T8, S15, S44, T49, S55, S62, and S68 were substituted to aspartic acid “Ndc80‐9D” or alanine “Ndc80‐9A”, respectively) can be used as tools to manipulate the stability of kinetochore–microtubule attachments.
- Ndc80 phospho‐mutants modify kinetochore–microtubule attachment stability. Ndc80f/f Zp3‐Cre oocytes were collected and microinjected with RNAs of wild‐type (Ndc80‐WT), phospho‐mimetic (Ndc80‐9D) or phospho‐deficient (Ndc80‐9A) forms of Ndc80. Cold‐stable microtubules were visualized by immunostaining oocytes 7 hours after NEBD for microtubules (α‐tubulin, cyan), kinetochores (ACA, orange), and chromosomes (Hoechst33342, magenta). Z‐projection images are shown. Magnified images of kinetochores are categorized: end‐on attachments (dark blue box), lateral attachments (light blue box), and unattached (dot‐lined box). Scale bar, 10 μm.
- Percentages of kinetochore–microtubule attachments in (B). All kinetochores were analyzed (n = 200 kinetochores of 5 oocytes from two independent experiments).
- Anaphase entry timing. Ndc80f/f (Ndc80‐intact) oocytes are used as a control. Ndc80f/f Zp3‐Cre (Ndc80‐deleted) oocytes expressing Ndc80‐WT, Ndc80‐9D, or Ndc80‐9A were monitored with the chromosome marker H2B‐mCherry (n = 15, 25, 25, 42, and 55 oocytes, respectively, from at least 3 independent experiments). Time after NEBD. Note that Ndc80f/f Zp3‐Cre oocytes expressing no Ndc80 construct exhibited an accelerated anaphase onset that is consistent with defects in the spindle checkpoint. Ndc80‐9D‐expressing oocytes did not undergo anaphase, consistent with spindle checkpoint activation by unstable kinetochore–microtubule attachments. Ndc80‐9A‐expressing oocytes tended to exhibit an earlier anaphase onset, in agreement with accelerated checkpoint satisfaction by stable kinetochore–microtubule attachments. Boxes show 25–75 percentiles and whiskers encompass data points within 1.5 times the interquartile range.
Source data are available online for this figure.
Figure EV5. Kinetochore–microtubule attachment stability is not absolutely required for bipolar microtubule organization.
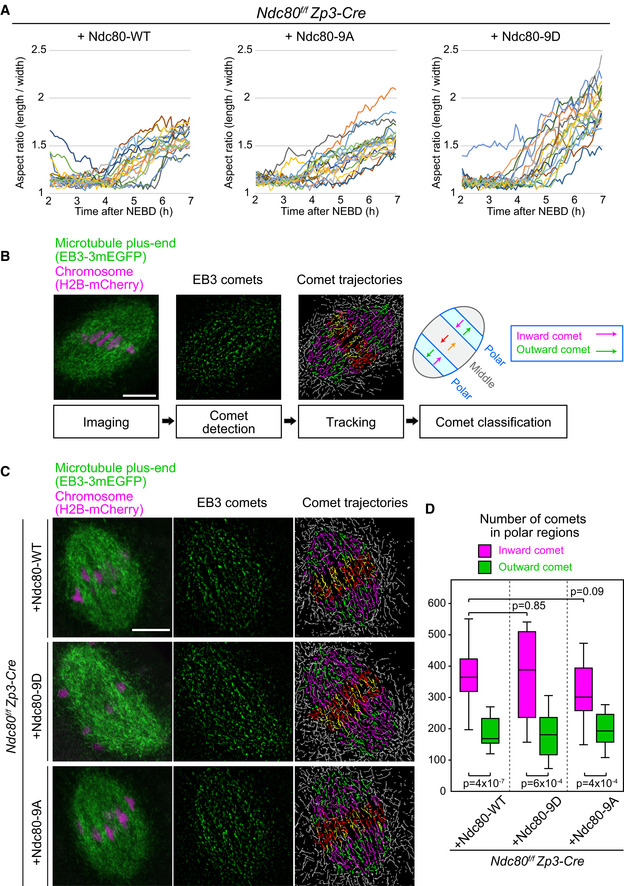
- Ndc80‐9D‐expressing oocytes do not exhibit increased collapse in spindle shape. Microtubules (EGFP‐Map4) and chromosomes (H2B‐mCherry) were visualized in Zp3‐Cre Ndc80f/f oocytes injected with Ndc80‐WT, Ndc80‐9D, or Ndc80‐9A. The aspect ratio (length/width) of 3D‐reconstructed spindles was measured over time (n = 18, 18, and 18 oocytes, respectively, from three independent experiments; identical to the dataset shown in Fig 4).
- Experimental pipeline for the quantification of microtubule organization. Oocytes were imaged with the microtubule plus‐end marker EB3‐3mEGFP (green) and the chromosome marker H2B‐mCherry (magenta) at 5 h after NEBD. The comets of EB3‐labeled microtubule plus‐ends were detected following image processing for peak enhancement and background subtraction. The comets were tracked to visualize their movements. The spindle was divided into 21 equal regions between the two spindle poles along the spindle axis, and divisions 4–6 and 16–18 were defined as polar regions. In the polar regions, comets moving toward the inside of the spindle were categorized as inward comets (magenta lines), and the others as outward comets (green lines). Inward comets were predominant in the polar regions of the spindle, which represents bipolar microtubule organization.
- EB3 dynamics are largely unaffected by kinetochore–microtubule stability. Zp3‐Cre Ndc80f/f oocytes expressing Ndc80‐WT, Ndc80‐9D, or Ndc80‐9A were analyzed as in (B).
- EB3 dynamics are not significantly affected. Total number of comets going inwards and outwards in the polar regions of the spindle (n = 14, 13, 16 oocytes from at least two independent experiments) is shown. Welch’s t‐test was performed. Boxes show 25–75 percentiles, and whiskers encompass data points within 1.5 times the interquartile range.
Data information: Scale bars, 10 μm. See also Movie EV9.
Source data are available online for this figure.
Central MTOCs do not predict chromosome segregation errors
These observations led us to investigate potential links between central MTOCs and chromosome segregation errors in oocytes. The time when the last central MTOC moved to a pole was correlated with the completion of chromosome alignment and with the onset of anaphase (Fig EV3D), consistent with the idea that central MTOCs pose a problem for chromosome segregation. However, we observed no chromosome segregation errors under our imaging condition (0/16 oocytes), which indicated that central MTOCs did not cause chromosome segregation errors in normal cultures.
To artificially induce chromosome segregation errors, we treated oocytes with low‐dose (60 nM) nocodazole, a microtubule depolymerizer. Chromosome tracking analysis showed that ~12% of all chromosomes underwent segregation errors (90/760 chromosomes from 38 oocytes; Fig EV3E and Movie EV5). In this dataset, we detected 9 chromosomes that transiently exhibited correlated motions with a closely positioned kinetochore during metaphase. Only 1 of such chromosomes underwent chromosome segregation error (1/9 chromosomes, ~11%; Fig EV3E). Thus, under this experimental condition, central MTOCs positioned close to chromosomes did not predict chromosome segregation errors.
Chromosome segregation errors can also be induced by maternal aging. We found no significant increase in the frequency of the appearance of central MTOCs in naturally aged (17–22‐month‐old) oocytes, compared to young (2‐month‐old) oocytes (Fig EV3F). In aged oocytes, premature chromosome separation precedes the majority of segregation errors, and prematurely separated chromosomes can be characterized by their rapid oscillations between spindle poles (Sakakibara et al, 2015). However, we observed no preferential positioning of central MTOCs close to chromosomes exhibiting rapid oscillations (n = 7 oocytes) (Fig EV3F). Thus, aging‐associated chromosome segregation errors cannot be predicted by the appearance of central MTOCs.
Phospho‐mutants of Ndc80 affect the stability of kinetochore–microtubule attachment
We recently reported that kinetochores promote acentrosomal spindle bipolarization during meiosis I (Yoshida et al, 2020). We therefore hypothesized that kinetochore–microtubule attachments play a role in MTOC sorting and the dynamics of central MTOCs. During meiosis I in oocytes, kinetochore–microtubule attachments become gradually stabilized by the dephosphorylation of kinetochore substrates including Ndc80, which is accompanied by the gradual conversion from relatively unstable lateral kinetochore–microtubule attachments to stable end‐on attachments (Brunet et al, 1999; Davydenko et al, 2013; Kitajima et al, 2011; Yoshida et al, 2015). To manipulate the stability of kinetochore‐microtubule attachments in oocytes, we replaced endogenous Ndc80 with the mutant versions Ndc80‐9D (phospho‐mimetic) and Ndc80‐9A (phospho‐deficient) (Guimaraes et al, 2008) by expressing those mutant forms in oocytes harvested from Ndc80f/f Zp3‐Cre mice (Ndc80‐deleted oocytes) (Yoshida et al, 2020; Fig EV4A). To examine the stability of kinetochore‐microtubule attachments, we visualized cold‐stable microtubules at metaphase, a time when both lateral and end‐on kinetochore‐microtubule attachments were observed in control oocytes (Fig EV4B and C, “+ Ndc80‐WT”). As expected, Ndc80‐9D‐expressing oocytes exhibited a significant decrease in end‐on kinetochore–microtubule attachments (Fig EV4B and C, “+ Ndc80‐9D”). Consistent with this observation, Ndc80‐9D‐expressing oocytes did not enter anaphase I by 14 h after NEBD (n = 25), while anaphase I entry was observed in 75% of Ndc80‐WT‐expressing oocytes by that time (n = 33). In contrast, Ndc80‐9A expression significantly increased end‐on kinetochore‐microtubule attachments and accelerated the onset of anaphase I (Fig EV4D). These results confirm that the stability of kinetochore‐microtubule attachments is decreased in Ndc80‐9D‐expressing oocytes, whereas their stability is increased in Ndc80‐9A‐expressing oocytes.
Ndc80 phospho‐regulation is critical for controlling MTOC positions
Using Ndc80‐9D and Ndc80‐9A as tools to manipulate the stability of kinetochore–microtubule attachments, we addressed their effects on MTOC sorting and the dynamics of central MTOCs during spindle bipolarization. Investigation of MTOC dynamics using our quantitative analysis pipeline revealed that Ndc80‐9D‐expressing oocytes failed to maintain MTOCs at the spindle poles (Fig 3A, Movies EV6 and EV7). Although MTOCs tended to be positioned at the poles of the forming spindle during the early phases of MTOC sorting (2–4 h after NEBD), they failed to maintain their positions at the spindle poles during the later phases (later than 4 h; Fig 3A and B). MTOCs that detached from the spindle poles frequently shuttled between the two poles (Fig 3B, Movie EV7), suggesting that spindle microtubules are dynamic but are incapable of properly sorting MTOCs. These defects resulted in the formation of spindles devoid of MTOCs at both poles (Fig 3C). In contrast to Ndc80‐9D‐expressing oocytes, Ndc80‐9A‐expressing oocytes did not exhibit any obvious defects in MTOC positions at late metaphase (Fig 3A–C). However, quantitative analysis revealed that Ndc80‐9A‐expressing oocytes exhibited significantly fewer central MTOCs compared to Ndc80‐WT‐expresing oocytes at early metaphase (Fig 3D). These results suggest that, at early metaphase, the phosphorylated state of Ndc80 promotes the appearance of central MTOCs. At late metaphase, the dephosphorylated state of Ndc80, which increases the stability of kinetochore–microtubule attachments, is required to restrict MTOC positions at spindle poles.
Figure 3. Kinetochore–microtubule attachment stability is required to confine MTOCs at spindle poles.
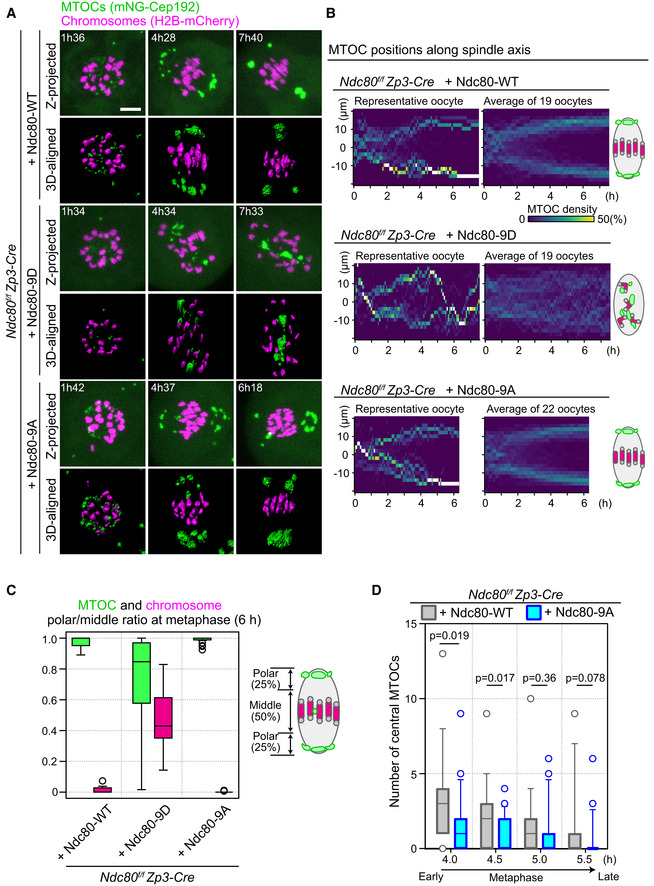
- Live imaging of Zp3‐Cre Ndc80f/f oocytes injected with Ndc80‐WT, Ndc80‐9D, or Ndc80‐9A. Z‐projection and 3D‐reconstructed images show MTOCs (mNeonGreen‐Cep192, green) and chromosomes (H2B‐mCherry, magenta). Time in h:mm after NEBD. Scale bar, 10 μm.
- Ndc80‐9D is defective for MTOC sorting. The density map of MTOCs along the spindle axis in Zp3‐Cre Ndc80f/f oocytes expressing Ndc80‐WT, Ndc80‐9D, or Ndc80‐9A. The color represents the percentage of MTOC volume coded from dark (0%) to white (50% or more of the total volume).
- MTOCs do not accumulate at the spindle poles in Ndc80‐9D‐expressing oocytes. Ratio of MTOCs (green) or chromosomes (magenta) in the polar region versus those in the middle region of the spindle at 6 hours after NEBD (n = 19, 19, and 22 oocytes, respectively, from at least three independent experiments). Boxes show 25–75 percentiles, and whiskers encompass data points within 1.5 times the interquartile range.
- Ndc80‐9A decreases central MTOCs. The number of central MTOCs (MTOCs that were positioned in the middle region of the spindle as shown in (C)) was determined at each time point (n = 19, 21 oocytes, respectively, from at least 3 independent experiments). Two‐tailed Student’s t‐test was performed. Boxes and whiskers show 25–75 and 10–90 percentiles, respectively.
Data information: See also Movies EV6 and EV7.
Source data are available online for this figure.
Dephosphorylation of Ndc80 is not required for initiating but is required for terminating spindle elongation
We next addressed whether the defects of Ndc80‐9D for MTOC positioning are associated with spindle elongation defects, as centrosomes strongly affect spindle shape and bipolarity in centrosomal cells (Ganem et al, 2009). We quantified temporal changes in spindle shape in 3D with live imaging of the microtubule marker EGFP‐Map4 (Schuh and Ellenberg, 2007; Fig 4A, Movie EV8). Ndc80‐9D‐expressing oocytes had no significant delay in the onset of spindle elongation, but had significantly faster kinetics of elongation compared to Ndc80‐WT‐ and Ndc80‐9A‐expressing oocytes (Fig 4B). Furthermore, in Ndc80‐9D‐expressing oocytes, the spindle failed to terminate its elongation after reaching a proper size (Fig 4B). The spindle length reached 37.3 ± 3.2 μm in Ndc80‐9D‐expressing oocytes at 7 h after NEBD, which was significantly larger than spindle lengths observed in Ndc80‐WT‐ and Ndc80‐9A‐expressing oocytes (32.3 ± 3.1 μm and 33.2 ± 3.0 μm, respectively) (Fig 4C). Despite the absence of restricted positioning of MTOCs at poles, the bipolar shape of the spindles of Ndc80‐9D‐expressing oocytes did not undergo a severe collapse (Fig EV5A). These results demonstrate that Ndc80 dephosphorylation is dispensable for making a bipolar‐shaped spindle but is required for limiting spindle elongation.
Figure 4. Kinetochore–microtubule attachment stability is not required for initiating but is required for terminating spindle elongation.
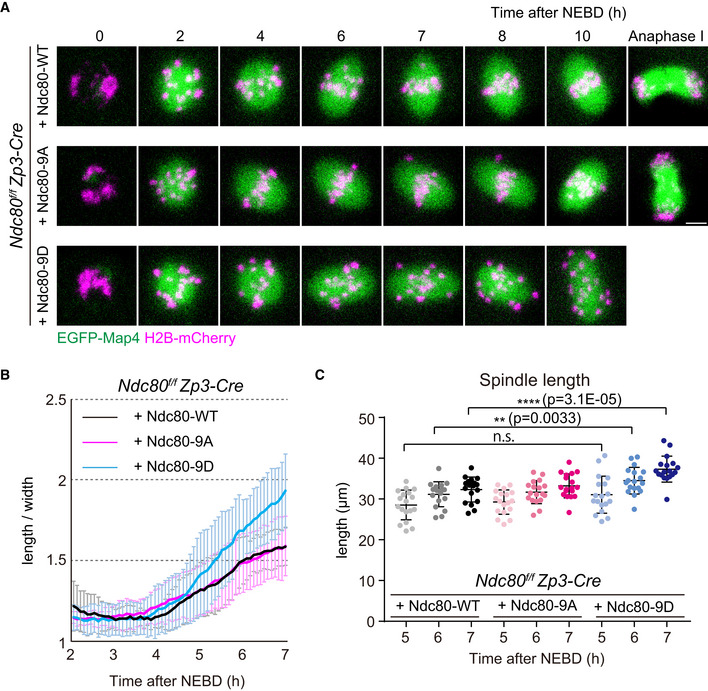
- Live imaging of Zp3‐Cre Ndc80f/f oocytes injected with Ndc80‐WT, Ndc80‐9D or Ndc80‐9A. Z‐projection and 3D‐reconstructed images show microtubules (EGFP‐Map4, green) and chromosomes (H2B‐mCherry, magenta). Scale bar, 10 μm.
- Ndc80‐9D is defective for limiting spindle elongation. The aspect ratio (length/width) of 3D‐reconstructed spindles was measured over time (n = 18, 18, and 18 oocytes, respectively, from three independent experiments).
- Ndc80‐9D causes excessive spindle elongation. Spindle lengths measured after 3D reconstruction are shown (n = 18, 18, and 18 oocytes, respectively, from three independent experiments). Two‐tailed Student’s t‐test was performed. **P < 0.01, ****P < 0.0001.
Data information: Means ± SD are shown. See also Movie EV8.
Source data are available online for this figure.
The spindle in Ndc80‐9D‐expressing oocytes has a largely bipolar microtubule organization, despite the lack of MTOCs at the poles
Next, we tested whether bipolar‐shaped spindles devoid of MTOCs at their poles, which are observed in Ndc80‐9D‐expressing oocytes, are capable of maintaining a bipolar microtubule organization. To quantify microtubule organization, we tagged the microtubule plus‐end marker EB3 (Schuh and Ellenberg, 2007) with three copies of mEGFP (EB3‐3mEGFP) and co‐expressed it with the chromosome marker H2B‐mCherry. The dynamics of microtubule plus‐ends and chromosomes were recorded on a single‐plane with confocal microscopy at 5 h after NEBD (Fig EV5B and Movie EV9). Our image processing pipeline allowed us to track microtubule plus‐end comets, which was used to determine their directionality (toward one pole or the other) and position (the middle region or polar regions) in the spindle (Fig EV5B). That analysis revealed that the spindles of Ndc80‐9D‐expressing oocytes had a largely bipolar microtubule organization (Fig EV5C). In Ndc80‐9D‐expressing oocytes, the polar regions of the spindles exhibited significantly more comets moving toward the inside of the spindle (“inward”), compared to those moving toward the spindle pole (“outward”), as observed in control and in Ndc80‐WT‐expressing oocytes (Fig EV5C and D). Thus, the dephosphorylation of Ndc80 is not absolutely essential for the bipolar organization of microtubules in the spindle.
Stable kinetochore fibers are directly connected to MTOCs and extend to the spindle poles
To gain insights into how stable kinetochore–microtubule attachments restrict MTOC position and spindle elongation, we investigated stable microtubules attached to kinetochores (K‐fibers). High‐resolution confocal imaging of metaphase spindles revealed that a substantial population of K‐fibers were directly connected to MTOCs and extended to the end of the spindle poles (Fig 5A). Quantification demonstrated that 84 ± 9% of MTOCs were attached to K‐fibers (Fig 5B). The average length of K‐fibers was 11.2 ± 2.4 μm, which corresponded to 85 ± 17% of the distance between kinetochores and a spindle pole (Fig 5C). These results suggest that stable kinetochore–microtubule attachments regulate MTOC position and spindle elongation through K‐fibers.
Figure 5. Model showing how kinetochore–microtubule attachments contribute to acentrosomal spindle bipolarization.
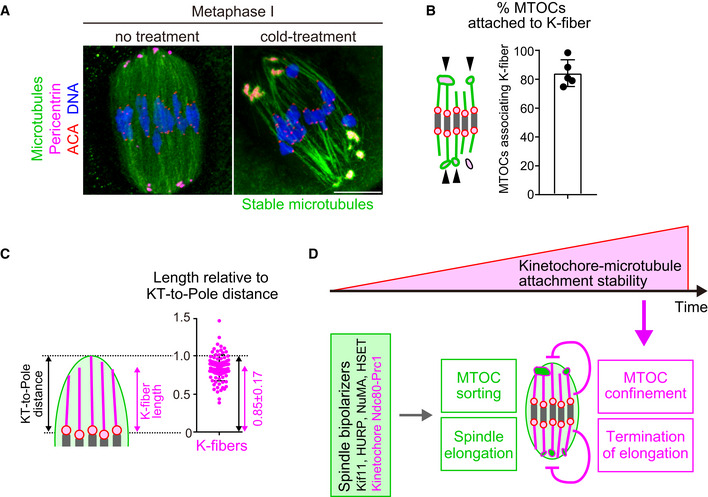
- K‐fibers are connected to MTOCs and extend to spindle poles. Oocytes 6 hours after NEBD were fixed following cold treatment. Microtubules (α‐tubulin, green), MTOCs (pericentrin, magenta), kinetochores (ACA, red), and DNA (Hoechst333342) are shown. Five oocytes from two independent experiments were analyzed. Scale bar, 10 μm.
- A majority of MTOCs are attached to K‐fibers. The volumes of individual MTOCs were measured after 3D reconstruction. The sum volume of MTOCs attached to K‐fibers relative to the total volume of MTOCs was calculated for each oocyte (n = 5 oocytes from two independent experiments). Means and SD are shown.
- K‐fibers extend to spindle poles. The length of K‐fibers and distance between kinetochores and a spindle pole (KT‐to‐Pole distance) were measured. K‐fiber length relative to the KT‐to‐Pole distance was calculated (n = 90 K‐fibers of 5 oocytes from two independent experiments).
- Model summarizing the results of this study. In early phases of acentrosomal spindle assembly, spindle bipolarizers, including Kif11, HURP, NuMA, HSET, and the kinetochore Ndc80 complex that recruits Prc1, establish spindle bipolarity by promoting MTOC sorting and spindle elongation. Meanwhile, the stability of kinetochore–microtubule attachments gradually increases, depending on the dephosphorylation of kinetochore components including Ndc80. As spindle bipolarity is established, stable kinetochore–microtubule attachments spatially confine MTOCs at spindle poles and limit spindle elongation.
Source data are available online for this figure.
The findings of this study, together with recent studies, suggest a model for how kinetochore–microtubule attachments contribute to proper acentrosomal spindle assembly (Fig 5D). Acentrosomal spindle assembly is triggered by the activation of microtubule nucleation from MTOCs. Nucleated microtubules initially form an apolar ball‐like structure, which then undergoes spindle elongation depending on the action of microtubule regulators including Kif11, HURP, NuMA, HSET and the kinetochore Ndc80 complex that recruits Prc1 (Breuer et al, 2010; Kolano et al, 2012; Mailhes et al, 2004; Schuh and Ellenberg, 2007; Yoshida et al, 2020). Those spindle bipolarizers promote MTOC sorting and spindle elongation. In parallel, the stabilization of kinetochore–microtubule attachments depends on dephosphorylation of the Ndc80 complex, which is promoted by Cdk1 activity that promotes the BubR1‐mediated recruitment of PP2A‐B56 phosphatase to centromeres (Davydenko et al, 2013; Yoshida et al, 2015). The stabilization of kinetochore–microtubule attachments is gradual, as Cdk1 activity gradually increases throughout prometaphase and metaphase (Brunet et al, 1999; Davydenko et al, 2013; Kitajima et al, 2011; Yoshida et al, 2015). Stable kinetochore–microtubule attachments start to appear when the spindle becomes bipolarized and thus initiates elongation (Davydenko et al, 2013; Kitajima et al, 2011; Yoshida et al, 2015). Spindle bipolarization allows the full stabilization of kinetochore–microtubule attachments by generating tension across the chromosome (Vallot et al, 2018; Yoshida et al, 2015). At later stages of spindle bipolarization, stable kinetochore–microtubule attachments spatially confine MTOCs at the poles of the spindle and terminate spindle elongation. Understanding how stable kinetochore–microtubule attachments mediate these functions requires future studies. K‐fibers are distinctively long (36.5 ± 7.4% of the spindle length) compared to typical spindle microtubules (5–27% of the spindle length in kinetochore‐free extracts of Xenopus eggs) (Brugués et al, 2012) and are directly connected to polar MTOCs and extend to the spindle poles. Stable kinetochore–microtubule attachments enable K‐fibers to anchor MTOCs, which may serve as a measure that properly adjusts the distance from kinetochores on aligned chromosomes to MTOCs at the spindle poles. K‐fibers may act as a scaffold that inactivates spindle bipolarizers or mediate forces that prevent excess spindle elongation, in a length‐dependent manner. Alternatively, but not mutually exclusively, K‐fibers may prevent chromosome‐mediated activation of microtubule nucleation at undesirable locations by maintaining chromosome alignment at the spindle equator. Whether stable kinetochore–microtubule attachments regulate MTOC position and spindle elongation independently of chromosome alignment should be investigated in future studies.
Ndc80‐9D‐expressing oocytes can form a bipolar‐shaped spindle that lack bipolar positioning of MTOCs but has a largely bipolar microtubule organization. The dispensability of polar MTOCs for overall spindle bipolarity is in contrast to the essentiality of bipolar positioning of centrosomes for the spindle in centrosomal cells (Ganem et al, 2009). The dispensability of bipolar positioning of MTOCs for the bipolar shape of spindles is consistent with a previous report that the simultaneous inhibition of Kif11 and dynein allows the formation of bipolar‐shaped spindles without MTOC splitting into two poles (Clift and Schuh, 2015). Although MTOCs are observed in oocytes of diverse animal models, including flies (Skold et al, 2005), worms (Connolly et al, 2015), frogs (Gard, 1992), and mice (Blerkom, 1991; Maro et al, 1985; Schuh and Ellenberg, 2007), MTOCs have not been detected in human oocytes (Holubcova et al, 2015). In mouse oocytes, although microtubules are predominantly nucleated at MTOCs during the early stages of spindle assembly (prior to the microtubule ball stage; Schuh and Ellenberg, 2007), microtubule nucleation in later stages may not be determined by MTOCs but rather largely attributed to nucleation within the spindle (Watanabe et al, 2016). Previous studies showed that defects in MTOC sorting are associated with spindle instability and chromosome segregation errors (Breuer et al, 2010; Kolano et al, 2012). It is thus likely that MTOC positioning at the spindle poles is critical for the robustness of acentrosomal spindles.
In a previous study, the expression of Ndc80‐9A following morpholino‐mediated knockdown of endogenous Ndc80 led to severe defects in spindle morphology (Gui and Homer, 2013). Such severe defects were not observed in our experimental system using Ndc80‐9A expression in oocytes after Zp3‐Cre‐mediated Ndc80 gene knockout. These apparent discrepancies may result from differences in depletion levels of Ndc80 protein or in the use of long‐term in vitro cultures between the two experimental systems. While that previous study depleted Ndc80 protein by culturing oocytes in vitro for 2 days after morpholino introduction (60–70% protein depletion) (Gui and Homer, 2013), our study achieved protein depletion by maintaining oocytes in vivo for > 10 days after gene knockout by Zp3‐Cre (> 90% protein depletion) (Yoshida et al, 2020). Our observation that Ndc80 replacement with Ndc80‐9D rather than with Ndc80‐9A had detrimental defects in chromosome alignment is consistent with previous observations in somatic cells (DeLuca et al, 2011; Tooley et al, 2011).
MTOC sorting is gradual and lagging MTOCs are frequently observed in the central region of bipolar‐shaped spindles during metaphase. Unstable kinetochore–microtubule attachments, which are predominant at early metaphase (Yoshida et al, 2015), promotes the appearance of central MTOCs. The significance of central MTOCs remains unclear. It is unlikely that central MTOCs by themselves can cause chromosome segregation errors, since the vast majority of chromosomes that are positioned close to central MTOCs at metaphase result in normal segregation at anaphase. Although microtubules can connect the central MTOCs to kinetochores at early metaphase, such connections may be removed by active error corrections of kinetochore–microtubule attachments by late metaphase (Lane and Jones, 2014; Yoshida et al, 2015; Vallot et al, 2018). Future development of tools to manipulate MTOC positions will allow for studies to investigate the significance of central MTOCs.
We previously showed that the Ndc80 complex is essential for spindle bipolarization during meiosis I in oocytes (Yoshida et al, 2020). The Ndc80 complex recruits the antiparallel microtubule crosslinker Prc1, which promotes spindle bipolarization, independently of kinetochore–microtubule attachments (Yoshida et al, 2020). Thus, the Ndc80 complex plays at least two roles in spindle bipolarity: (1) it promotes spindle bipolarization by recruiting Prc1, and (2) it confines MTOC positions at the spindle poles and limits spindle elongation by anchoring stable kinetochore–microtubule attachments. The latter function, described in this study, allows the cooperation of kinetochore‐based mechanisms and MTOC dynamics to fine‐tune acentrosomal spindle bipolarity.
Materials and Methods
Ethics statement
Experiments using mice were approved by the Institutional Animal Care and Use Committee at RIKEN Kobe Branch (IACUC). B6D2F1 (wild‐type), C57BL/6NCrSlc (wild‐type), Ndc80f/f and Ndc80f/f Zp3‐Cre (C57BL/6 background; Yoshida et al, 2020) female mice, 8–12 weeks of age, were used to obtain oocytes. Aged oocytes were obtained from female B6D2F1 mice, 17–22 months of age.
Oocyte culture and in vitro maturation
Mice were injected with 0.1 ml (5 IU) of pregnant mare serum gonadotrophin (PMSG) or 0.1 ml of CARD HyperOva (KYUDO). Oocytes at the GV stage were recovered 44–48 h later by puncturing ovaries in M2 medium supplemented with 200 nM 3‐isobutyl‐1‐methyl‐xanthine (IBMX). Cumulus cells were removed by pipetting the oocytes with a mouth glass pipette. Microinjection was carried out in M2 medium supplemented with IBMX. Resumption of meiotic maturation was induced by washing oocytes with M2 medium at least three times. Oocytes underwent NEBD within 45–75 min.
Microinjection
mRNAs were synthesized using an mMESSAGE mMACHINE T7 kit (Thermo Fisher Scientific) and were purified at a final concentration of 1.0–1.5 μg/μl. PCR‐based mutagenesis was performed to generate Ndc80‐9D and Ndc80‐9A, which carry aspartic acid and alanine mutations, respectively, at Ser4, Ser5, Thr8, Ser15, Ser44, Thr49, Ser55, Ser62, and Ser68 of Ndc80. mRNAs were microinjected into GV stage oocytes in M2+IBMX medium covered with mineral oil, on a heating plate (Tokai‐hit) at 37°C equipped with an inverted microscope (IX71, Olympus), using micromanipulators (Narishige) and a piezo unit (Prime tech). Microinjection volumes were 4–6 pl for H2B‐mCherry (diluted at 1:50 with water), Ndc80 (diluted at 1:4), mNG‐Cep192 (diluted at 1:20), tdTomato‐CENP‐C (diluted at 1:17), mEGFP‐Cdk5rap2 (diluted at 1:10), EGFP‐Map4 (diluted at 1:2), and EB3‐3mEGFP (diluted at 4:5). For 3‐color live imaging shown in Fig EV3D and E, 5–7 pg of H2B‐SNAP and mNG‐Cep192 mRNAs and 2 pg of tdTomato‐CENP‐C mRNA were used. Oocytes were incubated for 3–4 h in M2+IBMX medium before resumption of meiotic maturation was induced.
Live imaging of MTOCs, spindles, and kinetochores
Oocytes were imaged using a Zeiss LSM710/780/880 confocal microscope equipped with a 40× water‐immersion C‐Apochromat 1.2 NA objective (Zeiss) at 37°C in M2 medium. The microscope was controlled using Zen black software (Zeiss). Oocytes were tracked using the macro provided by Dr. Jan Ellenberg at EMBL Heidelberg (Politi et al, 2018). Pinhole size was adjusted to acquire 1.5–3.0‐µm‐thick confocal sections. Z‐stacks were acquired with 0.9–4.0 µm intervals between z‐slices. mEGFP and mNeonGreen were excited with a 488‐nm argon laser. mCherry and tdTomato were excited using a 561‐nm DPSS laser.
Immunostaining
Oocytes were fixed with 1.6% paraformaldehyde (pre‐warmed at 37°C) for 30 min at room temperature, followed by permeabilization for 15 min in PBS plus 0.2% Triton‐X100 (0.2% PBT) (Fig 1F) or for overnight in 0.1% PBT (Figs 5 and EV3A–C). In experiments to visualize cold‐stable microtubules, we pre‐cooled 200 μl M2 medium in a 1.5 ml tube on ice for at least 20 min, transferred oocytes into the medium and then incubated them for 5 min (Fig EV3A), 7 min (Fig EV4B), or 10 min (Fig 5) on ice before fixation. Oocytes were then blocked with 3% BSA in 0.1% PBT at room temperature for at least 15 min (up to 2 h) and incubated at 4°C overnight with primary antibodies. Oocytes were subsequently incubated with secondary antibodies for 2 h at room temperature. Hoechst33342 (Molecular Probes) was added at 1:2,000 in PBS + 1% BSA. The primary antibodies used were anti‐pericentrin (mouse, 611814, BD Transduction Laboratories, 1:500), anti‐alpha‐Tubulin (rat, YL1/2, MCA77G, Bio‐Rad, 1:2,000 (Fig 5) or 1:10,000 (other figures); or mouse, DM1A, T6199, Sigma, 1:500), and ACA (human, 15‐234, Antibodies Incorporated, 1:200 (Fig 5) or 1:500 (other figures). Secondary antibodies used were Alexa Fluor 488 goat anti‐mouse IgG (H+L) (A11029); goat anti‐rat IgG (H+L) (A11006); Alexa Fluor 555 goat anti‐mouse IgG (H+L) (A28180); goat anti‐human IgG (H+L) (A21433); Alexa Fluor 647 donkey anti‐mouse IgG (H+L) (A31571) (Molecular Probes, 1:500 (Fig 5) or 1:200 (other figures)).
Fixed oocytes were imaged using a Zeiss LSM780 confocal microscope equipped with a 40× water‐immersion C‐Apochromat 1.2 NA objective (Zeiss) at a constant temperature (25°C). The microscope was controlled using Zen Black software (Zeiss). Pinhole size was adjusted to acquire 1‐µm‐thick optical sections. Z‐stacks were acquired with 0.5 µm intervals between z‐slices. A 405‐nm diode laser, a 488‐nm argon laser, a 561‐nm DPSS laser, a 633‐nm HeNe laser were used for exciting Alexa Fluor 488, 555, and 633/647, respectively.
Image analysis
Microtubule organizing centers, spindle, and chromosome signals were reconstructed into 3D using Imaris software (Bitplane). For every time point, the spindle axis was manually defined based on the spindle shape or MTOC distribution. For earlier time points before spindle axis establishment, the same axis as that of early metaphase (immediately after spindle axis establishment) was used. To generate kymographs and density maps of MTOCs and chromosomes, the intensities of their signals or the volumes of 3D‐reconstructed objects were projected onto the spindle axis for each time point, using Fiji (Schindelin et al, 2012). In kymographs, the positions of two poles were manually determined and were used to define the center of the spindle axis. In the density maps, the center of mass of chromosomes was used as the center of the spindle.
MTOC and kinetochore tracking pipeline
Microtubule organizing centers and kinetochore positions were detected using the spot function of Imaris software (Bitplane) and were manually verified. These positions were then used for the tracking function of Imaris, and the resultant tracks were manually verified. The spindle axis for each time point was defined based on the distribution of MTOCs. The spot positions of the tracks and the orientation of the spindle axis were exported to R software. The positions of MTOCs and kinetochores along the spindle axis were calculated with R. The distance between each kinetochore pair and MTOCs was calculated in 3D with R. Individual MTOC and kinetochore pairs trajectory could then be extracted using R for each middle MTOC. For experiments to determine the origin of central MTOCs, the trajectories were manually verified with 3D‐reconstructed images in Imaris.
EB3 imaging and tracking pipeline
Oocytes microinjected with mRNAs for 3mEGFP‐EB3 and H2B‐mCherry were imaged on an LSM780 microscope, equipped with a 40× C‐apochromat water objective (1.2 NA) at 37°C at 5 h after NEBD. Single frames were acquired consecutively without waiting time. Scan time was 782 ms for one frame (512 × 512 pixels). For peak enhancement and background subtraction, we subtracted the image blurred with a strong Gaussian filter (sigma 8) from the same original image blurred with a light Gaussian filter (sigma 1.2). Tracking of EB3 comets was done automatically using the Trackmate plugin (Tinevez et al, 2017) in Fiji. To determine the position and direction of EB3 comets relative to the spindle, we manually fit an ellipse on the spindle using ImageJ, which was used to determine the position and orientation of the spindle axis and equator. The data for EB3 tracks and the spindle were then analyzed using R.
Author contributions
AC designed and performed most experiments, analyzed and interpreted the data, and wrote the manuscript. SY performed experiments shown in Figs 1E, 4, 5, and Figs EV1, EV3A–C, and EV5A. OT performed experiments shown in Fig EV3D and E. KA performed experiments shown in Fig EV3F. TSK designed, conceptualized, and supervised the project, interpreted the data, and wrote the manuscript.
Conflict of interest
The authors declare that they have no conflict of interest.
Supporting information
Expanded View Figures PDF
Movie EV1
Movie EV2
Movie EV3
Movie EV4
Movie EV5
Movie EV6
Movie EV7
Movie EV8
Movie EV9
Source Data for Expanded View and Appendix
Review Process File
Source Data for Figure 1
Source Data for Figure 2
Source Data for Figure 3
Source Data for Figure 4
Source Data for Figure 5
Acknowledgments
We thank M. Schuh for providing a Cep192 construct, J. Ellenberg for providing a macro for automated microscopy, the imaging and genome analysis and animal facilities of RIKEN Kobe for technical support. We also thank our laboratory members. A.C. and O.T. were partly supported by JSPS Postdoctoral Fellowship. This work was supported by the research grants MEXT/JSPS KAKENHI JP16H06161/JP16H01226/JP18H05549 to T.S.K.; JSPS KAKENHI JP17K15069/JP19K06682 to S.Y.; and by RIKEN BDR.
EMBO Reports (2021) 22: e51400.
Data availability
No data were deposited in a public database.
References
- Bennabi I, Terret ME, Verlhac MH (2016) Meiotic spindle assembly and chromosome segregation in oocytes. J Cell Biol 215: 611–619 [DOI] [PMC free article] [PubMed] [Google Scholar]
- Bennabi I, Quéguiner I, Kolano A, Boudier T, Mailly P, Verlhac MH, Terret ME (2018) Shifting meiotic to mitotic spindle assembly in oocytes disrupts chromosome alignment. EMBO Rep 19: 368–381 [DOI] [PMC free article] [PubMed] [Google Scholar]
- Blerkom JV (1991) Microtubule mediation of cytoplasmic and nuclear maturation during the early stages of resumed meiosis in cultured mouse oocytes. Proc Nat Acad Sci 88: 5031–5035 [DOI] [PMC free article] [PubMed] [Google Scholar]
- Breuer M, Kolano A, Kwon M, Li CC, Tsai TF, Pellman D, Brunet S, Verlhac MH (2010) HURP permits MTOC sorting for robust meiotic spindle bipolarity, similar to extra centrosome clustering in cancer cells. J Cell Biol 191: 1251–1260 [DOI] [PMC free article] [PubMed] [Google Scholar]
- Brugués J, Nuzzo V, Mazur E, Needleman DJ (2012) Nucleation and transport organize microtubules in metaphase spindles. Cell 149: 554–564 [DOI] [PubMed] [Google Scholar]
- Brunet S, Maria AS, Guillaud P, Dujardin D, Kubiak JZ, Maro B (1999) Kinetochore fibers are not involved in the formation of the first meiotic spindle in mouse oocytes, but control the exit from the first meiotic M phase. J Cell Biol 146: 1–12 [DOI] [PMC free article] [PubMed] [Google Scholar]
- Cheeseman IM, Chappie JS, Wilson‐Kubalek EM, Desai A (2006) The conserved KMN network constitutes the core microtubule‐binding site of the kinetochore. Cell 127: 983–997 [DOI] [PubMed] [Google Scholar]
- Clift D, Schuh M (2015) A three‐step MTOC fragmentation mechanism facilitates bipolar spindle assembly in mouse oocytes. Nat Commun 6: 7217 [DOI] [PMC free article] [PubMed] [Google Scholar]
- Connolly AA, Sugioka K, Chuang CH, Lowry JB, Bowerman B (2015) KLP‐7 acts through the Ndc80 complex to limit pole number in C. elegans oocyte meiotic spindle assembly. J Cell Biol 210: 917–932 [DOI] [PMC free article] [PubMed] [Google Scholar]
- Davydenko O, Schultz RM, Lampson MA (2013) Increased CDK1 activity determines the timing of kinetochore‐microtubule attachments in meiosis I. J Cell Biol 202: 221–229 [DOI] [PMC free article] [PubMed] [Google Scholar]
- DeLuca KF, Lens SM, DeLuca JG (2011) Temporal changes in Hec1 phosphorylation control kinetochore‐microtubule attachment stability during mitosis. J Cell Sci 124: 622–634 [DOI] [PMC free article] [PubMed] [Google Scholar]
- DeLuca JG, Gall WE, Ciferri C, Cimini D, Musacchio A, Salmon E (2006) Kinetochore microtubule dynamics and attachment stability are regulated by Hec1. Cell 127: 969–982 [DOI] [PubMed] [Google Scholar]
- Dumont J, Desai A (2012) Acentrosomal spindle assembly and chromosome segregation during oocyte meiosis. Trends Cell Biol 22: 241–249 [DOI] [PMC free article] [PubMed] [Google Scholar]
- Ganem NJ, Godinho SA, Pellman D (2009) A mechanism linking extra centrosomes to chromosomal instability. Nature 460: 278–282 [DOI] [PMC free article] [PubMed] [Google Scholar]
- Gard DL (1992) Microtubule organization during maturation of Xenopus oocytes: Assembly and rotation of the meiotic spindles. Dev Biol 151: 516–530 [DOI] [PubMed] [Google Scholar]
- Gui L, Homer H (2013) Hec1‐dependent cyclin B2 stabilization regulates the G2‐M transition and early prometaphase in mouse oocytes. Dev Cell 25: 43–54 [DOI] [PMC free article] [PubMed] [Google Scholar]
- Guimaraes GJ, Dong Y, McEwen BF, DeLuca JG (2008) Kinetochore‐microtubule attachment relies on the disordered N‐terminal tail domain of Hec1. Curr Biol 18: 1778–1784 [DOI] [PMC free article] [PubMed] [Google Scholar]
- Haverfield J, Dean NL, Nöel D, Rémillard‐Labrosse G, Paradis V, Kadoch IJ, FitzHarris G (2017) Tri‐directional anaphases as a novel chromosome segregation defect in human oocytes. Hum Reprod 32: 1293–1303 [DOI] [PMC free article] [PubMed] [Google Scholar]
- Holubcova Z, Blayney M, Elder K, Schuh M (2015) Error‐prone chromosome‐mediated spindle assembly favors chromosome segregation defects in human oocytes. Science 348: 1143–1147 [DOI] [PMC free article] [PubMed] [Google Scholar]
- Howe K, FitzHarris G (2013) Recent insights into spindle function in mammalian oocytes and early embryos. Biol Reprod 89: 71 [DOI] [PubMed] [Google Scholar]
- Kitajima TS, Ohsugi M, Ellenberg J (2011) Complete kinetochore tracking reveals error‐prone homologous chromosome biorientation in mammalian oocytes. Cell 146: 568–581 [DOI] [PubMed] [Google Scholar]
- Kolano A, Brunet S, Silk AD, Cleveland DW, Verlhac MH (2012) Error‐prone mammalian female meiosis from silencing the spindle assembly checkpoint without normal interkinetochore tension. Proc Natl Acad Sci 109: 1858–67 [DOI] [PMC free article] [PubMed] [Google Scholar]
- Lane S, Jones KT (2014) Non‐canonical function of spindle assembly checkpoint proteins after APC activation reduces aneuploidy in mouse oocytes. Nat Commun 5: 3444 [DOI] [PubMed] [Google Scholar]
- Letort G, Bennabi I, Dmitrieff S, Nedelec F, Verlhac MH, Terret ME (2019) A computational model of the early stages of acentriolar meiotic spindle assembly. Mol Biol Cell 30: 863–875 [DOI] [PMC free article] [PubMed] [Google Scholar]
- Lončarek J, Kisurina‐Evgenieva O, Vinogradova T, Hergert P, Terra S, Kapoor TM, Khodjakov A (2007) The centromere geometry essential for keeping mitosis error free is controlled by spindle forces. Nature 450: 745–749 [DOI] [PMC free article] [PubMed] [Google Scholar]
- Mailhes JB, Mastromatteo C, Fuseler JW (2004) Transient exposure to the Eg5 kinesin inhibitor monastrol leads to syntelic orientation of chromosomes and aneuploidy in mouse oocytes. Mutat Res Genetic Toxicol Environ Mutagen 559: 153–167 [DOI] [PubMed] [Google Scholar]
- Maro B, Howlett SK, Webb M (1985) Non‐spindle microtubule organizing centers in metaphase II‐arrested mouse oocytes. J Cell Biol 101: 1665–1672 [DOI] [PMC free article] [PubMed] [Google Scholar]
- Mogessie B, Scheffler K, Schuh M (2018) Assembly and positioning of the oocyte meiotic spindle. Annu Rev Cell Dev Biol 34: 381–403 [DOI] [PubMed] [Google Scholar]
- Moutinho‐Pereira S, Stuurman N, Afonso O, Hornsveld M, Aguiar P, Goshima G, Vale RD, Maiato H (2013) Genes involved in centrosome‐independent mitotic spindle assembly in Drosophila S2 cells. Proc Natl Acad Sci 110: 19808–19813 [DOI] [PMC free article] [PubMed] [Google Scholar]
- O’Connell CB, Lončarek J, Kaláb P, Khodjakov A (2009) Relative contributions of chromatin and kinetochores to mitotic spindle assembly. J Cell Biol 187: 43–51 [DOI] [PMC free article] [PubMed] [Google Scholar]
- Ohkura H (2015) Meiosis: an overview of key differences from mitosis. Csh Perspect Biol 7: a015859 [DOI] [PMC free article] [PubMed] [Google Scholar]
- Politi AZ, Cai Y, Walther N, Hossain MJ, Koch B, Wachsmuth M, Ellenberg J (2018) Quantitative mapping of fluorescently tagged cellular proteins using FCS‐calibrated four‐dimensional imaging. Nat Protoc 13: 1445–1464 [DOI] [PMC free article] [PubMed] [Google Scholar]
- Radford SJ, Nguyen AL, Schindler K, McKim KS (2017) The chromosomal basis of meiotic acentrosomal spindle assembly and function in oocytes. Chromosoma 126: 351–364 [DOI] [PMC free article] [PubMed] [Google Scholar]
- Reber S, Hyman AA (2015) Emergent properties of the metaphase spindle. Cold Spring Harbor Perspecti Biol 7: a015784 [DOI] [PMC free article] [PubMed] [Google Scholar]
- Sakakibara Y, Hashimoto S, Nakaoka Y, Kouznetsova A, Höög C, Kitajima TS (2015) Bivalent separation into univalents precedes age‐related meiosis I errors in oocytes. Nat Commun 6: 7550 [DOI] [PMC free article] [PubMed] [Google Scholar]
- Schindelin J, Arganda‐Carreras I, Frise E, Kaynig V, Longair M, Pietzsch T, Preibisch S, Rueden C, Saalfeld S, Schmid B (2012) Fiji: an open‐source platform for biological‐image analysis. Nat Methods 9: 676–682 [DOI] [PMC free article] [PubMed] [Google Scholar]
- Schuh M, Ellenberg J (2007) Self‐organization of MTOCs replaces centrosome function during acentrosomal spindle assembly in live mouse oocytes. Cell 130: 484–498 [DOI] [PubMed] [Google Scholar]
- Skold HN, Komma DJ, Endow SA (2005) Assembly pathway of the anastral Drosophila oocyte meiosis I spindle. J Cell Sci 118: 1745–1755 [DOI] [PMC free article] [PubMed] [Google Scholar]
- Sun SC, Lee SE, Xu YN, Kim NH (2010) Perturbation of Spc25 expression affects meiotic spindle organization, chromosome alignment and spindle assembly checkpoint in mouse oocytes. Cell Cycle 9: 4552–4559 [DOI] [PubMed] [Google Scholar]
- Sun SC, Zhang DX, Lee SE, Xu YN, Kim NH (2011) Ndc80 regulates meiotic spindle organization, chromosome alignment, and cell cycle progression in mouse oocytes. Microsc Microanal 17: 431–439 [DOI] [PubMed] [Google Scholar]
- Tinevez JY, Perry N, Schindelin J, Hoopes GM, Reynolds GD, Laplantine E, Bednarek SY, Shorte SL, Eliceiri KW (2017) TrackMate: An open and extensible platform for single‐particle tracking. Methods 115: 80–90 [DOI] [PubMed] [Google Scholar]
- Tooley JG, Miller SA, Stukenberg PT (2011) The Ndc80 complex uses a tripartite attachment point to couple microtubule depolymerization to chromosome movement. Mol Biol Cell 22: 1217–1226 [DOI] [PMC free article] [PubMed] [Google Scholar]
- Toso A, Winter JR, Garrod AJ, Amaro AC, Meraldi P, McAinsh AD (2009) Kinetochore‐generated pushing forces separate centrosomes during bipolar spindle assembly. J Cell Biol 184: 365–372 [DOI] [PMC free article] [PubMed] [Google Scholar]
- Vallot A, Leontiou I, Cladière D, Yakoubi WE, Bolte S, Buffin E, Wassmann K (2018) Tension‐induced error correction and not kinetochore attachment status activates the SAC in an Aurora‐B/C‐dependent manner in oocytes. Curr Biol 28: 130–139 [DOI] [PubMed] [Google Scholar]
- Watanabe S, Shioi G, Furuta Y, Goshima G (2016) Intra‐spindle microtubule assembly regulates clustering of microtubule‐organizing centers during early mouse development. Cell Rep 15: 54–60 [DOI] [PubMed] [Google Scholar]
- Woods LM, Hodges CA, Baart E, Baker SM, Liskay M, Hunt PA (1999) Chromosomal influence on meiotic spindle assembly: abnormal meiosis I in female Mlh1 mutant mice. J Cell Biol 145: 1395–1406 [DOI] [PMC free article] [PubMed] [Google Scholar]
- Yoshida S, Kaido M, Kitajima TS (2015) Inherent instability of correct kinetochore‐microtubule attachments during meiosis I in oocytes. Dev Cell 33: 589–602 [DOI] [PubMed] [Google Scholar]
- Yoshida S, Nishiyama S, Lister L, Hashimoto S, Mishina T, Courtois A, Kyogoku H, Abe T, Shiraishi A, Choudhary M, et al (2020) Prc1‐rich kinetochores are required for error‐free acentrosomal spindle bipolarization during meiosis I in mouse oocytes. Nat Commun 11: 2652 [DOI] [PMC free article] [PubMed] [Google Scholar]
Associated Data
This section collects any data citations, data availability statements, or supplementary materials included in this article.
Supplementary Materials
Expanded View Figures PDF
Movie EV1
Movie EV2
Movie EV3
Movie EV4
Movie EV5
Movie EV6
Movie EV7
Movie EV8
Movie EV9
Source Data for Expanded View and Appendix
Review Process File
Source Data for Figure 1
Source Data for Figure 2
Source Data for Figure 3
Source Data for Figure 4
Source Data for Figure 5
Data Availability Statement
No data were deposited in a public database.


