

Summary
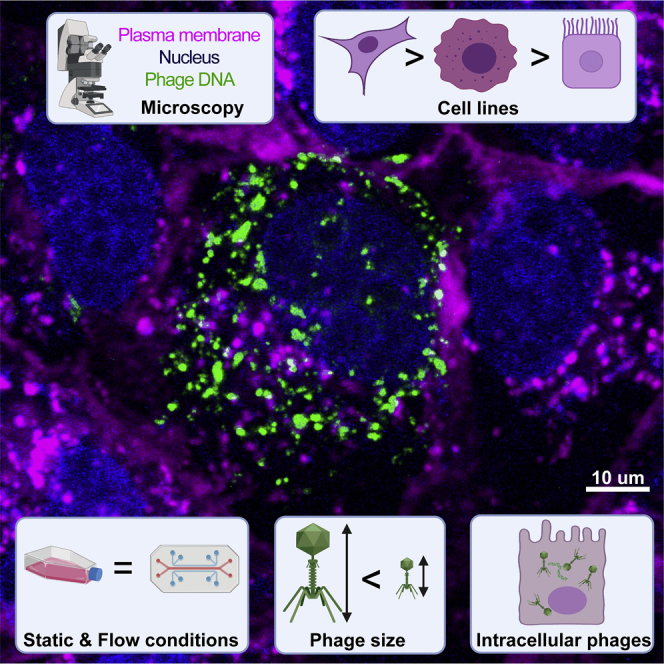
It is increasingly apparent that bacteriophages, viruses that infect bacteria and more commonly referred to as simply phages, have tropisms outside their bacterial hosts. Using live tissue culture cell imaging, we demonstrate that cell type, phage size, and morphology play a major role in phage internalization. Uptake was validated under physiological conditions using a microfluidic device. Phages adhered to mammalian tissues, with adherent phages being subsequently internalized by macropinocytosis, with functional phages accumulating intracellularly. We incorporated these results into a pharmacokinetic model demonstrating the potential impact of phage accumulation by cell layers, which represents a potential sink for circulating phages in the body. During phage therapy, high doses of phages are directly administered to a patient in order to treat a bacterial infection, thereby facilitating broad interactions between phages and mammalian cells. Understanding these interactions will have important implications on innate immune responses, phage pharmacokinetics, and the efficacy of phage therapy.
Subject areas: Immunology, Microbiology, Virology
Graphical abstract
Highlights
-
•
Live-cell imaging showed that bacteriophages were internalized by epithelial cells
-
•
Cell type, phage size, and morphology all influenced the rate of uptake
-
•
Internalized phages were functional and accumulated within cells over time
-
•
A pharmacokinetic model demonstrated the impact of phage accumulation by the body
Immunology; Microbiology; Virology
Introduction
Phages, short for bacteriophages, are viruses that infect bacteria and are the most abundant life form on the planet (Rohwer, 2003; Hatfull, 2015; Rohwer and Segall, 2015). Phages are found ubiquitously in the environment and are a major contributor to global microbial genetic diversity (Breitbart et al., 2003; Clokie et al., 2011; Manrique et al., 2016). Our bodies harbor large numbers of phages, and, together with their bacterial hosts, they constitute a key component of our gut microbiome (Shkoporov and Hill, 2019). The gut carries the largest aggregation of phages in the body, with an estimated 2 × 10¹² phages present in the average human colon (Clokie et al., 2011; Sender et al., 2016; Nguyen et al., 2017). These phages are constantly interacting with gut bacteria, as well as the epithelial tissues of the gut (Barr, 2017). Phages are detected in the circulatory systems of the body, suggesting they are capable of translocating from the gut and penetrating throughout the body (Górski et al., 2006; Nguyen et al., 2017). Once past the gut barrier, phages are able to penetrate tissues and major organs of the body, being found in classically sterile regions such as the blood, serum, organs, and even the brain (Geier et al., 1973; Gorski et al., 2003; Srivastava et al., 2004; Dabrowska et al., 2005; Górski et al., 2006; Dor-On and Solomon, 2015; Barr, 2017; Miȩdzybrodzki et al., 2017; Nguyen et al., 2017; Ghose et al., 2019; Huh et al., 2019). Numerous mechanisms pertaining to the transport of phages across epithelial barriers have been proposed (Dabrowska et al., 2005; Górski et al., 2006), including the “leaky gut” where phages bypass cell barriers at sites of damage and inflammation (Handley et al., 2013; Karimi et al., 2016) and receptor-mediated endocytosis (Tao et al., 2013; Lehti et al., 2017). Recently, a non-specific mechanism for phage uptake and transport across epithelial cell layers was proposed by Nguyen and colleagues, whereby epithelial cells uptake phages via macropinocytosis and preferentially transcytose phages from the apical surface toward the basolateral side of the cell (Nguyen et al., 2017). Macropinocytosis is a broad mechanism describing the enclosure of media within ruffles in cells' membrane (Kerr and Teasdale, 2009), prior to internalizing the media, and any phages it may contain, within the cells. Despite their prevalence in the human body, phage's capacity to interact with and influence mammalian cells remains largely unknown. These interactions can have important implications during phage therapy.
Phage therapy is a promising alternative to treat antibiotic-resistant bacterial infections. In Eastern Europe, phage therapy has been widely used since its discovery in 1917 (Rohwer and Segall, 2015), whereas in Western countries, phage therapy was largely abandoned in favor of antibiotics (Merril et al., 2003; Kutter et al., 2010; Abedon et al., 2011; Gordillo Altamirano and Barr, 2019). However, with the rise of antimicrobial resistance as one of the greatest threats to human health, phage therapy is being re-established as a potential treatment option for difficult-to-treat, antibiotic-resistant, bacterial infections (Gordillo Altamirano and Barr, 2019). Phages can be administered to patients by a number of routes, including intravenous (IV) or intraperitoneal to treat septicemia; orally to treat gastrointestinal infections; intranasal or inhalation to treat respiratory infections; or topically for cutaneous infections (Dąbrowska, 2019; Matsuzaki and Uchiyama, 2019). The administration route and bioavailability of phages needs to be carefully taken into account in order to achieve favorable efficacy in vivo.
In contrast to conventional drugs, phages are unique therapeutic agents capable of self-replicating and maintaining titers in the body (Payne and Jansen, 2000, 2001; Dąbrowska, 2019; Dąbrowska and Abedon, 2019). As such, there is a lack of knowledge regarding phage pharmacokinetics and pharmacodynamics (Dąbrowska and Abedon, 2019). Following administration, two major pharmacokinetic factors important for the efficacy of phage therapy are accessibility and clearance. First, natural barriers such as tissues and mucus layers can decrease accessibility of phages to sites of infection, thereby necessitating the administration of higher doses to achieve a favorable therapeutic effect. Second, phage clearance has been reported to occur rapidly: sometimes within just minutes to hours following parenteral administration in animal models and patients (Keller and Engley, 1958; Hildebrand and Wolochow, 1962; Hoffmann, 1965; Geier et al., 1973; Hodyra-Stefaniak et al., 2019; Sweere et al., 2019; Doub et al., 2020; Lin et al., 2020). Phage clearance within the body is thought to be mediated by three main components: (1) phagocytic cells (Carroll-Portillo and Lin, 2019), (2) the mononuclear phagocyte system (MPS; which was also previously called the reticuloendothelial system or RES), which includes the liver and spleen that filter out and remove phages from circulation (Van Belleghem et al., 2019), and (3) phage neutralizing antibodies, although it is still unclear how effective and rapidly produced these anti-phage antibodies are (Hodyra-Stefaniak et al., 2015; Dąbrowska and Abedon, 2019). Due to these complications, it is difficult to predict how phages will behave in the body when administered and ultimately whether phage therapy will be successful.
One underexplored aspect of phage therapy is the non-specific interactions between phages and tissues. During therapy, large quantities of phage cocktails, which may contain a mixture of complementary phages capable of infecting a certain bacterial species, are administered to patients in order to maintain a killing titer to combat a bacterial infection. Once within the body, these phages can have very short half-lives and are actively removed or inactivated by the body (Hodyra-Stefaniak et al., 2019; Sweere et al., 2019; Doub et al., 2020; Y.-W. Lin et al., 2020). Following phage administration to the body, epithelial and endothelial tissues are among the first and most abundant phage-mammalian interactions. Here, we present new insights into phage-mammalian cell adherence, uptake, and trafficking, via in vitro tissue culture. Our results suggest that tissues represent an unaccounted sink for exogenously administered phages. Put within the context of phage therapy, the interaction between mammalian cells and exogenous phages may have important implications for phage administration, dosing, and pharmacokinetics.
Results
The rate of phage uptake varies depending on the cell type
To better understand phage-eukaryote interactions, we used seven in vitro tissue culture cell lines that were selected to be broadly representative of different tissues types within the body and examined their interactions with ultrapure, high-titer monocultures of T4 phage. T4 phage is a virulent Myoviridae that infect Escherichia coli bacterial host. Using real-time live-cell imaging on a confocal microscope with a sensitive hybrid detector, we visualized the interaction and subsequent internalization of phage particles within mammalian cells. Cells were first grown on glass bottom slides for 2 days to generate an ∼80% confluent cell layer, followed by fluorescence staining of the nucleus and plasma membrane and maintained in a low feeding state (1% fetal bovine serum for all microscopy experiments). T4 phages were prepared using the Phage-on-Tap method (Bonilla et al., 2016), labeled using SYBR-Gold, subsequently washed to remove residual stain, and then directly applied to the cells and observed using live cell imaging.
Phages were visualized in real time being engulfed and trafficked through all seven of the different cell lines over a 2-hr period (Figure 1A and Videos S1, S2, S3, S4, S5, S6, and S7). The cell types tested include the following: epithelial cells—HeLa, A549, and HT29, from the cervix, lung, and colon, respectively; fibroblast cells—MDCK-I and BJ, from dog kidney and human skin, respectively; the endothelial cell line—HUVEC from umbilical vein; and monocyte-induced macrophages—THP-1 cells (Figure 1B). The increase in green fluorescence over time corresponds to the uptake and accumulation of fluorescently labeled T4 phages by the cells. We saw the first evidence of phage accumulation within cells occurring around 30 min, with continued accumulation over the following 90 min.
Figure 1.

Uptake and internalization of phages varies across cell type
(A) T4 phage was fluorescently labeled, applied to different cell lines, and incubated for 2 hr on a glass bottom slide. Cells were imaged every 2 min using real-time microscopy. Scale bar: 10 μm; timing: hours:minutes.
(B) Table of cell lines used in this study, their cell type, organism, organ origins, and category of uptake. Cells lines are ranked as high, intermediate, and low uptake.
(C) Percentage of cells containing intracellular phages at the 2-hr time point. Scatterplots show medians of percentage of cells with intracellular phages; error bars represent 95% confidence intervals; each dot represents one field of view (FOV). p values between the different groups calculated from a one-way ANOVA, shown as stars (F (2, 43) = 71.23; P < 0.0001: ∗∗∗∗).
(D) Percentage of cells containing phages represented across time. For each video, the number of cells with and without intracellular phages in a FOV was manually counted every ten minutes (A549 n = 6; HUVEC n = 8; MDCK-I n = 3; HeLa n = 6; THP-1 n = 8; HT29 n = 3; BJ n = 3). Curve plots show medians of percentage of cells with intracellular phages; the shaded area for each curve represents 95% confidence intervals.
See also Data S1, Figure 1, Figure 2, Figure 3, Figure 4, Figure 5, Figure 6and S2.
Phages were applied to the cell layer and incubated for two hours (or one hour for Videos S8 and S9) on a μ-Slide 8 well glass bottom slide on a microscope stage with temperature and CO2 control. One image was acquired every two minutes on an inverted Leica SP8 confocal microscope with HC PL APO 63x/1.40 CS2 oil immersion objective. A hybrid detector (HyD) was used in sequential mode to visualise phage DNA. Cells were stained with nucleus stain, Hoescht 33342 (blue), plasma membrane stain, CellMask (magenta) and T4 phages labelled with DNA-complexing stain, SYBR-Gold (green). Scale bar: 10 μm; Timing: hours:minutes.
Phages were applied to the cell layer and incubated for two hours (or one hour for Videos S8 and S9) on a μ-Slide 8 well glass bottom slide on a microscope stage with temperature and CO2 control. One image was acquired every two minutes on an inverted Leica SP8 confocal microscope with HC PL APO 63x/1.40 CS2 oil immersion objective. A hybrid detector (HyD) was used in sequential mode to visualise phage DNA. Cells were stained with nucleus stain, Hoescht 33342 (blue), plasma membrane stain, CellMask (magenta) and T4 phages labelled with DNA-complexing stain, SYBR-Gold (green). Scale bar: 10 μm; Timing: hours:minutes.
Phages were applied to the cell layer and incubated for two hours (or one hour for Videos S8 and S9) on a μ-Slide 8 well glass bottom slide on a microscope stage with temperature and CO2 control. One image was acquired every two minutes on an inverted Leica SP8 confocal microscope with HC PL APO 63x/1.40 CS2 oil immersion objective. A hybrid detector (HyD) was used in sequential mode to visualise phage DNA. Cells were stained with nucleus stain, Hoescht 33342 (blue), plasma membrane stain, CellMask (magenta) and T4 phages labelled with DNA-complexing stain, SYBR-Gold (green). Scale bar: 10 μm; Timing: hours:minutes.
Phages were applied to the cell layer and incubated for two hours (or one hour for Videos S8 and S9) on a μ-Slide 8 well glass bottom slide on a microscope stage with temperature and CO2 control. One image was acquired every two minutes on an inverted Leica SP8 confocal microscope with HC PL APO 63x/1.40 CS2 oil immersion objective. A hybrid detector (HyD) was used in sequential mode to visualise phage DNA. Cells were stained with nucleus stain, Hoescht 33342 (blue), plasma membrane stain, CellMask (magenta) and T4 phages labelled with DNA-complexing stain, SYBR-Gold (green). Scale bar: 10 μm; Timing: hours:minutes.
Phages were applied to the cell layer and incubated for two hours (or one hour for Videos S8 and S9) on a μ-Slide 8 well glass bottom slide on a microscope stage with temperature and CO2 control. One image was acquired every two minutes on an inverted Leica SP8 confocal microscope with HC PL APO 63x/1.40 CS2 oil immersion objective. A hybrid detector (HyD) was used in sequential mode to visualise phage DNA. Cells were stained with nucleus stain, Hoescht 33342 (blue), plasma membrane stain, CellMask (magenta) and T4 phages labelled with DNA-complexing stain, SYBR-Gold (green). Scale bar: 10 μm; Timing: hours:minutes.
Phages were applied to the cell layer and incubated for two hours (or one hour for Videos S8 and S9) on a μ-Slide 8 well glass bottom slide on a microscope stage with temperature and CO2 control. One image was acquired every two minutes on an inverted Leica SP8 confocal microscope with HC PL APO 63x/1.40 CS2 oil immersion objective. A hybrid detector (HyD) was used in sequential mode to visualise phage DNA. Cells were stained with nucleus stain, Hoescht 33342 (blue), plasma membrane stain, CellMask (magenta) and T4 phages labelled with DNA-complexing stain, SYBR-Gold (green). Scale bar: 10 μm; Timing: hours:minutes.
Phages were applied to the cell layer and incubated for two hours (or one hour for Videos S8 and S9) on a μ-Slide 8 well glass bottom slide on a microscope stage with temperature and CO2 control. One image was acquired every two minutes on an inverted Leica SP8 confocal microscope with HC PL APO 63x/1.40 CS2 oil immersion objective. A hybrid detector (HyD) was used in sequential mode to visualise phage DNA. Cells were stained with nucleus stain, Hoescht 33342 (blue), plasma membrane stain, CellMask (magenta) and T4 phages labelled with DNA-complexing stain, SYBR-Gold (green). Scale bar: 10 μm; Timing: hours:minutes.
We observed large variation in the uptake of phages across the seven cell types investigated. To quantify this, cells containing intracellular phages were manually counted and compared with the total number of cells in the field of view (FOV) at the 2-hr time point for each replicate. Cells were then categorized as high, intermediate, or low phage-uptake using univariate clustering analysis (Figures 1C and S1) (Wang and Song, 2011). A549 lung epithelial cells showed the highest accumulation of phages, with a median of cells containing fluorescently labeled phages at the 2-hr time point of 99% (±2%, mean ± standard deviation [SD]; FOV n = 8; coefficient of variation [CV] = 2%). Next, HUVEC, MDCK-1, and HeLa cells, representing endothelial, fibroblast, and epithelial cell types all showed intermediate levels of phage accumulation at the 2-hr time point, with medians of 44% (±34% SD; FOV n = 10; CV = 63%), 51% (±26% SD; FOV n = 4; CV = 54%), and 41% (±18% SD; FOV n = 7; CV = 42%) of phage-positive cells, respectively. Finally, THP-1, HT29, and BJ cells, representing macrophages, epithelial, and fibroblast cell types all showed little to no accumulation with medians of 0% (±11% SD; FOV n = 9; CV = 155%), 0% (±0.5% SD; FOV n = 4; CV = 200%), and 0% (±0% SD; FOV n = 4; CV = 0%) phage-positive cells at 2 hr, respectively. We further quantified the rate at which cells internalized phages by manually counting the number of cells per frame of interest containing fluorescently labeled phages for each of the FOV per cell lines (Figure 1D). Most cells showed large variability in the uptake rate over the 2-hr period. For A549 cells, which had the highest accumulation of phages, we saw large variation in the rate of uptake, with a median of 27% (±36% SD; FOV n = 6; CV = 83%) of cells that contained phages at 1 hr of incubation compared to 100% (±0% SD; FOV n = 6; CV = 0%) of cells at 2 hr. Comparatively, HUVECs, which were classified as intermediate accumulation of phages showed extensive variability in their uptake rates over time, with a median of 12% (±41% SD, FOV n = 8; CV = 116%) and 46% (±35% SD; FOV n = 8; CV = 60%) of cells containing phages at 1 and 2 hr, respectively. The rate of entry of SYBR-labeled phages was compared with non-labeled phages and no difference was observed (Figure S2).
To confirm that phages were internalized and not simply attached to the cell surface, we created a three-dimensional (3D) reconstruction using a z stack to visualize the intracellular localization of phages. After the live cell imaging of MDCK-I cells incubated with fluorescently labeled T4 phages for 1 hr (Video S8), we acquired a high-resolution z stack image of one chosen field of view. We reconstituted the 3D volume of the cell to visualize phage repartition in the cytoplasm (Figure 2 top left corner and Video S9). Finally, we looked at the localization of phages in 3D using the XY cross section (Figure 2). The 3D reconstruction of the cell confirmed that phages internalized by the cells (visualized as green fluorescent particles) lie in the same focal plane as the nucleus (Figure 2). Phages were found to be distributed throughout the cell cytoplasm. Additionally, they also appeared to be more abundant within membrane-bound vesicles surrounding the nucleus after the 2-hr incubation.
Figure 2.

3D reconstruction of intracellular phages
MDCK-I cells were incubated for an hour with T4 phages on glass bottom slide before live acquisition of a high-resolution z stack to visualize phage dispersion inside of cells. 3D cell projection is shown in the top left corner. The cross in the center of the image shows a cluster of internalized phages with its Z dimension (depth) represented in the side views. Scale bar: 10 μm.
Phages were applied to the cell layer and incubated for two hours (or one hour for Videos S8 and S9) on a μ-Slide 8 well glass bottom slide on a microscope stage with temperature and CO2 control. One image was acquired every two minutes on an inverted Leica SP8 confocal microscope with HC PL APO 63x/1.40 CS2 oil immersion objective. A hybrid detector (HyD) was used in sequential mode to visualise phage DNA. Cells were stained with nucleus stain, Hoescht 33342 (blue), plasma membrane stain, CellMask (magenta) and T4 phages labelled with DNA-complexing stain, SYBR-Gold (green). Scale bar: 10 μm; Timing: hours:minutes.
Phages were applied to the cell layer and incubated for two hours (or one hour for Videos S8 and S9) on a μ-Slide 8 well glass bottom slide on a microscope stage with temperature and CO2 control. One image was acquired every two minutes on an inverted Leica SP8 confocal microscope with HC PL APO 63x/1.40 CS2 oil immersion objective. A hybrid detector (HyD) was used in sequential mode to visualise phage DNA. Cells were stained with nucleus stain, Hoescht 33342 (blue), plasma membrane stain, CellMask (magenta) and T4 phages labelled with DNA-complexing stain, SYBR-Gold (green). Scale bar: 10 μm; Timing: hours:minutes.
Phage uptake occurs at comparable rates under both static and flow conditions
The previous experiments were all conducted under static conditions, where phages were directly applied to the cell culture media and phage-cell encounters driven purely by diffusion. However, phages administered to the body encounter dynamic environments and active fluid flow, such as in the circulatory and lymphatic system. These dynamic conditions may lead to increased phage-cell encounter rates or altered cellular uptake (Kim et al., 2007, 2012, 2016; Son, 2007; Navabi et al., 2013; Thuenauer et al., 2014). We investigated whether phage uptake rates under static conditions were comparable with uptake rates under fluid flow and shear conditions that mimic the circulatory systems of the body (Figure 3A). We chose HUVECs to use in our flow experiment for two main reasons: the first being that they are part of the intermediate uptake group as previously shown (Figure 1) and, secondly, are endothelial cells and would be among the first type of cells to be in contact with circulating phages in the human body. Using an in-house fabricated microfluidic device mounted on a glass coverslip adapted for confocal microscopy (Barr et al., 2015; Chin and Barr, 2019), we seeded the device with HUVECs and incubated it under static conditions for 12 hr to ensure sufficient cellular attachment to the substrate. Cells were allowed to settle within the device under a low flow rate of 0.66 μL/min for one day, before increasing to a final flow rate of 8 μL/min until cells reached confluency. Physiological shear stress values observed in the human body range from 0.1 dyne/cm2 in the microcirculation, reaching higher rates of 50 dyne/cm2 found in larger circulatory vessels (Davies et al., 2005; Park et al., 2011; Wang et al., 2012; Abaci et al., 2014; Yum et al., 2014). Due to the volumes of media and quantity of phages applied to the chip, we chose a flow rate of 8 μL/min, which is equivalent to a shear stress of 0.1 dyne/cm2 in our chip and was at the lower end of physiological circulatory range (Table S1). We perfused the chips with media containing 109 phages/ml, with phage uptake visualized as previously described at 2- and 18-hr time points. Even though the volumes and quantity of phages seen by the cell layers in the static (200 μL) and flow (960 μL) conditions are different, we still observe similar rates of T4 phage uptake after 2 hr (Figures 1A, 3Bii, and S4). Comparatively, after 18-hr incubation under shear stress, we observed a significant increase in the fluorescence intensity compared with 2 hr incubation (unpaired t test, P < 0.001) (Figure S4), suggesting that phage accumulation and saturation within cells continues over longer incubation periods.
Figure 3.

Uptake of phages under fluid flow and shear stress
T4 phage was applied to HUVECs within a microfluidic channel of a microfluidic device under a shear stress for 2 or 18 hr with images collected via real-time microscopy images.
(A) Schematic of the microchannel showing the flow from one port of the channel to the other side of the channel where the waste was collected.
(B) (i) Control cells without phages. Cells incubated under a constant flow of phages at a rate of 8 μL/min for either (ii) 2 or (iii) 18 hr. Scale bar: 10 μm.
See also Figures S3 and S4.
Phage type and size effects intracellular uptake
Next, we looked three different phage types with differing sizes and their subsequent rates of cellular uptake. We chose three Escherichia coli infecting phages: T4 phage from the Myoviridae family, measuring 90 nm wide and 200 nm long with a contractile tail; lambda phage from the Siphoviridae family, measuring 60 nm wide and 150 nm long with a non-contractile tail; and T3 phage from the Podoviridae family, measuring 55 nm wide and 30 nm long with a small non-contractile tail. We tested these phages against three cell lines representative of high, intermediate, and low rates of uptake (Figure 1C): A549 cells with a high rate of uptake, HUVECs with an intermediate rate, and BJ cells with a low rate. We incubated phages with the cells for 2 hr, acquiring images every 2 min (Videos S1, S2, S7, S10, S11, S12, S13, S14, and S15), with the final time point represented in Figure 4A. The first row of images shows clear differences in T4 phage uptake between the three cell lines (Figure 4A). However, when we applied the lambda and T3 phages to the three cells lines, we saw a large increase in the uptake of both phages compared with T4. This was particularly evident in the BJ cell line, which had effectively no T4 phage update over a 2-hr period but nonetheless demonstrated increased uptake of the smaller sized lambda and T3 phage. We quantified phage uptake across type and size using a pipeline built with CellProfiler software (McQuin et al., 2018) (see transparent methods) to analyze the median gray-value intensity in the cell region (median over all pixels in FOV marked as cells) as a proxy for fluorescence intensity of phage (Figure 4). For T3 phage, a Podoviridae and the smallest phage of the three tested, we observed the highest rate of uptake across the three cell lines (analysis of variance [ANOVA] one way, F (2, 45) = 71,32; P < 0.0001). This was especially evident for the BJ cell line where the median intensity of the phage fluorescence signal increased from a median of 0.01 normalized gray value with T4 phage (±0.006 SD; FOV n = 6; CV = 49%) up to 0.09 with lambda (±0.04 SD; FOV n = 6; CV = 49%) and finally to 0.16 with T3 phage (±0.04 SD; FOV n = 3; CV = 22%) (Figure 4B). Based on our microscopy results, we suggest that smaller sized phages showed increased rates of cellular uptake, with these effects being more pronounced in our intermediate and low uptake cell lines.
Figure 4.

Cellular uptake of differing phage types
Real-time microscopy images showing differential uptake of three phages. One representative cell line from each of the three high, intermediate, and low uptake groups was picked.
(A) Images were acquired in real time. Green gradient shows the qualitative increase in T4 phage uptake (Figure 1C), while gray gradient shows qualitative decrease in phage size. Scale bar, 10 μm. The image shown is the last image at 2-hr acquisition.
(B) Fluorescence intensity of the “phage object” area in normalized gray values at the 2-hr time point (A549-T4 n = 9; A549-lambda n = 3; A549-T3 n = 6; HUVEC-T4 n = 6; HUVEC-lambda n = 3; HUVEC-T3 n = 6; BJ-T4 n = 6; BJ-lambda n = 6; BJ-T3 n = 3). Scatterplots show medians over all pixels in the cell FOV; error bars represent 95% confidence intervals; each point represents one FOV. p values calculated from a one-way ANOVA (P < 0.0001: ∗∗∗∗; p < 0.05: ∗; ns: non-significant).
Phages were applied to the cell layer and incubated for two hours (or one hour for Videos S8 and S9) on a μ-Slide 8 well glass bottom slide on a microscope stage with temperature and CO2 control. One image was acquired every two minutes on an inverted Leica SP8 confocal microscope with HC PL APO 63x/1.40 CS2 oil immersion objective. A hybrid detector (HyD) was used in sequential mode to visualise phage DNA. Cells were stained with nucleus stain, Hoescht 33342 (blue), plasma membrane stain, CellMask (magenta) and T4 phages labelled with DNA-complexing stain, SYBR-Gold (green). Scale bar: 10 μm; Timing: hours:minutes.
Phages were applied to the cell layer and incubated for two hours (or one hour for Videos S8 and S9) on a μ-Slide 8 well glass bottom slide on a microscope stage with temperature and CO2 control. One image was acquired every two minutes on an inverted Leica SP8 confocal microscope with HC PL APO 63x/1.40 CS2 oil immersion objective. A hybrid detector (HyD) was used in sequential mode to visualise phage DNA. Cells were stained with nucleus stain, Hoescht 33342 (blue), plasma membrane stain, CellMask (magenta) and T4 phages labelled with DNA-complexing stain, SYBR-Gold (green). Scale bar: 10 μm; Timing: hours:minutes.
Phages were applied to the cell layer and incubated for two hours (or one hour for Videos S8 and S9) on a μ-Slide 8 well glass bottom slide on a microscope stage with temperature and CO2 control. One image was acquired every two minutes on an inverted Leica SP8 confocal microscope with HC PL APO 63x/1.40 CS2 oil immersion objective. A hybrid detector (HyD) was used in sequential mode to visualise phage DNA. Cells were stained with nucleus stain, Hoescht 33342 (blue), plasma membrane stain, CellMask (magenta) and T4 phages labelled with DNA-complexing stain, SYBR-Gold (green). Scale bar: 10 μm; Timing: hours:minutes.
Phages were applied to the cell layer and incubated for two hours (or one hour for Videos S8 and S9) on a μ-Slide 8 well glass bottom slide on a microscope stage with temperature and CO2 control. One image was acquired every two minutes on an inverted Leica SP8 confocal microscope with HC PL APO 63x/1.40 CS2 oil immersion objective. A hybrid detector (HyD) was used in sequential mode to visualise phage DNA. Cells were stained with nucleus stain, Hoescht 33342 (blue), plasma membrane stain, CellMask (magenta) and T4 phages labelled with DNA-complexing stain, SYBR-Gold (green). Scale bar: 10 μm; Timing: hours:minutes.
Phages were applied to the cell layer and incubated for two hours (or one hour for Videos S8 and S9) on a μ-Slide 8 well glass bottom slide on a microscope stage with temperature and CO2 control. One image was acquired every two minutes on an inverted Leica SP8 confocal microscope with HC PL APO 63x/1.40 CS2 oil immersion objective. A hybrid detector (HyD) was used in sequential mode to visualise phage DNA. Cells were stained with nucleus stain, Hoescht 33342 (blue), plasma membrane stain, CellMask (magenta) and T4 phages labelled with DNA-complexing stain, SYBR-Gold (green). Scale bar: 10 μm; Timing: hours:minutes.
Phages were applied to the cell layer and incubated for two hours (or one hour for Videos S8 and S9) on a μ-Slide 8 well glass bottom slide on a microscope stage with temperature and CO2 control. One image was acquired every two minutes on an inverted Leica SP8 confocal microscope with HC PL APO 63x/1.40 CS2 oil immersion objective. A hybrid detector (HyD) was used in sequential mode to visualise phage DNA. Cells were stained with nucleus stain, Hoescht 33342 (blue), plasma membrane stain, CellMask (magenta) and T4 phages labelled with DNA-complexing stain, SYBR-Gold (green). Scale bar: 10 μm; Timing: hours:minutes.
Phages adhere to mammalian cells, resulting in inactivation and uptake
We demonstrate that phages have different rates of cellular uptake depending on both cell type and the size and morphology of phages. Yet whether these phages remained functional or if they were inactivated by the cellular uptake and trafficking pathways remains unclear. To answer this, we quantified the number intracellular phages using two methods: classic plaque formation unit (PFU) assays and droplet digital PCR (ddPCR). Briefly, PFUs allowed us to quantify the number of active or functional phages present within the cells, while ddPCR quantified the absolute number of phage DNA genome copies present in the sample. We evaluated the accuracy of the two techniques with a dilution series of our initial phage sample from 109 to 102 phages per ml using PFU and ddPCR (Figure S5). Subtracting active phages (PFU) from phage DNA genome copies (ddPCR) enabled us to quantify the proportion of phages inactivated or damaged during cellular uptake and trafficking, as these damaged phages are no longer able to infect their bacterial host and therefore will only be detected by ddPCR.
In order to differentiate between intracellular phages and those adhered to the cell surface, we incubated cells with T4 phages (∼109/mL) for two different periods of time: 30 s, which is too short for phage internalization, as previously observed in the microscopy videos (Figures 1, 3, 4, and S6) where for A549 and HUVEC cells, 10 min is the earliest time point to observe intracellular phages, and 18 hr, to maximize the number of internalized phages. After incubation at each time point, cells were extensively washed to remove non-adherent phages, lysed, and phages quantified by both PFU and ddPCR (Figure 5A). We compared the same representative cell types previously used for high, intermediate, and low uptake cell lines (Figure 5B). For all three cell lines, we saw between 90 and 2200 active phages (PFU)/ml adhered to the cells within 30 s treatment, with a median of 625 PFU/mL (±420 SD; n = 6; CV = 60.1%), 325 phages/ml (±300 SD; n = 6; CV = 76.6%), and 250 phages/ml (±850 SD; n = 6; CV = 114%) for A549, HUVEC, and BJ cells, respectively, suggesting a small, yet persistent number of phages adhere to the cell layer. After 18 hr of incubation, we saw a large increase in the number of functional phages associated with the cells, with between 1.1 × 10⁴ and 3.1 × 10⁶ phages/ml accumulating within the three cell lines. Looking across the different cell lines, we see the highest accumulation of phages in the intermediate uptake cells, with a median of 5 × 10⁵ PFU/mL (±6.4 × 10⁵ SD; n = 9; CV = 85.7%) followed by the high and low uptake with medians, respectively, of 1.2 × 10⁵ PFU/mL (±8.4 × 10⁴ SD; n = 9; CV = 65.7%) and 5 × 10⁴ PDU/ml (±1.4 × 10⁶ SD; n = 9; CV = 144.3%), although there was no significant difference between the three cell lines (P > 0.1, ANOVA one way). We note that the BJ cell line, which showed the lowest rate of uptake observed via microscopy (Figure 1), still accumulated active phages over prolonged periods of time with non-significant differences of active phages at 18 hr observed with two other cell lines (unpaired t test, two tailed, P > 0.08 with A549 and P > 0.6 with HUVEC). This suggests that despite differences in the cells rates of phage uptake, even low uptake cell lines are capable of internalizing phages over extended time periods.
Figure 5.

Quantifying adherence and internalization of phages and their activity
(A) Schematic representation of the experiment. T4 phages were applied to cells either 30 s as an adherence control or for 18 hr to saturate phage uptake. Phages were quantified using both traditional plaque assays (PFUs) and digital droplet PCR (ddPCR), across three different cell lines: A549, HUVEC, and BJ, representative of the high, intermediate, or low phage uptake.
(B) Active T4 phages in green quantified by PFU and in gray the total number of phage DNA genome copies per sample quantified by ddPCR, including both active and inactive phages. Scatterplots show medians of phages or DNA genome copies/ml; error bars represent 95% confidence intervals; each point represents one sample. p values calculated from an unpaired t test between each pair (p < 0.001: ∗∗∗; p < 0.01: ∗∗; p < 0.05: ∗; ns: non-significant).
See also Figures S5–S8 and Tables S1–S3.
Surprisingly, when looking at ddPCR results, we see an increase in phage DNA associated with the 30 s treatment in all cell lines, with between 3.9 × 10² and 2.7 × 10⁴ DNA genome copies/ml persisting. When quantifying the inactivated phages at 30 s treatment, which was calculated as the difference in DNA genome copies and PFU, we observe between 7 × 101 and 2.7 × 10⁴ inactivated PFU/ml. These results suggest that (1) phages adhere to mammalian tissues, with a portion of these phages being inactivated, (2) longer incubation time allows for adhered phages to be internalized and accumulate inside of the cells, and (3) the majority of internalized phage particles remain active and stably persist within the cells for up to 18 hr.
Phage inactivation and internalization influences pharmacokinetics
A key underexplored aspect of phage pharmacokinetics (PK) is the non-specific interactions between phages and the epithelial and endothelial tissues. To address this, we integrated our experimental data (Figure 5) with an established PK model for phage administration in rats (Lin et al., 2020). The model was established from a single-dose PK study performed in healthy rats, following an intravenous bolus of phages. The phage disposition in blood was well characterized using a standard three-compartment PK model (Lin et al., 2020). In order to evaluate the impact of phage inactivation and internalization by mammalian cells on phage distribution, a fourth compartment was added to the existing model, representing the epithelial and endothelial tissues (Figure 6A). Deterministic simulations were subsequently performed with the previously estimated PK parameters (Lin et al., 2020), and the first-order inactivation constant was estimated from our in vitro data (ddPCR). Inactivation rate constant was calculated using both the 30 s- and 18 hr-derived constants, as a representative of both the rapid and prolonged phage accumulation in tissues (Figure 6B, Data S2 and S3 and Table S5). Deterministic simulations were performed at an IV bolus dose of 109 phages. With the inactivation rate constant calculated using 30 s data, complete removal of phages was noted as short as three hours. This is consistent with the 30 s in vitro data, in which rapid inactivation was observed. Comparatively, using the inactivation rate constant calculated using the 18-hr data, an initial rapid decay of circulating phages followed by a longer tail and phage persistence in the blood was observed for up to 32 hr. These two models represent two extremes of rapid and prolonged phage accumulation in tissues, highlighting the potential impact of these cellular mechanisms on phage disposition. Further studies characterizing both the affinity of phage-mammalian interactions and their influence on PK are needed for better clinical translation.
Figure 6.

Pharmacokinetic (PK) model of inactivation and internalization of phages by mammalian tissues
(A) Schematic of the standard 3-compartment model with an additional inactivation compartment. X0, the initial dose of phages and CL phage total body clearance. C1, the central compartment representing the central system (i.e., the blood). P1 and P2 compartments represent various organs or tissues participating in phage decay. R, the new compartment representing in vitro cell layers as a potential sink of phages. Q1 and Q2 are intercompartmental clearance one and two, respectively. KD1 is the first-order inactivation constant, and KD2 is the first-order reactivation constant (assumed to be zero in our model).
(B) Graph representing the decay of phages per central volume of distribution over time calculated with in vitro data. First order for the 30 s graph is 1511 1/h/rat, and for the 18 hr, the first order is 0.44 1/h/rat (calculation in Table S5).
Discussion
Phage therapy is one of the more promising alternatives in the fight against antibiotic resistance (Abedon et al., 2011; Loc-Carrillo and Abedon, 2011; Nilsson, 2014; Gordillo Altamirano and Barr, 2019). However, the effective dosing and administration of phages to the body during phage therapy remains a major challenge. Our understanding of the interactions between bacteriophages and mammalian cells may have important implications for phage therapy. In this article, we investigate the interactions between phages and in vitro tissue culture. We demonstrate that cell type plays a major role in the uptake process of phages, with individual cells taking up phages at different rates, even among the same cell types (e.g., epithelial, endothelial, etc.). Uptake rates were validated under shear stress conditions using a microfluidic device that mimics the shear stress to which endothelial cells are exposed to in situ (Han et al., 2012; Hosta-Rigau and Städler, 2013), with uptake shown to be comparable to static conditions. Using live cell imaging, we show that phages accumulate within cells over time and that smaller phages are internalized at higher rates than larger phages. Phages were found to adhere to mammalian cells, with adherent phages being internalized by macropinocytosis over the following 18 hr of incubation, with functional phages accumulating and stably persisting within the cells. Finally, we incorporate our results into an established pharmacokinetic (PK) model (Lin et al., 2020), demonstrating the potential impact of phage accumulation by epithelial and endothelial tissues, which represent an unaccounted sink of phages within the body. Our study provides novel insights into the uptake of phages by mammalian cell layers.
The mechanism of non-specific phage uptake by in vitro tissue culture cell lines was previously demonstrated to occur via macropinocytosis (Nguyen et al., 2017). We used mostly the same cell types as in the Nguyen study to ensure macropinocytosis was also the main entry way for phages into our cells. Cell types have been reported to have differing basal rates of macropinocytosis depending on their function and location within the body (Kerr and Teasdale, 2009), thereby influencing their rate of phage uptake. We found a high level of heterogeneity regarding phage uptake and internalization across all cell lines in our study (Figure 1). We have verified this finding multiple times and demonstrate that it is specific to neither cell type nor phage. Even though the cells used for microscopy were always a confluent cell layer, it is possible that the cell cycle were not synchronized, thereby contributing to differential uptake rates of phages among the same population of cells. Further, the mucus layer is known to interact with phages (Barr et al., 2013, 2015) and may play a role in the heterogeneity of phage uptake. Most of the cell lines used were non-mucus producing cells. However, we did test the effect of phage internalization on two mucus producing cell lines: A549s, which are a lung epithelial cell line that produce a thin mucus lining, and HT29s, which are a colonic epithelial cell line that produce a thicker mucus layer. A549s had the highest level of phage internalization, while HT29s with their significantly thicker mucosa had minimal phage internalization over a 2-hr period (Figure 1). Thus, it is likely that thicker mucus layer reduced the number of phages that were in contact with the cell membrane, thereby decreasing phage internalization.
The macropinosome plays an important role in the presentation of antigens for pattern recognition receptors located in other organelles and in the activation of innate immune responses (Canton, 2018). It is clear that labeled phages accumulate within the macropinosomes over time, but whether they were subsequently degraded by the endosomal/lysosomal system or recycled and fused back with the plasma membrane remains to be investigated (Kerr and Teasdale, 2009). Here, we propose that phages that come in contact with mammalian tissue layers can interact with and adhere to the cell membrane. This adherence leads to an internalization of membrane-associated phages via non-specific macropinocytosis, which allows for the steady accumulation of phages within the cell over time. Following phage uptake by mammalian tissues, the fate of internalized phages is multifaceted and has been demonstrated to include; phage inactivation by the cell (Geier et al., 1975) transcytosis and secretion of active phages on contralateral cell layers (Nguyen et al., 2017), dissemination of phages throughout the body (Ghose et al., 2019), and inactivation of phages by innate immunity (Sweere et al., 2019). Further research is required to probe the specific mechanisms of phage adherence, uptake, and the cellular mechanisms that govern the trafficking of phages within cells (Talman et al., 2019; Bodner et al., 2020).
Using three different phages, from different families, with different sizes, we were able to show an effect of phage morphology and size on the rate of uptake across three different cell lines. Using real-time microscopy, we demonstrate that the smaller sized Podoviridae phage particles had increased rates of uptake, especially in low uptake cell lines. One hypothesis for the increased uptake of these smaller sized phages may simply be the result of an increased number of particles capable of interacting with actin-mediated ruffles associated with of macropinosome formation, thereby leading to a higher number of phages engulfed within each macropinosome (Swanson and Watts, 1995; Kerr and Teasdale, 2009). It is also possible that there is a difference in ruffle size across cell lines leading to a predisposition of some cells to uptake differently shaped and sized phages. A similar relationship between particle size and uptake has been made with nanoparticles, where it was observed that 50-nm sized nanoparticles had high rates of uptake, which coincidentally are of similar size as our T3 phages (Yin Win and Feng, 2005; Lu et al., 2009; Zhu et al., 2013). It was also shown that the cell type as well as the particles shape influenced uptake, with disc-shaped particles having higher rates of uptake compared with elongated rod shapes. Again, our T3 phages are coincidentally similarly shaped to the disc-shaped particles (Agarwal et al., 2013; Hsiao et al., 2014), indicating that the shape of phages may play a role in their uptake: a factor that we cannot rule out from our study. It is intriguing to speculate that much of the research into nanoparticle delivery has converged upon parameters analogous with biology's own naturally occurring nanoparticles: the bacteriophages.
We observed that following the adsorption of phages with in vitro cell culture layers, a high proportion of phages were inactivated (Figure 5B): a phenomenon which, to our knowledge, has not been previously reported. Our first hypothesis to explain this rapid inactivation is that upon interaction with cell surface features, phages are mechanically triggered to eject their genomes, thereby leading to inactivation (Kellermayer et al., 2018). This would implicate an increase of phage DNA at the cell surface, which we observed via ddPCR results, along with a concomitant decrease in functional phage particles. Another hypothesis is that the transient and non-specific interactions between the phages and the cell surface features, including glycoproteins, glycolipids, and mucins (Barr et al., 2013), may physically block or impede the phage such that it is unable to access its host bacterial receptor for plaque quantification, thereby only being detected via ddPCR. Finally, this inactivation could be the result of the degradation of the phage capsid due to enzymes, secretions, or cellular products; though our negative controls show this is unlikely as there was no effect of spent cell culture media on phage infectivity (Figure S7). At this stage, while we cannot conclude the specific mechanisms inducing this loss of phage viability, our results suggest that this inactivation and adsorption to the tissue may represent a potential sink for circulating phages in the body. In a healthy gut microbiome, phages play a major role in controlling the bacterial population. The gut epithelium likely influences phage abundances in the gut via these same uptake and inactivation mechanisms, which could further impact the gut microbiome and its disease states (Gogokhia et al., 2019).
During phage therapy, the cells, tissues, organs, and systems of the body play an important role in the efficacy of treatment due to their effect on the sequestration of active phages and subsequently limiting accessibility of phages to the site of infection (Dąbrowska, 2019; Dąbrowska and Abedon, 2019). It has been proposed that the MPS is primarily responsible for the filtering and removal of the phages during phage therapy, with the liver and spleen considered the main organs responsible for filtering out circulating phages (Geier et al., 1973; Merril et al., 1996; Hodyra-Stefaniak et al., 2015). Recent case studies of phage PK following IV administration have shown rapid clearance in both humans and animal models, with over >99% of phages applied removed from circulation within the first few hours (Schooley et al., 2017; Y.-W. Lin et al., 2020). In a literature review, Dąbrowska (2019) noted that the phage titers in the blood immediately following intravenous injection (1–5 min) were markedly less than the expected hypothetical dilutions. Even when accounting for phage dilutions in the blood or total body volume, phage titers only reached between 0.02% and 0.4% of their predicted titers. This suggests that there is significant and rapid uptake of phages by the organs and cells of the MPS or alternatively the sequestration of phages by epithelial and endothelial tissues. All of the cell lines that were used in this study, including; endothelial, epithelial, macrophages, or fibroblast, may be in contact with phages at any time during therapy. Our results demonstrate that phages adhered to and were subsequently internalized by these cells (Figure 5B). The model we developed in this study (Figure 6), while preliminary, illustrated the potential impact that tissues play on the inactivation of phages following their delivery to a patient, with phages most likely displaying non-linear PK (in addition to non-linear clearance). We suggest that cell layers are a potential sink for phages and that these interactions may have unrecognized consequences on phage dosing and PK during treatment. Further research investigating the potential interactions between phages and mammalian tissues and cell layers in vivo is needed.
Limitations of the study
Our study describes the uptake of bacteriophages by mammalian tissues and applies these findings toward the administration of phages to the body. However, there are a number of important limitations and caveats to our study. Firstly, our study has been conducted using in vitro tissue culture cell lines and does not include any primary cell lines or in vivo animal models. Conducting in vivo animal models to investigate the non-specific uptake of phages by epithelial and endothelial tissues is challenging. Treating animals with phages intravenously, which is one common way of administering phages to a patient, has been done many times in prior literature (Keller and Engley, 1958; Geier et al., 1973; Hodyra-Stefaniak et al., 2015; Lin et al., 2020). However, the removal/inactivation of administered phages by the animals does not directly relate to our proposed epithelial and endothelial uptake mechanism, with additional intertwined phage removal mechanisms also at play, including phagocytic cells, MPS system, and adaptive immune response. As an alternative to in vivo models, we report data using a microfluidic model system and a phage PK model. Further in vivo studies are needed to investigate the influence of phage uptake by mammalian tissues and its impact on phage therapy.
We also described an effect between different phages, with varying size and morphology, and their subsequent uptake by mammalian cells, with smaller sized phages being internalized at higher numbers. We demonstrated this using three model E. coli phages: T4, lambda, and T3 phage, representing a large, medium, and smaller sized phage. Even though the phages used here are from different families, they are all dsDNA Caudovirales infecting E. coli strains. It is important to note that we have not tested other phage types, such as ssDNA, RNA, or filamentous phages, which could lead to different results. Further, phage size is only one potential factor likely influencing mammalian uptake rates. Additional phages and their associated physical parameters, including size, morphology, host range, and capsid proteins, along with representative nanoparticles, need to be investigated to confirm this observation.
Resource availability
Lead contact
Jeremy J. Barr.
Materials availability
This study did not generate any unique materials.
Data and code availability
This study did not create any data or code that was not already available.
Methods
All methods can be found in the accompanying transparent methods supplemental file.
Acknowledgments
We thank the following labs for kindly providing the cell lines: Hudson Institute of Medical Research and the Oncogenic Signaling Laboratory for providing the A549 cell line; the Nucleic Acids and Innate Immunity Research Group for providing the HT29 and BJ cell lines; the University of Melbourne and the Obstetrics, Nutrition and Endocrinology Group for providing the HUVECs; Monash University and the Moseley Laboratory for providing the HeLa cell line. We thank the following facilities for kindly providing equipment and guidance: Monash Micro Imaging Facility for help with microscopy acquisition, Monash School of Engineering for providing support in the fabrication of microfluidic devices, and Department of Biochemistry and Molecular Biology (Monash Biomedicine Discovery Institute) Imaging Facility for providing access to the ddPCR equipment. This work was performed in part at the Melbourne Center for Nanofabrication (MCN) in the Victorian Node of the Australian National Fabrication Facility (ANFF). M.C.B. was supported by Monash Graduate Scholarship (MGS). C.A.H. was supported by the Australia-Americas PhD Research Internship Program through the Australian Academy of Science. A.O. and N.H.V. were supported by CSIRO's Probing Biosystems Future Science Platform and the ARC Training Center for Personalised Therapeutic Technologies (IC170100016). J.L. is an NHMRC Principle Research Fellow. This work, including the efforts of J.J.B., was funded by the Australian Research Council DECRA Fellowship (DE170100525), National Health and Medical Research Council (NHMRC: 1156588), and the Perpetual Trustees Australia award (2018HIG00007).
Author contributions
Conceptualization, M.C.B. and J.J.B.; methodology, M.C.B., W.H.C., W.R., C.A.H., A.O., and O.C.; formal analysis, M.C.B., Y.W.L., L.A.F., and V.H.; investigation, M.C.B.; resources, A.N., N.H.V., and J.J.B.; writing – original draft preparation, M.C.B., R.P., and J.J.B.; writing – review and editing, all authors contributed; supervision and funding acquisition, J.J.B.
Declaration of interests
J.J.B. has a patent application related to this work (WO2018129536A1).
Published: April 23, 2021
Footnotes
Supplemental information can be found online at https://doi.org/10.1016/j.isci.2021.102287.
Supplemental information
References
- Abaci H.E., Shen Y.I., Tan S., Gerecht S. Recapitulating physiological and pathological shear stress and oxygen to model vasculature in health and disease. Sci. Rep. 2014;4:1–9. doi: 10.1038/srep04951. [DOI] [PMC free article] [PubMed] [Google Scholar]
- Abedon S.T., Kuhl S.J., Blasdel B.G., Kutter E.M. Phage treatment of human infections. Bacteriophage. 2011;1:66–85. doi: 10.4161/bact.1.2.15845. [DOI] [PMC free article] [PubMed] [Google Scholar]
- Agarwal R., Singh V., Jurney P., Shi L., Sreenivasan S.V., Roy K. Mammalian cells preferentially internalize hydrogel nanodiscs over nanorods and use shape-specific uptake mechanisms. Proc. Natl. Acad. Sci. U S A. 2013;110:17247–17252. doi: 10.1073/pnas.1305000110. [DOI] [PMC free article] [PubMed] [Google Scholar]
- Barr J.J., Auro R., Furlan M., Whiteson K.L., Erb M.L., Pogliano J., Stotland A., Wolkowicz R., Cutting A.S., Doran K.S. Bacteriophage adhering to mucus provide a non-host-derived immunity. Proc. Natl. Acad. Sci. U S A. 2013;110:10771–10776. doi: 10.1073/pnas.1305923110. [DOI] [PMC free article] [PubMed] [Google Scholar]
- Barr J.J., Auro R., Sam-Soon N., Kassegne S., Peters G., Bonilla N., Hatay M., Mourtada S., Bailey B., Youle M. Subdiffusive motion of bacteriophage in mucosal surfaces increases the frequency of bacterial encounters. Proc. Natl. Acad. Sci. U S A. 2015;112:13675–13680. doi: 10.1073/pnas.1508355112. [DOI] [PMC free article] [PubMed] [Google Scholar]
- Barr J.J. A bacteriophages journey through the human body. Immunol. Rev. 2017;279:106–122. doi: 10.1111/imr.12565. [DOI] [PubMed] [Google Scholar]
- Bodner K., Melkonian A.L., Barth A.I.M., Kudo T., Tanouchi Y., Covert M.W. Engineered fluorescent E. coli lysogens allow live-cell imaging of functional prophage induction triggered inside macrophages. Cell Syst. 2020;10:254–264.e9. doi: 10.1016/j.cels.2020.02.006. [DOI] [PubMed] [Google Scholar]
- Bonilla N., Rojas M.I., Netto Flores Cruz G., Hung S.H., Rohwer F., Barr J.J. ‘Phage on tap–a quick and efficient protocol for the preparation of bacteriophage laboratory stocks’. PeerJ. 2016;4:e2261. doi: 10.7717/peerj.2261. [DOI] [PMC free article] [PubMed] [Google Scholar]
- Breitbart M., Hewson I., Felts B., Mahaffy J.M., Nulton J., Salamon P., Rohwer F. Metagenomic analyses of an uncultured viral community from human feces. J. Bacteriol. 2003;185:6220–6223. doi: 10.1128/JB.185.20.6220-6223.2003. [DOI] [PMC free article] [PubMed] [Google Scholar]
- Canton J. Macropinocytosis: new insights into its underappreciated role in innate immune cell surveillance. Front. Immunol. 2018;9:2286. doi: 10.3389/fimmu.2018.02286. [DOI] [PMC free article] [PubMed] [Google Scholar]
- Carroll-Portillo A., Lin H.C. Bacteriophage and the innate immune system: access and signaling. Microorganisms. 2019;7:1–11. doi: 10.3390/microorganisms7120625. [DOI] [PMC free article] [PubMed] [Google Scholar]
- Chin W.H., Barr J.J. Phage Research in “Organ-on-chip” Devices. Microbiol. Aust. 2019:28–32. [Google Scholar]
- Clokie M.R., Millard A.D., Letarov A.V., Heaphy S. Phages in nature. Bacteriophage. 2011;1:31–45. doi: 10.4161/bact.1.1.14942. [DOI] [PMC free article] [PubMed] [Google Scholar]
- Dabrowska K., Switała-Jelen K., Opolski A., Weber-Dabrowska B., Gorski A. Bacteriophage penetration in vertebrates. J. Appl. Microbiol. 2005;98:7–13. doi: 10.1111/j.1365-2672.2004.02422.x. [DOI] [PubMed] [Google Scholar]
- Dąbrowska K. Phage therapy: what factors shape phage pharmacokinetics and bioavailability? Systematic and critical review. Med. Res. Rev. 2019;39:2000–2025. doi: 10.1002/med.21572. [DOI] [PMC free article] [PubMed] [Google Scholar]
- Dąbrowska K., Abedon S.T. Pharmacologically aware phage therapy: pharmacodynamic and pharmacokinetic obstacles to phage antibacterial action in animal and human bodies. Microbiol. Mol. Biol. Rev. 2019;83:1–25. doi: 10.1128/MMBR.00012-19. [DOI] [PMC free article] [PubMed] [Google Scholar]
- Davies P.F., Spaan J.A., Krams R. Shear Stress Biology of the Endothelium. Ann. Biomed. Eng. 2005;33:1714–1718. doi: 10.1007/s10439-005-8774-0. [DOI] [PubMed] [Google Scholar]
- Dor-On E., Solomon B. Targeting glioblastoma via intranasal administration of Ff bacteriophages. Front. Microbiol. 2015;6:530. doi: 10.3389/fmicb.2015.00530. [DOI] [PMC free article] [PubMed] [Google Scholar]
- Doub J.B., Ng V.Y., Johnson A.J., Slomka M., Fackler J., Horne B., Brownstein M.J., Henry M., Malagon F., Biswas B. Salvage bacteriophage therapy for a chronic MRSA prosthetic joint infection. Antibiotics. 2020;9:241. doi: 10.3390/antibiotics9050241. [DOI] [PMC free article] [PubMed] [Google Scholar]
- Geier M.R., Attallah A.F., Merril C.R. Characterization of Escherichia coli bacterial viruses in commercial sera. In Vitro. 1975;11:55–58. doi: 10.1007/BF02615323. [DOI] [PubMed] [Google Scholar]
- Geier M.R., Trigg M.E., Merril C.R. Fate of bacteriophage lambda in Non-immune germ-free mice. Nature. 1973;246:221–223. doi: 10.1038/246221a0. [DOI] [PubMed] [Google Scholar]
- Ghose C., Ly M., Schwanemann L.K., Shin J.H., Atab K., Barr J.J., Little M., Schooley R.T., Chopyk J., Pride D.T. The virome of cerebrospinal fluid: viruses where we once thought there were none. Front. Microbiol. 2019;10:2061. doi: 10.3389/fmicb.2019.02061. [DOI] [PMC free article] [PubMed] [Google Scholar]
- Gogokhia L., Buhrke K., Bell R., Hoffman B., Brown D.G., Hanke-Gogokhia C., Ajami N.J., Wong M.C., Ghazaryan A., Valentine J.F. Expansion of bacteriophages is linked to aggravated intestinal inflammation and colitis. Cell Host Microbe. 2019;25:285–299.e8. doi: 10.1016/j.chom.2019.01.008. [DOI] [PMC free article] [PubMed] [Google Scholar]
- Gordillo Altamirano F.L., Barr J.J. Phage therapy in the postantibiotic era. Clin. Microbiol. Rev. 2019;32:1–25. doi: 10.1128/CMR.00066-18. [DOI] [PMC free article] [PubMed] [Google Scholar]
- Gorski A., Dabrowska K., Switala-Jeleń K., Nowaczyk M., Weber-Dabrowska B., Boratynski J., Wietrzyk J., Opolski A. New insights into the possible role of bacteriophages in host defense and disease. Med. Immunol. 2003;2:2. doi: 10.1186/1476-9433-2-2. [DOI] [PMC free article] [PubMed] [Google Scholar]
- Górski A., Ważna E., Dąbrowska B.-W., Dąbrowska K., Świtała-Jeleń K., Międzybrodzki R. Bacteriophage translocation. FEMS Immunol. Med. Microbiol. 2006;46:313–319. doi: 10.1111/j.1574-695X.2006.00044.x. [DOI] [PubMed] [Google Scholar]
- Han J., Zern B.J., Shuvaev V.V., Davies P.F., Muro S., Muzykantov V. Acute and chronic shear stress differently regulate endothelial internalization of nanocarriers targeted to platelet-endothelial cell adhesion molecule-1. ACS Nano. 2012;6:8824–8836. doi: 10.1021/nn302687n. [DOI] [PMC free article] [PubMed] [Google Scholar]
- Handley S.A., Thackray L.B., Zhao G., Presti R., Miller A.D., Droit L., Abbink P., Maxfield L.F., Kambal A., Duan E. pathogenic simian immunodeficiency virus infection is associated with expansion of the enteric virome. Cell. 2013;151:253–266. doi: 10.1016/j.cell.2012.09.024. [DOI] [PMC free article] [PubMed] [Google Scholar]
- Hatfull G.F. Dark matter of the biosphere: the amazing world of bacteriophage diversity. J. Virol. 2015;89:8107–8110. doi: 10.1128/JVI.01340-15. [DOI] [PMC free article] [PubMed] [Google Scholar]
- Hildebrand G.J., Wolochow H. Translocation of bacteriophage across the intestinal wall of the rat. Exp. Biol. Med. 1962;109:183–185. doi: 10.3181/00379727-109-27146. [DOI] [PubMed] [Google Scholar]
- Hodyra-Stefaniak K., Miernikiewicz P., Drapała J., Drab M., Jończyk-Matysiak E., Lecion D., Kaźmierczak Z., Beta W., Majewska J., Harhala M. Mammalian Host-Versus-Phage immune response determines phage fate in vivo. Sci. Rep. 2015;5:1–13. doi: 10.1038/srep14802. [DOI] [PMC free article] [PubMed] [Google Scholar]
- Hodyra-Stefaniak K., Lahutta K., Majewska J., Kaźmierczak Z., Lecion D., Harhala M., Kęska W., Owczarek B., Jończyk-Matysiak E., Kłopot A. Bacteriophages engineered to display foreign peptides may become short-circulating phages. Microb. Biotechnol. 2019;12:730–741. doi: 10.1111/1751-7915.13414. [DOI] [PMC free article] [PubMed] [Google Scholar]
- Hoffmann M. Animal experiments on mucosal passage and absorption viraemia of T3 phages after oral, trachéal and rectal administration. Zentralbl. Bakteriol. Orig. 1965;198:371–390. [PubMed] [Google Scholar]
- Hosta-Rigau L., Städler B. Shear stress and its effect on the interaction of myoblast cells with nanosized drug delivery vehicles. Mol. Pharm. 2013;10:2707–2712. doi: 10.1021/mp4001298. [DOI] [PubMed] [Google Scholar]
- Hsiao I.-L., Gramatke A.M., Joksimovic R., Sokolowski M., Gradzielski M., Haase A. Size and cell type dependent uptake of silica nanoparticles. J. Nanomed. Nanotechnol. 2014;05:248. [Google Scholar]
- Huh H., Wong S., St Jean J., Slavcev R. Bacteriophage interactions with mammalian tissue: therapeutic applications. Adv. Drug Deliv. Rev. 2019;145:4–17. doi: 10.1016/j.addr.2019.01.003. [DOI] [PubMed] [Google Scholar]
- Karimi M., Mirshekari H., Moosavi Basri S.M., Bahrami S., Moghoofei M., Hamblin M.R. Bacteriophages and phage-inspired nanocarriers for targeted delivery of therapeutic cargos. Adv. Drug Deliv. Rev. 2016;106:45–62. doi: 10.1016/j.addr.2016.03.003. [DOI] [PMC free article] [PubMed] [Google Scholar]
- Keller R., Engley F.B. Fate of bacteriophage particles introduced into mice by various routes. Exp. Biol. Med. 1958;98:577–580. doi: 10.3181/00379727-98-24112. [DOI] [PubMed] [Google Scholar]
- Kellermayer M.S.Z., Vörös Z., Csík G., Herényi L. Forced phage uncorking: viral DNA ejection triggered by a mechanically sensitive switch. Nanoscale. 2018;10:1898. doi: 10.1039/c7nr05897g. [DOI] [PubMed] [Google Scholar]
- Kerr M.C., Teasdale R.D. Defining macropinocytosis. Traffic. 2009;10:364–371. doi: 10.1111/j.1600-0854.2009.00878.x. [DOI] [PubMed] [Google Scholar]
- Kim H.J., Huh D., Hamilton G., Ingber D.E. Human gut-on-a-chip inhabited by microbial flora that experiences intestinal peristalsis-like motions and flow. R. Soc. Chem. 2012;12:2165–2174. doi: 10.1039/c2lc40074j. [DOI] [PubMed] [Google Scholar]
- Kim H.J., Li H., Collins J.J., Ingber D.E. Contributions of microbiome and mechanical deformation to intestinal bacterial overgrowth and inflammation in a human gut-on-a-chip. Proc. Natl. Acad. Sci. U S A. 2016;113:E7–E15. doi: 10.1073/pnas.1522193112. [DOI] [PMC free article] [PubMed] [Google Scholar]
- Kim L., Toh Y.C., Voldman J., Yu H. A practical guide to microfluidic perfusion culture of adherent mammalian cells. Lab Chip. 2007;7:681–694. doi: 10.1039/b704602b. [DOI] [PubMed] [Google Scholar]
- Kutter E., De Vos D., Gvasalia G., Alavidze Z., Gogokhia L., Kuhl S., Abedon S.T. Phage therapy in clinical practice: treatment of human infections. Curr. Pharm. Biotechnol. 2010;11:69–86. doi: 10.2174/138920110790725401. [DOI] [PubMed] [Google Scholar]
- Lehti T.A., Pajunen M.I., Skog M.S., Finne J. Internalization of a polysialic acid-binding Escherichia coli bacteriophage into eukaryotic neuroblastoma cells. Nat. Commun. 2017;8:1915. doi: 10.1038/s41467-017-02057-3. [DOI] [PMC free article] [PubMed] [Google Scholar]
- Lin Y.W., Chang R.Y., Rao G.G., Jermain B., Han M.L., Zhao J.X., Chen K., Wang J.P., Barr J.J., Schooley R.T. Pharmacokinetics/pharmacodynamics of antipseudomonal bacteriophage therapy in rats: a Proof-of-Concept study. Clin. Microbiol. Infect. 2020;26(9):1229–1235. doi: 10.1016/j.cmi.2020.04.039. [DOI] [PubMed] [Google Scholar]
- Loc-Carrillo C., Abedon S.T. Pros and cons of phage therapy. Bacteriophage. 2011;1(2):111–114. doi: 10.4161/bact.1.2.14590. [DOI] [PMC free article] [PubMed] [Google Scholar]
- Lu F., Wu S.H., Hung Y., Mou C.Y. Size effect on cell uptake in well-suspended, uniform mesoporous silica nanoparticles. Small. 2009;5:1408–1413. doi: 10.1002/smll.200900005. [DOI] [PubMed] [Google Scholar]
- Manrique P., Bolduc B., Walk S.T., van der Oost J., de Vos W.M., Young M.J. Healthy human gut phageome. Proc. Natl. Acad. Sci. U S A. 2016;113:10400–10405. doi: 10.1073/pnas.1601060113. [DOI] [PMC free article] [PubMed] [Google Scholar]
- Matsuzaki S., Uchiyama J. Phage pharmacokinetics: relationship with administration route. In: Górski A., Międzybrodzki R., Borysowski J., editors. Phage Therapy: A Practical Approach. Springer; 2019. pp. 43–57. [Google Scholar]
- McQuin C., Goodman A., Chernyshev V., Kamentsky L., Cimini B.A., Karhohs K.W., Doan M., Ding L., Rafelski S.M., Thirstrup D. CellProfiler 3.0: next-generation image processing for biology. PLoS Biol. 2018;16:e2005970. doi: 10.1371/journal.pbio.2005970. [DOI] [PMC free article] [PubMed] [Google Scholar]
- Merril C.R., Biswas B., Carlton R., Jensen N.C., Creed G.J., Zullo S., Adhya S. Long-circulating bacteriophage as antibacterial agents. Proc. Natl. Acad. Sci. U S A. 1996;93:3188–3192. doi: 10.1073/pnas.93.8.3188. [DOI] [PMC free article] [PubMed] [Google Scholar]
- Merril C.R., Scholl D., Adhya S.L. The prospect for bacteriophage therapy in Western medicine. Nat. Rev. Drug Discov. 2003;2:489–497. doi: 10.1038/nrd1111. [DOI] [PubMed] [Google Scholar]
- Miȩdzybrodzki R., Kłak M., Jończyk-Matysiak E., Bubak B., Wójcik A., Kaszowska M., Weber-Dąbrowska B., Lobocka M., Górski A. Means to facilitate the overcoming of gastric juice barrier by a therapeutic staphylococcal bacteriophage A5/80. Front. Microbiol. 2017;8:1–11. doi: 10.3389/fmicb.2017.00467. [DOI] [PMC free article] [PubMed] [Google Scholar]
- Navabi N., McGuckin M.A., Linden S.K. Gastrointestinal cell lines form polarized epithelia with an adherent mucus layer when cultured in semi-wet interfaces with mechanical stimulation. PLoS One. 2013;8:e68761. doi: 10.1371/journal.pone.0068761. [DOI] [PMC free article] [PubMed] [Google Scholar]
- Nguyen S., Baker K., Padman B.S., Patwa R., Dunstan R.A., Weston T.A., Schlosser K., Bailey B., Lithgow T., Lazarou M. Bacteriophage transcytosis provides a mechanism to cross epithelial cell layers. mBio. 2017;8:e01874-17. doi: 10.1128/mBio.01874-17. [DOI] [PMC free article] [PubMed] [Google Scholar]
- Nilsson A.S. Phage therapy-constraints and possibilities. Ups J. Med. Sci. 2014;119:192–198. doi: 10.3109/03009734.2014.902878. [DOI] [PMC free article] [PubMed] [Google Scholar]
- Park J.Y., White J.B., Walker N., Kuo C.H., Cha W., Meyerhoff M.E., Takayama S. Responses of endothelial cells to extremely slow flows. Biomicrofluidics. 2011;5:22211. doi: 10.1063/1.3576932. [DOI] [PMC free article] [PubMed] [Google Scholar]
- Payne R.J.H., Jansen V.A.A. Phage therapy: the peculiar kinetics of self-replicating pharmaceuticals. Clin. Pharmacol. Ther. 2000;68:225–230. doi: 10.1067/mcp.2000.109520. [DOI] [PubMed] [Google Scholar]
- Payne R.J., Jansen V.A. Understanding bacteriophage therapy as a density-dependent kinetic process. J. Theor. Biol. 2001;208:37–48. doi: 10.1006/jtbi.2000.2198. [DOI] [PubMed] [Google Scholar]
- Rohwer F. Global phage diversity. Cell. 2003;113:141. doi: 10.1016/s0092-8674(03)00276-9. [DOI] [PubMed] [Google Scholar]
- Rohwer F., Segall A.M. In retrospect: a century of phage lessons. Nature. 2015;528:46–48. doi: 10.1038/528046a. [DOI] [PubMed] [Google Scholar]
- Schooley R.T., Biswas B., Gill J.J., Hernandez-Morales A., Lancaster J., Lessor L., Barr J.J., Reed S.L., Rohwer F., Benler S. Development and use of personalized bacteriophage-based therapeutic cocktails to treat a patient with a disseminated resistant Acinetobacter baumannii infection. Antimicrob. Agents Chemother. 2017;61:1–14. doi: 10.1128/AAC.00954-17. [DOI] [PMC free article] [PubMed] [Google Scholar]
- Sender R., Fuchs S., Milo R. Are we really vastly outnumbered? revisiting the ratio of bacterial to host Cells in humans. Cell. 2016;164:337–340. doi: 10.1016/j.cell.2016.01.013. [DOI] [PubMed] [Google Scholar]
- Shkoporov A.N., Hill C. Bacteriophages of the human gut: the “known unknown” of the microbiome. Cell Host Microbe. 2019;25:195–209. doi: 10.1016/j.chom.2019.01.017. [DOI] [PubMed] [Google Scholar]
- Son Y. Determination of shear viscosity and shear rate from pressure drop and flow rate relationship in a rectangular channel. Polymer. 2007;48:632–637. [Google Scholar]
- Srivastava A.S., Chauhan D.P., Carrier E. In utero detection of T7 phage after systemic administration to pregnant mice. BioTechniques. 2004;37:81–83. doi: 10.2144/04371ST04. [DOI] [PubMed] [Google Scholar]
- Swanson J.A., Watts C. Macropinocytosis. Trends Cell Biol. 1995;5:424–428. doi: 10.1016/s0962-8924(00)89101-1. [DOI] [PubMed] [Google Scholar]
- Sweere J.M., Van Belleghem J.D., Ishak H., Bach M.S., Popescu M., Sunkari V., Kaber G., Manasherob R., Suh G.A., Cao X. Bacteriophage trigger antiviral immunity and prevent clearance of bacterial infection. Science. 2019;363:eaat9691. doi: 10.1126/science.aat9691. [DOI] [PMC free article] [PubMed] [Google Scholar]
- Talman L., Agmon E., Peirce S.M., Covert M.W. Multiscale models of infection. Curr. Opin. Biomed. Eng. 2019;11:102–108. [Google Scholar]
- Tao P., Mahalingam M., Marasa B.S., Zhang Z., Chopra A.K., Rao V.B. In vitro and in vivo delivery of genes and proteins using the bacteriophage T4 DNA packaging machine. Proc. Natl. Acad. Sci. U S A. 2013;110:5846–5851. doi: 10.1073/pnas.1300867110. [DOI] [PMC free article] [PubMed] [Google Scholar]
- Thuenauer R., Rodriguez-Boulan E., Römer W. Microfluidic approaches for epithelial cell layer culture and characterisation. Analyst. 2014;139:3206–3218. doi: 10.1039/c4an00056k. [DOI] [PMC free article] [PubMed] [Google Scholar]
- Van Belleghem J.D., Dąbrowska K., Vaneechoutte M., Barr J.J., Bollyky P.L. Interactions between bacteriophage, bacteria, and the mammalian immune system. Viruses. 2019;11:10. doi: 10.3390/v11010010. [DOI] [PMC free article] [PubMed] [Google Scholar]
- Wang C., Lu H., Schwartz M.A. A novel in vitro flow system for changing flow direction on endothelial cells. J. Biomech. 2012;45:1212–1218. doi: 10.1016/j.jbiomech.2012.01.045. [DOI] [PMC free article] [PubMed] [Google Scholar]
- Wang H., Song M. Ckmeans.1d.dp: optimal k-means clustering in one dimension by dynamic programming. R. J. 2011;3:29–33. [PMC free article] [PubMed] [Google Scholar]
- Yin Win K., Feng S.S. Effects of particle size and surface coating on cellular uptake of polymeric nanoparticles for oral delivery of anticancer drugs. Biomaterials. 2005;26:2713–2722. doi: 10.1016/j.biomaterials.2004.07.050. [DOI] [PubMed] [Google Scholar]
- Yum K., Hong S.G., Healy K.E., Lee L.P. Physiologically relevant organs on chips. Biotechnol. J. 2014;9:16–27. doi: 10.1002/biot.201300187. [DOI] [PMC free article] [PubMed] [Google Scholar]
- Zhu J., Liao L., Zhu L., Zhang P., Guo K., Kong J., Ji C., Liu B. Size-dependent cellular uptake efficiency, mechanism, and cytotoxicity of silica nanoparticles toward HeLa cells. Talanta. 2013;107:408–415. doi: 10.1016/j.talanta.2013.01.037. [DOI] [PubMed] [Google Scholar]
Associated Data
This section collects any data citations, data availability statements, or supplementary materials included in this article.
Supplementary Materials
Phages were applied to the cell layer and incubated for two hours (or one hour for Videos S8 and S9) on a μ-Slide 8 well glass bottom slide on a microscope stage with temperature and CO2 control. One image was acquired every two minutes on an inverted Leica SP8 confocal microscope with HC PL APO 63x/1.40 CS2 oil immersion objective. A hybrid detector (HyD) was used in sequential mode to visualise phage DNA. Cells were stained with nucleus stain, Hoescht 33342 (blue), plasma membrane stain, CellMask (magenta) and T4 phages labelled with DNA-complexing stain, SYBR-Gold (green). Scale bar: 10 μm; Timing: hours:minutes.
Phages were applied to the cell layer and incubated for two hours (or one hour for Videos S8 and S9) on a μ-Slide 8 well glass bottom slide on a microscope stage with temperature and CO2 control. One image was acquired every two minutes on an inverted Leica SP8 confocal microscope with HC PL APO 63x/1.40 CS2 oil immersion objective. A hybrid detector (HyD) was used in sequential mode to visualise phage DNA. Cells were stained with nucleus stain, Hoescht 33342 (blue), plasma membrane stain, CellMask (magenta) and T4 phages labelled with DNA-complexing stain, SYBR-Gold (green). Scale bar: 10 μm; Timing: hours:minutes.
Phages were applied to the cell layer and incubated for two hours (or one hour for Videos S8 and S9) on a μ-Slide 8 well glass bottom slide on a microscope stage with temperature and CO2 control. One image was acquired every two minutes on an inverted Leica SP8 confocal microscope with HC PL APO 63x/1.40 CS2 oil immersion objective. A hybrid detector (HyD) was used in sequential mode to visualise phage DNA. Cells were stained with nucleus stain, Hoescht 33342 (blue), plasma membrane stain, CellMask (magenta) and T4 phages labelled with DNA-complexing stain, SYBR-Gold (green). Scale bar: 10 μm; Timing: hours:minutes.
Phages were applied to the cell layer and incubated for two hours (or one hour for Videos S8 and S9) on a μ-Slide 8 well glass bottom slide on a microscope stage with temperature and CO2 control. One image was acquired every two minutes on an inverted Leica SP8 confocal microscope with HC PL APO 63x/1.40 CS2 oil immersion objective. A hybrid detector (HyD) was used in sequential mode to visualise phage DNA. Cells were stained with nucleus stain, Hoescht 33342 (blue), plasma membrane stain, CellMask (magenta) and T4 phages labelled with DNA-complexing stain, SYBR-Gold (green). Scale bar: 10 μm; Timing: hours:minutes.
Phages were applied to the cell layer and incubated for two hours (or one hour for Videos S8 and S9) on a μ-Slide 8 well glass bottom slide on a microscope stage with temperature and CO2 control. One image was acquired every two minutes on an inverted Leica SP8 confocal microscope with HC PL APO 63x/1.40 CS2 oil immersion objective. A hybrid detector (HyD) was used in sequential mode to visualise phage DNA. Cells were stained with nucleus stain, Hoescht 33342 (blue), plasma membrane stain, CellMask (magenta) and T4 phages labelled with DNA-complexing stain, SYBR-Gold (green). Scale bar: 10 μm; Timing: hours:minutes.
Phages were applied to the cell layer and incubated for two hours (or one hour for Videos S8 and S9) on a μ-Slide 8 well glass bottom slide on a microscope stage with temperature and CO2 control. One image was acquired every two minutes on an inverted Leica SP8 confocal microscope with HC PL APO 63x/1.40 CS2 oil immersion objective. A hybrid detector (HyD) was used in sequential mode to visualise phage DNA. Cells were stained with nucleus stain, Hoescht 33342 (blue), plasma membrane stain, CellMask (magenta) and T4 phages labelled with DNA-complexing stain, SYBR-Gold (green). Scale bar: 10 μm; Timing: hours:minutes.
Phages were applied to the cell layer and incubated for two hours (or one hour for Videos S8 and S9) on a μ-Slide 8 well glass bottom slide on a microscope stage with temperature and CO2 control. One image was acquired every two minutes on an inverted Leica SP8 confocal microscope with HC PL APO 63x/1.40 CS2 oil immersion objective. A hybrid detector (HyD) was used in sequential mode to visualise phage DNA. Cells were stained with nucleus stain, Hoescht 33342 (blue), plasma membrane stain, CellMask (magenta) and T4 phages labelled with DNA-complexing stain, SYBR-Gold (green). Scale bar: 10 μm; Timing: hours:minutes.
Phages were applied to the cell layer and incubated for two hours (or one hour for Videos S8 and S9) on a μ-Slide 8 well glass bottom slide on a microscope stage with temperature and CO2 control. One image was acquired every two minutes on an inverted Leica SP8 confocal microscope with HC PL APO 63x/1.40 CS2 oil immersion objective. A hybrid detector (HyD) was used in sequential mode to visualise phage DNA. Cells were stained with nucleus stain, Hoescht 33342 (blue), plasma membrane stain, CellMask (magenta) and T4 phages labelled with DNA-complexing stain, SYBR-Gold (green). Scale bar: 10 μm; Timing: hours:minutes.
Phages were applied to the cell layer and incubated for two hours (or one hour for Videos S8 and S9) on a μ-Slide 8 well glass bottom slide on a microscope stage with temperature and CO2 control. One image was acquired every two minutes on an inverted Leica SP8 confocal microscope with HC PL APO 63x/1.40 CS2 oil immersion objective. A hybrid detector (HyD) was used in sequential mode to visualise phage DNA. Cells were stained with nucleus stain, Hoescht 33342 (blue), plasma membrane stain, CellMask (magenta) and T4 phages labelled with DNA-complexing stain, SYBR-Gold (green). Scale bar: 10 μm; Timing: hours:minutes.
Phages were applied to the cell layer and incubated for two hours (or one hour for Videos S8 and S9) on a μ-Slide 8 well glass bottom slide on a microscope stage with temperature and CO2 control. One image was acquired every two minutes on an inverted Leica SP8 confocal microscope with HC PL APO 63x/1.40 CS2 oil immersion objective. A hybrid detector (HyD) was used in sequential mode to visualise phage DNA. Cells were stained with nucleus stain, Hoescht 33342 (blue), plasma membrane stain, CellMask (magenta) and T4 phages labelled with DNA-complexing stain, SYBR-Gold (green). Scale bar: 10 μm; Timing: hours:minutes.
Phages were applied to the cell layer and incubated for two hours (or one hour for Videos S8 and S9) on a μ-Slide 8 well glass bottom slide on a microscope stage with temperature and CO2 control. One image was acquired every two minutes on an inverted Leica SP8 confocal microscope with HC PL APO 63x/1.40 CS2 oil immersion objective. A hybrid detector (HyD) was used in sequential mode to visualise phage DNA. Cells were stained with nucleus stain, Hoescht 33342 (blue), plasma membrane stain, CellMask (magenta) and T4 phages labelled with DNA-complexing stain, SYBR-Gold (green). Scale bar: 10 μm; Timing: hours:minutes.
Phages were applied to the cell layer and incubated for two hours (or one hour for Videos S8 and S9) on a μ-Slide 8 well glass bottom slide on a microscope stage with temperature and CO2 control. One image was acquired every two minutes on an inverted Leica SP8 confocal microscope with HC PL APO 63x/1.40 CS2 oil immersion objective. A hybrid detector (HyD) was used in sequential mode to visualise phage DNA. Cells were stained with nucleus stain, Hoescht 33342 (blue), plasma membrane stain, CellMask (magenta) and T4 phages labelled with DNA-complexing stain, SYBR-Gold (green). Scale bar: 10 μm; Timing: hours:minutes.
Phages were applied to the cell layer and incubated for two hours (or one hour for Videos S8 and S9) on a μ-Slide 8 well glass bottom slide on a microscope stage with temperature and CO2 control. One image was acquired every two minutes on an inverted Leica SP8 confocal microscope with HC PL APO 63x/1.40 CS2 oil immersion objective. A hybrid detector (HyD) was used in sequential mode to visualise phage DNA. Cells were stained with nucleus stain, Hoescht 33342 (blue), plasma membrane stain, CellMask (magenta) and T4 phages labelled with DNA-complexing stain, SYBR-Gold (green). Scale bar: 10 μm; Timing: hours:minutes.
Phages were applied to the cell layer and incubated for two hours (or one hour for Videos S8 and S9) on a μ-Slide 8 well glass bottom slide on a microscope stage with temperature and CO2 control. One image was acquired every two minutes on an inverted Leica SP8 confocal microscope with HC PL APO 63x/1.40 CS2 oil immersion objective. A hybrid detector (HyD) was used in sequential mode to visualise phage DNA. Cells were stained with nucleus stain, Hoescht 33342 (blue), plasma membrane stain, CellMask (magenta) and T4 phages labelled with DNA-complexing stain, SYBR-Gold (green). Scale bar: 10 μm; Timing: hours:minutes.
Phages were applied to the cell layer and incubated for two hours (or one hour for Videos S8 and S9) on a μ-Slide 8 well glass bottom slide on a microscope stage with temperature and CO2 control. One image was acquired every two minutes on an inverted Leica SP8 confocal microscope with HC PL APO 63x/1.40 CS2 oil immersion objective. A hybrid detector (HyD) was used in sequential mode to visualise phage DNA. Cells were stained with nucleus stain, Hoescht 33342 (blue), plasma membrane stain, CellMask (magenta) and T4 phages labelled with DNA-complexing stain, SYBR-Gold (green). Scale bar: 10 μm; Timing: hours:minutes.
Data Availability Statement
This study did not create any data or code that was not already available.