

Abstract
Mitochondria possess a small genome that codes for core subunits of the oxidative phosphorylation system and whose expression is essential for energy production. Information on the regulation and spatial organization of mitochondrial gene expression in the cellular context has been difficult to obtain. Here we devise an imaging approach to analyze mitochondrial translation within the context of single cells, by following the incorporation of clickable non‐canonical amino acids. We apply this method to multiple cell types, including specialized cells such as cardiomyocytes and neurons, and monitor with spatial resolution mitochondrial translation in axons and dendrites. We also show that translation imaging allows to monitor mitochondrial protein expression in patient fibroblasts. Approaching mitochondrial translation with click chemistry opens new avenues to understand how mitochondrial biogenesis is integrated into the cellular context and can be used to assess mitochondrial gene expression in mitochondrial diseases.
Keywords: gene expression, hippocampal neuron, mitochondria, synapse, translation
Subject Categories: Methods & Resources, Protein Biosynthesis & Quality Control
This study monitors mitochondrial protein synthesis with spatial resolution in single cells of multiple cell types.
Introduction
Mitochondria support the metabolic and bioenergetic demands of cells. The mitochondrial oxidative phosphorylation system (OXPHOS) transforms energy from reducing equivalents into ATP. During evolution, mitochondria retained a genome (mtDNA), which encodes a small set of proteins (thirteen proteins in human), all of which are core components of the OXPHOS system. All other mitochondrial proteins are nuclear‐encoded, synthesized on cytosolic ribosomes, and transported into mitochondria (Wiedemann & Pfanner, 2017; Dennerlein et al, 2017; Grevel et al, 2019; Hansen & Herrmann, 2019). Accordingly, the OXPHOS system is formed from subunits of dual genetic origin. The challenge of this compound system is that cells need to adapt the availability of the nuclear‐ and mitochondrial‐encoded proteins to each other, in order to generate membrane protein complexes of defined stoichiometry. Mitochondrial gene expression requires DNA replication, transcription, and translation of the mtDNA. Approximately 25% of the mitochondrial proteome participates in these processes (Sickmann et al, 2003; Richter‐Dennerlein et al, 2015; Morgenstern et al, 2017). Given the importance of gene expression in mitochondria, it is not surprising that dysfunction in any of these processes causes severe human disorders, the so‐called mitochondrial disorders, which frequently affect the central nervous system, skeletal muscle and heart (Ghezzi & Zeviani, 2018; Suomalainen & Battersby, 2018; Area‐Gomez et al, 2019; DiMauro, 2019). However, tissue‐specific pathologies of mitochondrial diseases are still not well understood, especially because the local regulation of these mitochondria processes remains unclear.
In addition, in highly differentiated cells such as cardiomyocytes and neurons, different mitochondrial subpopulations appear to be dedicated to fulfill certain functions within a single cell. These discrete pools can differ in their morphology, proteome, stress response, and can undergo different regulatory pathways (Palmer et al, 1977; Pivovarova et al, 2004; Hollander et al, 2014; Graham et al, 2017). Whether gene expression is heterogeneous within different mitochondria cannot be answered with conventional biochemical approaches as they lack the spatial resolution needed.
To address mitochondrial translation with spatial resolution, we established an imaging technique that allows monitoring mitochondrial translation in the cellular context. Using this method, newly synthesized mitochondrial peptides could be specifically labeled even at short labeling times. Our analyses reveal that not all mitochondria translate to the same extent in different cell types. Using neuronal cultures, we were able to monitor mitochondrial translation in axonal and dendritic mitochondria as well as in pre‐ and post‐synaptic regions. Moreover, we show that the approach could be utilized to detect even small changes in mitochondrial translation and therefore to assess mitochondrial translation in cellular disease models in a quantitative manner. Here, we show a widely applicable labeling approach for imaging‐based analysis of mitochondrial protein synthesis with spatial resolution.
Results and Discussion
Visualizing mitochondrial translation in the cellular context
The standard procedure to analyze mitochondrial translation is radiolabeling of newly synthesized polypeptides in intact cells or in purified mitochondria (Sasarman & Shoubridge, 2012; Pacheu‐Grau et al, 2013; Richter‐Dennerlein et al, 2016; Nottia et al, 2020). However, this approach does not allow an assessment of translation in the context of the cellular anatomy, since it lacks spatial resolution. To monitor mitochondrial protein synthesis in the context of an individual cell and to obtain quantitative information on the translation process, we devised an imaging approach, based on the fluorescent non‐canonical amino acid tagging (FUNCAT) procedure (Dieterich et al, 2010). For this, cytosolic translation was selectively inhibited by treatment with the antibiotic Harringtonine (Fig 1A) or other translation inhibitors (Fig EV1A and B), and cells were subsequently incubated with the alkyne‐containing non‐canonical amino acid L‐homopropargylglycine (HPG). Under these conditions, HPG is specifically incorporated into mitochondrial translation products instead of methionine and can be visualized by a subsequent copper‐catalyzed cycloaddition reaction (click) to azide‐containing fluorescent dyes (Fig 1A). Using this approach, we monitored mitochondrial protein synthesis in HeLa cells and obtained HPG‐specific fluorescent signals that colocalized well with mitochondria. As expected for mitochondrial translation products, the fluorescent signals were sensitive to the mitochondrial translation inhibitor Chloramphenicol (Fig 1B). Similarly, when we monitored mitochondrial protein synthesis in cells lacking mtDNA (Rho0 cells), HPG‐specific fluorescent signals were lost (Fig 1C), demonstrating that HPG is specifically incorporated into mitochondrial translation products under these experimental conditions.
Figure 1. Visualizing mitochondrial translation in the cellular context.
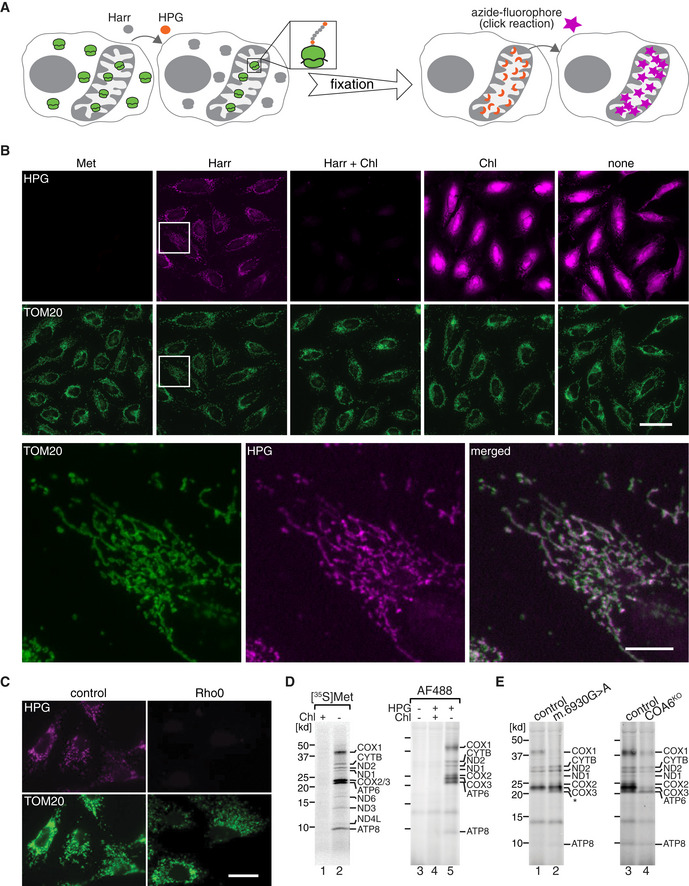
- Schematic presentation of the approach. Cytosolic translation is inhibited with Harringtonine (Harr), while mitochondrial ribosomes are allowed to incorporate the alkyne‐containing methionine homolog (HPG, orange) into newly synthesized proteins. In fixed cells, HPG moieties are clicked to an azide‐conjugated fluorophore (star, magenta), through copper‐catalyzed Huisgen cycloaddition (click), and can be visualized microscopically.
- WT HeLa cells were incubated with HPG for 30 min in the presence or absence of Harr and/or Chloramphenicol (Chl). After fixation, AF647‐azide (magenta) was used for click reaction (see A), and cells were immunostained for TOM20 as mitochondrial marker (green). Representative epifluorescent microscopy images are shown. Magenta images shown in the presence of only Chl and in the absence of both inhibitors (none) are presented at lower brightness level than the other panels, duo to their very strong intensities. An inset of Harr panel is zoomed in the panel below for better visualization. Met, methionine. Scale bars, 50 and 10 µm for the zoom panel.
- Mitochondrial translation products in osteosarcoma 143B control and Rho0 cell lines as described in A. Scale bars, 25 µm.
- Comparison of mitochondrial translation labeling in control HEK cells using radioactive [35S]Met or HPG followed by click reaction with AF488‐azide, in purified mitochondria. Samples were analyzed by SDS–PAGE and either digital autoradiography or fluorescent gel imaging.
- Similar experiments, performed by click reaction in 143B COX1 mutant cells (m.6930G > A), derived from a patient, or in COA6KO HEK293T cells, in comparison to the respective controls.
Figure EV1. Visualizing mitochondrial translation in the cellular context.
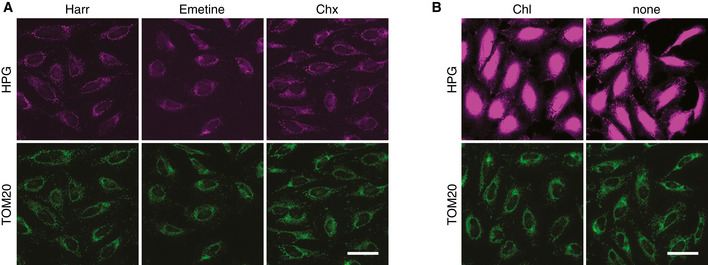
- Mitochondrial translation was labeled in WT HeLa cells for 30 min using indicated antibiotics for inhibiting cytosolic translation (magenta). Cells were then immunostained for TOM20 (green). Using Emetine and Cycloheximide (Chx) revealed no difference to Harringtonine (Harr).
- HPG labeling of HeLa cells in the presence of mitochondrial translation inhibitor Chloramphenicol (Chl) and the absence of all antibiotics (none). The brightness is scaled to the level of panels in A. Scale bars, 50 µm.
To test whether the translation products conform to the expected nature of the OXPHOS subunits, we compared our results with the classical method of pulse labeling with [35S] methionine, followed by SDS–PAGE and autoradiography (Fig 1D). HGP‐labeled proteins were detected with AF488‐azide, and provided a similar pattern to [35S] methionine labeling, which was, as expected, sensitive to Chloramphenicol (Fig 1D).
To confirm the identity of selected proteins, we first used a mutant cell line with a defect in mitochondrial translation of COX1 (m.6930G > A). In these cells, the full‐length COX1 protein is not translated (Bruno et al, 1999; Richter‐Dennerlein et al, 2016). This was correctly recapitulated by the HPG‐based analysis (Fig 1E, left panel). In the absence of the thiol reductase COA6, COX2 stability has been found to be strongly decreased, and thereby indirectly, the abundance of COX1 and COX3 is affected (Stroud et al, 2015; Pacheu‐Grau et al, 2015, 2020; Soma et al, 2019). HPG‐dependent labeling of mitochondrial translation products in COA6 knockout cells (COA6KO) resulted in the expected pattern of the loss of COX2, COX1, and COX3 (Fig 1E, right panel).
In summary, these experiments validated the imaging strategy to visualize mitochondrial translation in cells, which could be applied to determine mitochondrial gene expression in distinct cellular regions.
Differential levels of gene expression within mitochondria of a single cell
Mitochondria are optimized to fulfill the specific metabolic demands of different cell types. While it is becoming evident that the mitochondrial proteome is able to adapt to cell and tissue demands (Mootha et al, 2003; Williams et al, 2018; Bartolomeo et al, 2020), it is still unclear how mitochondrial gene expression is spatially coordinated to respond to differential demands within separate areas of single cells.
To compare mitochondrial translation within a single cell, we reasoned that the labeling time could be critical, as longer pulses might impede detection of small differences between individual mitochondria. In addition, in highly differentiated cells such as neurons, that display mitochondrial trafficking within a cell, shorter labeling time would be required to address local mitochondrial protein synthesis. Therefore, we assessed the minimum labeling time to obtain robust signal of mitochondrial translation. In HeLa cells, we observed a clear mitochondrial translation signal at 2 min of labeling time which further increased upon extended labeling time up to 30 min (Fig 2A).
Figure 2. Different levels of gene expression in mitochondria of a single cell.
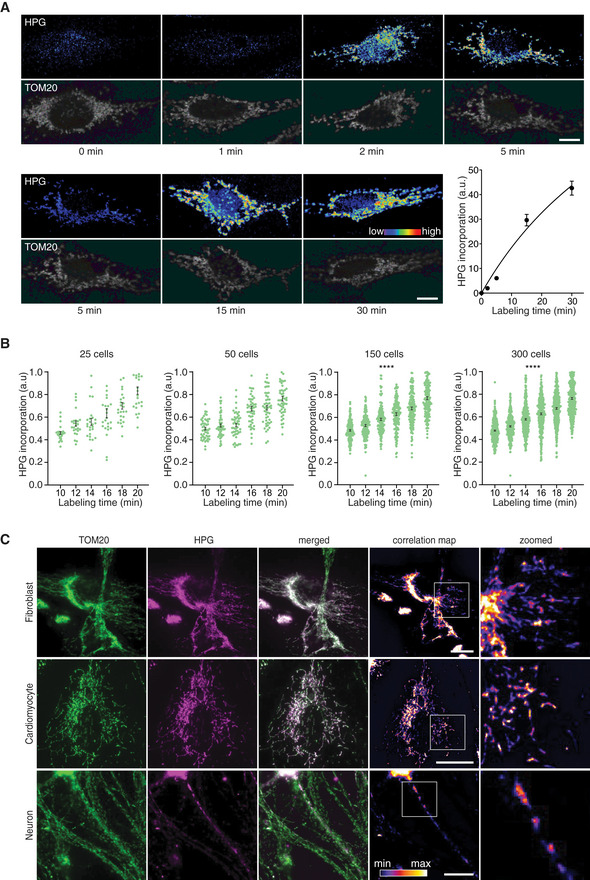
- Mitochondrial translation products were labeled in WT HeLa cells for indicated time lengths (heat map) and cells immunostained for TOM20 (gray). Representative confocal images are shown for each time point. The same 5‐min image was used in both rows with different brightness as a reference for intensity comparison of the other time points in the row. Scale bars, 10 µm. Mitochondrial protein synthesis was quantified over time. Thirty cells from N = 3 independent experiments were analyzed for each time point (average of the HPG intensity in the mitochondrial area was calculated and the baseline was set to zero by subtracting the value of time point 0 from all the values. Error bars, ± SEM). A hyperbolic graph was fitted to the data. R 2 = 0.97.
- As in A, mitochondrial translation products were labeled for increasing time (10 and 20 min) in HeLa cells. The number of analyzed cells was increased in the plots from 25 to 300 per time point. 150 or 300 random cells from N = 3 independent experiments were analyzed. Kruskal–Wallis followed by Fisher's test. ****P < 0.0001. Error bars, ± SEM.
- Mitochondrial translation products were labeled for 30 min and clicked with AF647 (magenta) and cells immunostained for TOM20 (green) in fibroblasts, iPSCs‐derived cardiomyocytes, and hippocampal neurons. Representative epifluorescent microscopy images are shown. The correlation of HPG and TOM20 channels is represented in fire lookup table, after calculating the Pearson correlation values over each pixel of the images. Scale bars, 25 µm.
To determine the sensitivity of the technique in detecting changes in mitochondrial translation, we defined a labeling time during which the HPG incorporation remained linear (10–20 min). Next, we analyzed HPG signals in cells in 2‐min time intervals. Using 25 random cells, we observed a linear increase of the detected label over time. By increasing the number of analyzed cells to 150, we detected ten percent differences between each consecutive point (Fig 2B). Accordingly, the sensitivity of the method is sufficient to detect differences of ten percent when adequate numbers of cells are assessed.
Next, we addressed if mitochondrial translation products could be identified in different cell types: human fibroblasts, human iPSCs‐derived cardiomyocytes, and rat hippocampal neurons. In all three cases, mitochondrial translation products were readily detectable with only small variations among each cell type (Figs 2C and EV2A). Interestingly, the correlation analysis of newly synthesized translation products with the mitochondrial marker TOM20 identified regions of high and low mitochondrial translation, reflecting compartment specific mitochondrial translation in the cellular context of the different cell types (Figs 2C and EV2B and C). This observation was most striking in neurons, where profound differences could be noted between the spatial pattern of the mitochondria and the translation products (Fig 2C, bottom panel).
Figure EV2. Different levels of gene expression in mitochondria of a single cell.
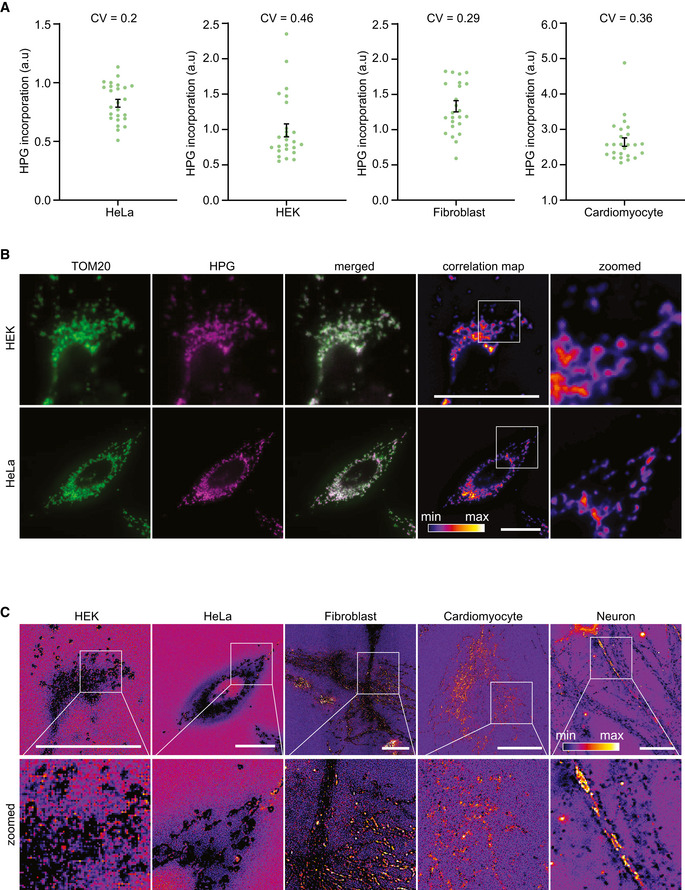
- Mitochondrial translation products were labeled with HPG in different cell types and 25 random cells, from N = 3 independent experiments, were analyzed and plotted for each cell type. Coefficients of variations (CV) are indicated on each graph. Error bars show mean ± SEM.
- Representative epifluorescent images of HEK and HeLa cells labeled for mitochondrial translation products with HPG and TOM20. Correlation of HPG and TOM20 channels is represented in fire lookup table, after calculating the Pearson correlation values over each pixel of the images. Scale bars, 25 µm.
- Representative images of different cell types, in which the ratio of HPG to TOM20 is calculated in each pixel and scaled in the fire lookup table. The same cells are shown as in Fig 2C and in B, where a correlation map between the two channels is plotted. The background color (blue or magenta) represents the baseline. Brighter pixels (yellow/orange/white) indicate high HPG to TOM20 ratios, while darker pixels (dark blue/black) indicate low ratios. Scale bars, 25 µm.
Accordingly, this labeling method allowed us to visualize actively translating mitochondria in different cell types even after short pulse times. Moreover, the spatial resolution of the technique revealed heterogeneous patterns of gene expression between mitochondria of a single cell in all the cell types.
Imaging mitochondrial translation with high resolution microscopy
Mitochondrial diseases present with many clinical manifestations affecting different tissues and organs. Defects in mitochondrial gene expression caused either by mutations in mtDNA or in nuclear‐encoded factors may lead to pathologic conditions (Smits et al, 2010; Antonicka et al, 2010; Boczonadi & Horvath, 2014; Haute et al, 2015). Therefore, implementing new techniques to rapidly monitor mitochondrial protein synthesis in living cells derived from different tissues will be helpful for the evaluation and diagnosis of mitochondrial diseases. To address the potential of our approach as a diagnostic tool for mitochondrial disorders, we labeled mitochondrial translation products in primary fibroblast cultures from a healthy control and a patient with a mutation in the mitochondrial translation elongation factor Ts (TSFM) (Fig 3A). Interestingly, quantification of the incorporated HPG revealed an almost 60 percent decrease of mitochondrial translation in the patient cells, which correlated with the mitochondrial protein synthesis defect measured using [35S] methionine radiolabeling (Fig 3A) and that had been reported previously (Emperador et al, 2017). In a similar fashion, mitochondrial translation products were labeled with both HPG and [35S] methionine in control and COA6KO cells (Fig 3B). The knockout cells showed a modest but significant decrease of mitochondrial translation, with both approaches. Accordingly, the labeling method represents a potential tool for screening defects in protein synthesis within mitochondria in a pathologic context.
Figure 3. Utilizing HPG labeling in a disease context and mapping mitochondrial translation with super resolution microscopy.
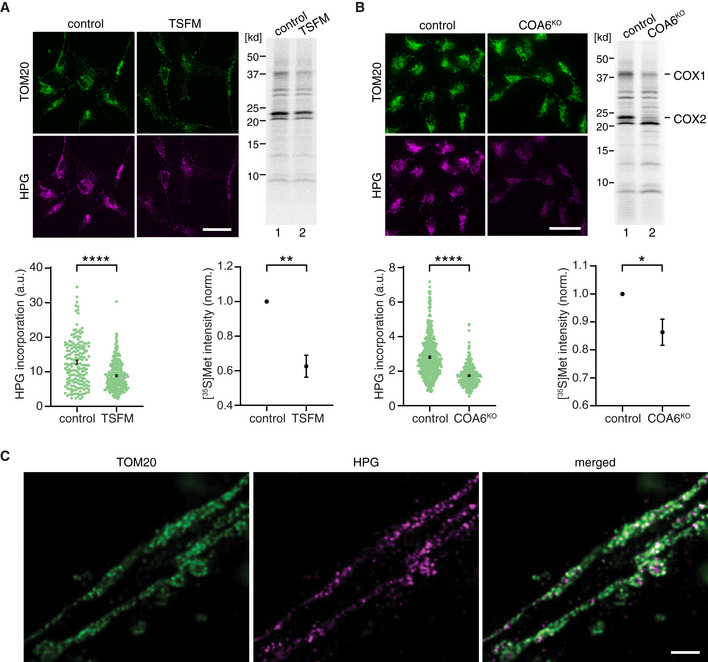
- Mitochondrial translation products were labeled using HPG and [35S]Met in control and TSFM patient fibroblasts. Representative epifluorescent microscopy and the autoradiography images are shown. Scale bars, 50 µm. Changes in mitochondrial protein synthesis were quantified for both approaches. For microscopy image analysis, > 300 cells from N = 3 independent experiments were analyzed for each cell type. Mann–Whitney U‐test, ****P < 0.0001. For radiolabeling analyses, N = 3 independent samples were quantified for each cell type. Student t‐test, **P < 0.01. Error bars, ± SEM.
- As in A using control and COA6KO HEK cells. Scale bars, 25 µm. For microscopy image analysis, ****P < 0.0001, and for radiolabeling experiments, *P < 0.05 were calculated. Error bars, ± SEM.
- Mitochondrial protein synthesis was monitored in hippocampal neurons, using HPG clicked to ATTO 590‐azide (magenta) and cells immunostained for TOM20 (green). A representative deconvolved STED microscopy image is shown. Scale bars, 1 µm.
To further assess the suitability of our approach to address biological questions related to the spatial organization of mitochondrial protein synthesis, we asked whether the synthesis of new proteins inside mitochondria could be localized at the suborganelle level. For that purpose, hippocampal neurons were labeled for their mitochondrial protein synthesis and further clicked with a high resolution STED compatible azide fluorophore (ATTO 590‐azide) and immunostained for TOM20 to detect mitochondria (Fig 3C). The representative deconvolved STED image resolves the localization of the newly synthesized mitochondrial peptides within the chain of connected mitochondria. This confirms the potential application of the technique to study spatial localization of the mitochondrial synthesis products in a highly resolved manner.
Mitochondrial translation can be tracked compartmentally in neurons
Mitochondria provide more than 90% of the ATP that is required for neuronal activity and are thus essential for synaptic transmission (Harris et al, 2012). Moreover, the presence of mitochondria at synaptic boutons has been suggested to regulate the size of the synapse and the number of vesicles (Smith et al, 2016), and these mitochondria also appear to present a distinct proteome, specialized for energy supply (Völgyi et al, 2015). This finding indicates that mitochondria may undergo function‐specific proteostasis in order to adapt to distinct subcellular processes. Different studies have addressed local protein synthesis at synaptic terminals and its relevance for proteome remodeling and plasticity in neurons (Richter & Klann, 2009; Hafner et al, 2019; Cioni et al, 2019). Previous studies revealed translation of mRNAs for nuclear‐encoded mitochondrial proteins in pre‐synaptic nerve terminals (Gioio et al, 2001; Kaplan et al, 2009). Moreover, mitochondrial proteins represent an important portion of locally synthesized proteins in synaptoneurosomes. Interestingly, many of these proteins are components of the OXPHOS system, which need to be locally imported and integrated into functional enzyme complexes (Kuzniewska et al, 2020). These findings indicate that biogenesis of mitochondrial proteins occurs locally and distant from the soma. However, it has not been addressed whether mitochondrial‐encoded proteins are locally expressed in different neuronal compartments, distant from the soma. To answer this question, we labeled mitochondrial translation products in hippocampal neurons and immunostained the samples for ANK‐G, a protein located in the axon initial segment. The plasma membrane of the neurons was stained using a lipophilic dye DiO. When used in low concentration, DiO sparsely labels cells in the sample by unselectively incorporating into the membrane and spreading across the plasma membrane of single cells. This allows for staining of neurons (or neurites) in a random manner. This approach enabled us to differentiate between axons and dendrites, as neurites containing ANK‐G, or devoid of it and to visualize single neurites in the culture. Mitochondrial translation products were found in both axons and dendrites (Fig 4A, the arrow and the star mark the axon and the dendrite, respectively).
Figure 4. Mitochondrial translation in neurons.
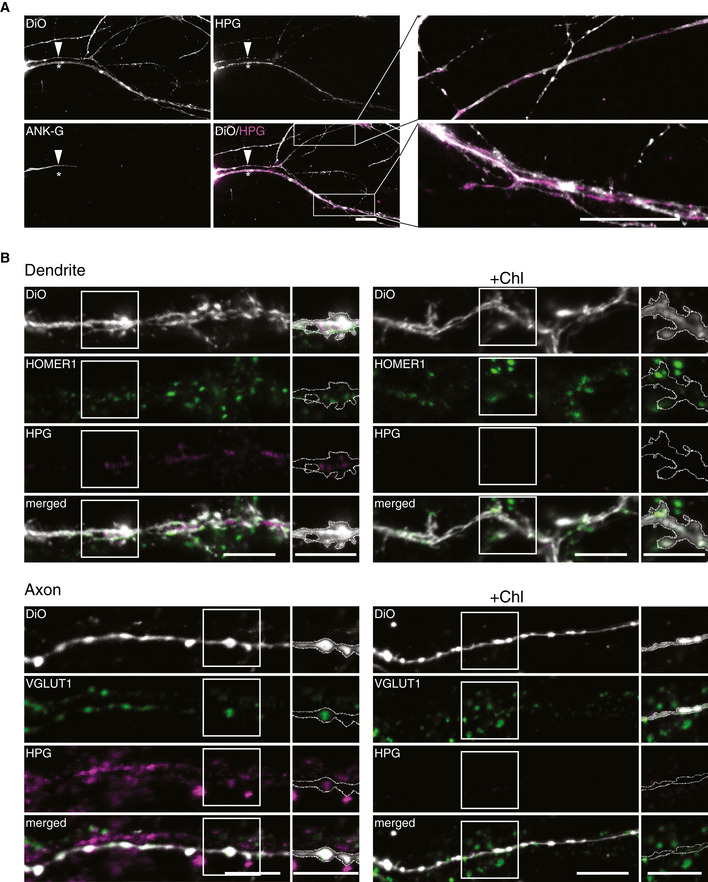
- Mitochondrial translation products were labeled with HPG in hippocampal neurons, immunostained for ANK‐G (initial axon segment), and plasma membrane was stained with DiO. Representative epifluorescent images and zoomed insets of neural branches are shown. In both axon (ANK‐G positive, arrow) and dendrite (star), HPG incorporation revealing mitochondrial protein synthesis was detected. Scale bars, 20 µm.
- Representative confocal images of a dendrite (top) and an axon (bottom) in which mitochondrial translation products were labeled with HPG (magenta). HOMER1 and VGLUT1 were used as post‐ and pre‐synapse markers, respectively (green) and DiO‐stained randomly neurites (gray). In each neurite, an exemplary region was selected and the DiO was outlined to mark the outer edge of the region. As a control, cells were treated with Chloramphenicol (Chl) to inhibit mitochondrial translation. Scale bars, 5 µm.
We then analyzed pre‐ and post‐synaptic regions for mitochondrial translation using HPG labeling. As a marker for pre‐synaptic sites, we labeled synaptic vesicles with an antibody against vesicular glutamate transporter 1 (VGLUT1). In a separate set of experiments, HOMER1 antibody was used to visualize post‐synaptic regions. The membrane of neurites was stained with DiO. We then imaged DiO‐stained dendrites and axons by confocal microscopy. Mitochondrial translation was readily detected along both axons and dendrites. Using Chloramphenicol, we validated the specificity of the detected mitochondrial translation signal. For a closer look at the synaptic regions, we outlined the DiO staining to define outer edge of the branch. To this end, we detected the HPG signal present at both pre‐ and post‐synaptic regions (Figs 4B and EV3). Accordingly, mitochondrial translation appears to occur at pre‐ and post‐synaptic regions of neurites.
Figure EV3. Mitochondrial translation in neurons.
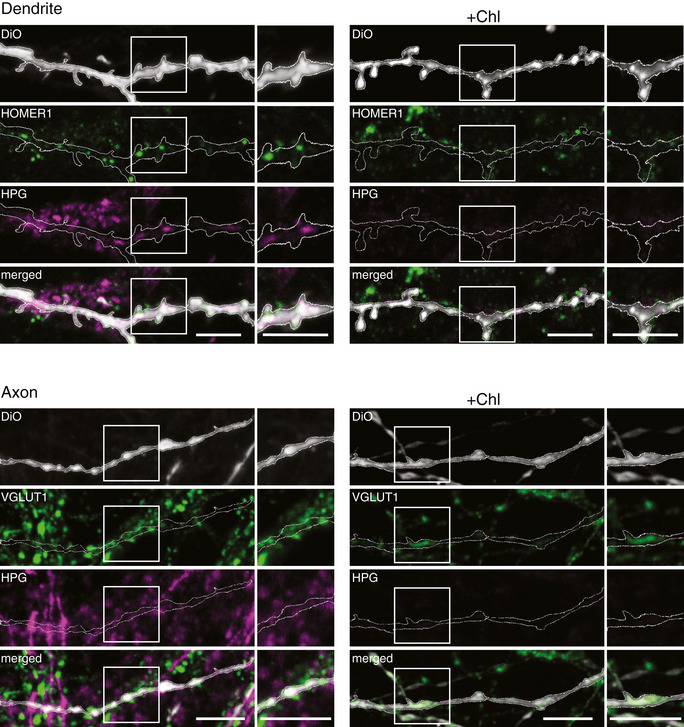
- Representative confocal images of a dendrite (top) and an axon (bottom) in which mitochondrial translation products were labeled with HPG (magenta). HOMER1 and VGLUT1 were used as post‐ and pre‐synapse markers, respectively (green) and DiO‐stained randomly neurites (gray). In each neurite, the DiO was outlined to mark the outer edge of the region. As a control, cells were treated with Chloramphenicol (Chl) to inhibit mitochondrial translation. Scale bars, 5 µm.
In summary, our work provides a first view of mitochondrial translation in neurons, demonstrating that this process can be detected in axons and dendrites and in functionally distinct compartments of the pre‐ and post‐synapse.
Conclusion
Here, we have implemented a new imaging approach that specifically allows to label mitochondrial translation products for fluorescent microscopic imaging. The strategy can be applied in a timely resolved manner with different labeling time and in a variety of different cell types. In addition, the labeling technique can be combined with super resolution microscopy to address questions regarding the spatial organization of mitochondrial protein synthesis. To this end, labeling of mitochondrial translation with HPG and subsequently click chemistry represents a powerful approach that could be applied in diagnostics of mitochondrial diseases and that opens new opportunities to study mitochondrial biogenesis in specialized cells such as neurons with spatial resolution.
Material and Methods
Cell lines and cell culture
All non‐primary cell lines and primary human fibroblasts were cultured in Dulbecco's modified Eagle's medium (DMEM, Thermo Fischer) and were supplemented with 10% (V/V) heat‐inactivated fetal bovine serum (Biochrom, Berlin, Germany), 2 mM l‐glutamine, 1 mM sodium pyruvate, and 50 μg/ml uridine. They were incubated at 37°C with 5% CO2 and passaged on a regular basis. HeLa was purchased from the DSMZ collection at the Leibnitz institute. HEK293T Flp‐In™ T‐REX™ was purchased from Invitrogen. WT fibroblasts, COA6KO HEK293T, WT, and Rho0‐143B cell lines were previously reported (King & Attardi, 1989; Gómez‐Durán et al, 2010; Pacheu‐Grau et al, 2018, 2020). The G6930A 143B cell line was a gift from G. Manfredi and J. Montoya (Bruno et al, 1999; Richter‐Dennerlein et al, 2016). TFSM mutant patient fibroblasts were previously reported (Emperador et al, 2017). For imaging purposes, the cells were seeded on PLL‐coated glass coverslips (0.1 mg/ml) 1 day before the start of the experiments.
The use of human iPSC lines was approved by the Ethics Committee of University Medical Center Göttingen (approval number: 10/9/15) and was carried out in accordance with the approved guidelines. Written informed consent was obtained from all participants prior to the participation in the study.
Human iPSC lines from a healthy donor (isWT11.8/UMGi130‐A) were used in this study. Human iPSCs were maintained on Matrigel‐coated plates (growth factor reduced, BD Biosciences), passaged every 4–6 days with Versene solution (Thermo Fisher Scientific), and cultured in StemMACS iPS‐Brew XF medium (Miltenyi Biotec) supplemented with 2 µM Thiazovivin (Merck Millipore), for 24 h after passaging with daily medium change. Directed differentiation of human iPSCs into iPSC‐cardiomyocytes was performed via WNT signaling modulation and subsequent metabolic selection, as previously described (Cyganek et al, 2018). Differentiated iPSC‐cardiomyocytes were cultured for 2 months and were subjected to molecular and functional analyses. Cell cultures were incubated in a humidified incubator with 5% CO2 at 37°C.
Neuronal hippocampal cultures were obtained from dissociated hippocampi of new‐born rats, as previously published (Banker & Cowan, 1977; Kaech & Banker, 2006; Truckenbrodt et al, 2018). For imaging purposes, the cells were plated at a concentration of ~30,000/cm2 on coverslips coated with 1mg/ml PLL, after being treated as previously described (Truckenbrodt et al, 2018). Following dissection and plating, the cells were left to adhere for 1–4 h at 37°C in a cell incubator, with 5% CO2. After adhesion, the medium was replaced to Neurobasal‐A medium (Gibco, Life Technologies, Carlsbad, CA, USA), containing 1:50 B27 supplement (Gibco) and 1:100 GlutaMAX (Gibco). Neurons were kept in culture at 5% CO2 and 37°C, for 14–21 days before use.
In vivo labeling of newly synthesized mitochondrial‐encoded peptides with HPG
To label newly synthesized mitochondrial‐encoded peptides, a click chemistry‐based approach was adapted (Estell et al, 2017). Briefly, cells were transferred to methionine‐free medium. In neurons, the labeling was done in warm Hank's Balanced Salt Solution (HBSS, Thermo Fisher). Cytosolic translation was stopped using Harringtonine (200µM, Carbosynth) for 20 min. Emetine (100 µg/ml, Merck) and Cycloheximide (Chx, 50 µg/ml, Roth) were used in a similar fashion. For control experiments blocking mitochondrial translation, 150 µg/ml Chloramphenicol was added 50 min before the start of the labeling. 500 µM of l‐Homopropargylglycine (HPG, Thermo Fisher) was then added for 30 min (unless mentioned otherwise). Cells were then transferred to buffer A containing 10 mM HEPES, 10 mM NaCl, 5 mM KCl, 300 mM sucrose, and 0.015% digitonin, for 2 min on ice, followed by 15 s in buffer A without digitonin. Coverslips were fixed using 4% PFA in PBS (137 mM NaCl, 2.7 mM KCl, 10 mM Na2HPO4, 2 mM KH2PO4) at pH 7.5 for 30 min at room temperature and were then further processed for click chemistry and immunostaining.
Click chemistry and immunostaining of fixed cells
After formaldehyde fixation, coverslips were washed for 5 min with PBS quenched for 15 min with 100 mM NH4Cl in PBS. Blocking and permeabilization were performed in staining solution (PBS + 5% BSA + 5% tryptone peptone + 0.1% Triton X‐100), using 3 solution exchanges, each for 5 min. After a brief wash with 3% BSA in PBS, coverslips were clicked for 20 min using a commercial kit (Click‐iT Cell Reaction Buffer Kit; Thermo Fisher), with 3 µM AlexaFluor 647‐azide (Thermo Fisher) or 5 µM ATTO 590‐azide (ATTO‐TEC). After another quick wash with 3% BSA in PBS, primary and secondary antibodies were diluted in the staining solution and were applied sequentially for 1 h. Three 5‐min washing steps with staining solution were performed between the primary and secondary antibody incubations. Three 5‐min sequential washes with blocking solution (PBS + 5% BSA + 5% tryptone peptone), high‐salt PBS (PBS + 500 mM NaCl), and PBS were performed at the end of the staining procedure, to remove thoroughly any unspecific binding of the antibodies. The coverslips were then embedded in Mowiol (Calbiochem, Billerica, MA, USA) and were allowed to dry overnight at room temperature, before imaging.
The probes used in this study are as follows: TOM20 (rabbit, Proteintech), ANK‐G (mouse, Antibodies incorporated), HOMER1 (mouse, Synaptic Systems), VGLUT1 nanobody conjugated to STAR 580 (Nanotag), goat anti‐rabbit Alexa Fluor Plus 488 (Thermo Fisher), donkey anti‐mouse conjugated to Cy3 (Dianova), goat anti‐rabbit STAR 580 (Abberior), goat anti‐rabbit ATTO 647N (ATTO‐TEC), and goat anti‐guinea pig Alexa Fluor 546 (Thermo Fisher).
Labeling of mitochondrial‐encoded peptides with [35S] methionine
Radioactive labeling of mitochondrial translation products was performed according to a previously published protocol (Chomyn, 1996) with minor modifications. Cytosolic translation was inhibited with Harringtonine (200 µM) for 20 min. Then, 200 µCi/ml [35S] methionine was added to the cells and was incubated at 37°C for 1 h. The cell lysate was loaded on a 10–18% Tris‐Tricine gradient gel, and the radioactive signal was detected using Phosphor Screens and a Typhoon scanner (GE Healthcare).
Quantification of the autoradiography images in Fig 3A and B was performed with ImageJ as follows: First, a manual threshold was determined to separate the background from the regions of interest. Then, in each lane, the integrated density (sum of values) of the pixels over the threshold was obtained.
Click chemistry on extracted mitochondria
Cells were incubated in methionine‐free medium with 200 µM Harringtonine for 20 min, and 500 µM HPG was added to the cells for 4 h. After harvesting the cells, mitochondria were isolated by differential centrifugation, as previously described (Lazarou et al, 2009). Briefly, cells were dissolved in isolation buffer (300 mM trehalose, 10 mM KCl, 10 mM HEPES pH 7.4, 2 mg/ml BSA and 2mM PMSF). Cells were subsequently homogenized on ice using a Potter S homogenizer. After a first centrifugation step at 400 ×g for 10 min at 4°C and a second one at 800 ×g for 7 min at 4°C to remove cell debris, mitochondria were collected by centrifugation at 10,000 ×g for 10 min at 4°C. Freshly isolated mitochondria were washed in isolation buffer lacking BSA, and protein concentrations were subsequently determined by Bradford assay. 100 µg of mitochondria proteins was pelleted and dissolved in 25 µl 50 mM Tris (pH 8.8) containing 1 mM PMSF and 1% SDS. A click reaction was performed on ice using a commercial kit (Click‐iT Cell Reaction Buffer Kit; Thermo Fisher), with 80 µM Alexa Fluor 488‐azide (Sigma). According to the manufacturer’s protocol, proteins were purified from the mixture using a MeOH/chloroform approach, after the end of the click reaction. The extracted pellet was completely dried by heating up to 50°C and was then dissolved in loading buffer containing 8 M Urea, 100 mM Dithiothreitol (DTT), and 1% benzonase. It was then incubated at 37°C for 20 min and was then loaded on a 10–18% Tris‐Tricine gradient gel. Fluorescent signals in the gels were analyzed using a FLA‐9000 Starion image scanner (Fujifilm).
Membrane staining with DiO for visualizing neurites
The cell’s membrane was stained with the carbocyanine dye, DiO (3,3′‐dioctadecyloxacarbocyanine perchlorate, Molecular Probes). The DiO staining procedure results in sparse labeling if used in low concentration. This dye is poorly soluble in water and is only soluble in membranes. Neurons on which DiO crystals land will be abundantly labeled, with all of their neurites becoming fluorescent, because DiO dissolves and spreads in their membranes. Neighboring neurons, which did not receive DiO crystals, remain invisible in the DiO (green) channel. For the staining, the DiO crystals were dissolved in dimethylformamide (DMF) to a stock concentration of 2 mg/ml, by mixing for 10 min at 50°C. The stock was kept at 4°C, in the dark, until use. A working concentration of 1 µg/ml was prepared in PBS and was thoroughly mixed and sonicated. It was applied to the coverslips for 20 min at 37°C. The coverslips were washed with PBS briefly and were left overnight in PBS at room temperature. The next day, the coverslips were embedded in Mowiol, as above, and were dried overnight before imaging.
Image acquisition
Epifluorescent images were taken with an inverted Nikon Ti epifluorescence microscope (Nikon Corporation, Chiyoda, Tokyo, Japan) equipped with a Plan Apochromat 60×, 1.4 NA oil immersion objective, an HBO‐100W Lamp, and an IXON X3897 Andor (Belfast, Northern Ireland, UK) camera, operated via the NIS‐Elements AR software (version 4.20; Nikon).
Confocal images were taken using an Abberior microscope operated with Imspector imaging software (Abberior Instruments, Göttingen, Germany). This setup was built on an Olympus IX83 base, equipped with a UPlanSApo 100× oil immersion objective (Olympus Corporation, Shinjuku, Tokyo, Japan) and an EMCCD iXon Ultra camera (Andor, Belfast, Northern Ireland, UK). Pulsed 561‐nm and 640‐nm lasers were used for excitation of ATTO 590 and STAR 580 and Alexa Fluor 647, respectively. For stimulated depletion, lasers emitting at 595 and 775 nm were employed. Where mentioned, images were deconvolved using Huygens software (Scientific Volume Imaging, WWW.svi.nl).
Image analysis
To analyze the mitochondrial translation signal, we used a self‐written script in Matlab. First, the area of single cells was separated. Then, in each cell, mitochondria were identified by applying an empirically determined threshold in the TOM20 channel. The HPG signal was then averaged inside the mitochondrial area. Different statistical tests were used and mentioned in the respective figure legends. A P‐value of < 0.05 was considered statistically significant.
To make the correlation maps in Figs 2C and EV2B, we calculated the Pearson correlation coefficient for the respective images. This procedure calculates for each pixel, identified by coordinates i and j, the following value:
where A and B are the two original images (meaning intensity matrices), and α and β are the average intensities of the two images, respectively.
The value obtained at a particular pixel is high when the original pixel intensities in the A and B images correlate (if they are both higher than the respective averages, or both lower). In contrast, if the intensity at the respective pixel is low in one of the original images and is high in the other, then the correlation value will be low (negative). This calculation provides an optimal view of the correlation between the channels, and indicates, pixel by pixel, the regions of low or high correlation.
Author contributions
RY performed the experiments, analyzed and interpreted the data, and edited the manuscript. EFF provided technical advice and edited the manuscript. LC and JM provided resources for the manuscript. SJ participated in conceptualization of the work and edited the manuscript. SOR participated in data analysis and interpretation, design and conceptualization of the work, and wrote and edited the manuscript. PR participated in design and conceptualization of the work, wrote and edited the manuscript, and was involved in supervision during the project. DP‐G performed experiments, analyzed and interpreted the data, was involved in supervision during the project, and wrote and edited the manuscript.
Conflict of interest
The authors declare that they have no conflict of interest.
Supporting information
Expanded View Figures PDF
Review Process File
Acknowledgements
Funded by the European Research Council (ERC) Advanced Grant (ERCAdG No. 339580) to PR and (ERCAdG No. 835102) to SJ, the Sonderforschungsbereiche (SFB) 1286 (projects Z03 (SOR), A05 (SJ), A06 (PR)), the SFB 1002 S01 (LC) and CY 90/1‐1 (LC), supported by the Deutsche Forschungsgemeinschaft (DFG, German Research Foundation) under Germany’s Excellence Strategy—EXC 2067/1‐390729940, the German Federal Ministry of Education and Research (BMBF)/DZHK (LC), Instituto de Salud Carlos III (grant PI17/00021) to JM, the Max Planck Institute for Biophysical Chemistry (PR), and the PhD program Molecular Biology—International Max Planck Research School and the Göttingen Graduate School for Neurosciences and Molecular Biosciences (GGNB; DFG grant GSC 226/1) (RY). Open Access funding enabled and organized by ProjektDEAL.
EMBO Reports (2021) 22: e51635.
Contributor Information
Silvio O Rizzoli, Email: srizzol@gwdg.de.
Peter Rehling, Email: peter.rehling@medizin.uni-goettingen.de.
Data availability
This study includes no data deposited in external repositories. All Matlab analysis routines are available upon request from SOR (srizzol@gwdg.de).
References
- Antonicka H, Østergaard E, Sasarman F, Weraarpachai W, Wibrand F, Pedersen AMB, Rodenburg RJ, van der Knaap MS, Smeitink JAM, Chrzanowska‐Lightowlers ZM et al (2010) Mutations in C12orf65 in patients with encephalomyopathy and a mitochondrial translation defect. Am J Hum Genet 87: 115–122 [DOI] [PMC free article] [PubMed] [Google Scholar]
- Area‐Gomez E, Guardia‐Laguarta C, Schon EA, Przedborski S (2019) Mitochondria, OxPhos, and neurodegeneration: cells are not just running out of gas. J Clin Invest 129: 34–45 [DOI] [PMC free article] [PubMed] [Google Scholar]
- Banker GA, Cowan WM (1977) Rat hippocampal neurons in dispersed cell culture. Brain Res 126: 397–425 [DOI] [PubMed] [Google Scholar]
- Bartolomeo FD, Malina C, Campbell K, Mormino M, Fuchs J, Vorontsov E, Gustafsson CM, Nielsen J (2020) Absolute yeast mitochondrial proteome quantification reveals trade‐off between biosynthesis and energy generation during diauxic shift. Pro Natl Acad Sci USA 117: 7524–7535 [DOI] [PMC free article] [PubMed] [Google Scholar]
- Boczonadi V, Horvath R (2014) Mitochondria: Impaired mitochondrial translation in human disease. Int J Biochem Cell Biol 48: 77–84 [DOI] [PMC free article] [PubMed] [Google Scholar]
- Bruno C, Martinuzzi A, Tang Y, Andreu AL, Pallotti F, Bonilla E, Shanske S, Fu J, Sue CM, Angelini C et al (1999) A Stop‐Codon mutation in the human mtDNA cytochrome c oxidase I gene disrupts the functional structure of complex IV. Am J Hum Genet 65: 611–620 [DOI] [PMC free article] [PubMed] [Google Scholar]
- Chomyn A (1996) In vivo labeling and analysis of human mitochondrial translation products. Methods Enzymol 264: 197–211 [DOI] [PubMed] [Google Scholar]
- Cioni JM, Lin JQ, Holtermann AV, Koppers M, Jakobs MAH, Azizi A, Turner‐Bridger B, Shigeoka T, Franze K, Harris WA et al (2019) Late endosomes act as mRNA translation platforms and sustain mitochondria in axons. Cell 176: 56–72 [DOI] [PMC free article] [PubMed] [Google Scholar]
- Cyganek L, Tiburcy M, Sekeres K, Gerstenberg K, Bohnenberger H, Lenz C, Henze S, Stauske M, Salinas G, Zimmermann WH et al (2018) Deep phenotyping of human induced pluripotent stem cell–derived atrial and ventricular cardiomyocytes. JCI Insight. 3: 12 [DOI] [PMC free article] [PubMed] [Google Scholar]
- Dennerlein S, Wang C, Rehling P (2017) Plasticity of mitochondrial translation. Trends Cell Biol 27: 712–721 [DOI] [PubMed] [Google Scholar]
- Dieterich DC, Hodas JJL, Gouzer G, Shadrin IY, Ngo JT, Triller A, Tirrell DA, Schuman EM (2010) In situ visualization and dynamics of newly synthesized proteins in rat hippocampal neurons. Nat Neurosci 13: 897–905 [DOI] [PMC free article] [PubMed] [Google Scholar]
- DiMauro S (2019) A brief history of mitochondrial pathologies. Int J Mol Sci 20: 5643 [DOI] [PMC free article] [PubMed] [Google Scholar]
- Emperador S, Bayona‐Bafaluy MP, Fernández‐Marmiesse A, Pineda M, Felgueroso B, López‐Gallardo E, Artuch R, Roca I, Ruiz‐Pesini E, Couce ML et al (2017) Molecular‐genetic characterization and rescue of a TSFM mutation causing childhood‐onset ataxia and nonobstructive cardiomyopathy. Eur J Hum Genet 25: 153–156 [DOI] [PMC free article] [PubMed] [Google Scholar]
- Estell C, Stamatidou E, El‐Messeiry S, Hamilton A (2017) In situ imaging of mitochondrial translation shows weak correlation with nucleoid DNA intensity and no suppression during mitosis. J Cell Sci 130: 4193–4199 [DOI] [PubMed] [Google Scholar]
- Ghezzi D, Zeviani M (2018) Human diseases associated with defects in assembly of OXPHOS complexes. Essays Biochem 62: 271–286 [DOI] [PMC free article] [PubMed] [Google Scholar]
- Gioio AE, Eyman M, Zhang H, Lavina ZS, Giuditta A, Kaplan BB (2001) Local synthesis of nuclear‐encoded mitochondrial proteins in the presynaptic nerve terminal. J Neurosci Res 64: 447–453 [DOI] [PubMed] [Google Scholar]
- Gómez‐Durán A, Pacheu‐Grau D, López‐Gallardo E, Díez‐Sánchez C, Montoya J, López‐Pérez MJ, Ruiz‐Pesini E (2010) Unmasking the causes of multifactorial disorders: OXPHOS differences between mitochondrial haplogroups. Hum Mol Genet 19: 3343–3353 [DOI] [PubMed] [Google Scholar]
- Graham LC, Eaton SL, Brunton PJ, Atrih A, Smith C, Lamont DJ, Gillingwater TH, Pennetta G, Skehel P, Wishart TM (2017) Proteomic profiling of neuronal mitochondria reveals modulators of synaptic architecture. Mol Neurodegener 12: 1–16 [DOI] [PMC free article] [PubMed] [Google Scholar]
- Grevel A, Pfanner N, Becker T (2019) Coupling of import and assembly pathways in mitochondrial protein biogenesis. Biol Chem 401: 117–129 [DOI] [PubMed] [Google Scholar]
- Hafner AS, Donlin‐Asp PG, Leitch B, Herzog E, Schuman EM (2019) Local protein synthesis is a ubiquitous feature of neuronal pre‐ and postsynaptic compartments. Science 364: 6441 [DOI] [PubMed] [Google Scholar]
- Hansen KG, Herrmann JM (2019) Transport of proteins into mitochondria. Protein J 38: 330–342 [DOI] [PubMed] [Google Scholar]
- Harris JJ, Jolivet R, Attwell D (2012) Synaptic energy use and supply. Neuron 75: 762–777 [DOI] [PubMed] [Google Scholar]
- Haute LV, Pearce SF, Powell CA, D’Souza AR, Nicholls TJ, Minczuk M (2015) Mitochondrial transcript maturation and its disorders. J Inherit Metab Dis 38: 655–680 [DOI] [PMC free article] [PubMed] [Google Scholar]
- Hollander JM, Thapa D, Shepherd DL (2014) Physiological and structural differences in spatially distinct subpopulations of cardiac mitochondria: influence of cardiac pathologies. Am J Physiol Heart Circ Physiol 307: H1–H14 [DOI] [PMC free article] [PubMed] [Google Scholar]
- Kaech S, Banker G (2006) Culturing hippocampal neurons. Nat Protoc 1: 2406–2415 [DOI] [PubMed] [Google Scholar]
- Kaplan BB, Gioio AE, Hillefors M, Aschrafi A (2009) Axonal protein synthesis and the regulation of local mitochondrial function. Results Probl Cell Differ 48: 225–242 [DOI] [PMC free article] [PubMed] [Google Scholar]
- King MP, Attardi G (1989) Human cells lacking mtDNA: repopulation with exogenous mitochondria by complementation. Science 246: 500–503 [DOI] [PubMed] [Google Scholar]
- Kuzniewska B, Cysewski D, Wasilewski M, Sakowska P, Milek J, Kulinski TM, Winiarski M, Kozielewicz P, Knapska E, Dadlez M et al (2020) Mitochondrial protein biogenesis in the synapse is supported by local translation. EMBO Rep 21: e48882 [DOI] [PMC free article] [PubMed] [Google Scholar]
- Lazarou M, Smith SM, Thorburn DR, Ryan MT, McKenzie M (2009) Assembly of nuclear DNA‐encoded subunits into mitochondrial complex IV, and their preferential integration into supercomplex forms in patient mitochondria. FEBS J 276: 6701–6713 [DOI] [PubMed] [Google Scholar]
- Mootha VK, Bunkenborg J, Olsen JV, Hjerrild M, Wisniewski JR, Stahl E, Bolouri MS, Ray HN, Sihag S, Kamal M et al (2003) Integrated analysis of protein composition, tissue diversity, and gene regulation in mouse mitochondria. Cell 115: 629–640 [DOI] [PubMed] [Google Scholar]
- Morgenstern M, Stiller SB, Lübbert P, Peikert CD, Dannenmaier S, Drepper F, Weill U, Höß P, Feuerstein R, Gebert M et al (2017) Definition of a high‐confidence mitochondrial proteome at quantitative scale. Cell Rep 19: 2836–2852 [DOI] [PMC free article] [PubMed] [Google Scholar]
- Nottia MD, Marchese M, Verrigni D, Mutti CD, Torraco A, Oliva R, Fernandez‐Vizarra E, Morani F, Trani G, Rizza T et al (2020) A homozygous MRPL24 mutation causes a complex movement disorder and affects the mitoribosome assembly. Neurobiol Disease 141: 104880 [DOI] [PubMed] [Google Scholar]
- Pacheu‐Grau D, Bareth B, Dudek J, Juris L, Vögtle FN, Wissel M, Leary SC, Dennerlein S, Rehling P, Deckers M (2015) Cooperation between COA6 and SCO2 in COX2 maturation during cytochrome c oxidase assembly links two mitochondrial cardiomyopathies. Cell Metab 21: 823–833 [DOI] [PubMed] [Google Scholar]
- Pacheu‐Grau D, Callegari S, Emperador S, Thompson K, Aich A, Topol SE, Spencer EG, McFarland R, Ruiz‐Pesini E, Torkamani A et al (2018) Mutations of the mitochondrial carrier translocase channel subunit TIM22 cause early‐onset mitochondrial myopathy. Hum Mol Genet 27: 4135–4144 [DOI] [PMC free article] [PubMed] [Google Scholar]
- Pacheu‐Grau D, Gómez‐Durán A, Iglesias E, López‐Gallardo E, Montoya J, Ruiz‐Pesini E (2013) Mitochondrial antibiograms in personalized medicine. Hum Mol Genet 22: 1132–1139 [DOI] [PubMed] [Google Scholar]
- Pacheu‐Grau D, Wasilewski M, Oeljeklaus S, Gibhardt CS, Aich A, Chudenkova M, Dennerlein S, Deckers M, Bogeski I, Warscheid B et al (2020) COA6 facilitates cytochrome c oxidase biogenesis as thiol‐reductase for copper metallochaperones in mitochondria. J Mol Bio 432: 2067–2079 [DOI] [PMC free article] [PubMed] [Google Scholar]
- Palmer JW, Tandler B, Hoppel CL (1977) Biochemical properties of subsarcolemmal and interfibrillar mitochondria isolated from rat cardiac muscle. J Biol Chem 252: 8731–8739 [PubMed] [Google Scholar]
- Pivovarova NB, Nguyen HV, Winters CA, Brantner CA, Smith CL, Andrews SB (2004) Excitotoxic calcium overload in a subpopulation of mitochondria triggers delayed death in hippocampal neurons. J Neurosci 24: 5611–5622 [DOI] [PMC free article] [PubMed] [Google Scholar]
- Richter JD, Klann E (2009) Making synaptic plasticity and memory last: mechanisms of translational regulation. Genes Dev 23: 1–11 [DOI] [PubMed] [Google Scholar]
- Richter‐Dennerlein R, Dennerlein S, Rehling P (2015) Integrating mitochondrial translation into the cellular context. Nat Rev Mol Cell Biol 16: 586–592 [DOI] [PubMed] [Google Scholar]
- Richter‐Dennerlein R, Oeljeklaus S, Lorenzi I, Ronsör C, Bareth B, Schendzielorz AB, Wang C, Warscheid B, Rehling P, Dennerlein S (2016) Mitochondrial protein synthesis adapts to influx of nuclear‐encoded protein. Cell 167: 471–483 [DOI] [PMC free article] [PubMed] [Google Scholar]
- Sasarman F, Shoubridge EA (2012) Radioactive labeling of mitochondrial translation products in cultured cells. Methods Mol Biol 837: 207–217 [DOI] [PubMed] [Google Scholar]
- Sickmann A, Reinders J, Wagner Y, Joppich C, Zahedi R, Meyer HE, Schönfisch B, Perschil I, Chacinska A, Guiard B et al (2003) The proteome of Saccharomyces cerevisiae mitochondria. Proc Natl Acad Sci USA 100: 13207–13212 [DOI] [PMC free article] [PubMed] [Google Scholar]
- Smith HL, Bourne JN, Cao G, Chirillo MA, Ostroff LE, Watson DJ, Harris KM (2016) Mitochondrial support of persistent presynaptic vesicle mobilization with age‐dependent synaptic growth after LTP. Elife 5: e15275 [DOI] [PMC free article] [PubMed] [Google Scholar]
- Smits P, Smeitink J, van den Heuvel L (2010) Mitochondrial translation and beyond: processes implicated in combined oxidative phosphorylation deficiencies. J Biomed Biotechnol 2010: 1–24 [DOI] [PMC free article] [PubMed] [Google Scholar]
- Soma S, Morgada MN, Naik MT, Boulet A, Roesler AA, Dziuba N, Ghosh A, Yu Q, Lindahl PA, Ames JB et al (2019) COA6 is structurally tuned to function as a thiol‐disulfide oxidoreductase in copper delivery to mitochondrial cytochrome c oxidase. Cell Rep 29: 4114–4126 [DOI] [PMC free article] [PubMed] [Google Scholar]
- Stroud DA, Maher MJ, Lindau C, Vögtle FN, Frazier AE, Surgenor E, Mountford H, Singh AP, Bonas M, Oeljeklaus S et al (2015) COA6 is a mitochondrial complex IV assembly factor critical for biogenesis of mtDNA‐encoded COX2. Hum Mol Genet 24: 5404–5415 [DOI] [PubMed] [Google Scholar]
- Suomalainen A, Battersby BJ (2018) Mitochondrial diseases: the contribution of organelle stress responses to pathology. Nat Rev Mol Cell Biol 19: 77–92 [DOI] [PubMed] [Google Scholar]
- Truckenbrodt S, Viplav A, Jähne S, Vogts A, Denker A, Wildhagen H, Fornasiero EF, Rizzoli SO (2018) Newly produced synaptic vesicle proteins are preferentially used in synaptic transmission. EMBO J 37: e98044 [DOI] [PMC free article] [PubMed] [Google Scholar]
- Völgyi K, Gulyássy P, Háden K, Kis V, Badics K, Kékesi KA, Simor A, Györffy B, Tóth EA, Lubec G et al (2015) Synaptic mitochondria: a brain mitochondria cluster with a specific proteome. J Proteomics 120: 142–157 [DOI] [PubMed] [Google Scholar]
- Wiedemann N, Pfanner N (2017) Mitochondrial machineries for protein import and assembly. Annu Rev Biochem 86: 685–714 [DOI] [PubMed] [Google Scholar]
- Williams EG, Wu Y, Ryu D, Kim JY, Lan J, Hasan M, Wolski W, Jha P, Halter C, Auwerx J et al (2018) Quantifying and localizing the mitochondrial proteome across five tissues in a mouse population. Mol Cell Proteomics 17: 1766–1777 [DOI] [PMC free article] [PubMed] [Google Scholar]
Associated Data
This section collects any data citations, data availability statements, or supplementary materials included in this article.
Supplementary Materials
Expanded View Figures PDF
Review Process File
Data Availability Statement
This study includes no data deposited in external repositories. All Matlab analysis routines are available upon request from SOR (srizzol@gwdg.de).