Abstract
p53-reactivation and induction of massive apoptosis-1, APR-017 methylated (PRIMA-1met; APR246) targets mutant p53 to restore its wild-type structure and function. It was previously demonstrated that PRIMA-1met effectively inhibited the growth of colorectal cancer (CRC) cells in a p53-independent manner, and distinctly induced apoptosis by upregulating Noxa in p53-mutant cell lines. The present study including experiments of western blotting, acridine orange staining and transmission electron microscopy revealed that PRIMA-1met induced autophagy in CRC cells independently of p53 status. Importantly, PRIMA-1met not only promoted autophagic vesicle (AV) formation and AV-lysosome fusion, but also increased lysosomal degradation. Furthermore, Cell Counting Kit-8 assay, colony formation assay and small interfering RNA transfection were performed to investigate the underling mechanisms. The study indicated that activation of the mTOR/AMPK-ULK1-Vps34 autophagic signaling cascade was key for PRIMA-1met-induced autophagy. Additionally, autophagy served a crucial role in the inhibitory effect of PRIMA-1met in cells harboring wild-type p53, which was closely associated with the increased expression of Noxa. Taken together, the results determined the effect of PRIMA-1met on autophagy, and further revealed mechanistic insights into different CRC cell lines. It was concluded that PRIMA-1met-based therapy may be an effective strategy for CRC treatment.
Keywords: p53-reactivation and induction of massive apoptosis-1methylated, autophagy, oncotherapy, p53, colorectal cancer
Introduction
Colorectal cancer (CRC; cancer of the colon and rectum) is a worldwide health concern. CRC is the second and third most common cancer type in women and men, respectively (1). In 2018, there were more than 1.8 million newly diagnosed CRC cases and 0.88 million deaths (1). In recent years, the incidence of CRC, particularly rectal cancer, has demonstrated an increasing trend in young individuals (2). Early diagnosis and radical surgery effectively improves the 5-year survival rate of patients; however, there are still a lack of efficacious measures for patients at advanced stages of CRC (stages III and IV) (3).
The activation of oncogenes and inactivation/defect of tumor-suppressor genes are crucial for the tumorigenesis of CRC. p53, a transcriptional factor, regulates cell cycle arrest, apoptosis, DNA repair and tumor angiogenesis by mediating numerous targeted genes (4,5). Importantly, p53 mutation occurs in ~40–50% of patients with CRC (6) and is associated with resistance to current treatment regimens and a poor prognosis. p53-reactivation and induction of massive apoptosis-1, APR-017 (PRIMA-1), a small compound (C9H5NO3), was determined to restore the sequence-specific DNA binding domain of mutant p53 by forming adducts with thiols for recovering wild-type structure and function, thereby inducing cell apoptosis and thus selectively killing cancer cells with mutant p53 (7,8). PRIMA-1met (APR246) as a methylated analog of PRIMA-1, is more effective in p53-mutant cells, and has been revealed to inhibit the growth of cells without mutant p53 (8–12). It was previously demonstrated that PRIMA-1met suppressed CRC cell proliferation, migration, invasion and colony formation independently of p53 status (13). Additionally, PRIMA-1met induced robust apoptosis in cells carrying mutant p53 by upregulating proapoptotic Noxa (13). However, the mechanisms underlying the cytotoxicity of PRIMA-1met in different CRC cell lines are yet to be fully elucidated.
Autophagy is a ‘self-eating’ response to intracellular and environmental stimuli, such as starvation, nutrient deprivation and energy exhaustion. It occurs via regulatory factors that consist of autophagy-related gene (ATG) products produced by normal cells and cancer cells. Once receiving nutrient or energy signals, regulators of autophagy induce the process, forming a double-membraned autophagosome that fuses lysosomes with cargoes, leading to degradation and recycling. Through this process, intracellular proteins and organelles are degraded in lysosomes and released into the cytoplasm for biosynthesis and metabolism recycling (14). Autophagy was originally considered to be a tumor-suppressive process, as autophagy gene Beclin-1 deletion occurred in 40–75% of patients with breast, ovarian and prostate cancer (15,16). A recent study indicated that autophagy inhibits tumor initiation and progression by suppressing chronic inflammation, DNA damage and genomic instability in the tumor environment (17). Thus, key molecules of autophagic pathways, including mTOR, AMPK, Akt, PI3K class III, Beclin-1 and p53 have become promising targets for anticancer studies.
The present study revealed the effect of PRIMA-1met on autophagy in different CRC cell lines, and further investigated the mechanisms underlying its inhibitory effect in cells expressing different types of p53. The results demonstrated that PRIMA-1met induced autophagy in different CRC cells irrespective of p53 status by activating the mTOR/AMPK-ULK1-Vps34 signaling cascade. Furthermore, upregulated autophagy served a crucial role in the suppressive effect of PRIMA-1met in cells carrying wild-type p53, which was associated with Noxa upregulation. The results provide a deeper understanding of the PRIMA-1met mechanism in patients with CRC.
Materials and methods
Cell lines and drugs
The CRC cell lines used in the current study that exhibited wild-type or mutant p53 were obtained from Dr Ting Zhang (Cancer Institute, The Affiliated Hospital of Jiangnan University, Wuxi, Jiangsu, China). The following cell lines were used: LOVO (wild-type p53), RKO (wild-type p53), HCT116 (wild-type p53), DLD-1 (mutant p53-S241F), SW480 (mutant p53-R237H), SW620 (mutant p53-R237H), HCT15 (mutant p53-P153A) and CaCO2 (mutant p53-E204X). HCT116 null (p53−/−) cells were provided by Dr Jimmy Chao (Bioprocessing Technology Institute, Singapore). Cells were cultured in DMEM (HyClone; Cytiva) except for SW620, which was cultured in RPMI-1640 medium (HyClone; Cytiva). Each medium was supplemented with 10% FBS (Gibco; Thermo Fisher Scientific, Inc.) and 1% penicillin/streptomycin (Invitrogen; Thermo Fisher Scientific, Inc.) in a humidified incubator with 5% CO2 at 37°C. PRIMA-1met (APR-246; Santa Cruz Biotechnology, Inc.) was dissolved in DMSO to a concentration of 50 mM. Additionally, 3-methyladenine (3-MA; Absin Bioscience, Inc.) was dissolved in PBS to a concentration of 67.04 mM (10 mg/ml; warmed). Both were subsequently stored at −20°C. Working solutions were diluted to appropriate concentrations with culture medium and the same quantity of DMSO was used as a control.
Western blot analysis
CRC cell lines were seeded at a density of 2×10⁶ cells per 100 mm overnight, and treated with DMSO, PRIMA-1met or 3-MA (800 µM; Data S1). After incubation at 37°C for 24 h, cells were harvested, lysed and analyzed via western blotting. The following primary antibodies (all 1:1,000) were used: β-actin (cat. no. AC026; ABclonal Biotech Co., Ltd.), LC3 (cat. no. NB100-2220; Novus Biologicals, LLC), Noxa (cat. no. OP180; EMD Millipore), p62 (cat. no. 8025; Cell Signaling Technology, Inc.), Unc-51 like autophagy activating kinase 1 (ULK1; cat. no. 8054; Cell Signaling Technology, Inc.), phospho-ULK1 (Ser757; cat. no. 14202; Cell Signaling Technology, Inc.), mTOR (cat. no. 2983; Cell Signaling technology, Inc.), phospho-mTOR (Ser2448; cat. no. 5536; Cell Signaling Technology, Inc.), AMPK (cat. no. 2532; Cell Signaling Technology, Inc.), phospho-AMPK (Thr172; cat. no. 2535; Cell Signaling Technology, Inc.), phospho-PI3K Class III (Ser249; cat. no. 13857; Cell Signaling Technology, Inc.) and PI3K Class III (cat. no. CY5322; Abways Technology, Inc). Goat-anti-rabbit IgG HRP (cat. no. AS014; 1:5,000; ABclonal Biotech Co., Ltd.), and goat-anti-mouse IgG HRP (cat. no. AS003; 1:5,000; ABclonal Biotech Co., Ltd.) secondary antibodies were also used. The expression of protein was estimated using the gray value, which was calculated using ImageJ version 1.8.0 software (National Institutes of Health). Data are presented as a percentage normalized to β-actin.
Acridine orange (AO) staining
CRC cells with differing p53 statuses (HCT116wt, RKO, CaCO2, SW480 and HCT116ko) were seeded in 24-well plates at a density of 6×10⁴ cells per well with 1 ml medium overnight. Samples were then treated with DMSO or 30 µM PRIMA-1met for 24 h. AO (Absin Bioscience, Inc.) solution was added to each well at a concentration of 1 µg/ml, after which samples were incubated at 37°C for 15 min. After rinsing with PBS twice, slides were removed and inverted onto carry sheet glass. Cell slides were then observed and imaged under a confocal microscope (Hitachi, Ltd.). The filter was excited to 488 nm and blocked at 515 nm.
Transmission electron microscopy (TEM)
RKO and HCT15 cells were seeded overnight in 100-mm dishes at a density of 2×10⁶ cells per dish. Subsequently, cells were treated with DMSO, 30 µM PRIMA-1met or 60 µM PRIMA-1met and incubated for 24 h. Cell pellets were harvested and fixed with 4% glutaraldehyde solution at 4°C for 4 h, followed by fixation with 1% osmic acid for 2 h at 20°C. Specimens were dehydrated by 50–100% ethanol or 100% acetone, and embedded with Epon 812. After slicing to 60–80 nm sections, slides were stained with 2% uranyl acetate and lead citrate to observe autophagic vesicles (AVs) with a double membrane and autolysosomes under a TEM (Hitachi, Ltd.).
Cell Counting Kit-8 (CCK-8) proliferation assay
After seeding cells in a 96-well plate at a density of 7,000 cells/well with 100 µl medium for 24 h, cells were treated with DMSO, PRIMA-1met (45 µM for HCT116wt, 40 µM for RKO and 55 µM for DLD-1 and HCT15), 3-MA (800 µM; Data S1) alone or in combination for 48 h. A CCK-8 assay (Dojindo Molecular Technologies, Inc.) was performed to measure cell proliferation by quantifying WST-8 formazan dye, which is proportional to the number of living cells according to previous research (18). Samples were calculated relative to DMSO, which was set to 100%. Each cell line was assessed in three independent experiments.
Colony formation assay
After seeding in a 6-well plate (6×10⁵ cells/well) and incubating at 37°C overnight, HCT116wt and DLD-1 cells were treated with DMSO, PRIMA-1met (50 µM for HCT116wt, 80 µM for DLD-1) and 3-MA (800 µM; Data S1) for 48 h. Subsequently, cells were harvested and seeded a second time into 6-well plates (1,000 cells per 2 ml medium per well). Each sample was prepared in duplicate. After culturing at 37°C in a humidified incubator for 10 days, samples were fixed at room temperature using 4% paraformaldehyde for 15 min and stained with 0.5% crystal violet for 15 min. After rinsing three times, colonies were observed and analyzed using ImageJ version 1.8.0 software (National Institutes of Health), in which colony size was set to a value of 50 for counting.
Small interfering (si)RNA transfection
DLD-1 and HCT116wt cells were seeded in 6-well plates (6×10⁵ cells with 2 ml medium per well) and cultured at 37°C for 24 h. A mixture containing 110 pmol Noxa siRNA (cat. no. sc-37305; Santa Cruz Biotechnology, Inc.) or control siRNA (cat. no. sc-36869; Santa Cruz Biotechnology, Inc.), 200 µl jetPRIME® buffer (Polyplus-transfection SA) and 4 µl jetPRIME® siRNA transfection reagent (Polyplus-transfection SA) was vortexed for 10 sec, spun down and incubated for 10 min at room temperature. The mixture was subsequently added to each well of the 6-well plate and incubated at 37°C for 24 h. Cells were then harvested for further experiments.
Statistical analysis
Statistical analysis was performed using SPSS version 19.0 (IBM Corp.) and data are presented as the mean + SEM. Comparisons between groups were calculated using one-way ANOVA followed by Tukey's post hoc test. P<0.05 was considered to indicate a statistically significant difference.
Results
PRIAM-1met induces autophagy flux in different CRC cell lines
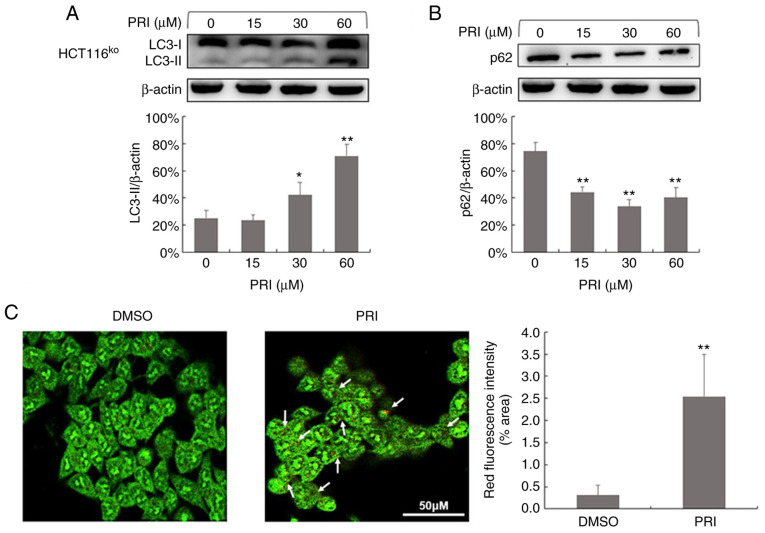
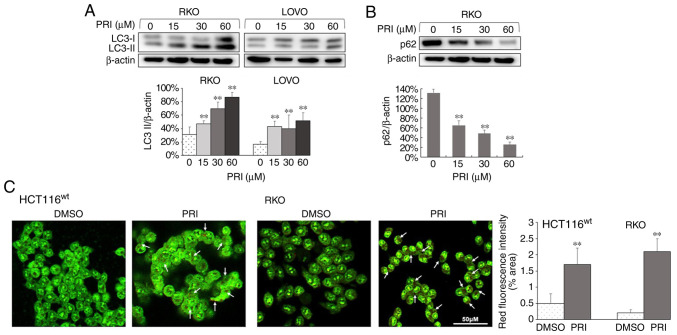
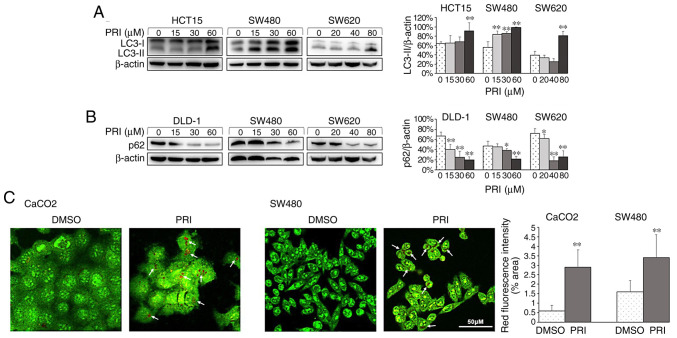
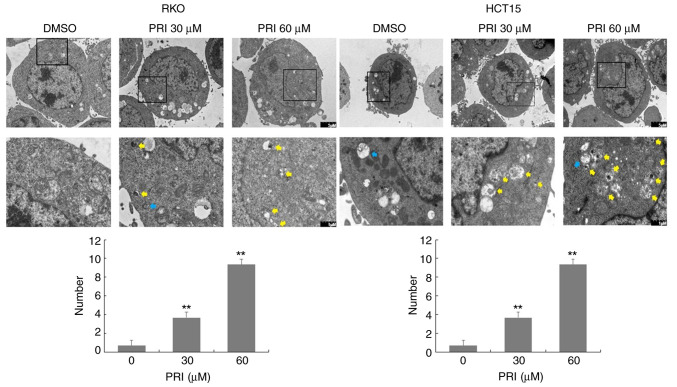
To investigate the effect of PRIMA-1met on autophagy flux, different CRC cell lines were exposed to PRIMA-1met and assessed via western blotting. Following treatment for 24 h, the results demonstrated an increased expression of LC3-II in two lines carrying wild-type p53, three of the four p53-mutant cell lines (excluding DLD-1) and 1 p53-deleted cell line (P<0.01; Figs. 1A, 2A and 3A). Conversely, reduced levels of p62 were observed in HCT116ko, RKO, DLD-1, SW480 and SW620 cells (P<0.01; Figs. 1B, 2B and 3B). The results indicated that PRIMA-1met promoted the dissociation of plasma LC3 (LC3-I) to membranous LC3 (LC3-II) for AV-membrane extension and the degradation of cargo (p62) in autolysosomes. To further determine whether PRIMA-1met induced autophagy flux in CRC cells, AO staining was performed on HCT116wt, RKO, SW480, CaCO2 and HCT116ko cells following treatment for 24 h. The results revealed that treated cells exhibited stronger red fluorescence than DMSO controls (P<0.01; Figs. 1C, 2C and 3C). However, AO demonstrated an affinity for AV organelles within the autolysosome and lysosome. Therefore, to distinguish these results further, autolysosomes were observed in PRIMA-1met-treated RKO and HCT15 cells via TEM. As presented in Fig. 4, numbers of autolysosomes and autophagosomes were increased significantly following PRIMA-1met administration in each of the cell lines compared with the DMSO control. This effect was more significant at higher concentrations (P<0.01). Taken together, PRIMA-1met treatment promoted AV formation, cargo removal and cargo degradation in autophagy flux, irrespective of p53 status.
Figure 1.
PRI promotes autophagy flux in the HCT116ko cell line without p53. (A) HCT116ko cells were treated with PRI at concentrations of 0, 15, 30 and 60 µM for 24 h. Western blotting revealed LC3-I and LC3-II bands for the four cell lysates. The histogram of gray values was calculated using ImageJ version 1.8.0 software from three independent experiments. The amount of LC3-II was normalized to β-actin and data are presented as the mean + SEM. *P<0.05 and **P<0.01, compared with the PRI untreated cells. (B) The expression of p62 was also determined (n=3). **P<0.01, compared with the untreated cells. (C) HCT116ko cells were stained with acridine orange after treatment with DMSO or 30 µM PRI for 24 h. The cytoplasm and nucleus exhibited green fluorescence, and acidic vesicular organelles were bright red. Greater red fluorescence (white arrow) was observed in cells following PRI administration compared with the DMSO control. The fluorescence intensity was analyzed using ImageJ version 1.8.0 software (National Institutes of Health) represented by the percent of area. Data were obtained from three different sights in each treated sample and assessed as the mean + SEM. **P<0.01, compared with the DMSO-treated group. PRI, p53-reactivation and induction of massive apoptosis-1, APR-017 methylated.
Figure 2.
PRI promotes autophagy flux in CRC cell lines with wild-type p53. (A) LC3-I and LC3-II were assessed via western blotting in RKO and LOVO cell lysates following 24 h treatment with PRI. The quantity of LC3-II was calculated after three independent experiments. The amount of LC3-II was normalized to β-actin and data are presented as the mean + SEM. **P<0.01, compared with the PRI untreated cells. (B) The expression of p62 was decreased in RKO cells following PRI treatment in a dose-dependent manner. Data are presented as the mean + SEM (n=3). **P<0.01, compared with the untreated group. (C) HCT116wt and RKO cells were treated with 30 µM PRIMA-1met, after which fluorescence was evaluated. The results revealed greater red fluorescence in acidic vesicular organelles stained with acridine orange (white arrow). The fluorescence intensities were also estimated and presented as the mean + SEM (n=3). **P<0.01, compared with the DMSO-treated group. PRI, p53-reactivation and induction of massive apoptosis-1, APR-017 methylated; CRC, colorectal cancer.
Figure 3.
PRI promotes autophagy flux in CRC cell lines with mutant p53. (A) Western blotting was used to assess LC3-I and LC3-II expression in HCT15, SW480 and SW620 cell lysates treated with different concentrations of PRI for 24 h. Gray values represent the quantity of LC3-II normalized to that of respective β-actin and assessed as the mean + SEM (n=3). **P<0.01, compared with the PRI untreated group. (B) p62 levels were decreased in DLD-1, SW480 and SW620 cell treated with PRI for 24 h. Data are presented as the mean + SEM (n=3). *P<0.05, **P<0.01, compared with the untreated group. (C) Greater red fluorescence in acidic vesicular organelles was observed in CaCO2 and SW480 cells treated with 30 µM PRI following acridine orange staining (white arrow). The fluorescence intensities were obtained and presented as the mean + SEM (n=3). **P<0.01, compared with the DMSO-treated group. PRI, p53-reactivation and induction of massive apoptosis-1, APR-017 methylated; CRC, colorectal cancer.
Figure 4.
Autophagosomes and autolysosomes are detected via transmission electron microscopy (TEM) after treatment with DMSO, 30 µM PRI or 60 µM PRI for 24 h (blue arrow, autophagosome; yellow arrow, autolysosome). Increased numbers of autophagosomes and autolysosomes were observed in RKO and HCT15 cells treated with PRI. Data were obtained from three different cells in each treated sample and presented as the mean + SEM. **P<0.01, compared with the PRI untreated cells. PRI, p53-reactivation and induction of massive apoptosis-1, APR-017 methylated.
PRIMA-1met regulates the mTOR/AMPK-ULK1-Vps34 autophagic signaling cascade in different CRC cell lines
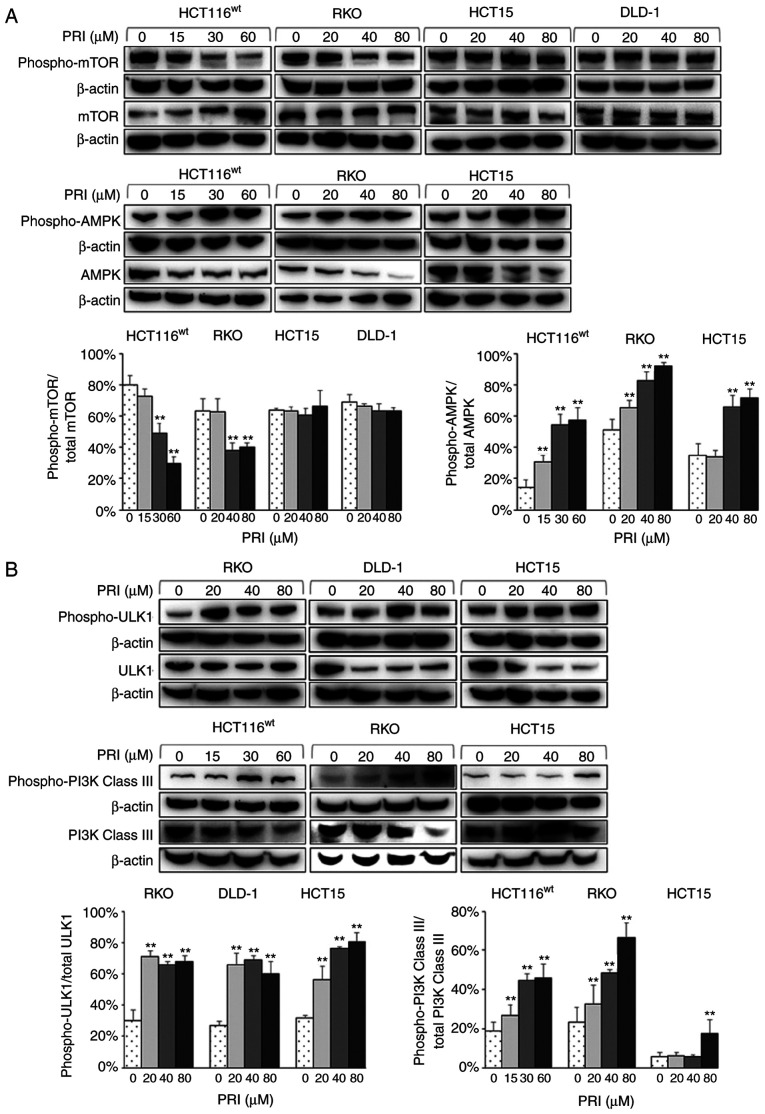
Several molecules involved in autophagic signaling were assessed by western blotting to determine the distinct mechanism of PRIMA-1met in CRC cell autophagy. The results revealed decreased levels of phospho-mTOR (a nutrient sensor) in PRIMA-1met-treated HCT116wt and RKO cells with wild-type p53. Increased levels of phospho-AMPK (an energy sensor) were also revealed in HCT116wt, RKO and HCT15 cells (P<0.01; Fig. 5A). Furthermore, PRIMA-1met administration upregulated the expression of phospho-ULK1 in RKO, DLD-1 and HCT15 cell lines, and phospho-PI3K Class III (the mammalian homolog of Vps34) in RKO, HCT116wt and HCT15 cells (P<0.01; Fig. 5B). The results indicated that PRIMA-1met mediated the autophagic mTOR/AMPK-ULK1-Vps34 signaling cascade in CRC cells independently of p53 status.
Figure 5.
Western blot analysis of colorectal cancer cell lysates treated with different concentrations of PRI for 24 h. (A) Phospho-mTOR and mTOR levels were increased and decreased respectively in HCT116wt and RKO cells carrying wild-type p53. However, there were no significant differences among the p53-mutant cell lines (HCT15 and DLD-1). Phospho-mTOR was normalized to total mTOR levels. PRI treatment also upregulated the expression of phospho-AMPK, and downregulated AMPK in HCT116wt, RKO and HCT15 cells. Phospho-AMPK was normalized to that of total AMPK and each experiment was performed in triplicate. Data are presented as the mean + SEM (n=3). **P<0.01, compared with the PRI untreated group. (B) Phospho-ULK1 and ULK1 expression was increased and decreased respectively in RKO, DLD-1 and HCT15 cell lines after PRI treatment. Phospho-ULK1 was normalized to total ULK1 levels. The expression of phospho-PI3K Class III was upregulated following PRI treatment in HCT116wt, RKO and HCT15 cells. Phospho-PI3K Class III was normalized to that of total PI3K Class III. Data are presented as the mean + SEM (n=3). **P<0.01, compared with the PRI untreated group. PRI, p53-reactivation and induction of massive apoptosis-1, APR-017 methylated; phosphor, phosphorylated; ULK1, Unc-51 like autophagy activating kinase 1.
PI3K inhibitor suppresses the inhibitory effect of PRIMA-1met in CRC cells with wild-type p53
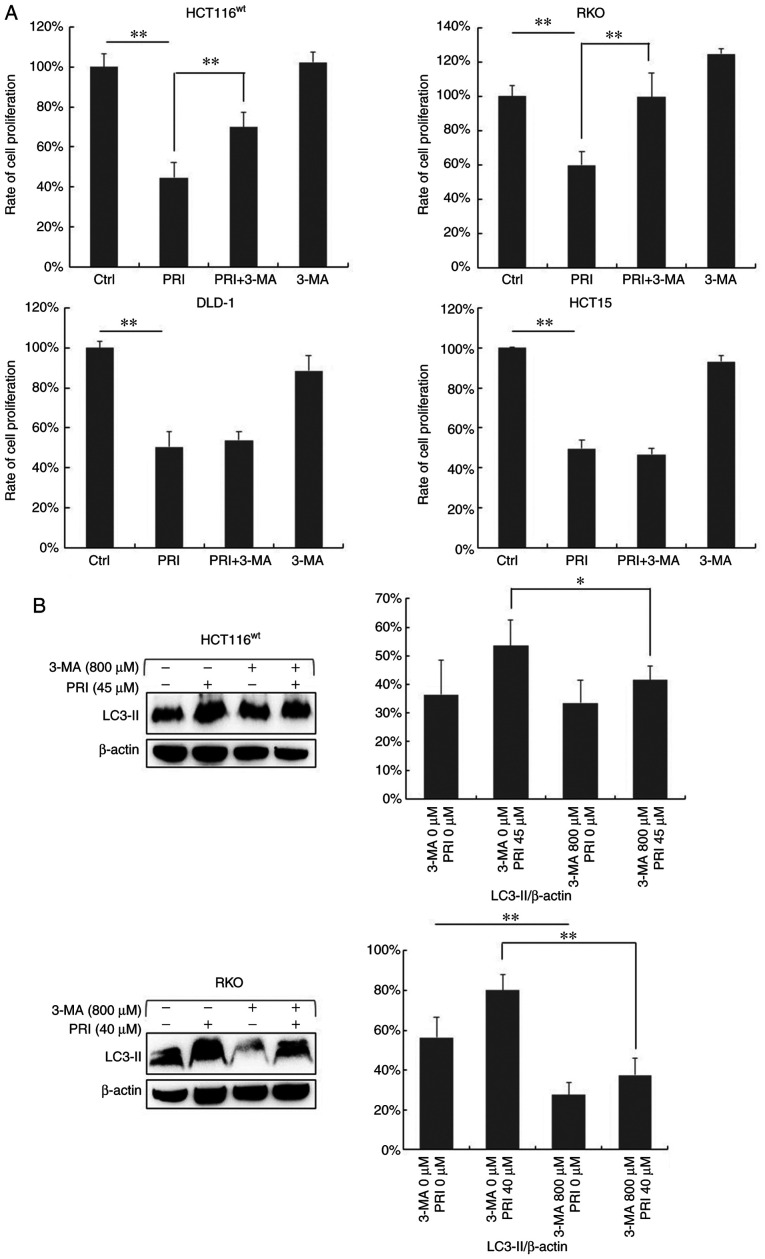
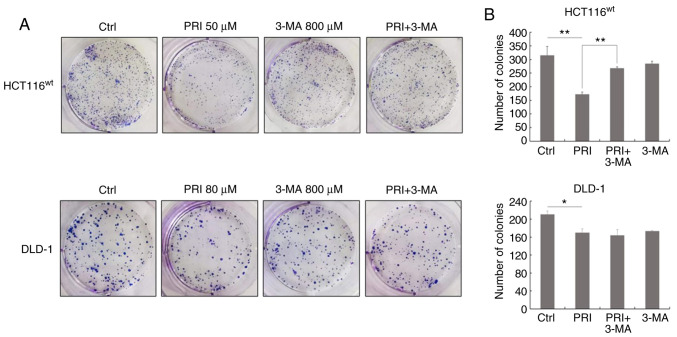
To determine whether PRIMA-1met-induced autophagy influenced cell growth, the PI3K inhibitor (3-MA) was applied to cells. HCT116wt, RKO, DLD-1 and HCT15 cells were exposed to PRIMA-1met and 3-MA either alone or in combination for 48 h, after which a CCK-8 assay was performed. As predicted, cell proliferation decreased in all cell lines following PRIMA-1met treatment (P<0.01; Fig. 6A), while 3-MA exposure did not affect cell proliferation (Fig. 6A). However, when administered in combination, the inhibition of cell growth was markedly weakened compared with PRIMA-1met treatment alone in HCT116wt and RKO cells expressing wild-type p53 (P<0.01; Fig. 6A). There was no significant difference in proliferation between PRIMA-1met and combinational regimens in DLD-1 and HCT15 cell lines carrying mutant p53 (Fig. 6A). LC3-II expression was assessed via western blotting after 3-MA treatment in HCT116wt and RKO cells (Fig. 6B). To further investigate the influence of the PI3K inhibitor on malignant transformation, cell colonies were observed and counted after PRIMA-1met and 3-MA treatment for 10 days (Fig. 7A). The number of colonies was significantly decreased following PRIMA-1met treatment compared with DMSO treatment alone in each cell line (P<0.01 in HCT116 cells; P<0.05 in DLD-1 cells; Fig. 7B). However, co-treatment of PRIMA-1met and 3-MA reversed this effect in HCT116wt cells (P<0.01; Fig. 7B). The results indicated that the PI3K inhibitor suppressed the inhibitory effect of PRIMA-1met on the growth of CRC cell lines expressing wild-type p53.
Figure 6.
3-MA suppresses the inhibitory effect of PRI on cell proliferation in CRC cells carrying wild-type p53. HCT116wt, RKO, DLD-1 and HCT15 cells were treated with DMSO, PRI (45 µM for HCT116wt, 40 µM for RKO and 55 µM for DLD-1 and HCT15) and 3-MA (800 µM) alone or in combination. (A) After 48 h, a Cell Counting Kit-8 assay was performed to estimate cell proliferation following different treatment regimens. Treatment administered in combination demonstrated a weaker suppressive effect when compared with PRI treatment alone in HCT116wt and RKO lines. Data are presented as the mean + SEM (n=3). **P<0.01. (B) LC3-II expression was assessed via western blotting after different treatments in HCT116wt and RKO cell lysates. The results revealed a decreased expression of LC3-II in HCT116wt and RKO cells after co-treatment compared with PRI treatment alone. Data are presented as the mean + SEM (n=3). *P<0.05 and **P<0.01. 3-MA, 3-methyladenine; PRI, p53-reactivation and induction of massive apoptosis-1, APR-017 methylated.
Figure 7.
3-MA suppresses the inhibitory effect of PRI on colony formation in HCT116wt cells. HCT116wt and DLD-1 cells were seeded into 6-well plates in duplicate following treatment with DMSO, PRI and 3-MA alone or in combination. (A) After 10 days, cell colonies were observed and imaged by ordinary camera. (B) Cell colonies were analyzed using ImageJ version 1.8.0 software (National Institutes of Health) in which colony size was set to a value of 50 for counting. Data are assessed as the mean + SEM (n=2). *P<0.05, **P<0.01. 3-MA, 3-methyladenine; PRI, p53-reactivation and induction of massive apoptosis-1, APR-017 methylated.
PRIMA-1met-induced autophagy in CRC cells expressing wild-type p53 is positively correlated with Noxa
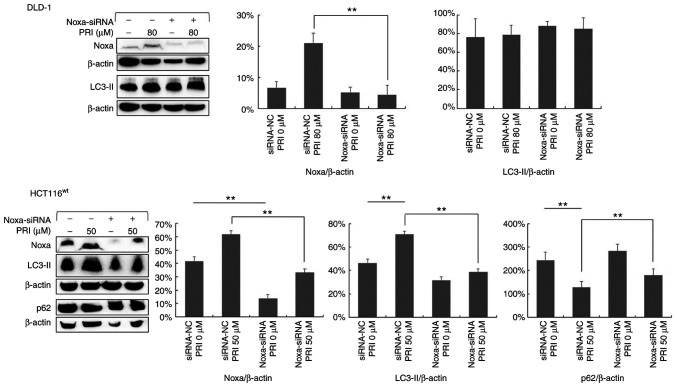
It was previously reported that Noxa upregulation, a pro-apoptotic molecule, is crucial for the PRIMA-1met induction of apoptosis in CRC cell lines with mutant p53 (10). To investigate the role of Noxa in PRIMA-1met-induced autophagy, Noxa was knocked down using siRNA in DLD-1 and HCT116wt cell lines. The results of western blotting revealed a decreased expression of Noxa (Fig. 8). In addition, LC3-II expression was reduced in HCT116wt cells after Noxa knockdown (P<0.01), whereas there was no significant effect in the p53-mutant DLD-1 cell line (Fig. 8). Furthermore, the results revealed that the decreased expression of p62 following PRIMA-1met treatment was reversed in HCT116wt cells treated with Noxa siRNA (P<0.05; Fig. 8).
Figure 8.
DLD-1 and HCT116wt cells were treated with or without PRI after transfection with control or Noxa siRNA. Western blotting revealed a reduced expression of Noxa following treatment with Noxa-siRNA. Additionally, LC3-II and p62 expression was decreased and increased respectively in HCT116wt cells after transfection with Noxa siRNA. However, decreased LC3-II levels were not demonstrated in the DLD-1 cell line. LC3-II and p62 levels were normalized to that of β-actin. Data are presented as the mean + SEM (n=3). **P<0.01. PRI, p53-reactivation and induction of massive apoptosis-1, APR-017 methylated; siRNA, small interfering RNA.
Discussion
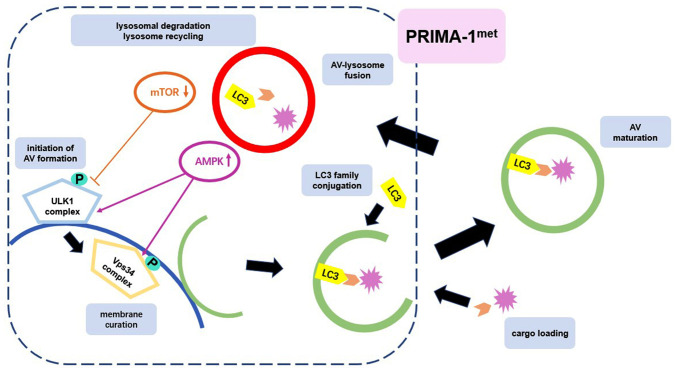
Autophagy occurs through several phases, including initiation (in which the membrane is prepared to form AVs), membrane curation, LC3 family conjugation, cargo loading, AV maturation, AV-lysosome fusion, lysosomal degradation and lysosome recycling (19). This dynamic process is also called autophagy flux. In the present study, several methods, such as western blotting, AO staining and TEM, were used to determine that PRIMA-1met treatment induced autophagy in CRC cell lines expressing different p53 statuses. PRIMA-1met treatment upregulated LC3 conversion, resulting in an increase in AVs and promoting the degradation of cargo through combination with receptor p62. This effect was exhibited regardless of p53 status but was relative to cell type. Furthermore, the results of the current study determined that the molecular mechanism underlying PRIMA-1met-induced autophagy in CRC cells involved the mediation of the mTOR/AMPK-ULK1-Vps34 signaling cascade.
ULK1, the mammalian homolog of ATG1, serves a convergent role in multiple signals that regulate autophagy, receiving nutrient and energy signals from its two upstream factors (AMPK and mTOR) (20). Additionally, AMPK that is activated under low energy conditions with an elevated AMP/ATP ratio phosphorylates ULK1 (21). mTOR, as an autophagy inhibitor, reduces the phosphorylation of ULK1 during nutrient stress and disrupts the interaction of ULK1 and AMPK (20). Once activated, the ULK1 complex, consisting of ULK1, ATG13, FIP200 and ATG101, promotes AV formation (22), leading to Vps34 complex activation, which includes Vps34 (PI3K Class III), Beclin-1, Vps15 and ATG14 for AV membrane curvature (23). The present study revealed that PRIMA-1met upregulated the phosphorylation of AMPK, ULK1 and PI3K Class III in CRC cells expressing both wild-type p53 and mutant p53. However, a decrease in the phosphorylation of mTOR was only observed in cells expressing wild-type p53. PRIMA-1met also increased the phosphorylation of PI3K Class III, but did not affect ULK1 in the HCT116wt cell line, which may be due direct activation by AMPK. The results indicated an association between PRIMA-1met and autophagy in different CRC cell lines mediated by the mTOR/AMPK-ULK1-Vps34 signaling cascade.
3-MA targets Vps34 and PI3Kγ by inhibiting PI3K Class I permanently and PI3K Class III temporarily, and as such is a useful reagent to block autophagosome formation. In the current study, the combined treatment of 3-MA and PRIMA-1met suppressed inducible autophagy and further reduced the inhibitory effect of PRIMA-1met on cell proliferation and colony formation in CRC cells expressing wild-type p53 compared with PRIMA-1met treatment alone. The results supported the notion that the mechanism underlying PRIMA-1met cytotoxicity in cells with wild-type p53 was associated with the induction of autophagy.
Previous studies have demonstrated that the crosstalk between autophagy and apoptosis, particularly in the Bcl-2 family, was crucial to regulating cell growth and survival (24,25). The present study revealed that the reduced expression of Noxa induced by siRNA suppressed LC3 conversion and p62 degradation in the HCT116wt cell line. However, this effect was not demonstrated in the DLD-1 cell line. Noxa upregulation therefore influenced cell autophagy following PRIMA-1met treatment in CRC cells carrying wild-type p53. The results confirmed that different mechanisms were involved in the inhibitory effect of PRIMA-1met in CRC cells expressing different types of p53. PRIMA-1met mainly promoted apoptosis in cells harboring mutant p53, whereas PRIMA-1met induced autophagy in cells carrying wild-type p53 or null p53. Inducible autophagy, including autophagic proteins, was determined to participate in apoptosis regulation through the complex network of molecular interactions in p53-mutant cells after PRIMA-1met treatment.
In conclusion, the present study elucidated that PRIMA-1met induced autophagy in CRC cells by activating the mTOR/AMPK-ULK1-Vps34 signaling cascade in a p53-independent manner (Fig. 9). Furthermore, induced autophagy was closely associated with the cytotoxicity of PRIMA-1met and the upregulation of Noxa in cells expressing wild-type p53. According to the complex interaction between autophagy and apoptosis, a deeper insight into the association between the two processes following PRIMA-1met induction, particularly in p53-mutant cells, is required for further study. The results of the current study demonstrated a further understanding of the mechanisms underlying the antitumor activity of PRIMA-1met in CRC, supporting PRIMA-1met-based therapy as a novel strategy for treating patients with advanced CRC.
Figure 9.
Autophagy pathway consists of several sequential steps as reported previously (19). PRIMA-1met markedly induces autophagic vesicle formation and fusion with lysosomes, while also increasing lysosomal degradation in colorectal cancer cell lines with different p53 statuses. PRIMA-1met upregulates AMPK activation in cells expressing wild-type or mutant p53, and negatively regulates mTOR expression in cells with wild-type p53, further increasing Unc-51 like autophagy activating kinase 1 and downstream PI3K Class III (Vps34) activation, regardless of p53 status. PRIMA-1met; p53-reactivation and induction of massive apoptosis-1, APR-017 methylated; ULK1, Unc-51 like autophagy activating kinase 1; AV, autophagic vesicle.
Supplementary Material
Acknowledgements
The authors would like to thank Dr Jun-dong Zhou (The Affiliated Suzhou Hospital of Nanjing Medical University, China) and Dr Fang Lin (Soochow University, China) for providing the laboratory and experimental equipment during the current study.
Funding Statement
The current study was supported by a grant from the National Natural Science Foundation of China (NSFC; grant no. 81603128), which funded the design of the study, experiments, data analysis and writing of the manuscript. The current study was also supported by the Gusu Health Layer Training Program for Young Top Talent (grant no. GSWS2019059) and the Science and Technology Project of Suzhou (grant nos. SYSD2018136 and SS201717), which contributed to completion of the experiments.
Funding
The current study was supported by a grant from the National Natural Science Foundation of China (NSFC; grant no. 81603128), which funded the design of the study, experiments, data analysis and writing of the manuscript. The current study was also supported by the Gusu Health Layer Training Program for Young Top Talent (grant no. GSWS2019059) and the Science and Technology Project of Suzhou (grant nos. SYSD2018136 and SS201717), which contributed to completion of the experiments.
Availability of data and materials
The datasets used and/or analyzed during the current study are available from the corresponding author on reasonable request.
Authors' contributions
XLL, JZ and ZRC designed the current study. XLL and JZ wrote the manuscript. ZRC revised the manuscript. XLL, CJX, HM and ZKL performed the experiments. All authors read and approved the final manuscript.
Ethics approval and consent to participate
Not applicable.
Patient consent for publication
Not applicable.
Competing interests
The authors declare that they have no competing interests.
References
- 1.Bray F, Ferlay J, Soerjomataram I, Siegel RL, Torre LA, Jemal A. Global cancer statistics 2018: GLOBOCAN estimates of incidence and mortality worldwide for 36 cancers in 185 countries. CA Cancer J Clin. 2018;68:394–424. doi: 10.3322/caac.21492. [DOI] [PubMed] [Google Scholar]
- 2.Kyaw M, Sung JJ. Young-onset colorectal cancer in the Asia-Pacific region. Med J Aust. 2016;205:450–451. doi: 10.5694/mja16.00957. [DOI] [PubMed] [Google Scholar]
- 3.Brenner H, Kloor M, Pox CP. Colorectal cancer. Lancet. 2014;383:1490–1502. doi: 10.1016/S0140-6736(13)61649-9. [DOI] [PubMed] [Google Scholar]
- 4.Ryan KM, Phillips AC, Vousden KH. Regulation and function of the p53 tumor suppressor protein. Curr Opin Cell Biol. 2001;13:332–337. doi: 10.1016/S0955-0674(00)00216-7. [DOI] [PubMed] [Google Scholar]
- 5.Bieging KT, Mello SS, Attardi LD. Unravelling mechanisms of p53-mediated tumour suppression. Nat Rev Cancer. 2014;14:359–370. doi: 10.1038/nrc3711. [DOI] [PMC free article] [PubMed] [Google Scholar]
- 6.Takayama T, Miyanishi K, Hayashi T, Sato Y, Niitsu Y. Colorectal cancer: Genetics of development and metastasis. J Gastroenterol. 2006;41:185–192. doi: 10.1007/s00535-006-1801-6. [DOI] [PubMed] [Google Scholar]
- 7.Li XL, Zhou J, Chen ZR, Chng WJ. P53 mutations in colorectal cancer-molecular pathogenesis and pharmacological reactivation. World J Gastroenterol. 2015;21:84–93. doi: 10.3748/wjg.v21.i1.84. [DOI] [PMC free article] [PubMed] [Google Scholar]
- 8.Lambert JM, Moshfegh A, Hainaut P, Wiman KG, Bykov VJ. Mutant p53 reactivation by PRIMA-1MET induces multiple signaling pathways converging on apoptosis. Oncogene. 2010;29:1329–1338. doi: 10.1038/onc.2009.425. [DOI] [PubMed] [Google Scholar]
- 9.Yoshikawa N, Kajiyama H, Nakamura K, Utsumi F, Niimi K, Mitsui H, Sekiya R, Suzuki S, Shibata K, Callen D, Kikkawa F. PRIMA-1MET induces apoptosis through accumulation of intracellular reactive oxygen species irrespective of p53 status and chemo-sensitivity in epithelial ovarian cancer cells. Oncol Rep. 2016;35:2543–2552. doi: 10.3892/or.2016.4653. [DOI] [PMC free article] [PubMed] [Google Scholar]
- 10.Lu T, Zou Y, Xu G, Potter JA, Taylor GL, Duan Q, Yang Q, Xiong H, Qiu H, Ye D, et al. PRIMA-1Met suppresses colorectal cancer independent of p53 by targeting MEK. Oncotarget. 2016;7:83017–83030. doi: 10.18632/oncotarget.12940. [DOI] [PMC free article] [PubMed] [Google Scholar]
- 11.Sobhani M, Abdi J, Manujendra SN, Chen C, Chang H. PRIMA-1Met induces apoptosis in Waldenstrom's Macroglobulinemia cells independent of p53. Cancer Biol Ther. 2015;16:799–806. doi: 10.1080/15384047.2015.1026482. [DOI] [PMC free article] [PubMed] [Google Scholar]
- 12.Tessoulin B, Descamps G, Moreau P, Maïga S, Lodé L, Godon C, Marionneau-Lambot S, Oullier T, Le Gouill S, Amiot M, Pellat-Deceunynck C. PRIMA-1Met induces myeloma cell death independent of p53 by impairing the GSH/ROS balance. Blood. 2014;124:1626–1636. doi: 10.1182/blood-2014-01-548800. [DOI] [PubMed] [Google Scholar]
- 13.Li XL, Zhou J, Chan ZL, Chooi JY, Chen ZR, Chng WJ. PRIMA-1met (APR-246) inhibits growth of colorectal cancer cells with different p53 status through distinct mechanisms. Oncotarget. 2015;6:36689–36699. doi: 10.18632/oncotarget.5385. [DOI] [PMC free article] [PubMed] [Google Scholar]
- 14.White E, Mehnert JM, Chan CS. Autophagy, metabolism, and cancer. Clin Cancer Res. 2015;21:5037–5046. doi: 10.1158/1078-0432.CCR-15-0490. [DOI] [PMC free article] [PubMed] [Google Scholar]
- 15.Liang XH, Jackson S, Seaman M, Brown K, Kempkes B, Hibshoosh H, Levine B. Induction of autophagy and inhibition of tumorigenesis by beclin 1. Nature. 1999;402:672–676. doi: 10.1038/45257. [DOI] [PubMed] [Google Scholar]
- 16.Aita VM, Liang XH, Murty VV, Pincus DL, Yu W, Cayanis E, Kalachikov S, Gilliam TC, Levine B. Cloning and genomic organization of beclin 1, a candidate tumor suppressor gene on chromosome 17q21. Genomics. 1999;59:59–65. doi: 10.1006/geno.1999.5851. [DOI] [PubMed] [Google Scholar]
- 17.Karantza-Wadsworth V, Patel S, Kravchuk O, Chen G, Mathew R, Jin S, White E. Autophagy mitigates metabolic stress and genome damage in mammary tumorigenesis. Genes Dev. 2007;21:1621–1635. doi: 10.1101/gad.1565707. [DOI] [PMC free article] [PubMed] [Google Scholar]
- 18.Huang KK, Ramnarayanan K, Zhu F, Srivastava S, Xu C, Tan ALK, Lee M, Tay S, Das K, Xing M, et al. Genomic and epigenomic profiling of high-risk intestinal metaplasia reveals molecular determinants of progression to gastric cancer. Cancer Cell. 2018;33:137–150.e5. doi: 10.1016/j.ccell.2017.11.018. [DOI] [PubMed] [Google Scholar]
- 19.Amaravadi RK, Kimmelman AC, Debnath J. Targeting autophagy in cancer: Recent advances and future directions. Cancer Discov. 2019;9:1167–1181. doi: 10.1158/2159-8290.CD-19-0292. [DOI] [PMC free article] [PubMed] [Google Scholar]
- 20.Kim J, Kundu M, Viollet B, Guan KL. AMPK and mTOR regulate autophagy through direct phosphorylation of Ulk1. Nat Cell Biol. 2011;13:132–141. doi: 10.1038/ncb2152. [DOI] [PMC free article] [PubMed] [Google Scholar]
- 21.Hardie DG. The AMP-activated protein kinase pathway-new players upstream and downstream. J Cell Sci. 2004;117((Pt 23)):5479–5487. doi: 10.1242/jcs.01540. [DOI] [PubMed] [Google Scholar]
- 22.Kumar S, Gu Y, Abudu YP, Bruun JA, Jain A, Farzam F, Mudd M, Anonsen JH, Rusten TE, Kasof G, et al. Phosphorylation of Syntaxin 17 by TBK1 controls autophagy initiation. Dev Cell. 2019;49:130–144.e6. doi: 10.1016/j.devcel.2019.01.027. [DOI] [PMC free article] [PubMed] [Google Scholar]
- 23.Behrends C, Sowa ME, Gygi SP, Harper JW. Network organization of the human autophagy system. Nature. 2010;466:68–76. doi: 10.1038/nature09204. [DOI] [PMC free article] [PubMed] [Google Scholar]
- 24.Zhou F, Yang Y, Xing D. Bcl-2 and Bcl-xL play important roles in the crosstalk between autophagy and apoptosis. FEBS J. 2011;278:403–413. doi: 10.1111/j.1742-4658.2010.07965.x. [DOI] [PubMed] [Google Scholar]
- 25.Wang J, Cui D, Gu S, Chen X, Bi Y, Xiong X, Zhao Y. Autophagy regulates apoptosis by targeting NOXA for degradation. Biochim Biophys Acta Mol Cell Res. 2018;1865:1105–1113. doi: 10.1016/j.bbamcr.2018.05.007. [DOI] [PubMed] [Google Scholar]
Associated Data
This section collects any data citations, data availability statements, or supplementary materials included in this article.
Supplementary Materials
Data Availability Statement
The datasets used and/or analyzed during the current study are available from the corresponding author on reasonable request.


