

This cross-sectional study describes the clinical characteristics and geographic and temporal distribution of the largest cohort of patients with multisystem inflammatory syndrome in children in the United States.
Key Points
Question
What are the clinical characteristics and geographic and temporal distribution of multisystem inflammatory syndrome in children (MIS-C) in the United States?
Findings
In this cross-sectional study, 1733 patients with MIS-C were identified with predominantly gastrointestinal, mucocutaneous, and cardiovascular manifestations, and a majority required intensive care. MIS-C peaks closely followed the peaks of COVID-19 and the spread of the pandemic from urban to rural communities.
Meaning
The data are consistent with observations that MIS-C resulted from delayed immunologic responses to infection by SARS-CoV-2.
Abstract
Importance
Multiple inflammatory syndrome in children (MIS-C) occurs in association with the COVID-19 pandemic.
Objective
To describe the clinical characteristics and geographic and temporal distribution of the largest cohort of patients with MIS-C in the United States to date.
Design, Setting, and Participants
Cross-sectional analysis was conducted on clinical and laboratory data collected from patients with MIS-C. The analysis included patients with illness onset from March 2020 to January 2021 and met MIS-C case definition.
Main Outcomes and Measures
Geographic and temporal distribution of MIS-C was compared with that of COVID-19 nationally, by region, and level of urbanicity by county. Clinical and laboratory findings and changes over time were described by age group and by presence or absence of preceding COVID-19.
Results
A total of 1733 patients with MIS-C were identified; 994 (57.6%) were male and 1117 (71.3%) were Hispanic or non-Hispanic Black. Gastrointestinal symptoms, rash, and conjunctival hyperemia were reported by 53% (n = 931) to 67% (n = 1153) of patients. A total of 937 patients (54%) had hypotension or shock, and 1009 (58.2%) were admitted for intensive care. Cardiac dysfunction was reported in 484 patients (31.0%), pericardial effusion in 365 (23.4%), myocarditis in 300 (17.3%), and coronary artery dilatation or aneurysms in 258 (16.5%). Patients aged 0 to 4 years had the lowest proportion of severe manifestations, although 171 patients (38.4%) had hypotension or shock and 197 (44.3%) were admitted for intensive care. Patients aged 18 to 20 years had the highest proportions with myocarditis (17 [30.9%]), pneumonia (20 [36.4%]), acute respiratory distress syndrome (10 [18.2%]), and polymerase chain reaction positivity (39 [70.9%]). These older adolescents also had the highest proportion reporting preceding COVID-19–like illness (63%). Nationally, the first 2 MIS-C peaks followed the COVID-19 peaks by 2 to 5 weeks. The cumulative MIS-C incidence per 100 000 persons younger than 21 years was 2.1 and varied from 0.2 to 6.3 by state. Twenty-four patients (1.4%) died.
Conclusions and Relevance
In this cross-sectional study of a large cohort of patients with MIS-C, 2 peaks that followed COVID-19 peaks by 2 to 5 weeks were identified. The geographic and temporal association of MIS-C with the COVID-19 pandemic suggested that MIS-C resulted from delayed immunologic responses to SARS-CoV-2 infection. The clinical manifestations varied by age and by presence or absence of preceding COVID-19.
Introduction
Patients with manifestations compatible with multisystem inflammatory syndrome in children (MIS-C) were first identified in April 2020 during the height of the COVID-19 pandemic in the United Kingdom.1 Patients had hyperinflammatory shock with features similar to Kawasaki disease and toxic shock syndrome. The report alerted clinicians and public health authorities worldwide, and similar patients were subsequently identified in Europe, the United States, and other countries.2,3,4,5,6,7 Most patients with MIS-C presented with fever, signs of generalized inflammation, hypotension and shock, and multiple organ dysfunction.7,8
The United States has a high burden of COVID-19 with the pandemic spreading in different age groups at different times across the country. As of January 2021, the total number of US COVID-19 cases exceeded 24 million, and the daily count of new cases was more than 200 000.9 Approximately 10% of the reported COVID-19 cases were in persons younger than 18 years, accounting for less than 2% of COVID-19 hospitalizations. Although most children with SARS-CoV-2 infection have mild or no symptoms, some children, particularly those with underlying conditions, can have severe illness. Clinical manifestations of hospitalized patients with COVID-19 may have some overlap with that of MIS-C.10 However, patients with MIS-C predominantly have gastrointestinal and cardiovascular manifestations and less prominent respiratory symptoms and complications such as pneumonia and acute respiratory distress syndrome (ARDS). Almost all patients with MIS-C tested positive for SARS-CoV-2 by serology, indicating that development of MIS-C was delayed by days to weeks after initial infection.2,6
In May 2020, after children with hyperinflammatory shock were first reported, the US Centers for Disease Control and Prevention (CDC) issued a health advisory describing the reported cases, outlining a case definition, and requesting clinicians to report similar cases to local and state health departments.7,11 The CDC established a national reporting platform to gather epidemiologic and clinical data from patients suspected of having MIS-C. A latent class analysis of the first 570 patients with MIS-C reported through July 2020 identified 3 classes of patients with varying illness manifestations based on key indicator variables.7 The present study describes the details of these and additional patients with MIS-C identified to date, including their geographic and temporal distribution, clinical characteristics, treatment, and outcome.
Methods
Patients diagnosed as having MIS-C were reported to the CDC by state, local, and territorial health departments using a standardized case report form, which included information on patient demographics, clinical findings, and laboratory test results. The patients were evaluated to determine if they met the CDC MIS-C case definition.7 Briefly, the case definition included patients younger than 21 years hospitalized with fever, at least 2 organ system involvement, laboratory evidence of inflammation, and laboratory confirmation of SARS-CoV-2 infection; patients were excluded if they had another plausible explanation for the illness. In addition, patients who met the following criteria were excluded because of concerns about misclassification of COVID-19 as MIS-C: (1) respiratory manifestations in the absence of cardiovascular, neurologic, or dermatologic manifestations; (2) respiratory symptoms and rash with no other symptoms and positive test results for SARS-CoV-2 by polymerase chain reaction (PCR); and (3) negative test results for SARS-CoV-2 by serology. Patients were not excluded if data on serology test were missing. Demographic and clinical findings were compared by age groups. Race and ethnicity data were obtained from medical records as documented at the time of hospitalization. MIS-C trends over time were assessed using MIS-C onset date. If this date was unavailable, fever onset or hospitalization date was used as a proxy. To assess temporal trends, patients were divided into 2 groups, separating the 2 major observed MIS-C peaks: patients with illness onset before July 1, 2020, and illness onset after July 1, 2020. The study was reviewed by the CDC for human subjects protection and was deemed public health surveillance and did not require informed consent or institutional review board approval. The reporting followed the Strengthening the Reporting of Observational Studies in Epidemiology (STROBE) reporting guideline.
Geographic trends were analyzed by state, the 4 US census regions,12 and level of urbanicity using the National Center for Health Statistics (NCHS) urban-rural classification scheme.13 The NCHS scheme divides counties into 6 categories largely corresponding with their population size: (1) large central metro, (2) large fringe metro, (3) medium metro, (4) small metro, (5) micropolitan, and (6) noncore-nonmetropolitan. The 2019 version of the zip code tabulation area data set was used to determine likely county of residence by cross walking available zip codes to corresponding counties.14 Some patients without zip code information were matched to an NCHS urban-rural category from residential county-level equivalent information or based on known residence in New York City, which is entirely classified as large central metro. Patients with only state-level geographic residential information were excluded from assessments of urbanicity.
COVID-19 daily case counts were taken from aggregate data reported to the CDC by health departments beginning January 21, 2020.9 For patients with MIS-C with preceding COVID-19–like illness (preceding COVID-19), a study had reported a median of 25 days between COVID-19 and MIS-C onset6; other studies have found a lag of 2 to 5 weeks between COVID-19 and MIS-C peaks.2,15,16 As a result, MIS-C for a given time period would be expected to arise from COVID-19 (or asymptomatic SARS-CoV-2 infections) occurring weeks earlier. To account for this incubation time, we created time periods for COVID-19 with the cut point of 21 days prior to the July 1 cut point for MIS-C and 21 days prior to the symptom onset date for most recent patients with MIS-C. The 2 time periods for COVID-19 were patients reported prior to June 9 and patients reported from June 10 through December 21.
The proportion of patients younger than 21 years was obtained from the CDC’s COVID-19 surveillance database for each jurisdiction, US region, and NCHS urban-rural category over the 2 time periods. These proportions were multiplied by the relevant aggregate counts to estimate the total number of pediatric patients with COVID-19. County-level COVID-19 aggregate case counts were taken from the USAFacts COVID-19 database, which is based on data reported by state and local health departments.17
Differences between groups were tested using Fisher exact tests for categorical variables and Kruskal-Wallis tests for continuous variables. All analyses were conducted using R version 4.0.2 (R Foundation). Two-sided P values were significant at less than .05.
Results
As of January 19, 2021, a total of 2090 patients suspected with MIS-C younger than 21 years were reported to the CDC. These patients had illness onset from March 2020 through January 2021, and 1816 patients (86.9%) met the MIS-C case definition. Based on COVID-19 misclassification criteria defined above, 83 patients were excluded from analysis. All subsequent analyses were performed on the remaining 1733 patients with MIS-C. Of these, 994 (57.6%) were male, and 1117 of 1586 patients (71.3%) with known race/ethnicity were either Hispanic (586 [37.4%]) or non-Hispanic Black (531 [33.9%]) (Table 1). The median (interquartile range) age of patients was 9 (5-13) years. The male:female ratio was roughly 1:1 for patients aged 0 to 4 years and progressively increased for subsequent age categories to 2:1 for patients aged 18 to 20 years.
Table 1. Characteristics of Patients With MIS-C by Age Group, United States, March 2020 to January 2021.
| Variable | All MIS-C cases (N = 1733), No. (%) | Age, No. (%), ya | P valueb | ||||
|---|---|---|---|---|---|---|---|
| 0-4 (n = 445) | 5-9 (n = 588) | 10-14 (n = 451) | 15-17 (n = 191) | 18-20 (n = 55) | |||
| Sexc | |||||||
| Female | 733 (42.4) | 206 (46.6) | 257 (43.8) | 176 (39.1) | 75 (39.5) | 18 (32.7) | .14 |
| Male | 994 (57.6) | 236 (53.4) | 330 (56.2) | 274 (60.9) | 115 (60.5) | 37 (67.3) | |
| Race/ethnicityd | |||||||
| Hispanic | 586 (37.4) | 157 (38.6) | 199 (37.3) | 147 (36.4) | 61 (35.1) | 21 (44.7) | .65 |
| Non-Hispanic | |||||||
| Black | 531 (33.9) | 126 (31) | 197 (36.9) | 138 (34.2) | 55 (31.6) | 14 (29.8) | |
| White | 317 (20.2) | 80 (19.7) | 100 (18.7) | 91 (22.5) | 37 (21.3) | 9 (19.1) | |
| Asian | 20 (1.3) | 5 (1.2) | 9 (1.7) | 4 (1) | 2 (1.1) | 0 (0) | |
| Time with fever, median (IQR), d | 5 (4-7) | 5 (4-7) | 5 (4-7) | 5 (4-7) | 5 (4-7) | 5 (4-6) | .47 |
| ICU admission | 1009 (58.2) | 197 (44.3) | 349 (59.4) | 300 (66.5) | 129 (67.5) | 32 (58.2) | <.001 |
| Died | 24 (1.4) | 6 (1.3) | 3 (0.5) | 4 (0.9) | 5 (2.6) | 6 (10.9) | <.001 |
| Signs and symptoms | |||||||
| Abdominal paine | 1153 (66.5) | 187 (42) | 475 (80.8) | 330 (73.2) | 123 (64.4) | 37 (67.3) | <.001 |
| Vomiting | 1114 (64.3) | 233 (52.4) | 426 (72.4) | 305 (67.6) | 121 (63.4) | 27 (49.1) | <.001 |
| Diarrhea | 931 (53.7) | 218 (49) | 331 (56.3) | 246 (54.5) | 105 (55) | 30 (54.5) | .22 |
| Rash | 963 (55.6) | 303 (68.1) | 354 (60.2) | 221 (49) | 65 (34) | 20 (36.4) | <.001 |
| Conjunctival hyperemia | 929 (53.6) | 248 (55.7) | 362 (61.6) | 250 (55.4) | 58 (30.4) | 10 (18.2) | <.001 |
| Cough | 490 (28.3) | 111 (24.9) | 131 (22.3) | 145 (32.2) | 76 (39.8) | 27 (49.1) | <.001 |
| Shortness of breathe | 475 (27.4) | 67 (15.1) | 141 (24) | 153 (33.9) | 84 (44) | 29 (52.7) | <.001 |
| Chest pain or tightnesse | 252 (14.5) | 6 (1.3) | 57 (9.7) | 100 (22.2) | 66 (34.6) | 23 (41.8) | <.001 |
| Clinical findings | |||||||
| Hypotension | 880 (50.8) | 160 (36) | 297 (50.5) | 283 (62.7) | 109 (57.1) | 29 (52.7) | <.001 |
| Shock | 638 (36.8) | 110 (24.7) | 210 (35.7) | 207 (45.9) | 88 (46.1) | 22 (40) | <.001 |
| Cardiac dysfunctionf | 484 (31.0) | 76 (18.8) | 175 (32.4) | 141 (34.7) | 74 (43.3) | 17 (41.5) | <.001 |
| Myocarditis | 300 (17.3) | 41 (9.2) | 96 (16.3) | 93 (20.6) | 53 (27.7) | 17 (30.9) | <.001 |
| Coronary artery dilatation or aneurysmf | 258 (16.5) | 74 (18.3) | 90 (16.7) | 65 (16) | 22 (12.9) | 6 (14.6) | .61 |
| Pericardial effusionf | 365 (23.4) | 102 (25.2) | 129 (23.9) | 85 (20.9) | 38 (22.2) | 11 (26.8) | .60 |
| Pneumoniag | 330 (19) | 53 (11.9) | 98 (16.7) | 103 (22.8) | 55 (28.8) | 20 (36.4) | <.001 |
| ARDS | 115 (6.6) | 22 (4.9) | 32 (5.4) | 33 (7.3) | 17 (8.9) | 10 (18.2) | .01 |
| Pleural effusionh | 171 (10.3) | 35 (8.2) | 68 (12) | 44 (10.1) | 18 (9.7) | 6 (12) | .40 |
| SARS-CoV-2 testing | |||||||
| PCR positivei | 893 (51.5) | 218 (49) | 274 (46.6) | 242 (53.7) | 118 (61.8) | 39 (70.9) | <.001 |
| Received serology and tested positivej | 1432 (82.6) | 371 (83.4) | 513 (87.2) | 373 (82.7) | 141 (73.8) | 32 (58.2) | <.001 |
| Treatment | |||||||
| IVIGk | 1395 (80.5) | 368 (82.7) | 492 (83.7) | 376 (83.4) | 129 (67.5) | 29 (52.7) | <.001 |
| Steroids | 1230 (71) | 278 (62.5) | 412 (70.1) | 359 (79.6) | 141 (73.8) | 38 (69.1) | <.001 |
| Preceding COVID-19–like illnessl | 265 (24.7) | 50 (18.1) | 62 (16.4) | 86 (30.7) | 50 (43.9) | 17 (63) | <.001 |
| Incidence per 100 000 children | 2.1 | 2.3 | 2.9 | 2.2 | 1.5 | 0.4 | <.001 |
Abbreviations: ARDS, acute respiratory syndrome; ICU, intensive care unit; IQR, interquartile range; IVIG, intravenous immune globulin; MIS-C, multisystem inflammatory syndrome in children; PCR, polymerase chain reaction.
There were 3 patients with unknown age.
P values from Fisher exact tests for categorical variables and Kruskal-Wallis tests for continuous variables.
Percentages calculated among 1727 persons with known sex.
Percentages calculated among 1568 persons with known race/ethnicity.
P value assessed excluding the 0- to 4-year age group, who may have been less able to report these symptoms.
Percentages calculated among 1563 persons with an echocardiogram performed.
Information about pneumonia was collected on the case report form under signs and symptoms, complications, or chest imaging.
Percentages calculated among 1664 persons with either an echocardiogram or chest imaging performed.
A total of 770 patients (44.4%) had negative PCR test results, and 70 (4.0%) were not reported to receive a PCR test.
A total of 301 patients (17.4%) were not reported to receive a serology test; patients with negative serology results were excluded from analysis.
A total of 274 patients (15.8%) received a second IVIG dose.
Among 1075 patients with available information, 265 reported preceding COVID-19–like illness at least 7 days before MIS-C onset.
Overall, 1567 patients (90.4%) had illness manifestation involving at least 4 organ systems. In addition to fever, the most common signs and symptoms included abdominal pain (1153 [66.5%]), vomiting (1114 [64.3%]), rash (963 [55.6%]), diarrhea (931 [53.7%]), and conjunctival hyperemia (929 [53.6%]) (Table 1). Respiratory symptoms such as cough, shortness of breath, and chest pain were reported in less than 30% of patients. The median (interquartile range) duration of fever was 5 (4-7) days. About 50.8% (n = 880) of patients had hypotension, and 36.8% (n = 638) developed shock. Cardiac dysfunction was reported in 31.0% (n = 484) of patients, pericardial effusion in 23.4% (n = 365), myocarditis in 17.3% (n = 300), and coronary artery dilatation or aneurysms in 16.5% (n = 258) (Table 1). Patients aged 0 to 4 years had the lowest proportion with involvement of more than 6 organ systems or with gastrointestinal symptoms, hypotension, shock, myocarditis, cardiac dysfunction, and admission for intensive care. They also were least likely to have lymphopenia and thrombocytopenia and to be treated with steroids, intubation, or mechanical ventilation. A significantly higher proportion of patients aged 18 to 20 years had myocarditis, pneumonia, ARDS, and PCR positivity. Patients in this age group were also more likely to report preceding COVID-19 7 or more days before MIS-C onset (Table 1).
The median values for markers of inflammation, coagulation, and cardiac damage are summarized in eTable 1 in the Supplement. C-reactive protein, brain natriuretic peptide or pro–brain natriuretic peptide, and interleukin 6 median values were many times higher than the normal reference values. Thrombocytopenia and lymphopenia were reported in 40.3% (n = 698) and 30.7% (n = 532) of patients, respectively. Overall, 1395 patients (80.5%) received intravenous immune globulin (IVIG), and 1230 (71.0%) received steroid treatment (Table 1). Receipt of these treatments varied by age group. The proportion treated with IVIG (29 [52.7%]) was lowest in patients aged 18 to 20 years whereas the proportion treated with steroids (278 [62.5%]) was lowest in those aged 0 to 4 years (P < .001). Overall, 1009 patients (58.2%) were admitted for intensive care and 24 patients (1.4%) died.
Figure 1 illustrates the epicurve of MIS-C using 7-day moving averages contrasting with that of the COVID-19 pandemic. The graph shows 3 peaks for MIS-C in early May, early August, and December. The first 2 peaks followed the peaks for the COVID-19 pandemic by 2 to 5 weeks. The third peak seems to follow the rise in the COVID-19 pandemic. As illustrated in the eFigure in the Supplement, the first MIS-C peak is primarily due to patients from the northeastern region of the United States, coinciding with the predominance of the COVID-19 pandemic in the same region. In contrast, the second peak was largely due to patients associated with the COVID-19 pandemic centered in the south and west regions. The earliest retrospectively identified patient with MIS-C had illness onset in March 2020, about 4 weeks before the initial cluster of UK patients were identified in mid-April.1
Figure 1. Daily Number of Patients With MIS-C and COVID-19 by 7-Day Moving Averages, United States, March 2020 to January 2021.

The grayed-out area on the right side represents the most recent 6 weeks of data, for which multisystem inflammatory syndrome in children (MIS-C) case reports are likely incomplete.
A total of 611 patients with MIS-C (35.3%) had illness onset prior to July 1 (eTable 2 in the Supplement). The age, sex, and clinical presentation of these patients were consistent with patients reported after July 1, although the proportion of patients who were non-Hispanic White increased after July 1 (12.2% [n = 62] vs 24.1% [n = 255]). A significantly higher proportion of patients before July 1 had cardiac dysfunction, myocarditis, and more elevated pro–brain natriuretic peptide values and decreased lymphocyte values. In addition, patients in the earlier period were less likely to receive IVIG and significantly less likely to receive steroid treatment and to have positive PCR test results (eTable 2 in the Supplement).
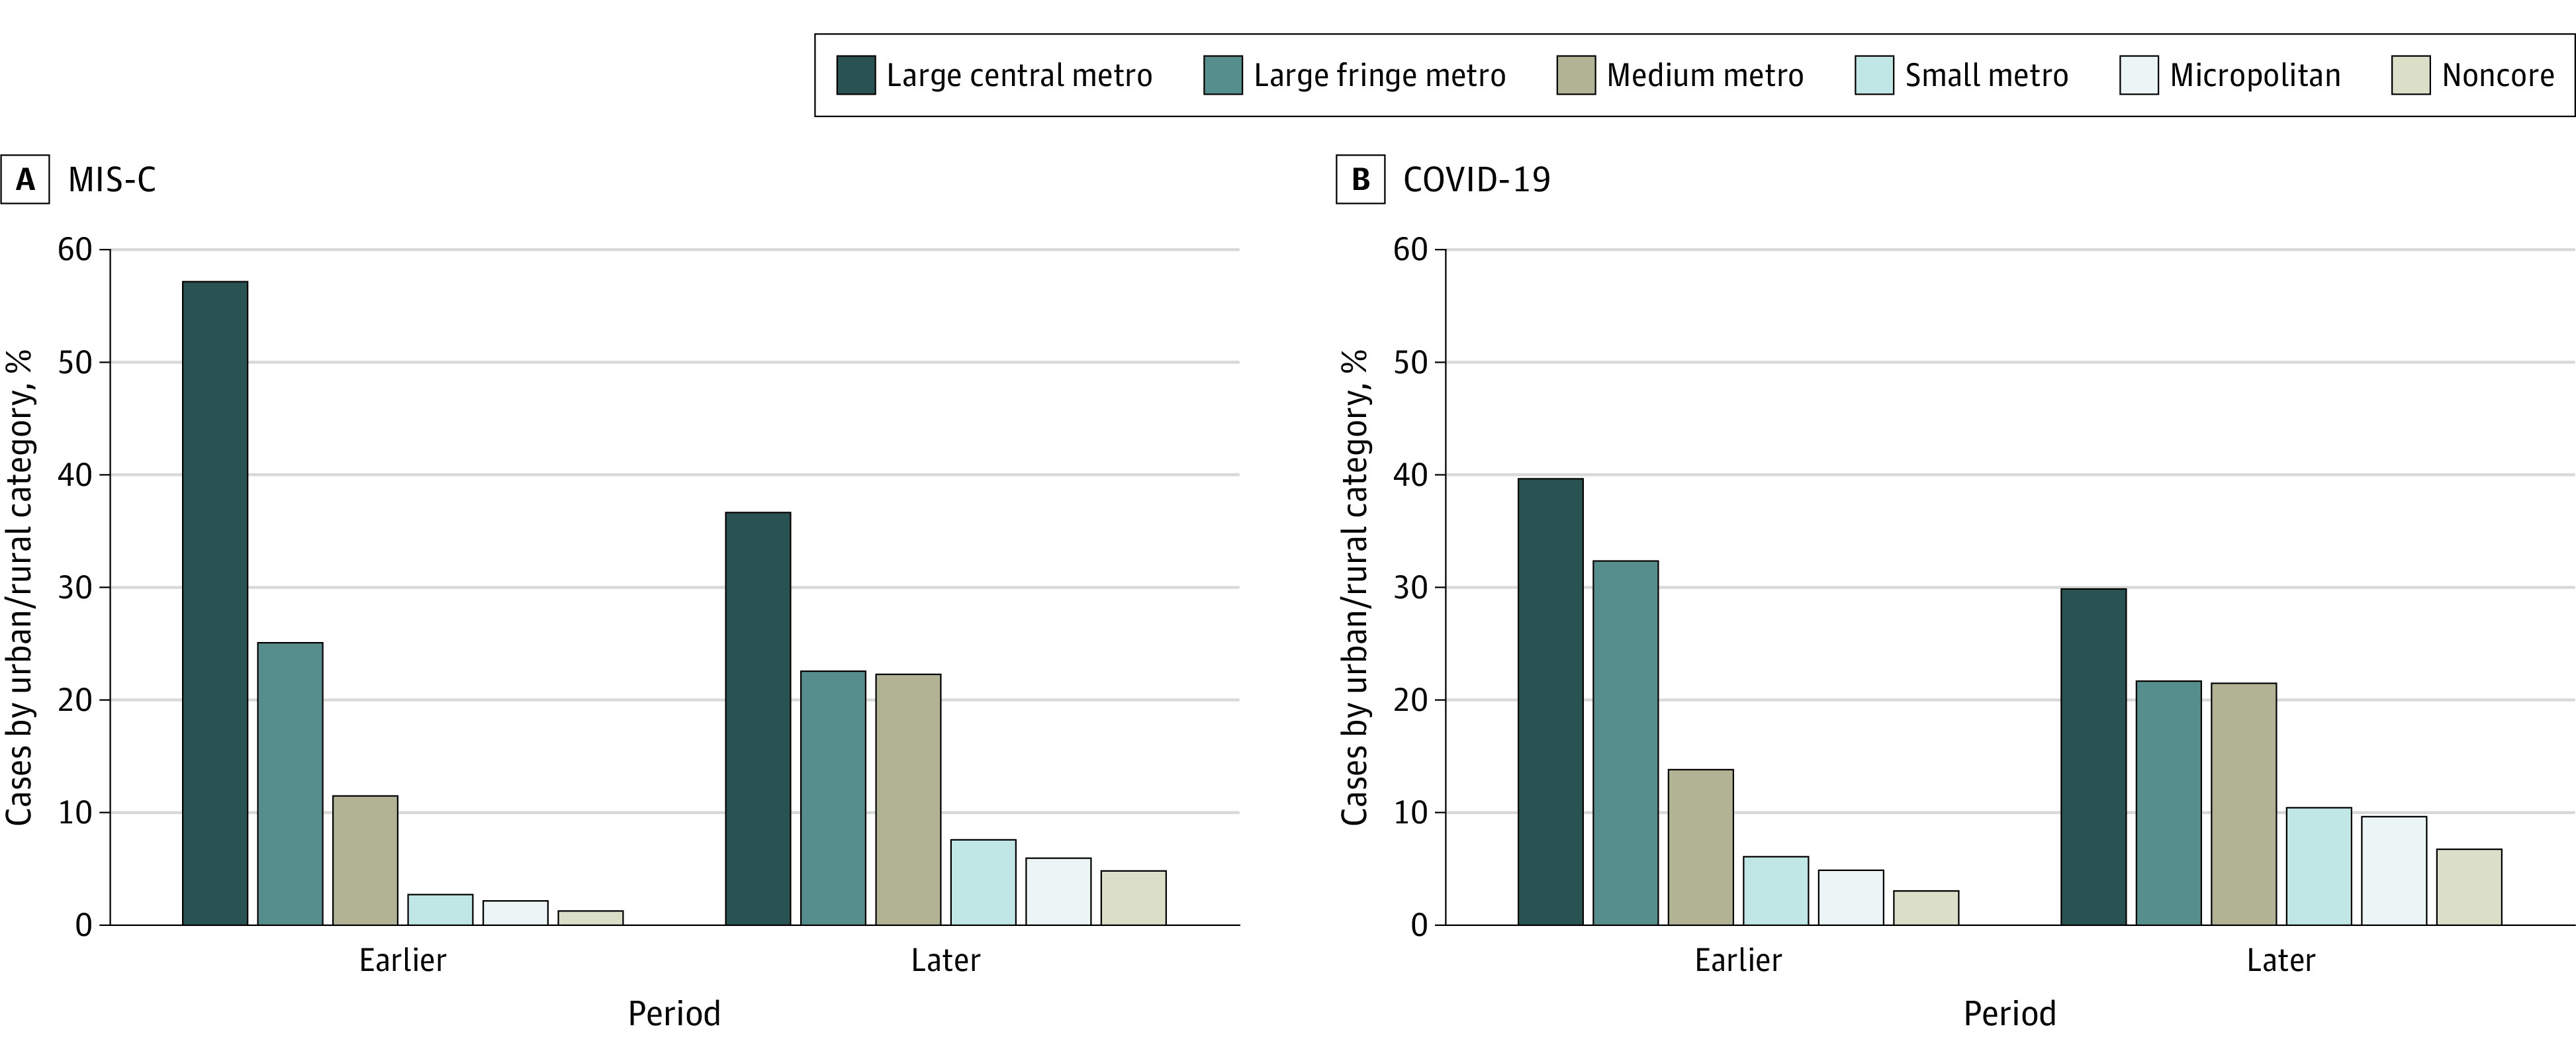
The geographic variation in cumulative MIS-C incidence per 100 000 persons younger than 21 years and COVID-19 cumulative incidence per 1000 persons younger than 21 years is depicted in Figure 2. The MIS-C incidence was 2.1 nationally and varied from 0.2 to 6.3 for states reporting patients with MIS-C. The burden of MIS-C in each state was generally highest in the Northeast, while most of the states with high pediatric COVID-19 burdens were in the West and Midwest (Figure 2). Patients with MIS-C from large central metro counties made up 57% of patients (n = 314) up to June 30, which declined to 37% (n = 380) from July onwards (Figure 3). The proportion of patients from small metro, micropolitan, or noncore areas increased from 6% (n = 34) to 18% (n = 191) over the 2 time periods. While the COVID-19 pandemic also increasingly spread to smaller towns and communities over time, the relative change was less pronounced than for MIS-C.
Figure 2. Multisystem Inflammatory Syndrome in Children (MIS-C) Cumulative Incidence per 100 000 Children and Pediatric COVID-19 Cumulative Incidence per 1000 Children Younger Than 21 Years, United States.

Figure 3. Proportion of Multisystem Inflammatory Syndrome in Children (MIS-C) and COVID-19 Cases by Urban-Rural Categories and 2 Time Periods, United States.
The presence of preceding COVID-19 at least 7 days before MIS-C onset was reported in 265 of 1075 patients (24.7%) with available information. The median (interquartile range) number of days before MIS-C onset for these patients was 27 (21-36) days; 253 patients (95.5%) developed MIS-C within 60 days of preceding COVID-19. The characteristics of patients with and without reported preceding COVID-19 are summarized in Table 2. The median (interquartile range) age of patients with preceding illness was higher than that without preceding illness (11 [6-15] vs 8 [5-11] years; P < .001). Compared with patients not reporting a preceding illness, patients who reported preceding illness were almost twice as likely to be non-Hispanic White. A significantly higher proportion of patients without preceding COVID-19 developed hypotension, shock, and cardiac dysfunction and were admitted for intensive care. Patients with preceding COVID-19 were more likely to report respiratory symptoms such as cough, shortness of breath, and chest pain and to have positive PCR test results. However, the proportion of patients with pneumonia and ARDS was similar between the 2 groups.
Table 2. Patients With MIS-C by Presence or Absence of Preceding COVID-19–Like Illness, United States, March 2020 to January 2021.
| Variable | COVID-19–like illness, No. (%)a | P valueb | |
|---|---|---|---|
| Not preceding (n = 810) | Preceding (n = 265) | ||
| Sexc | |||
| Female | 349 (43.1) | 106 (40) | .54 |
| Male | 460 (56.9) | 159 (60) | |
| Age, median (IQR), y | 8 (5-11) | 11 (6-15) | <.001 |
| Race/ethnicityd | |||
| Hispanic | 277 (37.9) | 79 (31.6) | <.001 |
| Non-Hispanic | |||
| Black | 257 (35.2) | 71 (28.4) | |
| White | 134 (18.4) | 79 (31.6) | |
| Asian | 8 (1.1) | 1 (0.4) | |
| Time with fever, median (IQR), d | 5 (4-7) | 5 (4-7) | .98 |
| ICU admission | 491 (60.6) | 141 (53.2) | .04 |
| Signs and symptoms | |||
| Abdominal pain | 558 (68.9) | 174 (65.7) | .33 |
| Vomiting | 528 (65.2) | 167 (63) | .55 |
| Diarrhea | 440 (54.3) | 145 (54.7) | .94 |
| Rash | 471 (58.1) | 142 (53.6) | .20 |
| Conjunctival hyperemia | 495 (61.1) | 136 (51.3) | .01 |
| Cough | 191 (23.6) | 81 (30.6) | .03 |
| Shortness of breath | 193 (23.8) | 90 (34) | .002 |
| Chest pain or tightness | 99 (12.2) | 52 (19.6) | .004 |
| Clinical findings | |||
| Hypotension | 448 (55.3) | 122 (46) | .01 |
| Shock | 327 (40.4) | 85 (32.1) | .02 |
| Cardiac dysfunctione | 263 (34.4) | 61 (24.6) | .005 |
| Myocarditis | 136 (16.8) | 51 (19.2) | .35 |
| Coronary artery dilatation or aneurysme | 142 (18.6) | 38 (15.3) | .29 |
| Pericardial effusione | 204 (26.7) | 52 (21) | .08 |
| Pneumoniaf | 121 (14.9) | 43 (16.2) | .62 |
| ARDS | 45 (5.6) | 14 (5.3) | >.99 |
| Pleural effusiong | 98 (12.4) | 24 (9.1) | .18 |
| SARS-CoV-2 testing | |||
| PCR positiveh | 346 (42.7) | 189 (71.3) | <.001 |
| Received serology testi | 717 (88.5) | 210 (79.2) | <.001 |
| Treatment | |||
| IVIGj | 693 (85.6) | 213 (80.4) | .05 |
| Steroids | 588 (72.6) | 199 (75.1) | .47 |
Abbreviations: ARDS, acute respiratory syndrome; ICU, intensive care unit; IQR, interquartile range; IVIG, intravenous immune globulin; MIS-C, multisystem inflammatory syndrome; PCR, polymerase chain reaction.
There were 658 patients for whom presence of COVID-19–like symptoms was unknown.
P values from Fisher exact tests for categorical variables and Kruskal-Wallis tests for continuous variables.
Percentages calculated among 1074 persons with known sex.
Percentages calculated among 980 persons with known race/ethnicity.
Percentages calculated among 1013 persons with an echocardiogram performed.
Information about pneumonia was collected on the case report form under signs and symptoms, complications, or chest imaging.
Percentages calculated among 1054 persons with either an echocardiogram or chest imaging performed.
A total of 493 patients (45.8%) had negative PCR results, and 47 (4.4%) were not reported to receive a PCR test.
A total of 148 patients (13.8%) were not reported to receive a serology test; patients with negative serology results were excluded from analysis.
A total of 162 patients (15.1%) received a second IVIG dose.
Discussion
The present study describes the largest cohort of patients with MIS-C and their geographic and temporal distribution in the United States to date. Patients were reported from almost all jurisdictions, and as of January 2020, the epicurve shows 3 peaks of MIS-C coinciding with the peaks of the COVID-19 pandemic. The discrepancy in MIS-C occurrence relative to total COVID-19 cases between the first and second peaks is primarily owing to intensive case finding and reporting in New York and surrounding states during the first MIS-C peak. In recent months, consistent with COVID-19 spread, more patients with MIS-C were identified in nonurban communities. The most recent third peak of the COVID-19 pandemic appears to be leading to another MIS-C peak perhaps involving urban and rural communities. The extent of this increase may not be fully captured for several months because of the 2- to 6-week delay in the occurrence of MIS-C and additional delays associated with identification and reporting of MIS-C. Patients reported during the 2 MIS-C peaks had similar characteristics except patients identified before July 1 were more likely to develop cardiac dysfunction and myocarditis. Interestingly, patients identified before July 1 were significantly less likely to receive steroid treatment. Whether or not steroid use has a direct effect on the likelihood of cardiac complications needs further evaluation. A recent study suggested that use of corticosteroids in conjunction with IVIG in patients with MIS-C was associated with a shortened recovery time for cardiac function.18
Patients with MIS-C predominantly presented with gastrointestinal symptoms such as abdominal pain, vomiting, and diarrhea as well as skin rash and conjunctival hyperemia. Most patients developed hypotension or shock with about 60% being admitted for intensive care. Myocarditis, cardiac dysfunction, or coronary artery dilatations were reported in approximately 30% of patients. The long-term effect of these complications is poorly understood, but follow-up studies to better elucidate the long-term outcomes of MIS-C have been initiated. In addition to understanding long-term outcomes, these studies may help in understanding the optimal level of follow-up care needed after patients are discharged from hospital or intensive care.
Compared with patients in the older age categories, patients aged 0 to 4 years had fewer cardiovascular complications and fewer admissions for intensive care. Although MIS-C in this age group seemed milder, the patients still had a more severe course compared with Kawasaki disease, with which MIS-C can easily be confused. About 38% of patients with MIS-C in this age group developed hypotension or shock and about 44% were admitted for intensive care. In addition, patients with MIS-C aged 0 to 4 years had a male:female ratio (1:1 vs 1.5:1) and frequency of Asian ancestry different from Kawasaki disease.19 The progressive increase in male:female ratio by age group among patients with MIS-C is not well understood. Patients aged 18 to 20 years were more likely to have myocarditis, pneumonia, and ARDS and to report preceding COVID-19 at least 7 days before MIS-C onset. The occurrence of symptomatic COVID-19 may have complicated the clinical course of these patients. Compared with other age groups, they were less likely to receive IVIG treatment although a similar proportion received steroids. Consistent with the COVID-19 pandemic, MIS-C disproportionately affected Hispanic and Black children and adolescents, although the proportion of patients who are non-Hispanic White increased over time. Long-standing inequities in the social determinants of health, such as housing, economic instability, insurance status, and work circumstances of patients and their family members have systematically placed racial and ethnic minority populations at higher risk for COVID-19 and probably also for more severe complications such as MIS-C.7
Most MIS-C illnesses are believed to result from asymptomatic or mild COVID-19 with hyperinflammation coinciding with peak antibody production several weeks after initial SARS-CoV-2 infection. Patients with MIS-C were reported to have significantly higher titers of SARS-CoV-2 receptor binding domain IgG antibodies compared with patients hospitalized with COVID-19.20 In the present study, about 25% of patients reported preceding COVID-19 at least 7 days before MIS-C onset. Although respiratory symptoms were more frequent among these patients, the proportion of patients with pneumonia and ARDS were similar among patients with and without preceding COVID-19. Overall, patients with preceding COVID-19 had a milder course with a lower proportion developing shock and cardiac dysfunction.
Limitations
The study has several limitations. Identification and reporting of patients suspected with MIS-C by health departments may not have been complete. Access to SARS-CoV-2 testing was variable by region and hospital particularly during the early phase of the pandemic. Serology test results can be affected by IVIG administration if samples were collected after treatment, and exclusion of patients who tested negative by serology could have introduced selection bias. Estimated pediatric patients with COVID-19 were used as a proxy for SARS-CoV-2 infections. However, if the proportion of pediatric SARS-CoV-2 infections resulting in reported COVID-19 disease differed by location or time, COVID-19 case counts may not be an ideal depiction of the distribution of populations at risk for MIS-C. Patients with MIS-C included in the analysis went through several levels of screening, including detailed review of clinical data for patients suspected with COVID-19 to create an algorithm. As reported, the patients represented the attending clinician’s best judgment of MIS-C diagnosis, but they were further screened using the CDC’s MIS-C case definition and using an additional algorithm created to exclude patients with possible COVID-19 diagnosis alone. These efforts may have led to exclusion of some patients with MIS-C.
Conclusions
The geographic and temporal occurrence of MIS-C in close association with the COVID-19 pandemic and the high proportion of patients with IgG positivity are consistent with earlier hypotheses that the emergence of MIS-C is due to delayed immunologic responses to infection by SARS-CoV-2.2,6,21 The clinical manifestations of patients with MIS-C varied by age and presence or absence of preceding COVID-19. Development of laboratory markers or diagnostic methods to distinguish MIS-C from severe COVID-19 illness and other hyperinflammatory conditions, such as Kawasaki disease, is critical for early and prompt diagnosis and treatment. As the COVID-19 pandemic spreads, causing a third peak and more sustained transmission across the United States, physicians should maintain a high index of suspicion for MIS-C to promptly diagnose and treat these patients. Practitioners should report patients suspected with MIS-C to local and state health departments.
eTable 1. Laboratory results for patients with MIS-C by age group, United States, March 2020 – January 2021
eTable 2. Characteristics of patients with MIS-C by time period of symptom onset, United States, March 2020 – January 2021
eFigure. Daily number of MIS-C and COVID-19 patients by 7-day moving averages, U.S. Census Regions: in A) the Northeast; B) the South; C) the West; and D) the Midwest
References
- 1.Riphagen S, Gomez X, Gonzalez-Martinez C, Wilkinson N, Theocharis P. Hyperinflammatory shock in children during COVID-19 pandemic. Lancet. 2020;395(10237):1607-1608. doi: 10.1016/S0140-6736(20)31094-1 [DOI] [PMC free article] [PubMed] [Google Scholar]
- 2.Dufort EM, Koumans EH, Chow EJ, et al. ; New York State and Centers for Disease Control and Prevention Multisystem Inflammatory Syndrome in Children Investigation Team . Multisystem inflammatory syndrome in children in New York state. N Engl J Med. 2020;383(4):347-358. doi: 10.1056/NEJMoa2021756 [DOI] [PMC free article] [PubMed] [Google Scholar]
- 3.Toubiana J, Poirault C, Corsia A, et al. Kawasaki-like multisystem inflammatory syndrome in children during the covid-19 pandemic in Paris, France: prospective observational study. BMJ. 2020;369:m2094. doi: 10.1136/bmj.m2094 [DOI] [PMC free article] [PubMed] [Google Scholar]
- 4.Belhadjer Z, Méot M, Bajolle F, et al. Acute heart failure in multisystem inflammatory syndrome in children (MIS-C) in the context of global SARS-CoV-2 pandemic. Circulation. 2020;142(5):429-436. doi: 10.1161/CIRCULATIONAHA.120.048360 [DOI] [PubMed] [Google Scholar]
- 5.Verdoni L, Mazza A, Gervasoni A, et al. An outbreak of severe Kawasaki-like disease at the Italian epicentre of the SARS-CoV-2 epidemic: an observational cohort study. Lancet. 2020;395(10239):1771-1778. doi: 10.1016/S0140-6736(20)31103-X [DOI] [PMC free article] [PubMed] [Google Scholar]
- 6.Feldstein LR, Rose EB, Horwitz SM, et al. ; Overcoming COVID-19 Investigators; CDC COVID-19 Response Team . Multisystem inflammatory syndrome in U.S. children and adolescents. N Engl J Med. 2020;383(4):334-346. doi: 10.1056/NEJMoa2021680 [DOI] [PMC free article] [PubMed] [Google Scholar]
- 7.Godfred-Cato S, Bryant B, Leung J, et al. ; California MIS-C Response Team . COVID-19-associated multisystem inflammatory syndrome in children: United States, March-July 2020. MMWR Morb Mortal Wkly Rep. 2020;69(32):1074-1080. doi: 10.15585/mmwr.mm6932e2 [DOI] [PMC free article] [PubMed] [Google Scholar]
- 8.Abrams JY, Godfred-Cato SE, Oster ME, et al. Multisystem inflammatory syndrome in children associated with severe acute respiratory syndrome coronavirus 2: a systematic review. J Pediatr. 2020;226:45-54.e41. doi: 10.1016/j.jpeds.2020.08.003 [DOI] [PMC free article] [PubMed] [Google Scholar]
- 9.Centers for Disease Control and Prevention . COVID-19: cases, data, and surveillance. Accessed December 28, 2020. https://www.cdc.gov/coronavirus/2019-ncov/cases-updates/index.html
- 10.Swann OV, Holden KA, Turtle L, et al. ; ISARIC4C Investigators . Clinical characteristics of children and young people admitted to hospital with covid-19 in United Kingdom: prospective multicentre observational cohort study. BMJ. 2020;370:m3249. doi: 10.1136/bmj.m3249 [DOI] [PMC free article] [PubMed] [Google Scholar]
- 11.US Centers for Disease Control and Prevention . Multisystem inflammatory syndrome in children (MIS-C) associated with coronavirus disease 2019 (COVID-19). Accessed December 28, 2020. https://emergency.cdc.gov/han/2020/han00432.asp
- 12.United States Census Bureau . Census regions and divisions of the United States. Accessed November 18, 2020. https://www2.census.gov/geo/pdfs/maps-data/maps/reference/us_regdiv.pdf
- 13.US Centers for Disease Control and Prevention . 2013 NCHS Urban-Rural Classification Scheme for Counties. Published April 2014. Accessed December 28, 2020. https://www.cdc.gov/nchs/data/series/sr_02/sr02_166.pdf
- 14.US Department of Housing and Urban Development . HUD USPS zip code crosswalk files. Accessed December 28, 2020. https://www.huduser.gov/portal/datasets/usps_crosswalk.html
- 15.Belot A, Antona D, Renolleau S, et al. SARS-CoV-2-related paediatric inflammatory multisystem syndrome, an epidemiological study, France, 1 March to 17 May 2020. Euro Surveill. 2020;25(22):2001010. doi: 10.2807/1560-7917.ES.2020.25.22.2001010 [DOI] [PMC free article] [PubMed] [Google Scholar]
- 16.Torres JP, Izquierdo G, Acuña M, et al. Multisystem inflammatory syndrome in children (MIS-C): Report of the clinical and epidemiological characteristics of cases in Santiago de Chile during the SARS-CoV-2 pandemic. Int J Infect Dis. 2020;100:75-81. doi: 10.1016/j.ijid.2020.08.062 [DOI] [PMC free article] [PubMed] [Google Scholar]
- 17.USA Facts . US coronavirus cases & deaths: track COVID-19 data daily by state and county. Accessed December 28, 2020. https://usafacts.org/visualizations/coronavirus-covid-19-spread-map/
- 18.Belhadjer Z, Auriau J, Méot M, et al. Addition of corticosteroids to immunoglobulins is associated with recovery of cardiac function in multi-inflammatory syndrome in children. Circulation. 2020;142(23):2282-2284. doi: 10.1161/CIRCULATIONAHA.120.050147 [DOI] [PMC free article] [PubMed] [Google Scholar]
- 19.Rowley AH. Multisystem inflammatory syndrome in children and Kawasaki disease: two different illnesses with overlapping clinical features. J Pediatr. 2020;224:129-132. doi: 10.1016/j.jpeds.2020.06.057 [DOI] [PMC free article] [PubMed] [Google Scholar]
- 20.Rostad CA, Chahroudi A, Mantus G, et al. Quantitative SARS-CoV-2 serology in children with multisystem inflammatory syndrome (MIS-C). Pediatrics. 2020;146(6):e2020018242. doi: 10.1542/peds.2020-018242 [DOI] [PubMed] [Google Scholar]
- 21.Whittaker E, Bamford A, Kenny J, et al. ; PIMS-TS Study Group and EUCLIDS and PERFORM Consortia . Clinical characteristics of 58 children with a pediatric inflammatory multisystem syndrome temporally associated with SARS-CoV-2. JAMA. 2020;324(3):259-269. doi: 10.1001/jama.2020.10369 [DOI] [PMC free article] [PubMed] [Google Scholar]
Associated Data
This section collects any data citations, data availability statements, or supplementary materials included in this article.
Supplementary Materials
eTable 1. Laboratory results for patients with MIS-C by age group, United States, March 2020 – January 2021
eTable 2. Characteristics of patients with MIS-C by time period of symptom onset, United States, March 2020 – January 2021
eFigure. Daily number of MIS-C and COVID-19 patients by 7-day moving averages, U.S. Census Regions: in A) the Northeast; B) the South; C) the West; and D) the Midwest