Abstract
The purpose of this study was to examine the effect of gaseous hydrogen sulphide on growth performance and cecal microbial diversity in weaning pigs. A total of 24 weaning pigs (Landrace × Yorkshire × Duroc; average body weight = 8.55 ± 0.68 kg;weaning at 28 days) were selected and randomly divided into four groups (six replicates in each group). The piglets were exposed to hydrogen sulphide (0, 5, 10 and 15 mg/m3) during the experiment period, which lasted 28 days in four controlled environmental chambers. The results showed that exposure to hydrogen sulphide reduced the average daily gain (ADG), average daily feed intake (ADFI), and increased the diarrhoea rate of piglets. Hydrogen sulphide could increase the abundance and diversity of intestinal microbiota. The abundance of Firmicutes and Proteobacteria increased and Bacteroides decreased in the treatment groups. Five biomarkers, such as Eubacterium_1coprostanoligenes, Clostridiales, Phascolarctobacterium, Acidaminococcaceae and Ruminococcaceae_UCG_002 were selected by Lefse analysis. Our results reveal that hydrogen sulphide damaged the growth performance and destroyed the microbial bacteria balance of weaning pigs. The concentrations of hydrogen sulphide should fall below 5 mg/m3.
Keywords: cecal microbial diversity, gaseous hydrogen sulphide, high‐throughput sequencing, weaning pigs
24 weaning pigs were exposed to hydrogen sulfide (0, 5, 10 and 15 mg/m3) in 4 controlled environmental chambers for 28 days.The results showed that exposure to gaseous hydrogen sulfide damaged the growth performance and resulted the microbial bacteria imbalance.The concentration of hydrogen sulfide should fall below 5 mg/m3.

1. INTRODUCTION
Hydrogen sulphide (H2S) is an insoluble gas with a colourless gas smelling of rotten egg, heavier than air, with a very low odour threshold and high toxicity. It has long been recognized as a toxic gas and environment pollutant (Haouzi, Sonobe, & Judenherc‐Haouzi, 2016; Wu et al., 2019) and remains a significant chemical hazard (Arnold, Dufresne, Alleyne, & Stuart, 1985; EPA, 2003) in various farming (Chénard, Lemay, & Laguë, 2003) as well as fishing activities (Glass, 1980). It continues to be one of the most common hazardous substances attributed to acute poisoning deaths in occupational settings. The maximum values recorded during some of the monitored events reached 1,000 ppm (Chénard et al., 2003). Pig production buildings involving short‐term storage of liquid manure may present hydrogen sulphide exposure risks. Its effects are reasonably well‐established in pigs and humans including mucosal irritation (Chaussier, 1908), especially of the eye, olfactory paralysis, sudden but reversible loss of consciousness, pulmonary oedema, death (Szabo, 2018) and genotoxic effect of high doses of hydrogen sulphide (Attene‐Ramos, Wagner, Plewa, & Gaskins, 2006).
According to the environmental protection agency (EPA), hydrogen sulphide is recognized as one of the important environmental stressors. Acute or chronic stress can modify gut permeability, which is related to the temporary distribution of tight junction proteins (Assimakopoulos, Gogos, & Labropoulou‐Karatza, 2011; Koh, Peng, & Klasing, 1996; Maejima, Deitch, & Berg, 1984; Matter & Balda, 2007). Mammals rely on their gut microbiota for digestion (Flint, Scott, Duncan, Louis, & Forano, 2012). The intestinal microbiome is involved in the regulation of multiple host pathways and metabolic and immune‐inflammatory axes that connect the gut with the liver, muscles and brain (Nicholson et al., 2012). The gut microbiome develops with its host from birth and is subjected to complex interactions influenced by the host genome, diet, health status, environment and lifestyle (Rodríguez et al., 2015).
Therefore, this research evaluated the effects of hydrogen sulphide on the growth performance and cecal microbiota of weaning pigs and ascertain the maxminum limitation of hydrogen sulphide in pigsty.
2. MATERIALS AND METHODS
2.1. Experimental design
A total of 24 weaning pigs (Landrace × Yorkshire ×Duroc; average body weight (BW) of 11.25 ± 1.01 kg; weaning at 28 days) were randomly allocated tofour treatment groups with six replicates in each group. The piglets were placed in four controlled environment chambers. The four environmental chambers were identical in terms of size, construction materials, acclimatisation equipment, cages, feeders and drinkers. Each controlled environment chambers was 23.5 × 23.5 × 2.5 m (length × width ×height) sealed unit. The piglets in three of the four rooms were exposed to hydrogen sulphide exposure 5 mg/m3, 10 mg/m3 and 15 mg/m3) during the experiment period, which lasted 28 days, whereas the last room served as the control treatment with 0 mg/m3 level of hydrogen sulphide. Hydrogen sulphide (purity ≥ 98%) and hydrogen sulphide bottles were provided by the Baoding Jinglian Gas Factory. The hydrogen sulphide bottles were connected to a pressure regulator and a flow metre in sequence to keep hydrogen sulphide concentration stable. The latter was connected to the chamber by a silicone tube. The piglets were fed with the feed according to the standards of the National Research Council, NRC (2012). The feed composition was provided in Table 1. The experimental protocols described the management and care of animals were approved by the Animal Care and Use Committee of Hebei Agriculture University, Baoding, China.
TABLE 1.
Dietary nutrient composition and its content
| Ingredients | Content (%) | Nutrient levels | Content (%) |
|---|---|---|---|
| Corn grain | 57 | Digestible energy b), (MJ.kg−1) | 14.06 |
| Wheat middling | 1 | Crude protein | 20.34 |
| Soybean oil | 2.5 | Crude fibre | 2.18 |
| Soybean meal | 14 | calcium | 0.88 |
| Soy protein isolate | 3.6 | phosphorus | 0.64 |
| Extruded soybean | 6 | Available phosphorus | 0.46 |
| Corn protein meal | 3 | Lysine | 1.22 |
| Imported fish meal | 3 | Methionine | 0.41 |
| Dried whey | 3 | Threonine | 0.81 |
| Glucose | 2 | ||
| NaCl | 0.3 | ||
| Limestone | 1 | ||
| CaHPO4 | 1.2 | ||
| Acidifier | 0.4 | ||
| Premixa) | 2 | ||
| Total | 100.00 |
A premix provides the following (per kg of the diet): VA 5 175 IU, VD31 150 IU, VE 11.5 IU, VK3 1.15 mg, VB1 0.575 mg, VB2 3.45 mg, VB6 0.23 mg, VB12 14.5 ug, riboflavin 3.45 mg, nicotinic acid 11.5 mg, pantothenic acid 5.75 mg, biotin 11.5 μg, Fe (as ferrous sulphate) 75 mg, Cu ( as copper sulphate) 10 mg, Mn (as manganese sulphate) 20 mg, I (as potassium iodide) 0.5 mg and Se (as sodium selenite) 0.175 mg.
b DE is a calculated value, while the others are measured values.
2.2. Sample collection
In experiment, Body weight (BW) of every piglet was measured on days 1, 15 and 28, and feed consumption was recorded on a piglet basis throughout the experiment to calculate the ADG, ADFI and FCR. From the experiment, faecal score of weaning pigs was recorded three times per day by the same person, according to the method described by Wang, Huang, Meng, and Wang (2011), the scores were as follows: 1 = well‐formed faeces (hard or soft, formed and moist stool that retains its shape), 2 = sloppy faeces (unformed stool that assumes the shape of the container) and 3 = diarrhoea (liquid stool that can be poured). The pigs were euthanized, and cecal digesta were collected in cryotubes and then stored at −80°C for further studies.
2.3. Intestinal microbiome analysis
Genomic DNA (gDNA) of bacteria was extracted from the samples using the Power Soil DNA Isolation Kit (Omega Bio‐Tek Inc., Norcross, GA, USA) according to the manufacturer's instructions. The DNA quality and quantity were assessed by the 260 nm/280 nm and 260 nm/230 nm ratios. Then, the DNA was stored at −80°C until further processing.
The V3‐V4 region of the bacterial 16S rRNA gene was amplified by polymerase chain reaction (PCR) with the common primer pair 338‐F (5'‐ACTCCTACGGGA GGCAGCA‐3') and 806‐R (5'‐GGACTACHVGGGTWTCTAAT‐3') combined with adapter and barcode sequences. A total volume of 50 μL contained 10 μL buffer, 0.2 μL Q5 high‐fidelity DNA polymerase, 10 μL high GC enhancer, 1 μL dNTP, 10 μM of each primer and 60 ng gDNA. The PCR conditions were as follows: an initial denaturation at 95°C for 5 min, followed by 15 cycles at 95°C for 1 min, 50°C for 1 min and 72°C for 1 min, and the final extension at 72°C for 7 min. The PCR products from the first step were purified using VAHTSTM DNA Clean Beads. The second step of PCR was then performed with a 40 μL reaction mixture that contained 20 μL 2 × Phμsion HF MM, 8 μL ddH2O, 10 μM for each primer and 10 μL PCR products from the first step. The PCR conditions were as follows: an initial denaturation at 98°C for 30 s, followed by 10 cycles at 98°C for 10 s, 65°C for 30 s min and 72°C for 30 s, and the final extension at 72°C for 5 min. Finally, all PCR products were quantified by Quant‐iT™ dsDNA HS reagent and pooled together. High‐throughput sequencing analysis of the bacterial rRNA gene was done using the Illumina Hiseq 2,500 platform (2 × 250 paired ends) at Biomarker Technologies Corporation, Beijing, China.
2.4. Bioinformatic analysis
According to the relationship between paired‐end (PE) reads and overlapping reads, the double‐ended sequencing data was compiled into a sequence of tags after Hiseq sequencing. The quality of the reads and the effect of merging analysed by quality control were used to obtain valid data by following three steps, such as PE read splicing, tag filtering and the removal of chimerism. UCLUST was used in QIIME (version 1.8.0) software to cluster tags at a similarity level of 97% to obtain operational taxon unit (OTUs) and classify the OTUs based on Silva taxonomy database (https://www.arb‐silva.de/).
2.5. Statistical analysis
All experimental data were statistically analysed by one‐way analysis of variance (ANOVA) using Statistical Packages for the Social Sciences (SPSS) 21.0. The results were expressed as Mean ± Standard Deviation (SD). p < .05 indicates a significant difference and p < .01 indicates an extremely significant difference.
3. RESULTS
3.1. Growth performance
The results of growth performance are shown in Table 2. Compared with control group, ADG and ADFI were significantly decreased (p < .01) and FCR was significantly increased (p < .01) in treatment groups.
TABLE 2.
Effect of gaseous hydrogen sulphide on the growth performance of weaning pigs
| Items | Control group | Treatment group 1 | Treatment group 2 | Treatment group 3 | p‐value |
|---|---|---|---|---|---|
| Initial weight(kg) | 11.12 ± 1.08 | 11.02 ± 1.18 | 11.15 ± 1.28 | 11.35 ± 0.78 | .96 |
| Final weight(kg) | 22.82 ± 1.74b | 20.48 ± 1.65a | 20.90 ± 2.24ab | 20.45 ± 1.32a | .097 |
| ADG, g | 417.86 ± 55.70B | 348.10 ± 32.47A | 338.21 ± 40.77A | 325 ± 23.15A | .003 |
| ADFI, g | 589.77 ± 6.03C | 585.05 ± 9.70AC | 576.47 ± 9.13AB | 571.23 ± 6.66B | .003 |
| FCR | 1.43 ± 0.21Bb | 1.74 ± 0.16Aab | 1.67 ± 0.18ABa | 1.77 ± 0.14Aab | .014 |
Note: The lowercase letters in the same row of data are the same, indicating that the difference is not significant (p > .05); the lowercase letters are different, indicating significant difference (p < .05); the same line of uppercase letters is different, indicating that the difference is extremely significant(p < .01).
3.2. Diarrhoea rate
It can be seen from Table 3 that the diarrhoea rate and faecal score of piglets were increased, but there were no statistical significance (p > .05).
TABLE 3.
Effects of gaseous hydrogen sulphide on diarrhoea rate and faecal morphology of weaning pigs
| Items | Control group | Treatment group 1 | Treatment group 2 | Treatment group 3 |
|---|---|---|---|---|
| Diarrhoea rate (%) | 5.02 | 5.55 | 6.02 | 6.08 |
| Faecal score | 2.07 ± 0.23 | 2.07 ± 0.18 | 2.08 ± 0.04 | 2.11 ± 0.15 |
Note: The lowercase letters in the same row of data are the same, indicating that the difference is not significant (p > .05); the lowercase letters are different, indicating significant difference (p < .05); the same line of uppercase letters is different, indicating that the difference is extremely significant(p < .01).
3.3. Overview of the sequencing data
Compared with control group, the piglets exposed to hydrogen sulphide had more OTUs (Figure 1). The Venn diagram is shown in Figure 2. There were 406 common OTUs among the treatment groups, while also 16, 5, 12 and 5 unique OTUs in the control group, and treatment groups 1, 2 and 3.
FIGURE 1.
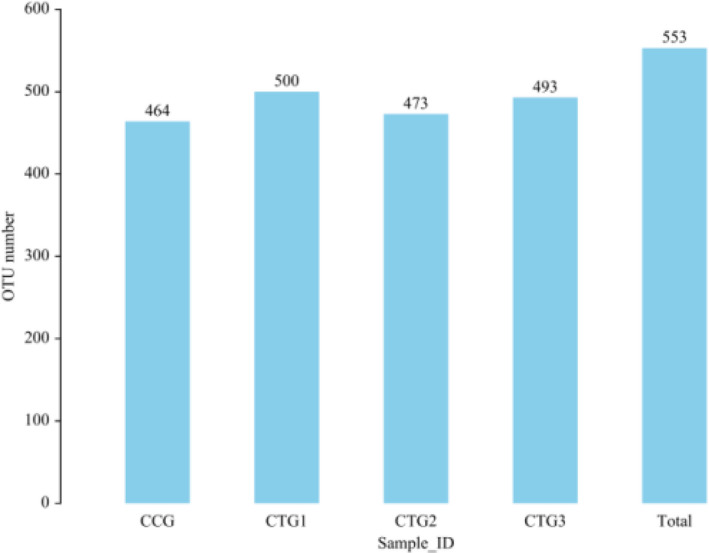
Distribution of OTU number of each group. Note: UCLUST is used in software QIIME (version 1.8.0) to cluster tags at 97% similarity level and obtain OTU. CCG, CTG1, CTG2 and CTG represent control group, treatment group 1, treatment group 2 and treatment group 3, respectively
FIGURE 2.
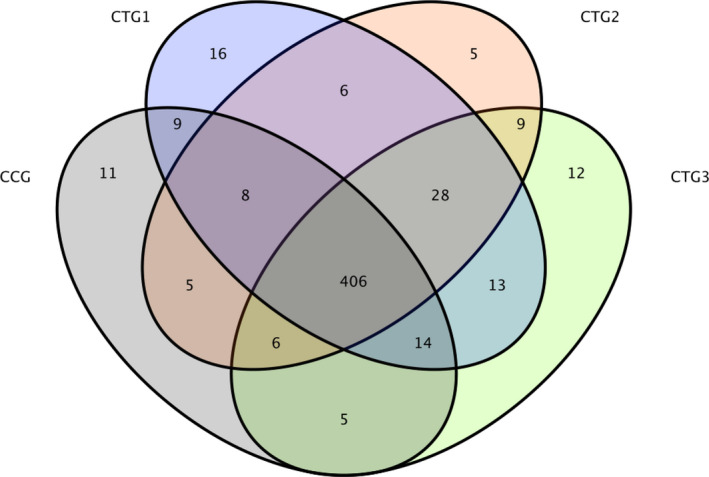
Venn map. Note: A Venn diagram represents the number of common and unique OTUs and the coincidence of OTUs between the samples. CCG, CTG1, CTG2 and CTG represent control group, treatment group 1, treatment group 2 and treatment group 3, respectively
3.4. Alpha and beta diversity
The alpha diversity analysis showed that ACE, Chao and Shannon indexes were increased, and the Shannon index was decreased in treatment groups 1, 2 and 3 when compared with the control group. Intestinal bacterial richness and diversity of the treatment groups were increased based on the OTUs, Chao, Shannon and Simpson indexes (Table 4). The rank abundance curve of the treatment groups was wider, indicating the species was richer than the control group in the treatment groups (Figure 3).
TABLE 4.
Alpha diversity index
| Items | Control group | Treatment group 1 | Treatment group 2 | Treatment group 3 | p‐value |
|---|---|---|---|---|---|
| Shannon | 4.06 ± 0.58 | 4.36 ± 0.16 | 4.38 ± 0.33 | 4.44 ± 0.39 | .87 |
| Simpson | 0.050 ± 0.025 | 0.027 ± 0.049 | 0.037 ± 0.025 | 0.033 ± 0.023 | .88 |
| ACE | 403.56 ± 26.68 | 409.35 ± 14.26 | 427.61 ± 30.70 | 414.07 ± 5.39 | .86 |
| Chao | 411.96 ± 29.07 | 418.18 ± 23.23 | 434.64 ± 31.73 | 435.77 ± 23.59 | .98 |
a: In the same column, the values with the same small letter superscripts mean no significant difference. The values with different small letter superscripts mean significant difference (p < .05) and the values with different capital letter superscripts mean very significant difference (p < .01). b: The Chao and ACE indexes measure the species richness. Shannon and Simpson indexes are used to measure species diversity, which are affected by species richness and community evenness among the samples. In the case of the same species abundance, the higher the evenness of each species in the community, the higher the diversity of the community; the high Shannon index and the low Simpson index values indicate the high species diversity of the samples.
FIGURE 3.
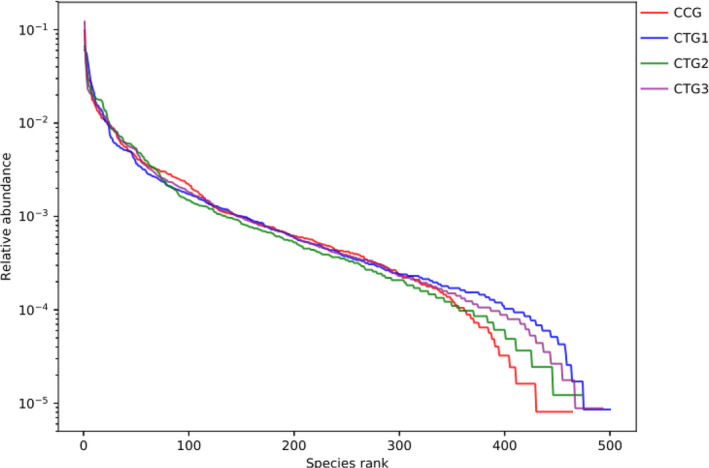
Rank abundance curve. Note: Rank abundance curve is a curve chart that sorts the OTU abundance of each sample by size and draws based on its relative abundance. It is mainly used to explain the species richness and evenness of the samples at the same time. The species richness is reflected by the length of the curve on the horizontal axis. The wider the curve, the richer the species composition. The evenness of species composition is reflected by the curve. The flat curve represents homogeneous species composition. CCG, CTG1, CTG2 and CTG represent control group, treatment group 1, treatment group 2 and treatment group 3, respectively
To compare the overall structure of microbiota under hydrogen sulphide exposure, the unweighted Unifrac distance matrix was calculated based on the OTUs of each sample. The results of the partial least squares discrimination analysis (PLS‐DA) based on distance exhibited a significant difference in the bacterial structure of the intestinal lumen. Furthermore, each sample of the four groups was fully separated (Figure 4). The similarity between the control group and treatment group 3 in the genus level was high (Figure 5).
FIGURE 4.
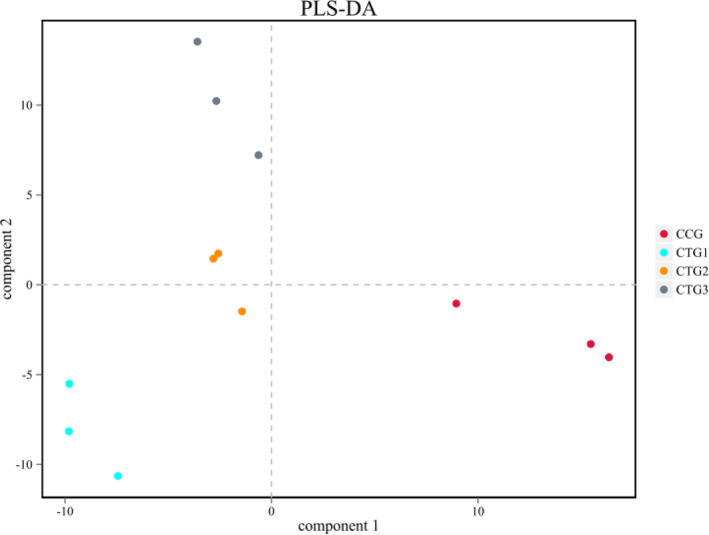
Partial least squares discrimination (PLS‐DA) analysis. Note: QIIME software is used for beta diversity analysis to compare the similarity of different samples in terms of species diversity. In the results, different colors represent different groups, the closer the samples are, the more similar the microbial composition and structure between the samples have. CCG, CTG1, CTG2 and CTG represent control group, treatment group 1, treatment group 2 and treatment group 3, respectively
FIGURE 5.
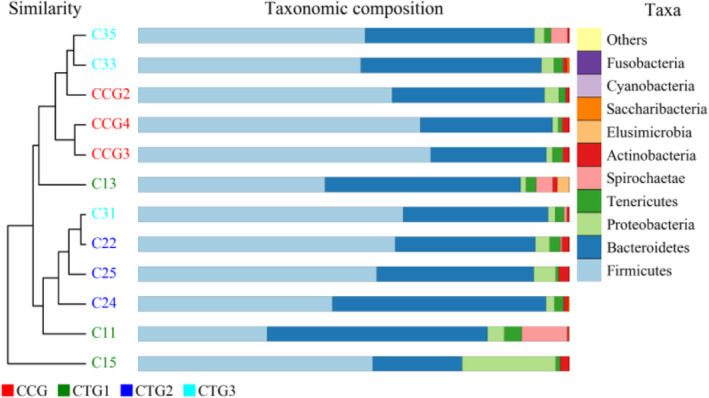
UPGMA (Unweighted pair‐group method with arithmetic mean) map. Note: The sample hierarchical clustering tree is shown as follows: sample clustering tree ‐‐the closer the samples are, the shorter the branches are, indicating that the species composition of the two samples is more similar. Abundance bar chart ‐‐ compares the species diversity, abundance similarity and dominant species of each sample according to the proportion of each color block. CCG, CTG1, CTG2 and CTG represent control group, treatment group 1, treatment group 2 and treatment group 3, respectively
3.5. Intestinal bacterial composition
To investigate the effects of different hydrogen sulphide concentrations on the structure and composition of intestinal microflora, the abundance of TOP10 microbial phyla (Figure 6a) and genus (Figure 6b) were used.
FIGURE 6.
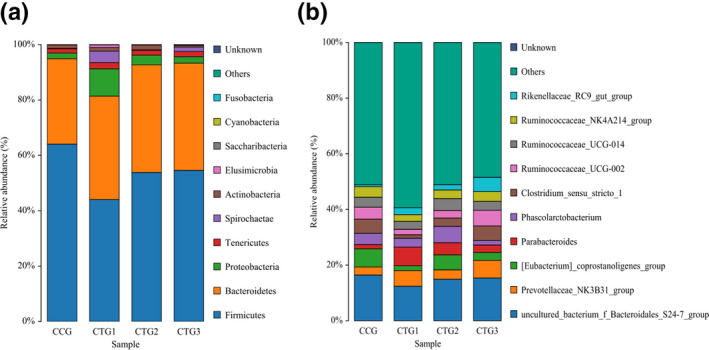
The phylum (a) and genus (b) level. Note: a color represents a species and the color block length represents the relative abundance ratio of species. The top ten species of abundance level were selected for analysis and other species were combined with others. As shown in the figure, unclassified represents the species not annotated by taxonomy. CCG, CTG1, CTG2 and CTG represent control group, treatment group 1, treatment group 2 and treatment group 3, respectively
At the phylum level, the microbiota in the cecal digesta was dominated by Firmicutes, Bacteroides and Proteobacteria. Compared with control group, the abundance of Firmicutes decreased by 20.04%(p < .05), 10.25% and 9.47% in treatment groups 1, 2 and 3; Bacteroidetes increased by 6.52%, 8.00% and 7.84%;Proteobacteria increased by 7.81%, 1.49% and 0.30%; Tenericutes increased by 0.68%, 0.15% and 0.25%;Spirochaetae increased by 3.99%, 0.04% and 1.49%.
The abundance of uncultured_bacterium_f_Bacteroidales_S24‐7_group decreased by 3.99%, 1.49% and 1.05% in treatment groups 1, 2 and 3; [Eubacterium]_ coprostanoligenes_group decreased by 87%, 1.14% and 3.66%;Ruminococcaceae_ NK4A214_ group decreased by 41.38%, 0.74% and 0.30%. Prevotellaceae_NK3B31_group increased by 2.73%, 0.48% and 3.43% in treatment groups 1, 2 and 3;Parabacteroides increased by 5.17%(p < .05), 2.81% and 1.09%.
3.6. LEfSe analysis
LEfSe analysis was performed with an LDA threshold of 4, and a statistically significant biomarker was found among different groups (Figure 7). Eubacterium_ coprostanoligenes and Megamonas were found in the control group. Phascolarctobacterium and Acidaminococcaceae were found in treatment group 2 and Ruminococcaceae_UCG‐002 was found in treatment group 3.
FIGURE 7.
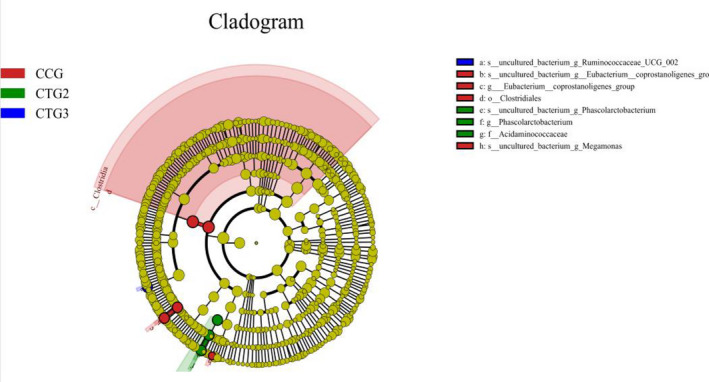
The LefSe analysis. Note: LefSe (Line Discriminant Analysis (LDA) Effect Size) is able to find the Biomarker with statistical difference between different groups. The coloring principle is to uniformly color the species with no significant difference to yellow, while other different species are colored according to the group with the highest abundance of the species. CCG, CTG1, CTG2 and CTG represent control group, treatment group 1, treatment group 2 and treatment group 3, respectively
4. DISCUSSION
The maximal concentration measurements taken within Animal feeding operations (AFOs) were the highest among the studies reviewed (8.66E + 03 mg/m3) (Malone Rubright, Pearce, & Peterson, 2017). Wang et al. (2011) indicated that exposure to hydrogen sulphide had lower weaning weight in chickens. Dorman, Struve, Gross, and Brenneman (2004) reported the exposure of hydrogen sulphide to SD rats led to reduced ADG. However, it was not clear whether hydrogen sulphide had a similar negative effect on piglets. In this study, BW and ADG of weaning pigs were linearly decreased with the increasing level of hydrogen sulphide. These results illustrate that hydrogen sulphide damages piglets health, especially the growth performance, and that higher hydrogen sulphide concentrations cause more obvious damage. Hydrogen sulphide is well known to cause irritation, damage to airway (Chen, Li, Shi, Zhang, & Xu, 2019) and pulmonary injury (Saeed et al., 2018) following inhalation. We found that gaseous hydrogen sulphide damaged the conjunctiva of piglets resulting eyelid redness and swollen and increased cough frequency which affecting appetite of the piglets, reducing the ADG. At the same time, the absorption of hydrogen sulphide will also affect the electron transfer of the respiratory chain in the body, reducing the ability of piglets to use oxygen and causing hypoxia, which may also be one of the reasons of reducing of ADG. For piglets, optimizing the gastrointestinal ecosystem and nutrient management seems of utmost importance to maintain piglets performance and health status (Taras, Vahjen, Macha, & Simon, 2006). The imbalance of intestinal bacteria may be the reason of increasing of diarrhoea rate and faecal score. These effects resulted the reduce of intake and nutrient utilization.
In this study, Alpha diversity index and rank abundance curve indicated that exposed to gaseous hydrogen sulphide could increase the cecal microbiota diversity and the species abundance of weaning pigs. PLS‐DA analysis showed that the species of the four populations could be separated and the composition of the microbial community group was similar. At the phylum level, the composition in the control group was closest to the treatment group 3, followed by the treatment groups 2 and 1, suggesting that the microbial community composition was affected by hydrogen sulphide. On the contrary, the similarity of the microbial community composition had increased with the increasing of hydrogen sulphide. It was speculated that the body would adjust itself and adapt to the stress with the increasing intensity of the particular stimulus.
At the phylum level, Firmicutes, Bacteroidetes and Proteobacteria are the dominant bacteria. The core microflora in the intestine directly affects the normal intestinal function. The bacterial genera, such as Proteus, Bacteroides, Absidia and Actinomycetes play important roles in the intestinal tract. Studies have found that Rothia and Bacteroides are the core microflora (Ley, Hamady, & Lozupone, 2008; Shen et al., 2006).The previous studies revealed that Firmicutes and Bacteroidetes are the dominant phyla in birds, zebrafish and mammals (Kohl, 2012; Semova et al., 2012). In the gastrointestinal tract of animals, Firmicutes and Bacteroides are the most common bacteria, accounting for 92.6% of all 16S rRNA sequences in human (Eckburg et al., 2005; Ley, Turnbaugh, Klein, & Gordon, 2006). In this study, three bacterial phyla, such as Firmicutes, Bacteroidetes and Proteobacteria accounted for 96.97%, 91.26%, 96.21% and 95.64%. It was similar with previous researches.
At the phylum level, Firmicutes was the most abundant in the four groups, and its abundance in pigs exposed to hydrogen sulphide was reduced compared to the control group. Besides, at the genus level, the abundance of [Eubacterium] _coprostanoligenes and Ruminococcaceae _NK4A214 which belongs to Firmicutes decreased in control and treatment groups. And the abundance was lowest when exposed to 5 mg/m3 hydrogen sulphide. Bacteroidetes, as the second abundant bacteria, at the genus level, the abundance of Parabacteroides increased significantly in treatment group 1 compared with the control group. The abundance of the uncultured_bacterium_f_Bacteroidales_S24‐7 genus decreased when exposed to hydrogen sulphide, and the abundance was lowest when exposed to 5 mg/m3 hydrogen sulphide. However, the abundance of Bacteroidetes in each treatment group increased. As one of the major members among animal microbiota, the phylum, Bacteroidetes exists in various mammalian microbiota, such as mice, dogs and ducks (Deng & Swanson, 2015; Wang et al., 2018; Weldon et al., 2015). Bacteroides are considered to have the ability to degrade organic substances of high molecular weight, such as proteins and carbohydrates. Bacteroides also help the host to obtain the nutrients from the diet (Tremaroli & Bäckhed, 2012). The previous studies reported that the increasing ratio of Firmicutes to Bacteroidetes might increase fat deposition (Schwiertz et al., 2010), which is associated with the increased production of SCFAs and energy utilization by colonic fermentation (Fernandes, Su, Rahat‐Rozenbloom, Wolever, & Comelli, 2014; Turnbaugh et al., 2006). This could be the reason of the reduction in apparent digestibility of protein, fat and energy.
Proteobacteria is the third abundant phylum. In contrast with the control group, the abundance of Proteobacteria was highest in the treatment group 1, followed by treatment groups 2 and 3. Proteus has pro‐inflammatory properties (Lopetuso, Ianiro, Scaldaferri, Cammarota, & Gasbarrini, 2016; Lopetuso et al., 2016; Sartor, 2008) and the role of Proteus in the intestinal inflammation has been demonstrated in various mouse models of colitis with positive correlation (Maharshak et al., 2013). Therefore, in addition to the reduction of energy absorption and utilization, hydrogen sulphide may also cause intestinal inflammation.
The biomarkers selected in the control group were Eubacterium_ coprostanoligenes, Clostridiales and Megamonas, while the biomarkers screened in the treatment groups included Phascolarctobacterium, Acidaminococcaceae and Ruminococcaceae_UCG_002. It was reported that the abundance of Eubacterium_coprostanoligenes of high‐yielding cows, meat ducks and laying hens was significantly higher than that of low‐yielding cows, meat ducks and laying hens (Dai et al., 2018; O’Donnell et al., 2013; Tong et al., 2018; Zhang(a) et al. 2019). Clostridiales (50.7%) were the dominant bacteria among cecal microbiota in 21‐day‐old meat ducks at the order level (Dai et al., 2018). It was related to the weight of humans and mice (Goodrich et al., 2014). It may explain the better growth performance in control group. Previous study showed that Bacteroides, Oscillibacter and Ruminococcaceae_UCG‐002 were positively correlated with the BW of pigs with intrauterine growth retardation (Zhang(b) et al. 2019). It indicated that the microflora related to carbohydrate metabolism and weight loss was decreased to influence in the nutrient absorption and growth performance of piglets after hydrogen sulphide treated.
In conclusion, the gaseous hydrogen sulphide level significantly affected the cecal microbiota of pigs. The increased level of hydrogen sulphide increased the diversity of cecal microbiota in pigs. High hydrogen sulphide content may reduce the defence of piglets cecum to harmful bacteria. The concentrations of hydrogen sulphide should fall below 5 mg/m3.
PEER REVIEW
The peer review history for this article is available at https://publons.com/publon/10.1002/vms3.324
Cui J, Wu F, Yang X, et al. Effect of gaseous hydrogen sulphide on growth performance and cecal microbial diversity of weaning pigs. Vet Med Sci.2021;7:424–431. 10.1002/vms3.324
Fengyang Wu and Xinyu Yang authors are contributed equally to this work.
[Correction added on 8 March 2021, after initial online publication. A duplicate of this article was published under the DOI: 10.1002/vms3.309. This duplicate has now been deleted and its DOI redirected to this version of the article.]
REFERENCES
- Arnold, I. M. , Dufresne, R. M. , Alleyne, B. C. , & Stuart, P. J. (1985). Health implication of occupational exposures to hydrogen sulfide. Journal of Occupational and Environmental Medicine, 27(5), 373–376. 10.1097/00043764-198505000-00018 [DOI] [PubMed] [Google Scholar]
- Assimakopoulos, S. F. , Gogos, C. , & Labropoulou‐Karatza, C. (2011). Could antioxidants be the "magic pill" for cirrhosis‐related complications? A Pathophysiological Appraisal. Medical Hypotheses, 77(3), 419–423. 10.1016/j.mehy.2011.05.034 [DOI] [PubMed] [Google Scholar]
- Attene‐Ramos, M. S. , Wagner, E. D. , Plewa, M. J. , & Gaskins, H. R. (2006). Evidence that hydrogen sulfide is a genotoxic agent. Molecular Cancer Research, 4(1), 9–14. 10.1158/1541-7786.MCR-05-0126 [DOI] [PubMed] [Google Scholar]
- Chaussier, F. (1908). Précis d’experiences faites sur les animaux avec le gaz hydrogéne sulfuré J Gen de Med. Chir Et Pharm Paris, 15, 19–39. [Google Scholar]
- Chen, M. , Li, X. , Shi, Q. , Zhang, Z. , & Xu, S. (2019). Hydrogen sulfide exposure triggers chicken trachea inflammatory injury through oxidative stress‐mediated FOS/IL8 signaling. Journal of Hazardous Materials, 368, 243–254. 10.1016/j.jhazmat.2019.01.054 [DOI] [PubMed] [Google Scholar]
- Chénard, L. , Lemay, S. P. , & Laguë, C. (2003). Hydrogen sulfide assessment in shallow‐pit swine housing and outside manure storage. Journal of Agricultural Safety and Health, 9(4), 285–302. 10.13031/2013.15458 [DOI] [PubMed] [Google Scholar]
- Dai, S. J. , Zhang, K. Y. , Ding, X. M. , Bai, S. P. , Luo, Y. H. , Wang, J. P. , & Zeng, Q. F. (2018). Effect of dietary non‐phytate phosphorus levels on the diversity and structure of cecal microbiota in meat duck from 1 to 21 d of age. Poultry Science, 97(7), 2441–2450. 10.3382/ps/pey090 [DOI] [PubMed] [Google Scholar]
- Deng, P. , & Swanson, K. S. (2015). Gut microbiota of humans, dogs and cats: Current knowledge and future opportunities and challenges. British Journal of Nutrition, 113(Suppl), S6–S17. 10.1017/S0007114514002943 [DOI] [PubMed] [Google Scholar]
- Dorman, D. C. , Struve, M. F. , & Gross, E. A. , Brenneman, K. A. (2004). Respiratory tract toxicity of inhaled hydrogen sulfide in Fischer-344 rats, Sprague-Dawley rats, and B6C3F1 mice following subchronic (90-day) exposure. Toxicology and Applied Pharmaeology, 198, 29–39. 10.1016/j.taap.2004.03.010. [DOI] [PubMed] [Google Scholar]
- Eckburg, P. B. , Bik, E. M. , Bernstein, C. N. , Purdom, E. , Dethlefsen, L. , & Sargent, M. … Relman, D. A. (2005). Diversity of the human intestinal microbial flora. Science, 308(5728), 1635–1638. 10.1126/science.1110591 [DOI] [PMC free article] [PubMed] [Google Scholar]
- EPA . (2003). Toxicological Review of Hydrogen Sulfide (CAC No 7783–06‐04) United States Environmental Protection Agency. Washington DC.
- Fernandes, J. , Su, W. , Rahat‐Rozenbloom, S. , Wolever, T. M. , & Comelli, E. M. Adiposity, gut microbiota and faecal short chain fatty acids are linked in adult humans. Nutr Diabetes. 2014;4(6):e121. Published 2014 Jun 30. 10.1038/nutd.2014.23. [DOI] [PMC free article] [PubMed] [Google Scholar]
- Flint, H. J. , Scott, K. P. , Duncan, S. H. , Louis, P. , & Forano, E. (2012). Microbial degradation of complex carbohydrates in the gut. Gut Microbes, 3(4), 289–306. 10.4161/gmic.19897 [DOI] [PMC free article] [PubMed] [Google Scholar]
- Glass, R. I. et al (1980). Deaths from asphyxia among fisherman. JAMA, 244, 2193–2194. 10.1001/jama.244.19.2193 [DOI] [PubMed] [Google Scholar]
- Goodrich, J. K. , Waters, J. L. , Poole, A. C. , Sutter, J. L. , Koren, O. , Blekhman, R. , … Ley, R. E. (2014). Human genetics shape the gut microbiome. Cell, 159(4), 789–799. 10.1016/j.cell.2014.09.053 [DOI] [PMC free article] [PubMed] [Google Scholar]
- Haouzi, P. , Sonobe, T. , & Judenherc‐Haouzi, A. (2016). Developing effective countermeasures against acute hydrogen sulfide intoxication: Challenges and limitations. Annals of the New York Academy of Sciences, 1374(1), 29–40. 10.1111/nyas.13015 [DOI] [PMC free article] [PubMed] [Google Scholar]
- Koh, T. S. , Peng, R. K. , & Klasing, K. C. (1996). Dietary copper level affects copper metabolism during lipopolysaccharide‐induced immunological stress in chicks. Poultry Science, 75(7), 867–872. 10.3382/ps.0750867 [DOI] [PubMed] [Google Scholar]
- Kohl, K. D. (2012). Diversity and function of the avian gut microbiota. Journal of Comparative Physiology B, 182(5), 591–602. 10.1007/s00360-012-0645-z [DOI] [PubMed] [Google Scholar]
- Ley, R. E. , Hamady, M. , Lozupone, C. et al Evolution of mammals and their gut microbes [published correction appears in Science. Science, 320(5883), 1647–1651. 10.1126/science.1155725. [DOI] [PMC free article] [PubMed] [Google Scholar]
- Ley, R. E. , Turnbaugh, P. J. , Klein, S. , & Gordon, J. I. (2006). Microbial ecology: Human gut microbes associated with obesity. Nature, 444(7122), 1022–1023. 10.1038/4441022a [DOI] [PubMed] [Google Scholar]
- Lopetuso, L. R. , Ianiro, G. , Scaldaferri, F. , Cammarota, G. , & Gasbarrini, A. (2016). Gut Viromeand Inflammatory Bowel Disease. Inflammatory Bowel Diseases, 22(7), 1708–1712. 10.1097/MIB.0000000000000807 [DOI] [PubMed] [Google Scholar]
- Maejima, K. , Deitch, E. A. , & Berg, R. D. (1984). Bacterial translocation from the gastrointestinal tracts of rats receiving thermal injury. Infection and Immunity, 43(1), 6–10. 10.1128/IAI.43.1.6-10.1984 [DOI] [PMC free article] [PubMed] [Google Scholar]
- Maharshak, N. , Packey, C. D. , Ellermann, M. , Manick, S. , Siddle, J. P. , Huh, E. Y. , … Carroll, I. M. (2013). Altered enteric microbiota ecology in interleukin 10‐deficient mice during development and progression of intestinal inflammation. Gut Microbes, 4(4), 316–324. 10.4161/gmic.25486 [DOI] [PMC free article] [PubMed] [Google Scholar]
- Malone Rubright, S. L. , Pearce, L. L. , & Peterson, J. (2017). Environmental toxicology of hydrogen sulfide. Nitric Oxide, 71, 1–13. 10.1016/j.niox.2017.09.011 [DOI] [PMC free article] [PubMed] [Google Scholar]
- Matter, K. , & Balda, M. S. (2007). Epithelial tight junctions, gene expression and nucleo‐junctional interplay. Journal of Cell Science, 120(Pt 9), 1505–1511. 10.1242/jcs.005975 [DOI] [PubMed] [Google Scholar]
- National Research Council (US) Subcommittee on Laboratory Animal Nutrition . (1995). Nutrient requirements of laboratory animals: Fourth Revised Edition. Washington (DC): National Academies Press (US). [PubMed] [Google Scholar]
- Nicholson, J. K. , Holmes, E. , Kinross, J. , Burcelin, R. , Gibson, G. , Jia, W. , & Pettersson, S. (2012). Host‐gut microbiota metabolic interactions. Science, 336(6086), 1262–1267. 10.1126/science.1223813 [DOI] [PubMed] [Google Scholar]
- O' Donnell, M. M. , Harris, H. , Jeffery, I. B. , Claesson, M. J. , Younge, B. , O' Toole, P. W. , & Ross, R. P. (2013). The core faecal bacterial microbiome of Irish thoroughbred racehorses. Letters in Applied Microbiology, 57(6), 492–501. 10.1111/lam.12137 [DOI] [PubMed] [Google Scholar]
- Rodríguez, J. M. , Murphy, K. , Stanton, C. , Ross, R. P. , Kober, O. I. , Juge, N. , … Collado, M. C. (2015). The composition of the gut microbiota throughout life, with an emphasis on early life. Microbial Ecology in Health & Disease,26:26050. Published 2015 Feb 2. 10.3402/mehd.v26.26050. [DOI] [PMC free article] [PubMed] [Google Scholar]
- Saeed, O. , Boyer, N. L. , Pamplin, J. C. , Driscoll, I. R. , DellaVolpe, J. , Cannon, J. , & Cancio, L. C. (2018). Military Medicine, 183(suppl_2), 130–132. 10.1093/milmed/usy073 [DOI] [PubMed] [Google Scholar]
- Sartor, R. B. (2008). Microbial influences in inflammatory bowel diseases. Gastroenterology, 134(2), 577–594. 10.1053/j.gastro.2007.11.059 [DOI] [PubMed] [Google Scholar]
- Schwiertz, A. , Taras, D. , Schäfer, K. , Beijer, S. , Bos, N. A. , Donus, C. , & Hardt, P. D. (2010). Microbiota and SCFA in lean and overweight healthy subjects. Obesity (Silver Spring), 18(1), 190–195. 10.1038/oby.2009.167 [DOI] [PubMed] [Google Scholar]
- Semova, I. , Carten, J. D. , Stombaugh, J. , Mackey, L. C. , Knight, R. , Farber, S. A. , & Rawls, J. F. (2012). Microbiota regulate intestinal absorption and metabolism of fatty acids in the zebrafish. Cell Host & Microbe, 12(3), 277–288. 10.1016/j.chom.2012.08.003 [DOI] [PMC free article] [PubMed] [Google Scholar]
- Shen, J. , Zhang, B. , Wei, G. , Pang, X. , Wei, H. , Li, M. , … Zhao, L. (2006). Molecular profiling of the Clostridium leptum subgroup in human fecal microflora by PCR‐denaturing gradient gel electrophoresis and clone library analysis. Applied and Environment Microbiology, 72(8), 5232–5238. 10.1128/AEM.00151-06 [DOI] [PMC free article] [PubMed] [Google Scholar]
- Szabo, C. (2018). A timeline of hydrogen sulfide (H2S) research: From environmental toxin to biological mediator. Biochemical Pharmacology, 149, 5–19. 10.1016/j.bcp.2017.09.010 [DOI] [PMC free article] [PubMed] [Google Scholar]
- Taras, D. , Vahjen, W. , Macha, M. , & Simon, O. (2006). Performance, diarrhea incidence, and occurrence of Escherichia coli virulence genes during long‐term administration of a probiotic Enterococcus faecium strain to sows and piglets. Journal of Animal Science, 84, 608–617. [DOI] [PubMed] [Google Scholar]
- Tong, J. , Zhang, H. , Yang, D. , Zhang, Y. , Xiong, B. , & Jiang, L. Illumina sequencing analysis of the ruminal microbiota in high‐yield and low‐yield lactating dairy cows. PLoS One. 2018;13(11):e0198225. Published 2018 Nov 13. 10.1371/journal.pone.0198225. [DOI] [PMC free article] [PubMed] [Google Scholar]
- Tremaroli, V. , & Bäckhed, F. (2012). Functional interactions between the gut microbiota and host metabolism. Nature, 489(7415), 242–249. 10.1038/nature11552 [DOI] [PubMed] [Google Scholar]
- Turnbaugh, P. J. , Ley, R. E. , Mahowald, M. A. , Magrini, V. , Mardis, E. R. , & Gordon, J. I. (2006). An obesity‐associated gut microbiome with increased capacity for energy harvest. Nature, 444(7122), 1027–1031. 10.1038/nature05414 [DOI] [PubMed] [Google Scholar]
- Wang, S. , Chen, L. I. , He, M. , Shen, J. , Li, G. , Tao, Z. , … Lu, L. (2018). Different rearing conditions alter gut microbiota composition and host physiology in Shaoxing ducks. Scientific Reports, 8(1), 7387. 10.1038/s41598-018-25760-7 [DOI] [PMC free article] [PubMed] [Google Scholar]
- Wang, Y. , Huang, M. , Meng, Q. , & Wang, Y. (2011). Effects of atmospheric hydrogen sulfide concentration on growth and meat quality in broiler chickens. Poultry Science, 90(11), 2409–2414. 10.3382/ps.2011-01387 [DOI] [PubMed] [Google Scholar]
- Weldon, L. , Abolins, S. , Lenzi, L. , Bourne, C. , Riley, E. M. , & Viney, M. (2015). The gut microbiota of wild mice[J]. PLoS One, 10, e0134643. 10.1371/journal.pone.0134643 [DOI] [PMC free article] [PubMed] [Google Scholar]
- Wu, D. D. , Wang, D. Y. , Li, H. M. , Guo, J. C. , Duan, S. F. , & Ji, X. Y. (2019). Hydrogen Sulfide as a Novel Regulatory Factor in Liver Health and Disease. Oxidative Medicine and Cellular Longevity, 2019, 3831713. 10.1155/2019/3831713 [DOI] [PMC free article] [PubMed] [Google Scholar]
- Zhang(a), Y. , Ma, W. , Zhang, Z. , Liu, F. , Wang, J. , Yin, Y. , & Wang, Z. (2019). Effects of Enterococcus faecalis on egg production, egg quality and caecal microbiota of hens during the late laying period. Archives of Animal Nutrition, 73(3), 208–221. 10.1080/1745039X.2019.1591128 [DOI] [PubMed] [Google Scholar]
- Zhang(b), W. , Ma, C. , Xie, P. , Zhu, Q. , Wang, X. , Yin, Y. , & Kong, X. (2019). Gut microbiota of newborn piglets with intrauterine growth restriction have lower diversity and different taxonomic abundances. Journal of Applied Microbiology, 127(2), 354–369. 10.1111/jam.14304 [DOI] [PMC free article] [PubMed] [Google Scholar]


