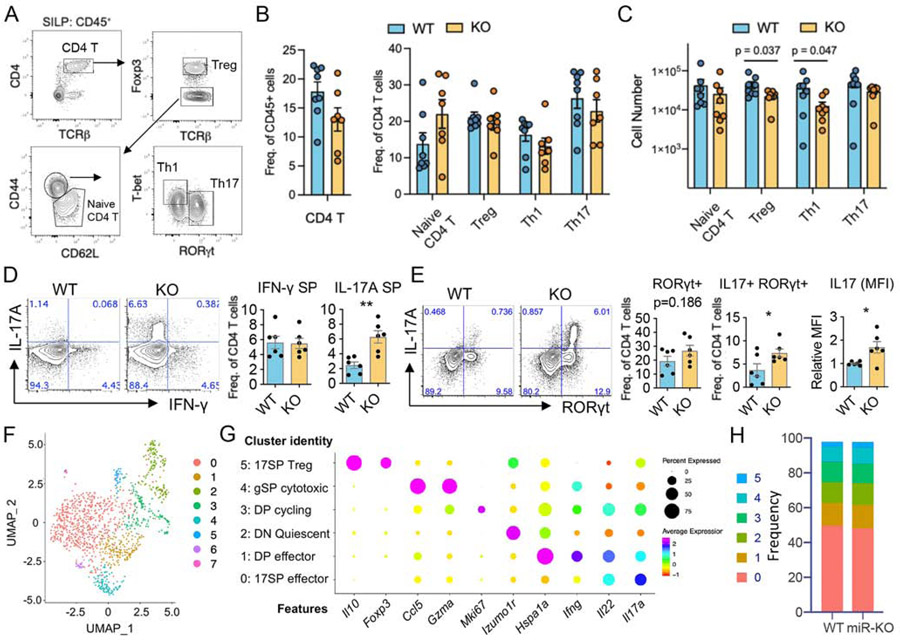
Figure 3. Loss of miR-221 and miR-222 enhances IL-17 production in activated intestinal CD4+ T cells.
(A-E) Lymphocytes were isolated from the small intestine of healthy WT and miR-221/222-KO mice and analysed by FACS. (A) Representative FACS plots show T helper subsets defined as naïve, Treg, Th1 and Th17. (B-C) Pooled data comparing the frequencies (B) and cell number (C) of T helper subsets between WT (n=8) and miR-221/222-KO (n=7) according to A. (D) Proportion of CD4+ T cells expressing IL-17a and IFN-γ following PMA-I stimulation. (E) Proportion of CD4+ T cells expressing RORγt and IL-17a after PMA-I stimulation. (B-E) Data are represented as mean with SEM. Plots are pooled from 6-8 mice/group from at least 3 independent experiments. (**p<0.01; Student’s t-test) (F-I) Il17-gfp+ cells from the small intestine of healthy WT and miR-221/222-KO mice were used for scRNA-seq (see Fig. S3A for gating strategy). (F) UMAP plot depicts 8 clusters separated in an unbiased manner. The clusters 6 and 7 contained less than 10 cells of unknown origin and removed from further analysis. (G) Dot plot shows the expression of representative marker genes to define cluster identities. (H) Stacked bar plots depict the frequency of each cluster between WT and miR-221/222-KO mice.

