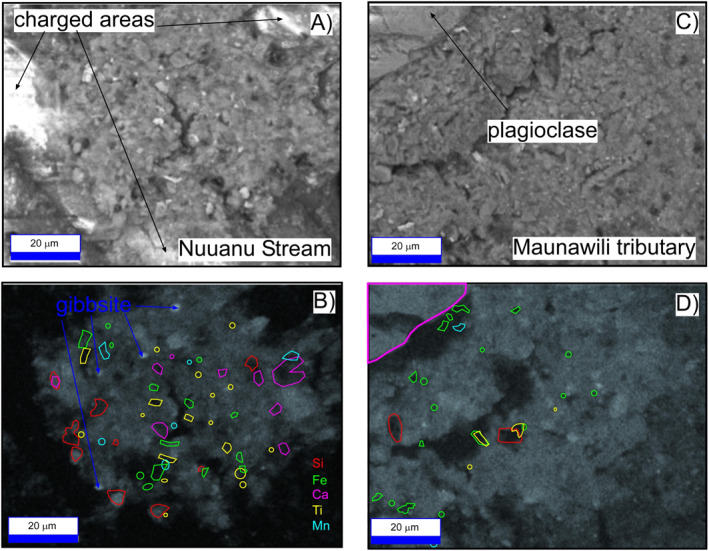
Figure 8.

Back‐scatter electron (A and B) for samples from the Kalihi Stream, Oahu, and Maunawili tributary stream, respectively. (C and D) Are Al X‐ray maps corresponding to the samples above them. Polygons represent areas of high concentration for the elements indicated as determined from X‐ray maps not shown. See text for discussion.
