

Cryo-EM structure of TFIIK provides insight into CTD phosphorylation of RNA polymerase II in the preinitiation-Mediator complex.
Abstract
During transcription initiation, the general transcription factor TFIIH marks RNA polymerase II by phosphorylating Ser5 of the carboxyl-terminal domain (CTD) of Rpb1, which is followed by extensive modifications coupled to transcription elongation, mRNA processing, and histone dynamics. We have determined a 3.5-Å resolution cryo–electron microscopy (cryo-EM) structure of the TFIIH kinase module (TFIIK in yeast), which is composed of Kin28, Ccl1, and Tfb3, yeast homologs of CDK7, cyclin H, and MAT1, respectively. The carboxyl-terminal region of Tfb3 was lying at the edge of catalytic cleft of Kin28, where a conserved Tfb3 helix served to stabilize the activation loop in its active conformation. By combining the structure of TFIIK with the previous cryo-EM structure of the preinitiation complex, we extend the previously proposed model of the CTD path to the active site of TFIIK.
INTRODUCTION
The C-terminal domain (CTD) of the largest subunit (Rpb1) of RNA polymerase II (pol II) is composed of 26 and 52 repeats of the consensus sequence of Y1S2P3T4S5P6S7 in yeast and human, respectively, and is subjected to extensive posttranslational modifications during transcription, which serves as a platform for binding of transcription factors, mRNA processing factors, and histone modifiers (1–3).
CTD modifications begin with phosphorylation on the fifth residue of the consensus repeat (Ser5) during transcription initiation by TFIIH, the 10-subunit general transcription factor (4–9). Whereas this CTD phosphorylation depends on the three-subunit kinase module (called TFIIK in yeast), composed of Kin28, Ccl1, and Tfb3, yeast homologs of cyclin-dependent kinase 7 (CDK7), cyclin H, and MAT1, respectively (10–13), CTD phosphorylation levels are substantially enhanced in the preinitiation complex (PIC) containing pol II and all five general transcription factors (8, 14), and, to a greater extent, in PIC-Mediator (15, 16). The enhanced CTD phosphorylation can be reconstituted in vitro when a CTD peptide is combined with TFIIK and Mediator (17), suggesting functional and physical interactions between Mediator and TFIIK (18). Consistent with biochemical studies, recent cryo–electron microscopy (cryo-EM) structures of PIC-Mediator localized the position of TFIIK in contact with the Mediator head module (19, 20) and suggested the path of CTD from pol II, although the Mediator head module, to TFIIK (19). However, the structure of TFIIK remained to be determined, due to its local mobility.
In contrast to CDKs for the cell cycle, such as CDK2, CDKs for transcription, such as CDK7 in TFIIH, CDK8 in Mediator, and CDK9 in positive transcription elongation factor b (P-TEFb), have subunit(s) or cofactor(s) that activate respective cyclin kinases during distinct steps of transcription (21). In the case of CDK7 (Kin28 in yeast), previous biochemical studies suggest that Tfb3 binds a Kin28-Ccl1 dimer and activates the kinase activity through its C-terminal region, while the N-terminal region of Tfb3, containing the Ring domain, serves to tether TFIIK to the rest of TFIIH (core TFIIH) (22).
Here, we have determined a structure of TFIIK using cryo-EM and chemical cross-linking and mass spectrometry (XL-MS). The C-terminal 62 residues of Tfb3 were identifiable, lying along the interface between Kin28 and Ccl1, stabilizing the activation loop (T-loop) in its catalytically active form. By docking the structure of TFIIK into the previous cryo-EM map of PIC-Mediator, we now localize the active site of TFIIK in PIC-Mediator and thus extend the previously proposed model of the CTD path on the Mediator head module to the active site of TFIIK.
RESULTS
Cryo-EM structure determination of TFIIK
Active TFIIK, with a phosphorylated Thr162 in the activation loop, was isolated from yeast through a TAP tag on the Tfb3 subunit, which is capable of pol II CTD phosphorylation, as previously published (fig. S1, A and B) (23). TFIIK was incubated with 10-fold molar excess CTD peptide and nonhydrolyzable analog of adenosine triphosphate (ATP) [adenosine diphosphate-aluminum fluoride-stabilized (ADP-AIF3)] and was vitrified by plunge freezing. We imaged ~3 million particles, with a Titan Krios equipped with a K3 direct electron detector (fig. S1C). Reference-free two-dimensional (2D) class averaging with cryoSPARC (24) yielded a set of homogeneous classes, with clearly visible secondary structures (fig. S1D). Approximately 1 million images selected through the 2D class averaging were subjected to ab initio calculation of initial maps and following iterative 3D classifications with Relion (25). TFIIK particles (~130,000) selected from these classifications were processed with 3D autorefinement, CTF refinement, and Bayesian polishing routines in Relion at a nominal resolution of 3.64 Å (fig. S1, I, K, and L), referred to as Map 2 (table S1). While Map 2 showed the well-defined features of the cyclin kinase ascribable to Kin28-Ccl1 and flanking density attributable to the C-terminal region of Tfb3 (Fig. 1, A and B), another run of 3D classification was performed using a mask excluding flexible HN3–4 helices of Ccl1 (fig. S1H) to further improve map quality for model building (Fig. 1A). In this 3.5-Å-resolution map of the core TFIIK, referred to as Map 1 (table S1 and fig. S1, E to G), many side chains were clearly visible (Fig. 1, C to E), allowing us to build an atomic model, aided by homology models of Kin28 and Ccl1 constructed from the published crystal structures of CDK7 (26) and cyclin H (27). The Kin28/Ccl1/Tfb3 model was iteratively refined against the cryo-EM map using real-space refinement in Phenix and Coot with good refinement statistics (table S1). The resulting model contained Kin28 (296 of 306 residues), Ccl1 (287 of 393 residues), and the C-terminal 62 residues of Tfb3 (residues 259 to 320) (Fig. 1, A and B to F). The other regions were not built because of missing or poor densities. The density corresponding to ADP-AlF3 was observed in the ATP-binding site of Kin28, whereas there was no density attributable to the CTD peptide in the substrate catalytic site (Fig. 1, A and B).
Fig. 1. Cryo-EM structure of TFIIK.
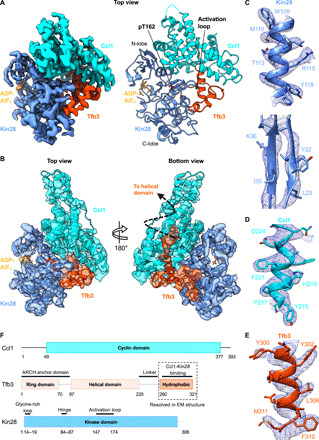
(A) Left: Cryo-EM map of the core yeast TFIIK at 3.5 Å shows clear density for each subunit: Kin28 (blue), Ccl1 (cyan), and Tfb3 (orange) with density colored by subunits indicated. Right: Structural model of TFIIK with subunits colored as indicated. Activation loop, ADP-AlF3, and phosphorylated Thr162 annotated. (B) Cryo-EM map and fit structural model of yeast TFIIK at 3.64-Å resolution, including HN3 and HN4 helices of Ccl1. (C to E) EM density with side chains of Kin28 (C), Ccl1 (D), and Tfb3 (E). (F) Schematic diagram of domains of TFIIK subunits. The Ring domain and helical domain of Tfb3 are not resolved in the EM map.
Cross-linking and mass spectrometry of TFIIK
The structure of TFIIK determined by cryo-EM was validated by chemical XL-MS (Fig. 2A). Endogenously purified holo-TFIIH (23) containing core-TFIIH subunits (Ssl2, Rad3, Tfb1, Tfb2, Ssl1, Tfb4, and Tfb5) and TFIIK was reacted with MS-cleavable cross-linker disuccinimidyl dibutyric urea (DSBU) (28), and the cross-linked peptides were acquired by MS and analyzed by the search engine, MeroX (29). To obtain cross-links of high confidence, identifications with a false discovery rate (FDR) of 1% or lower were retained. We obtained a total of 635 cross-links, comprising 564 within core TFIIH, 43 within TFIIK, and 28 between core TFIIH and TFIIK. Of the 43 cross-links identified in TFIIK, 12 cross-links could be directly compared with corresponding residues in the model (the other 31 were on flexible loops or on the N-terminal portion of Tfb3 and not modeled), and all cross-links were consistent with our model (Cα-Cα distances less than 25 Å) (Fig. 2, A to C, and fig. S2B), which are in good agreement with previous studies using bis(sulfosuccinimidyl)suberate/disuccinimidyl suberate with similar spacer arm length (30–32).
Fig. 2. TFIIH holo-enzyme cross-linking mass spectrometry.
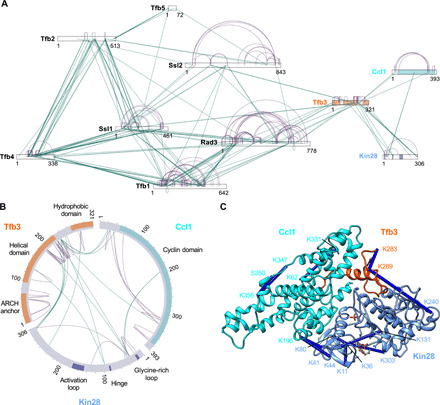
(A) Six hundred thirty-five nonredundant cross-links identified for holo-TFIIH containing TFIIK and core TFIIH components (Ssl2, Rad3, Tfb1, Tfb2, Ssl1, Tfb4, and Tfb5) as a network plot. Intrasubunit cross-links are shown in purple, and interprotein cross-links are shown in green. (B) Circle plot of TFIIK-specific cross-links. (C) Cross-links mapped on the structure of TFIIK, with all cross-links (blue) consistent with a cutoff of 25 Å, well below the 40-Å upper limit.
Overall structure of TFIIK
In TFIIK, Kin28 [root mean square deviation (RMSD) of ~5.7 Å with CDK7 [Protein Data Bank (PDB): 1UA2] across 278 residue pairs], and Ccl1 [RMSD of ~5.0 Å with cyclin H (PDB: 1KXU) across 224 residue pairs] form a canonical CDK-cyclin complex (Fig. 3A, and fig. S3, A and B) (33–35). Kin28 was phosphorylated at Thr162, stabilizing the activation loop in a conformation characteristic of active CDKs (Fig. 3, B and C). The X-DFG motif at the N terminus of the activation loop was in a “BLAminus” conformation, consistent with an active kinase (36). ADP-AlF3 was identified in the catalytic cleft between the two lobes of Kin28 (Fig. 3A and fig. S3A) in Map 2. Ccl1 contains two canonical cyclin boxes (fig. S3B), each consisting of five helices (H1 to H5 and H1′ to H5′) and four extra N-terminal α helices [HN1 (residues 48 to 54), HN2 (residues 62 to 73), HN3 (residues 77 to 82), and HN4 (residues 95 to 105)]. The first cyclin (N-terminal) box primarily interacts with Kin28, while the second (C-terminal) cyclin box and two N-terminal α helices (HN1 and HN2) interact with Tfb3 (Fig. 3A and fig. S3B).
Fig. 3. Activation mechanism of TFIIK.
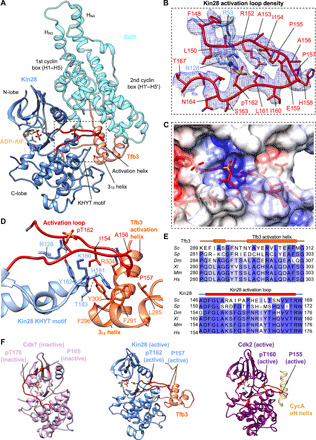
(A) Structural model of TFIIK activation. Kin28 (blue), Ccl1 (cyan), Tfb3 (orange), and the activation loop (red) are colored. (B) EM density of the activation loop with important activating residues. The phosphate group on Thr162 (pT162) is apparent as in other activated CDKs (30). (C) Electrostatic potential map of activation loop and surrounding residues show a conserved basic patch surrounding pT162, suggesting a similar activation mechanism conserved through CDKs. (D) Activation of the Kin28 activation loop by the Tfb3 activation helix and the Kin28 KHYT motif. The Tfb3 activation helix makes direct contact with the activation loop via hydrogen bonding interaction between Tfb3 R304 and Kin28 backbone carbonyl and hydrophobic interaction between Tfb3 F296 and Kin28 P157. Tfb3 also binds the Kin28 KHYT motif (residues 180 to 183) by a hydrogen bonding networking including Tfb3 F291–Kin28 H181 and Tfb3 Y300–Kin28 T183. The KHYI motif also helps stabilize the activated activation loop by hydrogen boding interactions with Y182 and R128 and hydrophobic interaction between Y182 and L161. (E) Sequence alignment of Tfb3 activation loop (top) and Kin28 activation loop (bottom). Tfb3 activation helix is highly conserved from yeast to human. Kin28 activation loop is highly conserved though A156 is replaced with a serine/threonine in other eukaryotes for CAK regulation. (F) Structures of inactive human CDK7 (PDB: 1UA2) (pink, left), active yeast Kin28 (this study) (blue, middle), and active CDK2 (PDB: 1FIN) (purple, right). Inactive CDK7 has activation loop (red) covering the active site, while activated Kin28 and CDK2 moved the activation loop, which are stabilized by the Tfb3 activation helix and the CycA αN helix, respectively. The CycA αN helix is absent in Ccl1/cyclin H.
The C-terminal 62 residues (residues 259 to 320) of Tfb3 were identified at the interface between the C-lobe of Kin28 and the second cyclin box of Ccl1 (i.e., on the opposite side to the active site of Kin28) (Fig. 3A and fig. S3C). These residues do not form a hydrophobic core of their own but rather snake along a groove between Kin28 and the second cyclin box of Ccl1. Of the C-terminal 62 residues, its N-terminal (residues 271 to 285) and C-terminal (residues 313 to 320) regions primarily interact with the second cyclin box, HN1 and HN2 of Ccl1, as described above, while the central region of Tfb3 reaches into the active site of Kin28, where a short 310 helix (residues 289 to 292) is in contact with the KHYT motif of Kin28, and the following amphipathic helix (termed as Tfb3 activation helix, residues 299 to 309) is in contact with the activation loop (Fig. 3, A and D). Notably, this region containing two α helices is the most conserved part of Tfb3/MAT1 (Fig. 3E, top, and fig. S3C).
The active site of TFIIK
Activation loop phosphorylation and Tfb3 binding are both likely to be key determinants of TFIIK activation but are independent mechanisms: The salt bridges between phosphorylated Thr162 (pT162) and three Arginine residues (Arg53, Arg128, and Arg152) of Kin28 stabilize the flattened, active conformation of the activation loop on the KHYT motif of Kin28 as in other active CDKs (Fig. 3, B and C), while distinct residues (Ala156 and Pro157) located at the tip of the activation loop pack against the hydrophobic face of the Tfb3 activation helix (Tyr300, Ala301, Arg304, and Val305) and of the flanking short 310 helix (Phe296) (Fig. 3D). In other eukaryotes, Ala156 of the activation loop is replaced with Ser (or Thr) (Fig. 3E, bottom), and its phosphorylation marks negative regulation of transcription during mitosis (37). This hydrophobic interaction is stabilized by surrounding hydrogen bonds between the Kin28 KHYT motif (His181 and Thr183) and Tfb3 (Phe291 and Tyr300) (Fig. 3D). Also, a hydrogen bond between the main chain of the activation loop and Arg304 of Tfb3 most likely contributes to Tfb3 binding (Fig. 3D).
To locate the substrate binding site of TFIIK, the crystal structure of CDK2–cyclin A bound to a substrate peptide (PKTPKKA, the underlined phosphorylatable Thr defined as position +0 in the catalytic site) (PDB: 3QHR) (38) was aligned with the coordinates of TFIIK (RMSD of ~3.0 Å between CDK2–cyclin A and Kin28-Ccl1). The substrate peptide PKTPKKA could be replaced with one-repeat CTD peptide (PTSPSYS) without steric hindrance, while retaining Ser-Pro as CTD Ser5-Pro6 at positions +0 and +1. The model was then subjected to energy minimization in Rosetta with an acetyl group to the N terminus of the peptide and an N-methylamide to the C terminus to mimic its more extended form (Fig. 4 and fig. S4A). The resulting CTD peptide, Pro3-Thr4-Ser5-Pro6-Ser7-Tyr1-Ser2, formed stable hydrophobic interactions along the substrate binding site with Ser5 in the catalytic site at position +0 (Fig. 4 and fig. S4C): Similar to Cdk2, L150 and N164-T167 of Kin28 were positioned to make a suitable pocket for proline (Pro6) at position +1, while T167, the hydrophobic stem of R168, and W169 formed a hydrophobic pocket to accept proline (Pro3) at position −2. M49 of the STAIRE helix also packed against tyrosine (Tyr1) at position +3. By contrast, the side chains of Thr4, Ser7, and Ser2 at positions −1, +2, and +4, respectively, were free of contacts. This binding mode is in good agreement with a previous mutational study (39) showing requirement for Tyr1, Pro3, and Pro6 but not Ser2, Thr4, and Ser7 for Ser5 phosphorylation. When the CTD modeling was repeated by positioning Ser2, Ser7, or Thr4 in the catalytic site (fig. S4, D to F), hydrophobic residues, Pro3, Pro6, and Tyr1, were mostly free of contacts. For example, when Ser2 is at the active site, the residues in the hydrophobic sites occupied by the Pro3, Pro6, and Tyr1 in the Ser5 substrate peptide are replaced with Ser7, Pro3, and Ser5, respectively. Only Pro3 makes hydrophobic contacts with the kinase domain. When Thr4 is the substrate, there is no proline at position +1, and the Pro3, Pro6, and Tyr1 side chains are pointed away from the kinase domain. When Ser7 is the substrate, the side chain of Tyr1 is at the +1 position and points away from the hydrophobic site that binds the +1 Pro. Calculations with Rosetta of the ΔΔG of binding for the four peptides were not ordered as we expected. S5 was higher (less favorable) than S2, S7, and T4, although the distribution of the top 10 models overlapped significantly (fig. S4B) so we could not discriminate between potential Kin28 substrates (Ser2, Thr4, Ser5, and Ser7) from this modeling alone.
Fig. 4. Computational modeling of CTD peptide bound to Kin28.
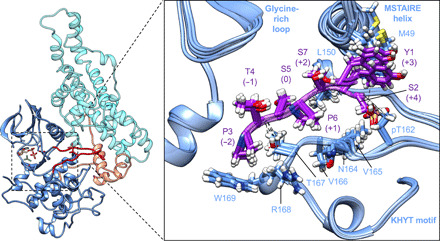
Rosetta model of one-repeat CTD peptide (PTSPSYS, the underlined phosphorylatable Ser5 at position +0 in the catalytic site) for Ser5 phosphorylation by TFIIK using human CDK2-substrate peptide complex (PDB: 3QHR) as a template. An ensemble of the five lowest-energy models is shown.
The structure of TFIIK in the PIC with Mediator
Previous cryo-EM structures of the PIC-Mediator localized TFIIK, but the structure of TFIIK was not determined because of its local mobility relative to the rest of the structure (19, 20). The structure of TFIIK was fitted into the corresponding density (20) in good agreement with XLs in the PIC (Fig. 5, A and B, and fig. S5C), except HN3 (residues 77 to 86) and HN4 (residues 94 to 111) of Ccl1, which are yeast specific and the most mobile part in the structure of TFIIK based on local resolution calculations (fig. S1I). The N- and C-lobes of Kin28 are in contact with the middle module’s hook and head module’s neck of Mediator (40–42), respectively (Fig. 5B), forming a tunnel that may direct the CTD (see below). The point of contact with the Mediator neck is the region of CDK7/Kin28 that differs the most from CDK2 (26), comprising αD-αE loop (Kin28 residues 95 to 105), and the Pro-rich C-terminal region (Kin28 residues 293 to 303). On the back side of TFIIK, Tfb3 was facing toward the ARCH anchor domains of Tfb3 (Fig. 5C). In between, Tfb3 linker region (residues 145 to 268) is likely disordered, but its localization was supported by previous XL-MS (Fig. 5, A and C) (19, 20).
Fig. 5. TFIIK in the preinitiation-Mediator complex.
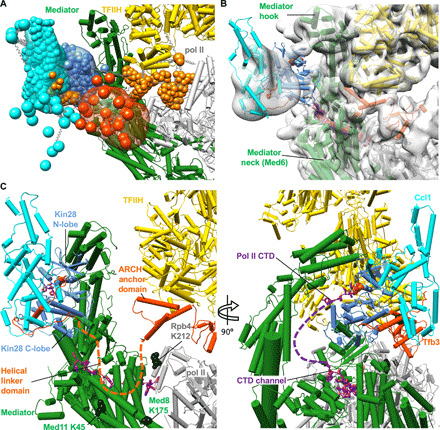
(A) Probability distributions [Kin28 in blue, Ccl1 in cyan, the C-terminal 62 residues of Tfb3 (residues 259 to 320) in orange, and the linker region of Tfb3 (residues 146 to 267) in orange red] generated by Integrative Modeling based on cryo-EM map and XL-MS. Kin28, Ccl1, and Tfb3 are represented by coarse-grained beads, with each bead corresponding to 1 and 5 amino acid residues for structured and unstructured regions. (B) Placement of the structure of TFIIK in previous cryo-EM map of PIC-Mediator (EMDB: 3850). Mediator (green), TFIIH (yellow) and pol II (gray) represented in cylinders. Pol II CTD (purple, PDB: 4GWQ) is located in close proximity (<40 Å) to TFIIK. (C) Close-up view on connection of TFIIK to PIC through Tfb3. Tfb3 is anchored to TFIIH by the Ring domain connected to Rad3. Placement of TFIIK near Mediator Med6/Med8 would likely require the unfolding of helical linker domain of Tfb3 (Fig. 1F), schematically depicted by the orange dashed line. Previous studies (19, 20) identified cross-links between Mediator/pol II subunits and the Tfb3 helical domain (Tfb3 K192–Med8 K173, Tfb3 K226–Rpb4 K212, Tfb3 K192–Med11 K45, and Tfb3 K226–Med8 K173) and Kin28–Ccl1 binding domain (Ccl1 K273–Med11 K45). Residues of pol II/Mediator in black spheres formed cross-links with the helical domain of Tfb3, which is extended (orange dashed line) in our IMP (integrated modeling platform)-based modeling.
There are some notable features of the tunnel formed by Mediator and TFIIK (Fig. 6). The tunnel lies in the path of the CTD where it emerges from the “CTD channel” (19) formed by the Mediator head and middle modules. The active site of TFIIK lies on the inner wall of the tunnel, so that CTD phosphorylation may be processive as it threads through the tunnel (5, 19). The ~25-residue segment of CTD bound to the Mediator head in the CTD channel (19, 43) is oriented for the delivery to the active site of TFIIK. When a seven-residue CTD (SPTSPSY) is modeled on TFIIK (Fig. 6, right), its N-terminal end is ~37 Å away from the C-terminal end of the CTD segment bound to the Mediator head and may be connected by simply extending ~13 residues. The ~37-Å spacing likely accommodates some irregularities of the CTD heptad repeats such as deletion or insertion of multiple residues.
Fig. 6. Model of TFIIK and CTD in the preinitiation-Mediator complex.
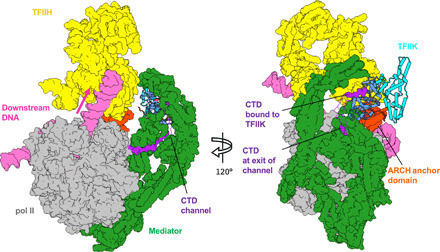
Proposed model of TFIIK in the PIC. The Mediator head module guides pol II CTD toward the active site of TFIIK. The C-terminal end of the 25-residue CTD segment (purple) bound to the Mediator head (39) coincides with the N-terminal end of the seven-residue CTD segment (purple) bound to TFIIK (this study). The two segments are connected by a ~14-residue linker (silhouette).
DISCUSSION
There is an extended family of CDKs in eukaryotes (21): While ancestral CDK family members function to regulate the cell cycle, some CDKs, such as CDK7, CDK8, and CDK9, have evolved to function in other cellular processes, most notably in transcription regulation. We have determined the structure of TFIIK, composed of Kin28 (the yeast ortholog of CDK7), Ccl1, and Tfb3, which is responsible for the CTD Ser5 phosphorylation during transcription initiation. In the structure, Kin28 and Ccl1 form a canonical CDK-cyclin complex. Tfb3 was identified on the back side of TFIIK, stabilizing the active form of the activation loop at the edge of the catalytic cleft and facilitating access of a substrate to the active site. When TFIIK is superimposed onto the CDK2–cyclin A complex, the Tfb3 activation helix is approximately in the position and orientation of the N-terminal helix (αN) of cyclin A (Fig. 3F and fig. S3, D and E). In some ancestral cell cycle CDKs, such as CDK2, the N-terminal helix of cyclin (e.g., cyclin A) directly stabilizes the activation loop (33). In contrast, in TFIIK, the equivalent N-terminal α helices (HN1 and HN2) of Ccl1/cyclin H interact with Tfb3/MAT1, which, in turn, stabilizes the activation loop (Fig. 3F and fig. S3, D and E). Thus, the activation loop stabilization through Tfb3/MAT1 may have been acquired during evolution of the transcriptional lineage of cyclins.
Nearly all CDKs phosphorylate their substrates at Ser (or Thr) residues with a strong sequence preference for Ser-Pro at positions +0 and +1 and weaker preferences for amino acids at other positions (38). We therefore asked how Kin28 (TFIIK) can distinguish between Ser5 and Ser2, both of which are followed by a proline in the CTD (39). Our in silico analysis suggests that residues Pro3, Pro6, and Tyr1 formed stable hydrophobic interactions at positions −2, +1, and +3, respectively, in the substrate binding site (Fig. 5), which is in good agreement with previous mutational study (39). Such hydrophobic interactions were not possible when the CTD modeling was repeated by positioning Ser2 at position +0 (fig. S4), which may explain its substrate specificity of Ser5 over Ser2.
Previous biochemical studies demonstrated that CTD phosphorylation levels are substantially enhanced in the presence of Mediator (15–17). In addition to the activation loop, Mediator contacts the αE and αI helices of Kin28/CDK7 as well as the Pro-rich C-terminal region, which is a long, structurally variable insertion in CMGC family kinases between the αG and αH helices (36). The Pro-rich region provides an additional recognition site and thus confers diverse substrate selection (26). In the mitogen-activated protein kinase p38 (44), the equivalent region, called the docking site, binds docking site recognition sequences and brings neighboring phosphorylatable regions closer to the catalytic site. In a similar manner, the Pro-rich region of Kin28/CDK7 serves as a docking site, which binds Mediator and thereby aligns the CTD path for delivery to its active site (Fig. 6). Moreover, the tunnel formed between the middle module’s hook and middle module’s neck of Mediator sterically confines the CTD path and thus further enhances the chance for CTD to access TFIIK. It may even facilitate processive CTD phosphorylation (5, 19) as it threads through the tunnel.
MATERIALS AND METHODS
Protein purification
TFIIK and holo-TFIIH were purified from yeast as previously described (23) with minor modifications. In short, yeast containing TAP tags on TFIIH subunits Tfb4 and Ssl2 was grown in 100 liters of YPAD (yeast extract, peptone, adenine, glucose) medium to an optical density (OD) of 10.0. Whole cell lysate was prepared by bead beating in buffer A [50 mM Hepes (pH 7.6), 1 mM EDTA, 5% glycerol, 400 mM potassium acetate, 2-mercaptoethanol, and protease inhibitors]. Following the addition of 100 mM ammonium sulfate and 0.1% polyethyleneimine (PEI), lysed cells were stirred for 1 hour and centrifuged, and then the cleared lysate was loaded onto an immunoglobulin G (IgG) column. The column was washed with 5 to 10 column volumes of buffer 300 [50 mM Hepes (pH 7.6), 1 mM EDTA, 5% glycerol, 300 mM potassium acetate, 2 mM dithiothreitol (DTT), and protease inhibitors] and then resuspended in buffer 300 and allowed to settle. IgG beads were washed by batch with another 10 column volumes of buffer 300. TFIIH was treated with tobacco etch virus in buffer 300, eluted from the IgG column, and loaded onto a UnoQ column (Bio-Rad). TFIIH was eluted by salt gradient of concentration from 300 mM to 1.2 M potassium acetate. Fractions containing different TFIIH subunits were separated and concentrated separately.
Cryo-EM sample preparation and data collection
To prepare cryo-EM grids, purified TFIIK (final concentration, 0.08 mg/ml) was incubated with 10-fold molar excess CTD peptide (three-repeat CTD peptide) and 2.5 mM ADP-AlF3 for 30 min in buffer 100 [20 mM Hepes (pH 7.5), 100 mM potassium acetate, and 2 mM DTT]. The sample (2 μl) was then applied to glow-discharged (1 min; easiGlow, Pelco) R1.2/1.3 200-mesh or R2/2 300-mesh QUANTIFOIL holey carbon grids (Electron Microscopy Sciences). The grids were subsequently blotted for 2 s using Whatman grade 41 filter paper (Sigma-Aldrich) and flash-frozen in liquid ethane with a Leica EM CPC manual plunger (Leica Microsystems). EM grids were prepared in batches, and the freezing conditions were optimized by screening on a FEI TF20 microscope operating at 200 kV and equipped with a FEI Falcon III direct electron detection camera at the Electron Microscopy Research Lab (University of Pennsylvania).
Cryo-EM specimens were imaged at the Beckman Center for Cryo-Electron Microscopy (University of Pennsylvania) using a FEI Titan Krios G3i transmission electron microscope operating at 300 kV, equipped with a K3 direct electron detector (Gatan) and a Bioquantum energy quantum filter (Gatan) and at a nominal magnification of ×105,000 in super-resolution mode (pixel size of 0.415 Å) at a defocus range between 0.8 and 2.8 μm. A total of 4620 images was collected over the course of 2 days. The exposure time was 2.24 s, divided into 35 frames, at a nominal dose of 45 electrons/Å2.
Image processing and 3D reconstruction
The cryo-EM data were processed, and maps were calculated with using a combination of software including cryoSPARC v2.12.4 (24) and Relion 3.0.8 (25). The TFIIK dataset was motion-corrected with MotionCorr2 (45) and then imported into cryoSPARC for CTF correction with CTFFIND4 (46). Blob-based picking with cryoSPARC was used to produce a small subset of particles for the generation of 2D references. A total of 3,288,475 particles were picked by template-based picking, and two rounds of reference-free 2D classification were performed to remove particles that lacked clear features (fig. S1D), resulting in a subset of 938,135 particles. This subset was then transferred to Relion 3.0.8 for initial model generation by stochastic gradient descent. The initial model was consistent with 2D class averages and could accommodate a cyclin kinase pair (fig. S1H).
This initial model was then used as a reference for multiple rounds of 3D classification (fig. S1J). Last, two classes consisting of 129,955 particles were selected and combined in 3D autorefinement yielding a map of 4.2 Å. The data were further processed by iterating rounds of Beamtilt estimation and Bayesian polishing, yielding a final map of 3.64-Å resolution (fig. S1G). 3D variability analysis was conducted in cryoSPARC showing motion and heterogeneity in the HN3 and HN4 helices (fig. S1M).
CryoEF (47) was used to evaluate the orientation distribution and anisotropic effects using a particle size of 100 Å (fig. S1K). As determined by cryoEF, Map 2 (EOD = 0.69) showed slight anisotropy. To decrease anisotropy and improve the map quality, a further run of 3D classification was performed masking out the flexible HN3 and HN4 helices (fig. S1H). A good class of 81,446 particles was obtained, and subsequent refinement in Relion, as outlined above, yielded a final map of 3.5-Å resolution (fig. S1G). Repeated cryoEF analysis using these particles showed an improved orientation distribution (fig. S1F), and the EOD was increased to 0.71. Maps were postprocessed independently with deepEMhancer (48) and Relion and both were deposited. The local resolution of the maps was determined using Fourier shell correlation (cutoff of 0.5) with blocres (49) (fig. S1, E and I).
Model building and refinement
To build the atomic model of Kin28/Ccl1/Tfb3, we started by rigid-body fitting crystal structures of human CDK7 (PDB: 1UA2) (26) and cyclin H (PDB: 1KXU) (50) into the cryo-EM map using UCSF Chimera (51), which showed an apparent continuous density corresponding to the Tfb3 subunit (fig. S3F). Because of slight sequence variations in Kin28 and Ccl1 between yeast and human, sequence alignments, secondary structure predictions, and homology modeling were used to facilitate the model building. In Kin28, a phosphate group was added to the side chain of Thr162 due to phosphorylation, and the ADP-AlF3 was placed into the density at the ATP-binding site. There was no observable density for the CTD peptide. The density map, corresponding to the Tfb3 subunit, was of sufficient quality for ab initio model building. Residues (259 to 320) in the C-terminal region of the Tfb3 were modeled into the density map. The remaining portion of Tfb3 was missing or disordered in the density map. The model building and adjustments were done using Coot (fig. S3, G and H) (52). Refinement of the Kin28/Ccl1/Tfb3 model against the cryo-EM map was carried out using the real space refinement in Phenix (53). In the final model, amino acids for Kin28 (26 to 31, 42 to 43, and 304 to 306) and Ccl1 (1 to 46, 288 to 325, and 371 to 393) were not built because of missing or poor densities. The final model statistics are shown in table S1.
Cross-linking mass spectrometry sample preparation
One hundred fifty micrograms of purified holo-TFIIH at a concentration of 1 mg/ml in buffer 300 [20 mM Hepes (pH 7.6), 300 mM potassium acetate, 5% glycerol, and 2 mM DTT] was mixed with 6 mM DSBU (Thermo Fisher Scientific) and incubated on ice for 2 hours. The reaction was quenched by adding 50 mM ammonium bicarbonate, and the reaction was further stopped by trichloroacetic acid (TCA) precipitation. Cross-linked proteins were precipitated with 20% (w/v) TCA (Sigma-Aldrich) on ice for 90 min. Proteins were pelleted by centrifugation at 21,000g for 15 min and washed with 10% TCA in 0.1 M tris-HCl and then with acetone (Thermo Fisher Scientific). The solvent was discarded, the pellet was air-dried and then stored at −80°C for analysis by MS.
Cross-linked proteins were resuspended in 50 μl of resuspension buffer (2.5% SDS and 50 mM triethylammonium bicarbonate final concentrations) and reduced with final 10 mM DTT (US Biological) for 30 min at 30°C, followed by alkylation with final 50 mM iodoacetamide (Sigma-Aldrich) for 30 min at 30°C. The proteins were processed using an S-Trap column according to the protocol recommended by the supplier (Protifi, C02-mini) and digested with trypsin (Thermo Fisher Scientific) in 1:10 (w/w) enzyme/protein ratio for 1 hour at 47°C. Peptides eluted from this column were vacuum-dried and resuspended with the peptide fractionation-elution buffer [70% (v/v) liquid chromatography–MS (LC-MS) grade water (Thermo Fisher Scientific), 30% (v/v) acetonitrile (Thermo Fisher Scientific), and 0.1% (v/v) trifluoroacetic acid (TFA; Thermo Fisher Scientific)]. Peptides were first fractionated using AKTA Pure 25 with Superdex 30 Increase 3.2/300 (GE Life Sciences) at a flow rate of 30 μl min−1 of the elution buffer, and 100-μl fractions were collected. On the basis of the elution profile, fractions containing enriched cross-linked peptides of higher molecular masses were vacuum-dried and resuspended with LC-MS grade water containing 0.1% (v/v) TFA for MS analysis. One-half of each fraction was analyzed by a Q-Exactive HF mass spectrometer (Thermo Fisher Scientific) coupled to a Dionex Ultimate 3000 UHPLC system (Thermo Fisher Scientific) equipped with an in-house–made 15-cm-long fused silica capillary column (75 μm inner diameter), packed with reversed-phase ReproSil-Pur C18-AQ 2.4-μm resin (Dr. Maisch GmbH, Ammerbuch, Germany) column. Elution was performed using a gradient from 5 to 45% B (90 min), followed by 90% B (5 min), and reequilibration from 90 to 5% B (5 min) with a flow rate of 400 nl/min (mobile phase A: water with 0.1% formic acid; mobile phase B: 80% acetonitrile with 0.1% formic acid). Data were acquired in data-dependent tandem MS (MS/MS) mode. Full-scan MS settings were as follows: mass range, 300 to 1800 (mass/charge ratio); resolution, 120,000; MS1 AGC target 1E6; MS1 Maximum IT, 200 ms. MS/MS settings were as follows: resolution, 30,000; AGC target 2E5; MS2 Maximum IT, 300 ms; fragmentation was enforced by higher-energy collisional dissociation with stepped collision energy of 25, 27, 30; loop count, top 12; isolation window, 1.5 m/z; fixed first mass, 130; MS2 Minimum AGC target, 800; charge exclusion: unassigned, 1, 2, 3, 8 and > 8; peptide match, off; exclude isotope, on; dynamic exclusion, 45 s. Raw files were converted to mgf format with TurboRawToMGF 2.0.8 (54).
Cross-linked peptide search
Search engine MeroX 2.0.1.4 (29) was used to identify and validate cross-linked peptides. MeroX was run in RISEUP mode, with default cross-linker mass and fragmentation parameters for DSBU: precursor mass range, 1000 to 10,000 Da; minimum precursor charge, 4; precursor and fragment ion precisions, 5.0 and 10.0 ppm, respectively; maximum number of missed cleavages, 3; carbamidomethylation of cysteine and oxidation of methionine, as fixed and variable modifications, respectively; results were filtered for score (>10) and FDR (<1%). Visualization of the cross-links on the TFIIK structure used Chimera with the Xlink Analyzer plug-in (55).
Modeling of CTD on TFIIK
The crystal structure of CDK2–cyclin A bound to a substrate peptide (PKTPKKA, the underlined phosphorylatable Thr defined as position +0 in the catalytic site) (PDB: 3QHR) (56) was aligned with TFIIK. Then, the side chains of the seven-residue segment of the CTD (sequence PTSPSYS) with S5 at the active site were replaced with the most common rotamer of each residue given the backbone conformation of the peptide according to the backbone-dependent rotamer library (57). The peptide was modified on the N and C terminus by adding acetyl and N-methyl amide groups, respectively, to mimic an extended peptide sequence. The structure of the Kin28/peptide complex was refined with 50 independent trials of the FastRelax algorithm in Rosetta (58). The ΔΔG of binding was estimated by performing the same refinement procedure on the Kin28 kinase domain alone and the peptide separated from the kinase domain and calculating the difference in Rosetta energy: ΔΔG = E(complex) − E(kinase alone) − E(peptide alone). The same procedure was repeated for the S2 (sequence SYSPTSP), T4 (SPTSPSY), and S7 (SPSYSPT) phosphorylation sites of the CTD. The five lowest scoring (ΔΔG) refined models for each peptide sequence in complex with Kin28 was selected for molecular visualization.
Kinase assay
Pol II (4 pmol) was treated with 3 pmol of TFIIK in 20 mM Hepes (pH 7.6), 2.5 mM magnesium acetate, 100 mM potassium acetate, 5 mM DTT, 5% glycerol, and 5 mM ATP for 1 hour at room temperature. Reactions were stopped by adding EDTA. Phosphorylated and unphosphorylated pol II were analyzed by running a 6% SDS–polyacrylamide gel electrophoresis gel for 2 hours at 120 V (fig. S1B).
Integrative modeling of TFIIK in Mediator-PIC
Integrative modeling (59) of TFIIK on core Mediator-PIC was performed on the basis of a previously described approach (19), with minor modifications, using a Cryo-EM map for the core Mediator-bound transcription PIC at 5.8-Å resolution (EMDB-3850) (20) and two cross-link datasets (19). The TFIIK trimer and the core Mediator-PIC were treated as two rigid bodies, modeled at a residue level where possible and represented by flexible coarse-grained beads encompassing 5 to 40 amino acids elsewhere, as specified in a model topology file. A scoring function considering satisfaction of the EM volume, cross-linking dataset pairwise distance restraints, sequence connectivity, and nonoverlapping volumes was used in two separate simulations, producing 320,000 models from 160 initial configurations each. From the top-scoring 500 models of each simulation (fig. S5A), a single structural cluster was determined, positioning the TFIIK structure at an overall sampling precision of ~9 Å (fig. S5, B and C).
Acknowledgments
We would like to acknowledge the use of instruments at the Electron Microscopy Resource Lab and at the Beckman Center for Cryo-Electron Microscopy at the University of Pennsylvania Perelman School of Medicine. We also thank D. Johnson-McDaniel for assistance with Krios microscope operation. Funding: This research was supported by NIH grants R01-GM123233 to K.M. and CA196539 and AG031862 to B.A.G. and the Cancer Prevention Research Institute of Texas, grant number 13127, to CPRIT Scholar in Cancer Research, K.-L.T.; NIH training grants T32-GM008275 to T.v.E and T32-GM071339 to H.J.K. and the National Science Foundation Graduate Research Fellowship UDGE-1845298 to J.J.G.C.; NIH grant R35 GM122517 to R.L.D. and P30 CA006927 to the Fox Chase Cancer Center (in support of the Molecular Modeling Facility at Fox Chase). Computational resources were supported by NIH Project Grant S10OD023592. Author contributions: T.v.E., K.-L.T., and K.M. designed the experiments. T.v.E prepared cryo-EM samples and analyzed the data. H.J.K. and B.A.G. performed XL-MS. J.J.G.C., K.-L.T., and T.L. built models. R.L.D. and M.I.P. performed the molecular modeling of Kin28/substrate interactions. T.v.E., K.-L.T., and K.M. wrote the paper and prepared the figures for publication. Competing interests: The authors declare that they have no competing interests. Data and materials availability: All data needed to evaluate the conclusions in the paper are present in the paper and/or the Supplementary Materials. Additional data related to this paper may be requested from the authors. The cryo-EM density maps were deposited in the Electron Microscopy Data Bank (EMDB-23036,22191). The atomic coordinates were deposited in the Protein Data Bank (accession codes: 7KUE and 6XI8). The cross-linking data were deposited in the PRIDE repository and available at PXD021211. IMP files and Rosetta models are available at the Murakami Lab GitHub repository: https://github.com/cryomurakami/Structure_of_TFIIK_for_phosphorylation_of_CTD_of_RNA_polymerase_II.
SUPPLEMENTARY MATERIALS
Supplementary material for this article is available at http://advances.sciencemag.org/cgi/content/full/7/15/eabd4420/DC1
REFERENCES AND NOTES
- 1.Hsin J. P., Manley J. L., The RNA polymerase II CTD coordinates transcription and RNA processing. Genes Dev. 26, 2119–2137 (2012). [DOI] [PMC free article] [PubMed] [Google Scholar]
- 2.Buratowski S., Progression through the RNA polymerase II CTD cycle. Mol. Cell 36, 541–546 (2009). [DOI] [PMC free article] [PubMed] [Google Scholar]
- 3.Phatnani H. P., Greenleaf A. L., Phosphorylation and functions of the RNA polymerase II CTD. Genes Dev. 20, 2922–2936 (2006). [DOI] [PubMed] [Google Scholar]
- 4.Shiekhattar R., Mermelstein F., Fisher R. P., Drapkin R., Dynlacht B., Wessling H. C., Morgan D. O., Reinberg D., Cdk-activating kinase complex is a component of human transcription factor TFIIH. Nature 374, 283–287 (1995). [DOI] [PubMed] [Google Scholar]
- 5.Feaver W. J., Gileadi O., Li Y., Kornberg R. D., CTD kinase associated with yeast RNA polymerase II initiation factor b. Cell 67, 1223–1230 (1991). [DOI] [PubMed] [Google Scholar]
- 6.Roy R., Adamczewski J. P., Seroz T., Vermeulen W., Tassan J. P., Schaeffer L., Nigg E. A., Hoeijmakers J. H. J., Egly J. M., The MO15 cell cycle kinase is associated with the TFIIH transcription-DNA repair factor. Cell 79, 1093–1101 (1994). [DOI] [PubMed] [Google Scholar]
- 7.Lu H., Zawel L., Fisher L., Egly J. M., Reinberg D., Human general transcription factor IIH phosphorylates the C-terminal domain of RNA polymerase II. Nature 358, 641–645 (1992). [DOI] [PubMed] [Google Scholar]
- 8.Serizawa H., Conaway J. W., Conaway R. C., Phosphorylation of C-terminal domain of RNA polymerase II is not required in basal transcription. Nature 363, 371–374 (1993). [DOI] [PubMed] [Google Scholar]
- 9.Serizawa H., Mäkelä T. P., Conaway J. W., Conaway R. C., Weinberg R. A., Young R. A., Association of Cdk-activating kinase subunits with transcription factor TFIIH. Nature 374, 280–282 (1995). [DOI] [PubMed] [Google Scholar]
- 10.Feaver W. J., Svejstrup J. Q., Henry N. L., Kornberg R. D., Relationship of CDK-activating kinase and RNA polymerase II CTD kinase TFIIH/TFIIK. Cell 79, 1103–1109 (1994). [DOI] [PubMed] [Google Scholar]
- 11.Keogh M. C., Cho E. J., Podolny V., Buratowski S., Kin28 is found within TFIIH and a Kin28-Ccl1-Tfb3 trimer complex with differential sensitivities to T-loop phosphorylation. Mol. Cell. Biol. 22, 1288–1297 (2002). [DOI] [PMC free article] [PubMed] [Google Scholar]
- 12.Drapkin R., Le Roy G., Cho H., Akoulitchev S., Reinberg D., Human cyclin-dependent kinase-activating kinase exists in three distinct complexes. Proc. Natl. Acad. Sci. U.S.A. 93, 6488–6493 (1996). [DOI] [PMC free article] [PubMed] [Google Scholar]
- 13.Fisher R. P., Jin P., Chamberlin H. M., Morgan D. O., Alternative mechanisms of CAK assembly require an assembly factor or an activating kinase. Cell 83, 47–57 (1995). [DOI] [PubMed] [Google Scholar]
- 14.Yankulov K. Y., Bentley D. L., Regulation of CDK7 substrate specificity by MAT1 and TFIIH. EMBO J. 16, 1638–1646 (1997). [DOI] [PMC free article] [PubMed] [Google Scholar]
- 15.Kim Y. J., Bjorklund S., Li Y., Sayre M. H., Kornberg R. D., A multiprotein mediator of transcriptional activation and its interaction with the C-terminal repeat domain of RNA polymerase II. Cell 77, 599–608 (1994). [DOI] [PubMed] [Google Scholar]
- 16.Myers L. C., Gustafsson C. M., Bushnell D. A., Lui M., Erdjument-Bromage H., Tempst P., Kornberg R. D., The Med proteins of yeast and their function through the RNA polymerase II carboxy-terminal domain. Genes Dev. 12, 45–54 (1998). [DOI] [PMC free article] [PubMed] [Google Scholar]
- 17.Guidi B. W., Bjornsdottir G., Hopkins D. C., Lacomis L., Erdjument-Bromage H., Tempst P., Myers L. C., Mutual targeting of mediator and the TFIIH kinase Kin28. J. Biol. Chem. 279, 29114–29120 (2004). [DOI] [PubMed] [Google Scholar]
- 18.Svejstrup J. Q., Li Y., Fellows J., Gnatt A., Bjorklund S., Kornberg R. D., Evidence for a mediator cycle at the initiation of transcription. Proc. Natl. Acad. Sci. U.S.A. 94, 6075–6078 (1997). [DOI] [PMC free article] [PubMed] [Google Scholar]
- 19.Robinson P. J., Trnka M. J., Bushnell D. A., Davis R. E., Mattei P.-J., Burlingame A. L., Kornberg R. D., Structure of a complete mediator-RNA polymerase II pre-initiation complex. Cell 166, 1411–1422.e16 (2016). [DOI] [PMC free article] [PubMed] [Google Scholar]
- 20.Schilbach S., Hantsche M., Tegunov D., Dienemann C., Wigge C., Urlaub H., Cramer P., Structures of transcription pre-initiation complex with TFIIH and Mediator. Nature 551, 204–209 (2017). [DOI] [PMC free article] [PubMed] [Google Scholar]
- 21.Fisher R. P., Secrets of a double agent: CDK7 in cell-cycle control and transcription. J. Cell Sci. 118, 5171–5180 (2005). [DOI] [PubMed] [Google Scholar]
- 22.Busso D., Keriel A., Sandrock B., Poterszman A., Gileadi O., Egly J. M., Distinct regions of MAT1 regulate cdk7 kinase and TFIIH transcription activities. J. Biol. Chem. 275, 22815–22823 (2000). [DOI] [PubMed] [Google Scholar]
- 23.Murakami K., Gibbons B. J., Davis R. E., Nagai S., Liu X., Robinson P. J. J., Wu T., Kaplan C. D., Kornberg R. D., Tfb6, a previously unidentified subunit of the general transcription factor TFIIH, facilitates dissociation of Ssl2 helicase after transcription initiation. Proc. Natl. Acad. Sci. U.S.A. 109, 4816–4821 (2012). [DOI] [PMC free article] [PubMed] [Google Scholar]
- 24.Punjani A., Rubinstein J. L., Fleet D. J., Brubaker M. A., cryoSPARC: Algorithms for rapid unsupervised cryo-EM structure determination. Nat. Methods 14, 290–296 (2017). [DOI] [PubMed] [Google Scholar]
- 25.Scheres S. H., RELION: Implementation of a Bayesian approach to cryo-EM structure determination. J. Struct. Biol. 180, 519–530 (2012). [DOI] [PMC free article] [PubMed] [Google Scholar]
- 26.Lolli G., Lowe E. D., Brown N. R., Johnson L. N., The crystal structure of human CDK7 and its protein recognition properties. Structure 12, 2067–2079 (2004). [DOI] [PubMed] [Google Scholar]
- 27.Andersen G., Busso D., Poterszman A., Hwang J. R., Wurtz J. M., Ripp R., Thierry J. C., Egly J. M., Moras D., The structure of cyclin H: Common mode of kinase activation and specific features. EMBO J. 16, 958–967 (1997). [DOI] [PMC free article] [PubMed] [Google Scholar]
- 28.Hage C., Iacobucci C., Rehkamp A., Arlt C., Sinz A., The first zero-length mass spectrometry-cleavable cross-linker for protein structure analysis. Angew. Chem. Int. Ed. Engl. 56, 14551–14555 (2017). [DOI] [PubMed] [Google Scholar]
- 29.Iacobucci C., Götze M., Ihling C. H., Piotrowski C., Arlt C., Schäfer M., Hage C., Schmidt R., Sinz A., A cross-linking/mass spectrometry workflow based on MS-cleavable cross-linkers and the MeroX software for studying protein structures and protein-protein interactions. Nat. Protoc. 13, 2864–2889 (2018). [DOI] [PubMed] [Google Scholar]
- 30.Fritzsche R., Ihling C. H., Gotze M., Sinz A., Optimizing the enrichment of cross-linked products for mass spectrometric protein analysis. Rapid Commun. Mass Spectrom. 26, 653–658 (2012). [DOI] [PubMed] [Google Scholar]
- 31.Kalisman N., Adams C. M., Levitt M., Subunit order of eukaryotic TRiC/CCT chaperonin by cross-linking, mass spectrometry, and combinatorial homology modeling. Proc. Natl. Acad. Sci. U.S.A. 109, 2884–2889 (2012). [DOI] [PMC free article] [PubMed] [Google Scholar]
- 32.Hall Z., Schmidt C., Politis A., Uncovering the early assembly mechanism for amyloidogenic β2-microglobulin using cross-linking and native mass spectrometry. J. Biol. Chem. 291, 4626–4637 (2016). [DOI] [PMC free article] [PubMed] [Google Scholar]
- 33.Russo A. A., Jeffrey P. D., Pavletich N. P., Structural basis of cyclin-dependent kinase activation by phosphorylation. Nat. Struct. Biol. 3, 696–700 (1996). [DOI] [PubMed] [Google Scholar]
- 34.Schneider E. V., Böttcher J., Blaesse M., Neumann L., Huber R., Maskos K., The structure of CDK8/CycC implicates specificity in the CDK/cyclin family and reveals interaction with a deep pocket binder. J. Mol. Biol. 412, 251–266 (2011). [DOI] [PubMed] [Google Scholar]
- 35.Tahirov T. H., Babayeva N. D., Varzavand K., Cooper J. J., Sedore S. C., Price D. H., Crystal structure of HIV-1 Tat complexed with human P-TEFb. Nature 465, 747–751 (2010). [DOI] [PMC free article] [PubMed] [Google Scholar]
- 36.Modi V., Dunbrack R. L. Jr., Defining a new nomenclature for the structures of active and inactive kinases. Proc. Natl. Acad. Sci. U.S.A. 116, 6818–6827 (2019). [DOI] [PMC free article] [PubMed] [Google Scholar]
- 37.Akoulitchev S., Reinberg D., The molecular mechanism of mitotic inhibition of TFIIH is mediated by phosphorylation of CDK7. Genes Dev. 12, 3541–3550 (1998). [DOI] [PMC free article] [PubMed] [Google Scholar]
- 38.Cheng K. Y., Noble M. E. M., Skamnaki V., Brown N. R., Lowe E. D., Kontogiannis L., Shen K., Cole P. A., Siligardi G., Johnson L. N., The role of the phospho-CDK2/cyclin A recruitment site in substrate recognition. J. Biol. Chem. 281, 23167–23179 (2006). [DOI] [PubMed] [Google Scholar]
- 39.Hengartner C. J., Myer V. E., Liao S. M., Wilson C. J., Koh S. S., Young R. A., Temporal regulation of RNA polymerase II by Srb10 and Kin28 cyclin-dependent kinases. Mol. Cell 2, 43–53 (1998). [DOI] [PubMed] [Google Scholar]
- 40.Tsai K. L., Yu X., Gopalan S., Chao T. C., Zhang Y., Florens L., Washburn M. P., Murakami K., Conaway R. C., Conaway J. W., Asturias F. J., Mediator structure and rearrangements required for holoenzyme formation. Nature 544, 196–201 (2017). [DOI] [PMC free article] [PubMed] [Google Scholar]
- 41.Nozawa K., Schneider T. R., Cramer P., Core Mediator structure at 3.4 Å extends model of transcription initiation complex. Nature 545, 248–251 (2017). [DOI] [PubMed] [Google Scholar]
- 42.Robinson P. J., Trnka M. J., Pellarin R., Greenberg C. H., Bushnell D. A., Davis R., Burlingame A. L., Sali A., Kornberg R. D., Molecular architecture of the yeast Mediator complex. eLife 4, e08719 (2015). [DOI] [PMC free article] [PubMed] [Google Scholar]
- 43.Robinson P. J., Bushnell D. A., Trnka M. J., Burlingame A. L., Kornberg R. D., Structure of the mediator head module bound to the carboxy-terminal domain of RNA polymerase II. Proc. Natl. Acad. Sci. U.S.A. 109, 17931–17935 (2012). [DOI] [PMC free article] [PubMed] [Google Scholar]
- 44.Chang C. I., Xu B.-e., Akella R., Cobb M. H., Goldsmith E. J., Crystal structures of MAP kinase p38 complexed to the docking sites on its nuclear substrate MEF2A and activator MKK3b. Mol. Cell 9, 1241–1249 (2002). [DOI] [PubMed] [Google Scholar]
- 45.Zheng S. Q., Palovcak E., Armache J. P., Verba K. A., Cheng Y., Agard D. A., MotionCor2: Anisotropic correction of beam-induced motion for improved cryo-electron microscopy. Nat. Methods 14, 331–332 (2017). [DOI] [PMC free article] [PubMed] [Google Scholar]
- 46.Mindell J. A., Grigorieff N., Accurate determination of local defocus and specimen tilt in electron microscopy. J. Struct. Biol. 142, 334–347 (2003). [DOI] [PubMed] [Google Scholar]
- 47.Naydenova K., Russo C. J., Measuring the effects of particle orientation to improve the efficiency of electron cryomicroscopy. Nat. Commun. 8, 629 (2017). [DOI] [PMC free article] [PubMed] [Google Scholar]
- 48.Sanchez-Garcia R., Gomez-Blanco J., Cuervo A., Carazo J. M., Sorzano C. O. S., Vargas J., DeepEMhancer: A deep learning solution for cryo-EM volume post-processing. bioRxiv 2020.06.12.148296 (2020). [DOI] [PMC free article] [PubMed] [Google Scholar]
- 49.Cardone G., Heymann J. B., Steven A. C., One number does not fit all: Mapping local variations in resolution in cryo-EM reconstructions. J. Struct. Biol. 184, 226–236 (2013). [DOI] [PMC free article] [PubMed] [Google Scholar]
- 50.Kim K. K., Chamberlin H. M., Morgan D. O., Kim S. H., Three-dimensional structure of human cyclin H, a positive regulator of the CDK-activating kinase. Nat. Struct. Biol. 3, 849–855 (1996). [DOI] [PubMed] [Google Scholar]
- 51.Pettersen E. F., Goddard T. D., Huang C. C., Couch G. S., Greenblatt D. M., Meng E. C., Ferrin T. E., UCSF Chimera—A visualization system for exploratory research and analysis. J. Comput. Chem. 25, 1605–1612 (2004). [DOI] [PubMed] [Google Scholar]
- 52.Emsley P., Lohkamp B., Scott W. G., Cowtan K., Features and development of Coot. Acta Crystallogr. D Biol. Crystallogr. 66, 486–501 (2010). [DOI] [PMC free article] [PubMed] [Google Scholar]
- 53.Afonine P. V., Klaholz B. P., Moriarty N. W., Poon B. K., Sobolev O. V., Terwilliger T. C., Adams P. D., Urzhumtsev A., New tools for the analysis and validation of cryo-EM maps and atomic models. Acta Crystallogr. D Biol. Crystallogr. 74, 814–840 (2018). [DOI] [PMC free article] [PubMed] [Google Scholar]
- 54.Sheng Q., Li R., Dai J., Li Q., Su Z., Guo Y., Li C., Shyr Y., Zeng R., Preprocessing significantly improves the peptide/protein identification sensitivity of high-resolution isobarically labeled tandem mass spectrometry data. Mol. Cell. Proteomics 14, 405–417 (2015). [DOI] [PMC free article] [PubMed] [Google Scholar]
- 55.Kosinski J., von Appen A., Ori A., Karius K., Müller C. W., Beck M., Xlink Analyzer: Software for analysis and visualization of cross-linking data in the context of three-dimensional structures. J. Struct. Biol. 189, 177–183 (2015). [DOI] [PMC free article] [PubMed] [Google Scholar]
- 56.Bao Z. Q., Jacobsen D. M., Young M. A., Briefly bound to activate: Transient binding of a second catalytic magnesium activates the structure and dynamics of CDK2 kinase for catalysis. Structure 19, 675–690 (2011). [DOI] [PMC free article] [PubMed] [Google Scholar]
- 57.Shapovalov M. V., Dunbrack R. L. Jr., A smoothed backbone-dependent rotamer library for proteins derived from adaptive kernel density estimates and regressions. Structure 19, 844–858 (2011). [DOI] [PMC free article] [PubMed] [Google Scholar]
- 58.Leaver-Fay A., Tyka M., Lewis S. M., Lange O. F., Thompson J., Jacak R., Kaufman K. W., Renfrew P. D., Smith C. A., Sheffler W., Davis I. W., Cooper S., Treuille A., Mandell D. J., Richter F., Ban Y. E. A., Fleishman S. J., Corn J. E., Kim D. E., Lyskov S., Berrondo M., Mentzer S., Popović Z., Havranek J. J., Karanicolas J., Das R., Meiler J., Kortemme T., Gray J. J., Kuhlman B., Baker D., Bradley P., ROSETTA3: An object-oriented software suite for the simulation and design of macromolecules. Methods Enzymol. 487, 545–574 (2011). [DOI] [PMC free article] [PubMed] [Google Scholar]
- 59.Webb B., Viswanath S., Bonomi M., Pellarin R., Greenberg C. H., Saltzberg D., Sali A., Integrative structure modeling with the integrative modeling platform. Protein Sci. 27, 245–258 (2018). [DOI] [PMC free article] [PubMed] [Google Scholar]
Associated Data
This section collects any data citations, data availability statements, or supplementary materials included in this article.
Supplementary Materials
Supplementary material for this article is available at http://advances.sciencemag.org/cgi/content/full/7/15/eabd4420/DC1