

Abstract
Objectives
The immunologic events that build up to the fatal neurological stage of experimental cerebral malaria (ECM) are incompletely understood. Here, we dissect immune cell behaviour occurring in the central nervous system (CNS) when Plasmodium berghei ANKA (PbA)‐infected mice show only minor clinical signs.
Methods
A 2‐photon intravital microscopy (2P‐IVM) brain imaging model was used to study the spatiotemporal context of early immunological events in situ during ECM.
Results
Early in the disease course, antigen‐specific CD8+ T cells came in contact and arrested on the endothelium of post‐capillary venules. CD8+ T cells typically adhered adjacent to, or were in the near vicinity of, perivascular macrophages (PVMs) that line post‐capillary venules. Closer examination revealed that CD8+ T cells crawled along the inner vessel wall towards PVMs that lay on the abluminal side of large post‐capillary venules. ‘Activity hotspots’ in large post‐capillary venules were characterised by T‐cell localisation, activated morphology and clustering of PVM, increased abutting of post‐capillary venules by PVM and augmented monocyte accumulation. In the later stages of infection, when mice exhibited neurological signs, intravascular CD8+ T cells increased in number and changed their behaviour, actively crawling along the endothelium and displaying frequent, short‐term interactions with the inner vessel wall at hotspots.
Conclusion
Our study suggests an active interaction between PVM and CD8+ T cells occurs across the blood–brain barrier (BBB) in early ECM, which may be the initiating event in the inflammatory cascade leading to BBB alteration and neuropathology.
Keywords: CD8+ T cells, perivascular macrophage, malaria, immune response, 2‐photon intravital microscopy
Our study suggests that perivascular macrophages and CD8+ T cells interact across the blood–brain barrier (BBB) in the early stages of experimental cerebral malaria, which may be the initiating event in the inflammatory cascade leading to BBB alteration and neuropathology.
Introduction
Cerebral malaria (CM) is a life‐threatening complication of malaria that takes a significant toll on human life each year. 1 Despite many years of research, effective malaria vaccines are not available and parasite resistance to drugs is common, 2 which highlights the need for a better understanding of CM pathogenesis. 3 , 4 Detailed examination of the complex pathophysiologic processes leading to neurological disease in individuals infected with P. falciparum, the pathogen responsible for causing CM, cannot be conducted in humans, 5 necessitating the need for small animal models. In this context, the murine PbA‐infected ECM model is widely used, as it reproduces many features of human CM. 6 The model has proven particularly useful for investigating the inflammatory and pathological processes that result in neurological disease during malaria infections. 7 , 8 , 9 , 10 Several studies have demonstrated the indispensable role for CD8+ T cells in ECM pathogenesis. 11 , 12 However, their precise activities locally within the cerebral vasculature that contributes to neurological disease have only recently been investigated. 13 Parasite‐specific CD8+ T cells are initially stimulated by dendritic cells (DCs) in the spleen, 12 which then migrate to the brain guided by the chemokine CXCL10 (IP‐10). 14 , 15 Brain‐infiltrating CD8+ T cells alter endothelial BBB function, promote leucocyte sequestration and eventually cause neurological disease. 16 , 17 Mice deficient in granzyme B and perforin are completely protected against ECM reinforcing the belief that neurological disease is primarily a manifestation of cytotoxic T lymphocyte (CTL)‐mediated tissue damage. 18 , 19 , 20 Some evidence indicates that CTL requires an additional antigenic stimulus locally within the brain in order to release their cytotoxic enzymes 18 and that endothelial cells (ECs) provide this stimulus via MHC class I‐mediated parasite antigen presentation. 13 However, reporter mice that reveal professional antigen‐presenting cell (APC) populations were not used in this in vivo study, despite previous reports showing that antigen‐specific CD8+ T cells make long‐lasting contact with CNS‐resident CX3CR1+ APC in the perivascular space. 21 Nevertheless, the role of CX3CR1+ APC in ECM itself is not entirely clear as functional studies have relied on clodronate–liposome depletion of the cells, 21 which causes non‐specific inflammation and an influx of myeloid cells even in the absence of infection.
Studies examining the behaviour of T cells in situ in the brain require advanced microscopy technology and fluorescent reporter mouse strains to allow for tracking of their interactions with the endothelium or CNS‐resident cell populations. 22 For example, using such approaches, seminal studies in the multiple sclerosis mouse model experimental autoimmune encephalomyelitis (EAE) have shown that circulating CD4+ T cells expressing α4‐integrins arrest to the vascular endothelium and then transmigrate through the tight junctions of the BBB into the perivascular space. 23 The perivascular space is akin to a castle moat bordered by an outer wall, the BBB, and an inner wall, the glia limitans, formed by astrocyte end processes. 24 Within this space, APCs such as PVM and DC reside, where they act as ‘gatekeepers’ for parenchymal leucocyte invasion. 25 , 26 , 27 PVMs play a multifaceted role in diseases such as multiple sclerosis, Alzheimer’s disease, type 1 diabetes and cancer. 28 PVM and microglia continually survey the CNS microenvironment with motile cellular processes and respond to BBB disruption by surrounding the affected vasculature. 29 , 30 In line with this, trans‐endothelial penetration of inter‐endothelial junctions by macrophages has been reported in the dermis, mesentery and brain. 31 , 32 , 33 Process extensions of PVM also monitor the kidney vasculature. 32 , 33 , 34 Filopodia of macrophages have been reported to localise to inter‐endothelial junctions and bridge neighbouring tip cells in the embryonic mouse brain. 35 , 36 Thus, PVM and EC form an inter‐dependent, reciprocal vascular unit that supports angiogenesis, macrophage differentiation and integrity of EC junctions. 34 , 36 In this context, microglial activation during ECM has been reported. 37 , 38 Upon transmigration into the perivascular space, T cells may re‐encounter cognate antigen presented on PVM 23 that may or may not involve T‐cell receptor (TCR) engagement. 39 , 40 In this context, studies in human postmortem CM samples have shown that blood vessels are stacked with leucocytes including monocytes, macrophages and T cells. 41 , 42
T‐cell entry into the brain during ECM has been recorded mostly in the late stages of disease; therefore, it remains unclear how T cells behave in the early phase of infection, in particular where and how they initially encounter cognate antigen in the CNS. 13 , 21 Using our 2P‐IVM brain imaging model, 43 we have previously demonstrated that CD8+ T effector cells promote monocyte accumulation in the cerebral vasculature 1–2 days prior to the onset of the neurological stage (NS) of ECM. 17 In this study, we explored the precise behaviour of T cells with particular emphasis on early‐stage disease. We found that polyclonal CD8+ T cells isolated from PbA‐infected mice specifically localised at activity hotspots defined by PVM along the vasculature. Our data indicate that these early PVM‐T cell localisations may represent the initial event that kick‐starts the inflammatory cascade culminating in T‐cell extravasation and ECM.
Results
GFP+ T cells undergo a profound transformation in behaviour and function across the different disease stages of ECM
In order to track T cells in the brain during different stages of ECM, we made use of the transgenic DPE‐GFP reporter mice post‐PbA infection (Figure 1a–c). 44 , 45 In these mice, GFP expression is driven under the control of the distal and proximal Cd4 enhancers and promoters. All αβ T cells and PVM in these mice express GFP, with PVM being distinguishable from T cells based on high levels of GFP expression, behaviour and morphology. 45 DPE‐GFP and DPE‐GFPxRAG‐1−/− mice were infected with PbA and monitored daily for clinical signs up to and including day 7 p.i., when most immune‐competent animals develop NS (Figure 1a–c). Approximately 90% of the PbA‐infected DPE‐GFP mice developed minor clinical signs on day 5–6 p.i., which was thus defined as early‐stage (ES) disease. NS developed on day 7 p.i. with mice typically showing loss of motor response. As expected, DPE‐GFPxRAG‐1−/− control mice were completely protected from ECM, thus confirming the essential role of the adaptive immune system (Figure 1a, c). Flow cytometric analysis of brain‐sequestered leucocytes (BSL) confirmed the large increase in CD8+CD44hiGFP+ T‐cell numbers in the CNS during ECM (Figure 1d, e). Consistent with previous studies, CD8−GFP+ T cells also increased significantly, but their absolute numbers were lower than their CD8+ counterparts (Figure 1e). 14 , 17
Figure 1.
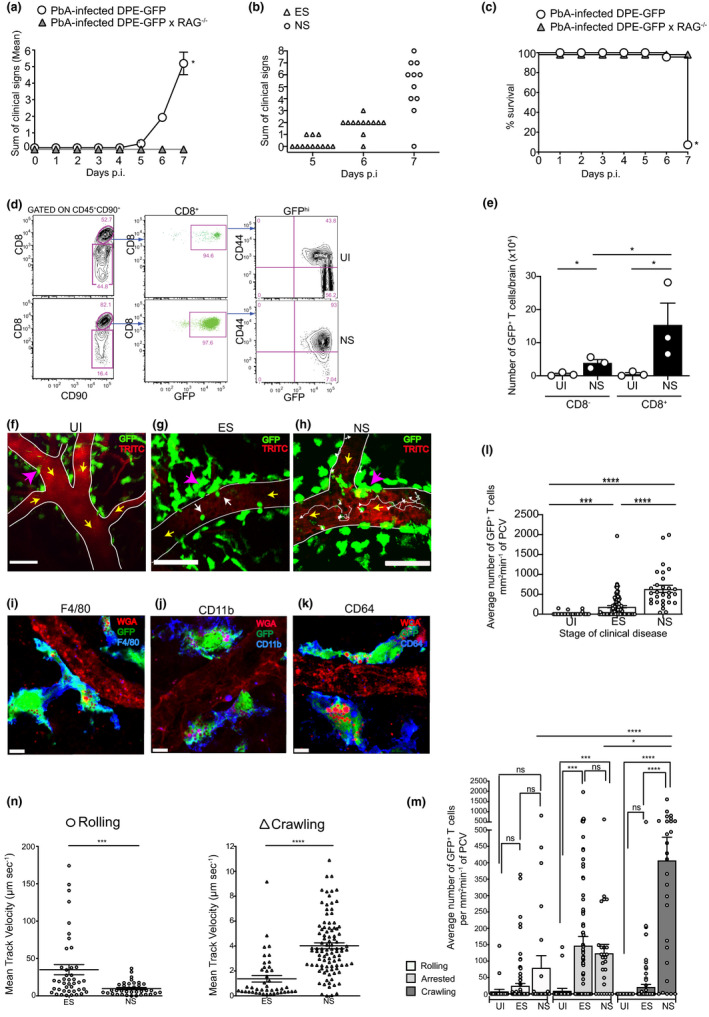
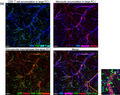
CD8+ T cells exhibit distinct motility patterns across different disease stages of ECM. PbA‐infected DPE‐GFP and DPE‐GFPxRAG‐1−/− mice were monitored for (a) mean clinical score *P < 0.05 (unpaired t‐test) or (b) clinical score of individual DPE‐GFP mice on days 5–7 p.i.; mice in ES showed either nil or minor clinical signs and those in NS typically showed loss of motor response. Each symbol in b represents one mouse (n = 12). (c) % survival, *P < 0.05 (Mantel–Cox test). a–c are from 2 or 5 independent experiments. (d) Flow cytometric analysis shows > 95% of CD8+ T cells expressed GFP in both healthy UI mice and those that developed NS. (e) Quantitative analysis of brain‐sequestered CD8+GFP+ and CD8−GFP+ T cells from 3 or 4 mice/group. Bars represent mean ± SEM. *P < 0.05 (ANOVA). (f–h) Representative 2P‐IVM snapshots of the cerebral microvasculature of DPE‐GFP mice at various disease stages (n = 3 or 8 mice/group). White arrow in g indicates arrested cells. White tracks in h indicate crawling cells. Yellow arrows indicate direction of blood flow. Pink arrows indicate GFP+ PVM. Scale bars represent 100 μm in f, 47 μm in g and 75 μm in h. (i–k) Confocal images of brain sections stained with antibodies against (i) F4/80, (j) CD11b and (k) CD64. Average number of (l) total and (m) rolling, arrested and crawling GFP+ T cells. Bars represent mean ± SEM. ns, not significant, *P < 0.05, ***P = 0.0001, ****P < 0.0001 (Kruskal–Wallis test, Dunn’s test). 26–94 PCVs from 3 or 8 mice/group. e–m are from at least 2 independent experiments. (n) Mean track velocity of rolling and crawling GFP+ T cells. 36–96 cell tracks from 4 or 8 mice/group, and 2 or 3 independent experiments. ***P = 0.0001, ****P < 0.0001 (Mann–Whitney U‐test).
We next performed 2P‐IVM in PbA‐infected DPE‐GFP mice during the various stages of ECM development (Figure 1f–h). A distinct population of large, dendritic‐shaped GFP+ perivascular cells (indicated by pink arrows) lined post‐capillary venules (PCVs) in DPE‐GFP mice. These cells expressed the myeloid/macrophage markers F4/80, CD11b and CD64 (Figure 1i–k) and represented PVM as reported previously in the skin ([45] and see further below). Flow cytometric analysis confirmed that PVMs were CD45+GFP+CD90−CD3−CD11b+F4/80+ (Supplementary figure 1a) and could be distinguished from microglia that were CD45intGFP−CD90−CD3−CD11b+F4/80− (green outline). 45 GFP+ PVMs were easily distinguishable from the smaller spherical GFP+ T cells in the blood vessels (indicated by white arrows, Figure 1g). Rolling, crawling and arrested T‐cell behaviour is defined elsewhere (see Methods). 46 , 47 , 48 , 49 , 50 , 51 In uninfected (UI) mice, very few GFP+ T cells were observed to interact with the endothelium of PCV as would be expected in the steady state (Figure 1f, l). 52 Mice in ES showed GFP+ T cells sporadically arresting to the endothelium of PCV. A 10‐fold increase in the average number of T cells (187 ± 28 mm2 min−1) was recorded compared to UI mice (Figure 1g, l), with a further 3.9‐fold increase recorded as the disease progressed from ES to NS (636 ± 89 mm2 min−1) (Figure 1h, l; Supplementary video 1). Of the total GFP+ T cells that had accumulated in the PCV during ES, 76% firmly arrested on the inner vessel wall, while the remaining 24% either rolled or crawled in approximately equal numbers (Figure 1m). In NS, the average number of arrested cells remained unchanged compared to ES, whereas crawling cells increased significantly with disease progression, such that of GFP+ cells, 67% of cells crawled, 20% arrested and 13% rolled along the endothelium (Figure 1m). These observations are consistent with reports that T cells crawl vigorously along the luminal surface of blood vessels prior to their extravasation in the build‐up to clinical EAE. 23 Furthermore, GFP+ cells, similar to monocytes, 17 rolled more slowly as the disease progressed from ES [Vmean: 35 ± 6.7 µm s−1] to NS [Vmean: 9.7 ± 1.4 µm s−1] (Figure 1n). However, crawling speed increased from ES [Vmean: 1.3 ± 0.2 µm s−1] to NS [Vmean: 4.0 ± 0.2 µm s−1]. Together, our data show that intravascular GFP+ T cells in DPE‐GFP mice increase in number and display distinct migratory patterns across the different disease stages of ECM.
Transferred CD8+GFP+ T cells arrest to the vascular endothelium and drive the progression of ES to NS in RAG−/− mice
Since we could not unequivocally distinguish between CD4+ and CD8+ T cells in DPE‐GFP mice, we resorted to our previously published adoptive transfer approach to investigate the behaviour of CD8+ T cells (Figure 2a). 17 To this end, we purified CD8+ T cells from the spleen of either UI control (henceforth termed naïve) or PbA‐infected (termed primed) DPE‐GFP mice on day 7 p.i. (Figures 2a and Supplementary figure 1b, c). CD8− splenocytes were also collected from PbA‐infected DPE‐GFP mice on day 7 p.i. (termed primed CD8− Sp). A total of 107 primed CD8+ T cells or primed CD8− Sp were injected into PbA‐infected DPE‐GFPxRAG‐1−/− recipient mice. Naïve CD8+ T cells from UI DPE‐GFP mice served as a negative control. Recipients of primed CD8− Sp, naïve CD8+ T cells and those that received no cells presented with only minor clinical signs during the observation period of 6 days (Figure 2b). They were mostly free from signs of illness on day 7 p.i. (Figure 2c). This was consistent with the reported inability of these cells to reverse the resistance of RAG‐1−/− mice to neurological disease. 17 , 19 In contrast, all mice that received primed CD8+ T cells exhibited clinical signs of illness on day 7 p.i. and began to progress to NS (Figure 2c). We noted that none of the DPE‐GFPxRAG‐1−/− mice that received primed CD8+ T cells had a profound impairment of motor responses typically seen in DPE‐GFP mice during NS (Figure 1b). For quantification purposes, we therefore pooled recipients of primed CD8+ T cells into ES regardless of their disease stage. Quantification by flow cytometry showed that, compared to UI mice, increased numbers of CD8+ T cells sequestered in the brains of DPE‐GFPxRAG‐1−/− mice that had received primed CD8+ T cells, which is consistent with previous reports. 12 , 19
Figure 2.
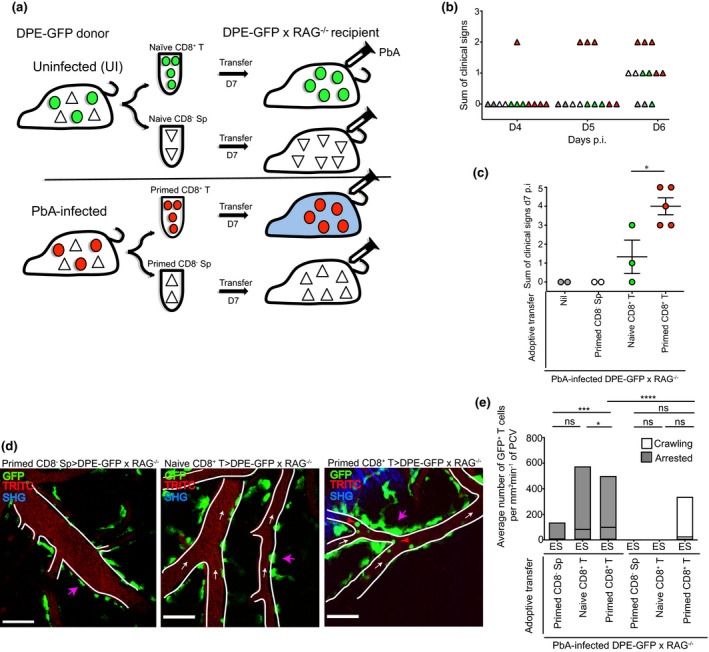
Plasmodium‐specific CD8+ T cells arrest to the inner wall of PCV during ES. (a) CD8+ T cells or CD8− Sp were MACS‐purified from the spleen of UI (termed naïve) or PbA‐infected (termed primed) DPE‐GFP donor mice on day 7 p.i. and adoptively transferred i.v. into PbA‐infected DPE‐GFPxRAG‐1−/− mice as depicted. Mice that developed NS are shown in blue. (b) Clinical score of individual DPE‐GFPxRAG‐1−/− mice on days 4–6 p.i. Each symbol represents one mouse. Recipients of primed CD8− Sp, naïve CD8+ T cell, primed CD8+ T cell and those that received no cells are shown in white, green, red and grey, respectively. These mice presented with nil or minor clinical signs. (c) The number of signs of illness on day 7 p.i. Each symbol represents one mouse. (d) 2P‐IVM was performed when recipients of primed CD8+ T cells were showing signs of illness. Representative snapshot of 2 independent experiments (n = 2, 3 or 5 mice/group). Blue represents second harmonic generation (SHG) signals. Red arrows indicate arrested CD8+GFP+ T cells. White arrows indicate direction of blood flow. Pink arrows indicate GFP+ PVM. Scale bars represent 100 µm (primed CD8− Sp) and 60 µm (naïve and primed CD8+ T). (e) Average number of arrested and crawling GFP+ T cells from 18‐59 PCV. Primed CD8− Sp (n = 2), naïve CD8+ T (n = 3) and primed CD8+ T (n = 5) are from 2 independent experiments. Bars represent mean ± SEM. ns, not significant, *P < 0.05, ***P = 0.001, ****P < 0.0001 (Kruskal–Wallis test, Dunn’s test).
We also performed dose titration experiments using increasing numbers of adoptively transferred primed CD8+ T cells (0, 10 and 22 × 106) (Supplementary figure 1d). Increasing the number of cells to 22 × 106 accelerated the disease course by 1–2 days, and by day 7 p.i., all the mice had progressed in their disease course and were euthanised. Taken together, we show that PbA‐specific CD8+GFP+ effector T cells are capable of promoting the disease course in immunodeficient mice. The fact that they accumulate in the CNS during the different disease stages of ES and NS therefore enabled us to specifically track their intravascular behaviour.
Next, we adoptively transferred the various cell populations into PbA‐infected DPE‐GFPxRAG‐1−/− mice as depicted in Figure 2a, and 2P‐IVM was performed when mice were in ES. As with DPE‐GFP mice, GFP+ PVM lined PCV in recipient animals (indicated by pink arrows, Figure 2d). 45 As expected, in mice that received no cells (0 mm2 min−1, Supplementary figure 2a, Supplementary video 2), primed CD8− Sp (7.7 ± 7 mm2 min−1) and naïve CD8+ T cells (82.5 ± 42 mm2 min−1) (Figure 2d, e), GFP+ adherent cells in PCV were either completely absent or present in low numbers. Alternatively, mice that received primed CD8+ T cells showed an increased accumulation of GFP+ adherent cells (98.5 ± 19 mm2 min−1) in the PCV during the ES phase (indicated by red arrows, Figure 2d, e; Supplementary video 3). Together, our data show that CD8+ T cells primed to Plasmodium interact with the CNS vasculature in significant numbers 24–48 h before they normally induce the development of NS in mice. At this stage, very few, if any, T cells leave the vasculature, which raises the question of whether and where they see their cognate antigen prior to inducing ECM.
Intravascular CD8+GFP+ T cells localise at PVM sites
Extravasated CD8+ T cells arrest at CX3CR1+ APC in the perivascular space during ECM. 21 Strikingly, we found that some GFP+CD8+ T cells in PbA‐infected DPE‐GFP mice crawled along the inner vessel wall towards GFP+ PVM during ES (Figure 3a, b; Supplementary video 4). These T cells exhibited directional migration, crawling with or against the blood flow or perpendicular to the vessel axis to eventually arrive at a site of GFP+ PVM residence (indicated by red arrows and inset in Figure 3b; Supplementary video 4). This behaviour was replicated by primed CD8+ T cells adoptively transferred into PbA‐infected DPE‐GFPxRAG‐1−/− mice (Supplementary figure 2b; Supplementary video 5). Other cell types including primed CD8− Sp or naïve CD8+ T cells did not exhibit interactions with the vascular wall and rather moved with the blood flow (Figure 2d, Supplementary video 3). Upon their arrival at PVM sites, crawling T cells often paused their migration and assumed a spherical or elongated, non‐polarised morphology (white arrow, Figure 3c, d). Closer inspection of the x‐y‐t single plane showed that approximately 1/3rd of the GFP+ intravascular T cells were directly aligned along the inner vessel wall with GFP+ PVM located on the abluminal side (Figure 3e; Supplementary video 6). The proportion of CD8+ T cells that localised at PVM sites was significantly higher during ES (DPE‐GFP mice, 35.2 ± 5%; primed CD8+ T>DPE‐GFPxRAG‐1−/−, 35.8 ± 12%) and NS (DPE‐GFP mice, 55.9 ± 9%) compared to control groups that included UI DPE‐GFP mice (0%) and PbA‐infected DPE‐GFPxRAG‐1−/− mice that received primed CD8− Sp (0%), naïve CD8+ T cells (8.3 ± 8%) or transferred primed RFP+OT‐I effector cells, which do not have specificity for PbA (0%) (Figure 3f). T cells that had localised at PVM sites were immobile (mean distance from PVM: DPE‐GFPxRAG‐1−/− mice, 8.3 ± 1.3 µm; DPE‐GFP mice, 7.2 ± 0.5 µm) (Supplementary figure 2c; Supplementary video 6). 40 T cells that had not localised at PVM sites rapidly scanned the endothelial wall (mean distance from PVM: DPE‐GFPxRAG‐1−/− mice, 17.6 ± 1.7 µm; DPE‐GFP mice, 17.1 ± 1.3 µm), displaying an agitated behaviour as reported for T cells that scan for antigen expression on the surface of APC. 40 Our data show that Plasmodium‐specific CD8+ T cells display intravascular directional migration and lie directly adjacent to GFP+ PVM in the early stage of ECM.
Figure 3.
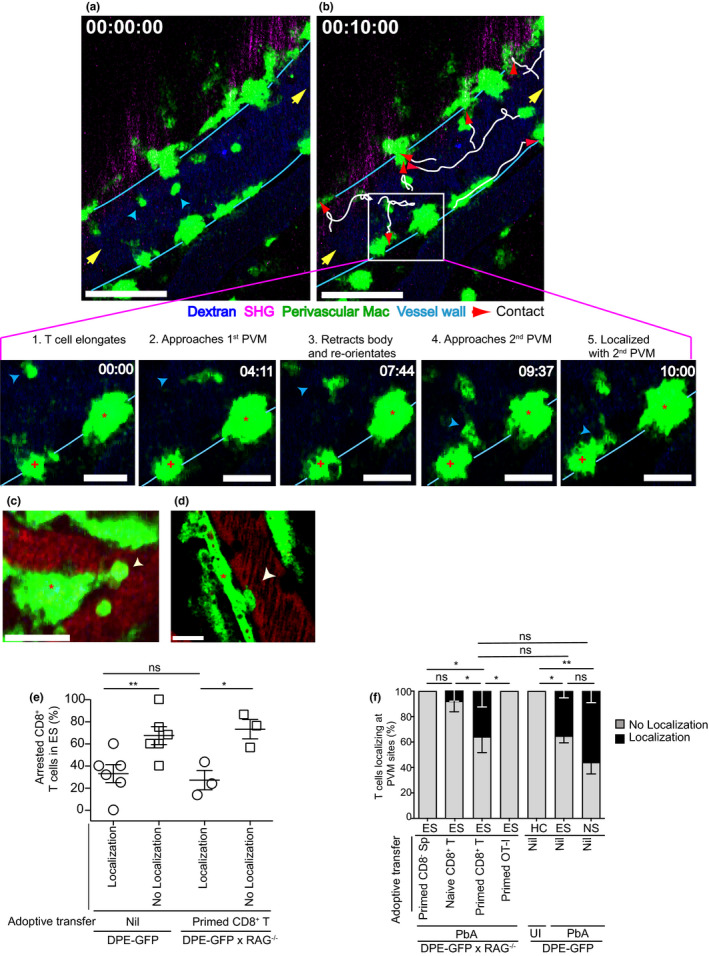
CD8+ T cells co‐localise with PVM. (a, b) A time series of the cerebral vasculature of PbA‐infected DPE‐GFP mice during ES. One of two independent experiments (n = 2). Yellow arrows indicate direction of blood flow; blue arrows, CD8+ T cells; white lines, migration tracks of T cells after 10 min; and red arrows, localisation with PVM. Scale bar 60 μm. T cells show discrimination while localising (inset). Panels 1 and 2, T cell (blue arrow) migrates towards 1st PVM (asterisk). Panel 3, T cell retracts its body and re‐orientates towards 2nd PVM (plus symbol). Panels 4 and 5, T cell localises only with 2nd PVM after 10 min. Scale bar 20 μm. (c, d) Single x‐y‐t focal plane of a primed CD8+ T cell (white arrow) localised at a PVM site in DPE‐GFPxRAG‐1−/− mice (asterisk indicates PVM). Scale bar 25 μm in (c) and 16 μm in (d). Representative of 5 mice from 3 independent experiments. (e) Percentage of CD8+ T cells localising at PVM sites. Each symbol represents one mouse (n = 3 or 6). 90–115 T cells from 44 to 48 PCV, 2 or 3 independent experiments. Error bars represent mean ± SEM. ns, not significant, *P < 0.05, **P < 0.005 (unpaired t‐test). (f) % CD8+ T cells localising with PVM. 114, 213 and 162 CD8+ T cells from 18 to 101 PCVs were assessed for ES (primed CD8+ T), ES (nil) and NS, respectively. ns, not significant, *P < 0.05, **P < 0.001 (one‐way ANOVA; Kruskal–Wallis test, comparing % localisation in each group with every other group). Data are from 2, 3 or 5 (DPE‐GFPxRAG‐1−/−) and 3 or 8 (DPE‐GFP) mice/group from 2 or 3 independent experiments.
Dendritic‐shaped GFP+ perivascular APCs are PVM
GFP+ PVMs were abundant around medium‐to‐large (20–160 µm diameter) PCV in the leptomeninges (Figure 4a and inset) and were bordered by astrocytes (glia limitans) that line the perivascular space (Figure 4b). 25 , 29 PVMs were scarce around arterioles, capillaries and small PCV (8–20 µm diameter) (Figure 4c, d) 16 and were distinct from DC, as reported. 53 In uninfected DPE‐GFP and PbA‐infected DPE‐GFPxRAG‐1−/− mice adoptively transferred with primed CD8− Sp or naïve CD8+ T cells, PVM abutted the PCV as single cells (Figure 4e, g) pink arrow in 1f, 2d). In comparison, during the course of ECM, PVM increased their cell size and moved closer to the vasculature, thereby covering a greater percentage of the PCV wall (Figure 4f, h, I; pink arrow in 1g, h, 2d, Supplementary videos 1, 3). 29 Besides residing as single cells, adjacent PVM grouped together to form clusters, which increased in cellularity with the progression of clinical disease (Figure 4e, g). These ‘activity hotspots’ correlated with the attraction of other leucocytes and were defined as whole or part of a blood vessel abutted by PVM that shows accumulation of ≥ 1 rolling, adherent or crawling leucocyte. Given that PVMs have a demonstrated role of leucocyte attraction in infectious models, this may indicate a similar role in ECM. 45
Figure 4.
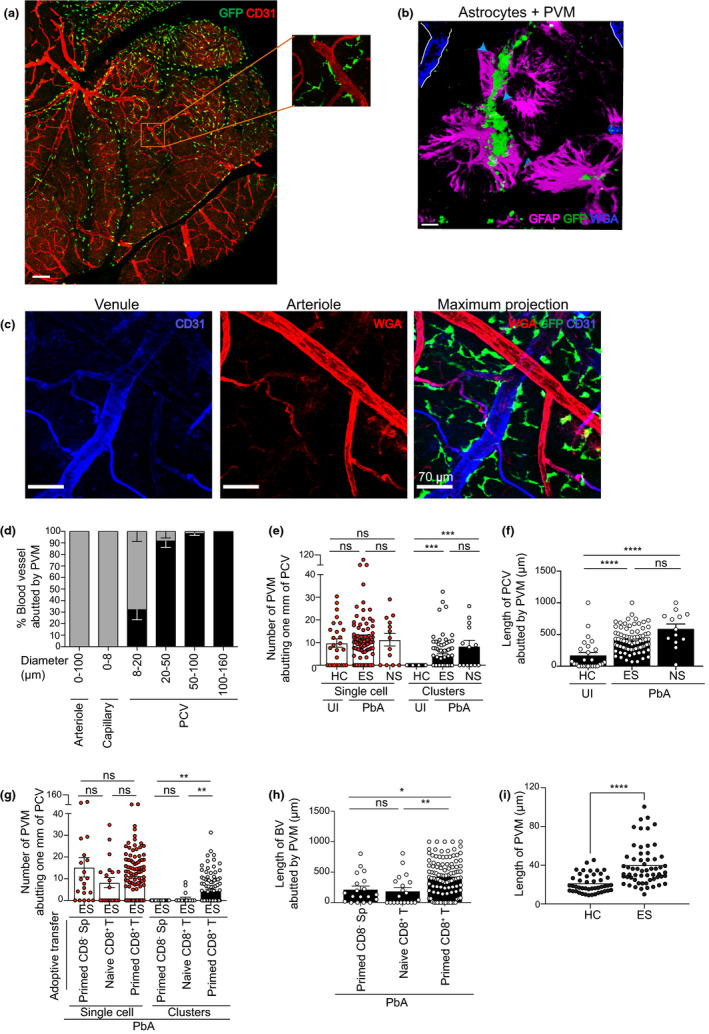
Phenotypic characterisation and distribution of PVM during ECM. (a) Tile scan image of the top of the brain in UI DPE‐GFP mice using confocal microscopy. Scale bar 340 μm. (b) PVM intercalated with GFAP, an intermediate filament protein produced by astrocytes (glia limitans). Scale bar 110 μm. (c) PVM closely abuts the length of large PCV (blue) but not arterioles (red) or capillaries (red mixed with blue). Scale bar 70 μm. a–c are representative of 2 or 3 independent experiments (n = 3). (d) 2P‐IVM of the cerebral vasculature during ES. Grey bars indicate 0, and black bars ≥ 1 indicate PVM abutting the length of a blood vessel. 171 blood vessels from 4 independent experiments (n = 8). Bars represent mean ± SEM. 2P‐IVM was performed on DPE‐GFP (e, f) and DPE‐GFPxRAG‐1−/− (g, h) mice. Number of PVM was quantified manually. Clusters were defined as cell area that is at least twofold more than that of UI mice. Error bars represent mean ± SEM. ns, not significant, **P < 0.001, ***P = 0.0001, ****P < 0.0001 (ANOVA, Kruskal–Wallis test). Data are pooled from 2 (HC), 7 (ES), 3 (NS), 2 (primed CD8− Sp), 3 (naïve CD8+ T) or 5 (primed CD8+ T) mice. 13–104 PCV from at least 2 independent experiments. NS is one experiment. (i) Length of PVM abutting PCV (n = 4), 2 independent experiments.
Activity hotspots of PVM create a niche for CD8+ T cells
Previous reports have shown that perivascular APCs act as barometers of neuroinflammation, with perivascular clustering associated with BBB disruption, fibrinogen leakage and inflammation. 29 , 33 We found that PVM activity hotspots were distributed along the length of large PCV (Figure 5a and inset). Curiously, arterioles, capillaries and PCV of <20 µm diameter were mostly free of CD8+ T‐cell accumulation and scarcely surrounded by PVM (Figures 5b, c, 4d). In this context, it is perhaps relevant that capillaries and arterioles in the CNS lack a perivascular space. 26 Differential staining of PCV (blue) (upper left panel), arterioles (dim red) and monocytes (bright red) (lower left panel) was achieved using wheat germ agglutinin (WGA) and anti‐CD31 antibody treatment (see Methods). PVM activity correlated with the accumulation of monocytes (magenta) (upper right panel) and CD8+ T cells (upper left and lower right panel; yellow arrow in inset) in PCV, regardless of the disease stage of ECM. PVM showed an activated morphology characterised by amoeboid appearance, dextran+ phagosomes and process extensions displaying reduced complexity and re‐orientating towards the vasculature (Figure 5d, 4i). 29 However, inactive sites in these mice were not different to control groups, which is consistent with reports that non‐inflamed blood vessels show neither vascular leakage nor alteration in tight junction protein expression in mice with fatal disease. 13 Quantitative analysis confirmed that increased perivascular clustering correlated with increased CD8+ T‐cell accumulation during ES (Figure 5e). We have previously shown that Plasmodium‐primed CD8+ T cells induce monocyte accumulation in large PCV during ES 17 ; however, the reporters used in this study revealed other myeloid cells in the perivascular space in addition to PVM. 3D rendering of high magnification images could not resolve the interface between T cells and PVM because of overlap of GFP signals. It was therefore not possible to distinguish potential trans‐endothelial membrane in our setting. Of note, T‐cell co‐localisation at PVM sites was specific as Plasmodium antigen expression in itself did not support PVM‐T cell interactions (Figure 3f). Collectively, our study identifies ‘activity hotspots’ in PCV marked by increased number, perivascular clustering, abutting and activated morphology of PVM that co‐localise with Plasmodium‐specific polyclonal CD8+ T cells.
Figure 5.
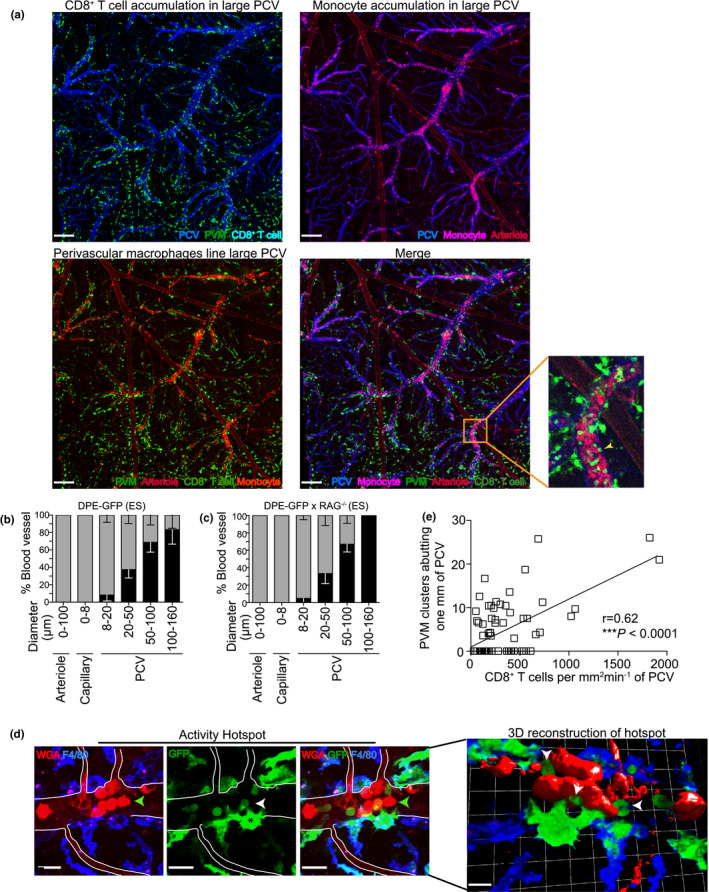
PVMs create activity hotspots for CD8+ T cells. (a) Confocal microscopy shows a maximum intensity z‐projection of blood vessels of the brain of PbA‐infected DPE‐GFP mice during ES. Scale bar: 470 μm. One of two independent experiments (n = 2). (b, c) 2P‐IVM of the cerebral vasculature of PbA‐infected DPE‐GFP and DPE‐GFPxRAG‐1−/− mice that received primed CD8+ T cells. No accumulation and accumulation were defined as 0 (grey) or > 0 (black) mm2 min−1 respectively. Bars represent mean ± SEM. 81–134 blood vessels assessed from 5 (DPE‐GFPxRAG‐1−/−) or 8 (DPE‐GFP) mice/group from 3 independent experiments. (d) Representative maximum intensity z‐projections (panels 1, 2 and 3) and 3‐D reconstruction (panel 4) of activated hotspots in PbA‐infected DPE‐GFP mice using confocal microscopy. WGAhi monocytes are indicated by green arrows, CD8+ T cells by white, vessel wall by white lines, and PVMs (asterisk) are F4/80+ (green‐blue) containing intracytoplasmic phagosomes (pink) (n = 3). Scale bar 18 μm except 3D reconstruction, which is 100 μm. (e) Correlation of the number of PVM clusters with accumulated CD8+ T cells in DPE‐GFP mice (n = 13) (r = 0.62, ****P < 0.0001, Pearson’s test). d and e are from 2 or 7 independent experiments.
Reduced interaction times between CD8+ T cells and PVM during NS
Finally, we compared the behaviour of CD8+ T cells during ES and NS. Crawling T cells travelled longer distances within a given observation period during NS (ES, 39.8 ± 11.0 µm min−1 vs. NS, 147.6 ± 12.6 µm min−1) (****P < 0.0001) (Supplementary figure 3a–e, Supplementary video 7). A sharp increase in median instantaneous velocity (ES, 0 vs. NS, 3.2) reduced the average migration time along the vessel wall (ES, 169.8 ± 24.6 µm s−1 vs. NS, 27.8 ± 3.4 µm s−1) (Figure 6a, b). Furthermore, CD8+ T‐cell activity was no longer restricted to ‘hotspots’ and involved the entire PCV. Unlike ES, half the cells that were crawling migrated in loops during NS, at a sharper turning angle (median turning angle: ES, 59.6 vs. NS, 124.3) (Figures 6c and Supplementary figure 3f, g). These changes in locomotion increased the interaction frequency at PVM sites (number of interactions per mm2 min−1) during NS (NS, 231.1 ± 34 mm2 min−1) as compared to ES (DPE‐GFP mice, 88.9 ± 16 mm2 min−1; DPE‐GFPxRAG‐1−/− mice, 38.4 ± 7 mm2 min−1) (Figure 6d; Supplementary video 7). PVM interactions were not a non‐specific by‐product of neuroinflammation (Supplementary figure 3h). In addition, an increasing number of T cells also began to appear in the extravascular space at this stage. 21 These data suggest that intravascular PVM‐T cell interactions may be important during early stages of ECM but are less critical once substantial inflammation is established.
Figure 6.
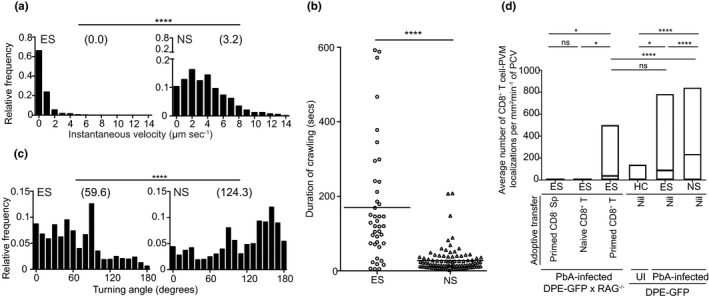
Intensified crawling of CD8+ T cells leads to increased engagement with PVM sites. (a) Relative frequency distribution of the instantaneous velocity of crawling T cells. 31–81 cell tracks from 2 or 3 mice, ****P < 0.0001 (Mann–Whitney U‐test). (b) Duration of intraluminal crawling. Crawlers were tracked after they entered and until they exited from the field of view for a maximum of 10 min of observation period. 41–96 cell tracks from 3 or 5 mice. Bar indicates mean, ****P < 0.0001 (Mann–Whitney U‐test). (c) Relative frequency distribution of turning angles of crawling T cells. 37–87 cell tracks from 3 or 4 mice, ****P < 0.0001 (Mann–Whitney U‐test). a–c are from at least 2 (ES) or a single experiment (NS). (d) Average number of CD8+ T‐cell–PVM interactions (ANOVA, Dunn’s test) during various stages of disease, HC (n = 2), ES (n = 8), NS (n = 4), primed CD8− Sp (n = 2), naïve CD8+ T (n = 3) and primed CD8+ T (n = 5). 18–155 PCVs from 2 or 3 independent experiments/group.
Discussion
The sequence of inflammatory events within the vasculature during ECM remains incompletely defined. Since CD8+ T cells are required for the induction of ECM in the PbA infection model, the present report focused on the behaviour of CD8+ T cells in the vasculature during both ES and NS. 11 , 54 Minor clinical signs are not unlike malarial symptoms in humans (such as shaking chills) and are primarily a manifestation of parasite release into the bloodstream. 55 , 56 We have shown here that CD8+ T cells with antigen specificity for Plasmodium enter the brain during ES. Upon entry into the CNS vasculature, they arrest on the post‐capillary venular endothelium adjacent to PVM. Parasite‐specific CD8+ T cells arresting to the luminal wall in a cognate peptide–MHC I‐dependent manner have been reported; however, these studies were carried out in mice with fatal disease. 13 Our studies concur with this report as we detected a significant number of CD8+ T cells arresting to the luminal wall during NS. Together, these studies support the idea that retention of CD8+ T cells recognising cognate antigen in the brain is favored over those that recognise irrelevant antigen. 57 However, Swanson and co‐authors did not utilise reporter mice that reveal CNS‐resident APC in their studies, making it impossible to visualise T‐cell localisation with PVM. This is surprising as Shaw et al. have shown earlier that CX3CR1+ APCs make cognate interactions with CD8+ T cells in the perivascular space in the late stages of ECM. 21 In the present study, we used DPE‐GFP reporter mice to visualise PVM activity in the brain. We found that, unexpectedly, effector T cells had localised at activity hotspots characterised by activated morphology, as well as increased clustering and abutting of PCV by PVM. Thus, PVM created a niche for T‐cell arrest. At approximately 24–48 h after localisation at activity hotspots, CD8+ T cells increased in number, crawled intensely along the endothelium, increased their interaction rate at PVM sites and induced NS in mice. Such intensified T‐cell activity within the CNS vasculature may be necessary for extravasation, as the BBB is generally considered to shield the brain and spinal cord from leucocyte access. Nevertheless, the remarkable transformation in T‐cell behaviour across the disease stages of ECM raised the question about the role of PVM in transportation of antigenic cargo across the BBB. The ability of PVM to present antigen is a well‐described phenomenon. 58 For example, in EAE this occurs after T cells cross the endothelial barrier and invade the surrounding meningeal/perivascular space in order to access antigen. However, the data presented here challenge this model and instead point to PVM acting as a conduit for communicating with T cells across the BBB by releasing signalling mediators such as chemokines. Furthermore, macrophage/myeloid cell processes extending through intercellular junctions of the endothelium in the dermal vasculature, mesentery and brain as well as epithelial barriers of the intestinal tract have been reported. 31 , 32 , 33 , 59 Although the microenvironment encountered by T cells within the vascular lumen during ECM will be different from that encountered in the brain during EAE, our findings provide a lead for investigating how T cells may be activated by perivascular APC in the absence of BBB breach. In this regard, using differential thresholds of GFP expression to distinguish GFPlo Plasmodium parasites 12 from GFPhi PVM, we were able to detect phagocytised parasites in PVM during NS. 13 Intracytoplasmic dextran+ phagosomes were also detected, as reported. 31 Although this does not directly prove active plasma sampling, as transport of dextran across the endothelium into the perivascular space cannot be excluded in this setting, these data nevertheless show that PVM can access blood‐borne mediators and/or parasitised red blood cells (pRBCs). 13 , 60
Another important question relates to the mechanisms that underlie the attraction of T cells towards PVM. Only Plasmodium‐specific but not ovalbumin (OVA)‐specific CD8+ T cells crawled along the endothelium and displayed directed migration towards PVM. Since PVM supposedly reside behind the BBB, this raises the question as to how these T‐cell alignments may be established. Firstly, it is possible that early inflammation causes disruption of the endothelial monolayer, giving T cells access to the perivascular space. Secondly, it is conceivable that PVMs communicate with the vascular lumen across the endothelium by producing neutrophil‐attracting chemokines. 45 We therefore speculate that early systemic pro‐inflammatory signals during ECMs, such as IFN‐γ released by NK cells 61 and CD4+ T cells, 54 may activate chemokine production by CNS‐resident PVM and lead to subsequent CD8+ T‐cell recruitment. 21
Previous evidence, mostly based on in vitro studies, has suggested that antigen presentation to Plasmodium‐specific CD8+ T cells in the CNS occurs on cerebral endothelium. 62 , 63 However, this notion has been contradicted by in vivo studies, which found no evidence of endothelial injury, loss of cell viability or discontinuities in the vascular lining during ECM. 16 , 21 Recently, MHC I‐deficient Kb−/−Db−/− bone marrow chimeras were used to show that lack of MHC I‐mediated cognate antigen presentation reduces CD8+ T‐cell arrest in the vasculature and protects mice from ECM. 13 As the vascular lumen is not known to harbour radioresistant cells, an assumption was made that reduced CD8+ T‐cell arrest in the vasculature was a direct outcome of poor antigen presentation by EC. More studies are needed to corroborate these findings as fate‐mapping studies have revealed that PVMs are long‐lived radioresistant cells of the CNS that develop independently of Flt3+ haematopoietic precursors. 33 , 64 Finally, if indeed ECs were presenting antigen to CD8+ T cells, then the question arises as to why they do not become self‐targets of cytotoxicity and escape injury. 13 We therefore propose a mechanism similar to that proposed by Geissmann and co‐workers that PVM and endothelial cells are integral parts of a single anatomical and functional unit that monitors trans‐endothelial transport and scavenges particulate matter in the vasculature. 34 Thus, repeated interactions of CD8+ T cells at PVM sites, 31 if they are indeed antigen‐specific, result in the release of cytotoxic mediators, such as perforin and granzyme B, which would accumulate at endothelial intercellular junctions over time and lead to BBB disruption. 65 Such disruptions cause controlled opening of transcellular and paracellular fluid transport pathways. 16 , 66 In addition, T cells frantically migrating along the endothelium may be trying to find a suitable spot for extravasation. 23 In this context, it is relevant that granzyme B promotes CTL extravasation via basement membrane remodelling. 67
Depletion of myeloid cells, for example by clodronate liposomes (CL) on days 5–7 p.i. or utilising the CX3CR1‐iDTR mice, does not confer protection from ECM, 17 , 68 , 69 , 70 which may argue against the role of PVM in this disease. However, it was unclear from these studies whether complete PVM depletion had been accomplished especially since PVMs have a heterogeneous phenotype. 31 , 45 In addition, in our hands CL injection intrathecally, as was done in some of these studies, induces vigorous local inflammation in the brain resulting in the recruitment of neutrophils and monocytes. This is not surprising as macrophage depletion leads to disruption of EC junctions and increases vascular permeability. 32 In the light of this, there is the need for more specific depletion approaches for PVM to dissect their precise role in ECM.
Collectively, we propose that CD8+ T cells localise specifically at PVM hotspots in the early phases of ECM development. Such encounters may provide an instruction for T cells to reactivate, and produce cytokines and cytotoxic mediators, which consequently amplifies the inflammatory response within the CNS vasculature. 18 , 19 , 71 , 72 This idea is supported by straighter T‐cell trajectories leading to increased interaction rate at PVM sites during NS, consistent with the notion that chemotactic ‘roadmaps’ laid along the endothelium by previous cells guide new ‘recruits’ more efficiently to their target cell. 73 Therefore, a better understanding of the nature of T‐cell–PVM interactions may provide a therapeutic target for this devastating condition.
Methods
Mice
All mice used in this study were on a C57BL/6 background. mT/mG mice were purchased from the Jackson Laboratory. 74 DPE‐GFP mice were described previously. 44 C57BL/6 and RAG‐1−/− mice were obtained from the Australian Resources Centre (Perth, Australia). DPE‐GFPxRAG‐1−/− mice were screened for GFP+, CD3+ and B220+ expression by flow cytometry and RAG‐1 gene expression by RT‐PCR. Only CD3−GFP+ DPE‐GFPxRAG‐1−/− mice were used. This study was carried out in accordance with the guidelines from the National Health and Medical Research Council of Australia. All animal procedures and protocols were approved by the University of Sydney Animal Ethics Committee. All mice were maintained with environmental enrichment in specific pathogen‐free (SPF) conditions at the Centenary Institute Animal Facility or the Medical Foundation Building Animal Facility, Department of Pathology, University of Sydney. The surgical procedures and intravital imaging were performed by trained specialists as described. 43
Parasites and infections
The maintenance and usage of PbA strain were described previously. 75 Mice were infected with PbA by intraperitoneal injection (i.p.) of 106 pRBC. Parasitaemia was monitored by examining Diff‐Quick‐stained (Lab Aids, Narrabeen, NSW, Australia) thin blood smears prepared from tail bleeds. Other read‐outs included hepatomegaly, splenomegaly, enlarged lymph nodes and haemozoin pigmentation during dissections. SIINFEKL/GFP‐expressing PbA (PbTG) and GFP‐expressing PbA (PbG) were a kind gift from Dr William Heath (University of Melbourne).
Clinical disease assessment
PbA‐infected mice were monitored for up to and including day 7 p.i. as reported. 17 From days 1 to 6 p.i., mice were assessed for minor clinical signs such as reduced activity, hair standing on end, prominent vertebral spinous processes/scapulae/pelvis, sunken eyes and/or hunched posture. Mice showing these minor clinical signs were referred to as being in ES. Each sign was given a score of 1. Mice developing ≥ 3 signs on days 1‐6 p.i. were euthanised in accordance with ethics guidelines. Otherwise, mice progressed to day 7 p.i. On day 7 p.i., mice were assessed for clinical signs of illness including reduced searching behaviour, hypothermia, ruffled fur, isolation from group and/or partial immobility, as well as loss of motor response including ataxia, muscular weakness, inability to grab the cage grid, inability to hold on to a rope and/or tendency to fit upon manipulation. Initially, mice exhibited clinical signs of illness and then progressed to show loss of motor response. Mice showing loss of motor responses were referred to as being in NS. Mice were given a score of 1 for each sign. Mice selected for intravital imaging showed no more than 4 signs indicating loss of motor response. All mice in the experimental study were euthanised on day 7 p.i. with the exception of some mice that showed no clinical signs, which were monitored for up to and including day 8 p.i. PbTG/PbG‐infected mice were monitored for up to and including day 10 p.i.
Flow cytometry
The method for preparation of BSL for flow cytometry has been reported. 17 Mice were sacrificed and perfused via the heart with 20 mL of perfusion fluid to remove blood contaminants from the cerebral vasculature. Brains were mashed between frosted glass slides in PBS and digested with collagenase type IV (Sigma, St. Louis, Missouri, USA) and DNase I (Sigma). Low‐density dead cells/debris/myelin were removed by resuspension in 30% Percoll followed by centrifugation. Cells obtained from the brain were suspended in 2% (v/v) FCS in PBS containing anti‐CD16/32 (2.4G2) (BD, New Jersey, USA) to block Fc receptors. Cells were labelled by incubating with fluorochrome‐labelled antibodies (see Supplementary table 1) diluted in FACS buffer for 30 min on ice after which cells were washed and stained with 0.5 μg mL−1 DAPI (Invitrogen, Carlsbad, California, USA) for dead cell exclusion. Data were acquired on a FACSCanto II (BD), LSRFortessa (BD) or LSR‐II flow cytometer (BD) and analysed using FlowJo software (Treestar, Ashland, Oregon, USA).
Immunohistochemistry
Mice were euthanised and perfused with 10% neutral buffered formalin in PBS. Brains were harvested and further fixed in 10% neutral buffered formalin (Sigma) and 4% w/v sucrose overnight at 4°C. Using a vibratome, longitudinal or superior transverse sections were prepared and blocked in 10% FCS. For some experiments, mice were injected WGA‐A594 (Life Technologies, Carlsbad, California, USA) i.v. prior to sacrifice to reveal blood vessels. In others, brain sections were stained with anti‐CD31 antibody (BD). Staining blood vessels with WGA prior to anti‐CD31 antibody treatment caused differential staining with PCV revealing as CD31+WGAlo and arterioles as WGA+CD31lo. Stained sections were mounted in Dako mounting medium. A series of single Z‐stack images were acquired at 1‐μm interval through a volume of 1000 μm using either a 20× or 63× oil objective of the Leica SP5 confocal microscope. Fluorochrome‐labelled antibodies used for immunohistochemistry are described in Supplementary table 1.
Cranial window preparation
A detailed protocol for the preparation of mice for 2P‐IVM has been previously published. 43 Briefly, mice were closely monitored for awareness signs and surgical procedures were initiated only after the animal entered a deep state of anaesthesia. 17 Anaesthetised mice were placed on a heat pad (Fine Science Tools, Foster City, California, USA), and core body temperature was monitored using a rectal probe (Fine Science Tools). The head of the mouse was restrained in a stereotaxic frame, and a circular incision was made in the parietal bone using a pneumatic dental drill to yield a cranial flap. The flap was lifted gently without damaging the dura mater underneath. Minor bleeding was controlled using gelfoam bits, and the cranial window was bathed in pre‐warmed artificial cerebrospinal fluid. The chamber was sealed with a coverslip held in place with vacuum grease.
2‐Photon intravital microscopy
A detailed protocol has been previously published. 43 The intravital imaging experiments were performed for no longer than 1.5 h. 17 , 43 Images were acquired using a LaVision BioTec TrimScope II single‐beam 2‐photon microscope (Gottingen, Germany) attached to an Olympus BX‐51 fixed‐stage microscope equipped with 20× (NA0.8) water immersion objective. The set‐up included external non‐descanned dual‐channel/fluorescence detectors and a diode‐pumped, wide‐band mode‐locked Ti:sapphire femtosecond laser (MaiTai HP; Spectra‐Physics, 720–1050 nm, pulse length 140 fs; 90 MHz repetition rate). TRITC‐conjugated dextran (800 μg) (Invitrogen) or Evans Blue conjugated to BSA was injected i.v. for labelling blood vessels. The brain was exposed to polarised laser light at a wavelength of 900 nm. Emitted light was separated with appropriate filter sets, and four photo‐multiplier tubes, including two ultrasensitive ones, were used for collecting light. To maximise our observations, we varied the area and depth of imaging, but x‐y‐t data were mostly acquired of a 300 μm × 300 μm plane at a resolution of 0.6 μm pixel−1 captured at the rate of 1 frame per second. As the limited scan speed of a point line scanner as used in our microscope set‐up can be restrictive, this strategy was useful while tracking leucocytes that roll along the endothelial wall at 20−50 μm s−1 52 . A minimum of 120 to maximum 1200 frames were collected and sometimes combined with 3‐dimensional z stacks to create x‐y‐z‐t time‐lapse images. For x‐y‐z‐t images, our set‐up allowed a maximal penetration depth of 250 μm of the meningeal and submeningeal parenchyma. Snapshots of x‐y‐z stacks were acquired at a maximal penetration depth of 1000 μm. For data acquisition, firstly a suitable field of view was selected in the upper left region of the cranial window. The next field of view was recorded by moving horizontally across to the next 300 μm × 300 μm plane within the cranial window as described previously. 17 , 43
Image analysis
Unless otherwise stated, image analysis was done using VoloCity (Perkin Elmer, Waltham, Massachusetts, USA). High‐resolution 4D x‐y‐z‐t raw data sets from 2P‐IVM experiments were imported into Imaris for 3D rendering (version 8.1.2; Bitplane, Zurich, Switzerland). Each blood vessel was initially assessed for intact blood flow, which was defined by the presence of at least one free‐flowing, high‐velocity leucocyte within a blood vessel and its tributaries for the entire observation period. Blood vessels were classified based on its (a) blood flow and/or (b) diameter. Based on (a), diverging vessels with outflow of blood were classified as arteries and converging vessels with inflow of blood were classified as veins. Based on (b), blood vessels of 0–8 μm diameter were defined as capillaries and > 8 μm diameter as arterioles (outflow) or PCV (inflow). PCVs were further sorted into 8–20 μm, 20–50 μm, 50–100 μm and 100–160 μm diameters. The area of a blood vessel was measured by multiplying its length and diameter. Abutting was defined as ≥ 1 PVM lining the length of a blood vessel.
Rolling, crawling and arrested cell behaviour have been reported elsewhere. 50 , 51 , 76 Rolling cells were defined as single, spherical cells moving in the direction of the blood flow at a lower speed than free‐flowing cells. Crawling cells were defined as single ovoid/elongated cells with a leading edge and a trailing uropod moving with or against the blood flow. Single cells that remained stationary for 20 s or longer were defined as ‘arrested’ cells. Crawling T cells could be further differentiated from arrested cells by their motility. The number of leucocytes in the blood vessel was defined as the average of the total number of rolling, adherent and crawling cells visualised per mm2 area of blood vessel per minute. Mean velocity (Vmean) was defined as the mean distance travelled by leucocytes in the blood vessel per second. Displacement rate was defined as the distance between the location of a cell at the start and end of an observation period of one minute. Meandering index was defined as displacement of a cell divided by its total length of track.
Distance between T cells and PVM was measured by calculating the length in µm between the centre point of a T cell and the outer perimeter of the nearest PVM. As some T cells extended pseudopodia rapidly in various directions, the centre point of a T cell, rather than its perimeter, was taken as a more reliable reference point for measuring distance. To calculate length, the body of PVM running parallel to the horizontal axis of the blood vessel was measured.
T‐cell isolation and adoptive transfer
T‐cell isolations were performed as described. 17 Cell isolations were performed in a biological safety cabinet to facilitate transfer under sterile conditions into immunodeficient mice. To obtain GFP+CD8+ T cells by positive selection, splenocytes from DPE‐GFP mice were disaggregated and labelled with CD8‐conjugated immunomagnetic beads (Miltenyi, Bergisch Gladbach, Germany) and subsequently sorted using a MACS system (Miltenyi). Further enrichment was achieved by passing the positive fraction through a second MACS column. Based on flow cytometry, approximately 92% of the cells in the positive fraction were CD3+CD8+ T cells, most of which expressed GFP (Supplementary figure 1c). Approximately 5% CD8+ T cells eluted into the CD8− splenocyte fraction. 17 For adoptive transfer experiments, DPE‐GFPxRAG‐1−/− recipient mice 6–8 weeks of age were initially infected i.p. with 106 pRBC, following which either 5, 10 or 22 × 106 MACS‐purified CD8+ T cells or CD8− splenocytes were adoptively transferred into recipient mice via the tail vein. Recipient mice were then selected based on disease stage.
For in vitro stimulation of RFP+OT‐I cells, 3–5 × 10⁶ splenocytes from mT/mG OT‐I mice 74 were incubated with OVA‐derived 0.5 μg mL−1 SIINFEKL peptide (Auspep, Tullamarine, VIC, Australia) and 10 ng mL−1 rIL‐2 in cell culture medium. After 48 h, cells were transferred to flasks and rIL‐2 was replenished every alternate day. After 6 days of culture, OT‐I CTL cells were 99% pure by flow cytometry. 5 × 10⁶ cells were injected i.v. into PbA‐infected mice on day 2 p.i.
Statistical analysis
Differences in survival of treatment groups were analysed using the Mantel–Cox log‐rank test. Correlations were calculated and plotted using Prism (GraphPad Prism; San Diego, California, USA). For comparison of two groups, the Student’s t‐test (normally distributed) or the Mann–Whitney U‐test (not normally distributed) was used. For multiple comparisons, one‐way ANOVA was used. A difference between groups was considered significant if P < 0.05.
Author contribution
Jim Qin: Formal analysis; Investigation; Methodology; Software; Validation; Visualization; Writing‐review & editing. Michael Lovelace: Formal analysis; Methodology; Software; Validation; Writing‐review & editing. Andrew Mitchell: Methodology; Validation; Writing‐review & editing. Tania de Koning‐Ward: Investigation; Methodology; Resources; Writing‐review & editing. Georges Grau: Conceptualization; Methodology; Resources; Supervision; Writing‐review & editing. Saparna Pai: Conceptualization; Data curation; Formal analysis; Investigation; Methodology; Project administration; Software; Supervision; Validation; Visualization; Writing‐original draft; Writing‐review & editing.
Conflict of interest
The authors declare no conflict of interest.
Supporting information
Acknowledgments
SP is funded by an AITHM Research Support Grant. TdKW is funded by an NHMRC Senior Research Fellowship. This research was funded by NHMRC Project Grant APP1099920 to GEG. We are deeply grateful to Dr Maria Wynne (USyd) for her advice on surgical procedures and animal welfare. We thank Dr Mate Biro (UNSW), Dr Louise Cole (formerly of Bosch Institute Advanced Microscopy Facility, USyd), Mr Chris Johnson (Perkin Elmer) and Mr Steven Chai (Bitplane/Andor) for help with microscopy/image analysis. We acknowledge the use of the Centenary Institute Microscopy Facility for image acquisition and analysis, and Garvan Institute Microscopy Facility Image Analysis Suite for Imaris 3D reconstructions.
References
- 1. WHO . World Malaria Report 2019. 2019. https://www.who.int/publications/i/item/9789241565721
- 2. Dondorp AM, Nosten F, Yi P et al. Artemisinin resistance in Plasmodium falciparum malaria. New Eng J Med 2009; 361: 455–467. [DOI] [PMC free article] [PubMed] [Google Scholar]
- 3. Miller LH, Baruch DI, Marsh K, Doumbo OK. The pathogenic basis of malaria. Nature 2002; 415: 673–679. [DOI] [PubMed] [Google Scholar]
- 4. Ghazanfari N, Mueller SN, Heath WR. Cerebral malaria in mouse and man. Front Immunol 2018; 9: 2016. [DOI] [PMC free article] [PubMed] [Google Scholar]
- 5. de Souza JB, Hafalla JC, Riley EM, Couper KN. Cerebral malaria: why experimental murine models are required to understand the pathogenesis of disease. Parasitology 2010; 137: 755–772. [DOI] [PubMed] [Google Scholar]
- 6. Wykes MN, Good MF. What have we learnt from mouse models for the study of malaria? Eur J Immunol 2009; 39: 2004–2007. [DOI] [PubMed] [Google Scholar]
- 7. Craig AG, Grau GE, Janse C et al. The role of animal models for research on severe malaria. PLoS Pathog 2012; 8: e1002401. [DOI] [PMC free article] [PubMed] [Google Scholar]
- 8. Grau GE, Fajardo LF, Piguet PF, Allet B, Lambert PH, Vassalli P. Tumor necrosis factor (cachectin) as an essential mediator in murine cerebral malaria. Science 1987; 237: 1210–1212. [DOI] [PubMed] [Google Scholar]
- 9. Baptista FG, Pamplona A, Pena AC, Mota MM, Pied S, Vigario AM. Accumulation of Plasmodium berghei‐infected red blood cells in the brain is crucial for the development of cerebral malaria in mice. Infect Immun 2010; 78: 4033–4039. [DOI] [PMC free article] [PubMed] [Google Scholar]
- 10. Engwerda C, Belnoue E, Gruner AC, Renia L. Experimental models of cerebral malaria. Curr Top Microbiol Immunol 2005; 297: 103–143. [PubMed] [Google Scholar]
- 11. Belnoue E, Kayibanda M, Vigario AM et al. On the pathogenic role of brain‐sequestered αβ CD8+ T cells in experimental cerebral malaria. J Immunol 2002; 169: 6369–6375. [DOI] [PubMed] [Google Scholar]
- 12. Lundie RJ, de Koning‐Ward TF, Davey GM et al. Blood‐stage Plasmodium infection induces CD8+ T lymphocytes to parasite‐expressed antigens, largely regulated by CD8α+ dendritic cells. Proc Natl Acad Sci USA 2008; 105: 14509–14514. [DOI] [PMC free article] [PubMed] [Google Scholar]
- 13. Swanson PA 2nd, Hart GT, Russo MV et al. CD8+ T cells induce fatal brainstem pathology during cerebral malaria via luminal antigen‐specific engagement of brain vasculature. PLoS Pathog 2016; 12: e1006022. [DOI] [PMC free article] [PubMed] [Google Scholar]
- 14. Nie CQ, Bernard NJ, Norman MU et al. IP‐10‐mediated T cell homing promotes cerebral inflammation over splenic immunity to malaria infection. PLoS Pathog 2009; 5: e1000369. [DOI] [PMC free article] [PubMed] [Google Scholar]
- 15. Miu J, Mitchell AJ, Muller M et al. Chemokine gene expression during fatal murine cerebral malaria and protection due to CXCR3 deficiency. J Immunol 2008; 180: 1217–1230. [DOI] [PubMed] [Google Scholar]
- 16. Nacer A, Movila A, Baer K, Mikolajczak SA, Kappe SH, Frevert U. Neuroimmunological blood brain barrier opening in experimental cerebral malaria. PLoS Pathog 2012; 8: e1002982. [DOI] [PMC free article] [PubMed] [Google Scholar]
- 17. Pai S, Qin J, Cavanagh L et al. Real‐time imaging reveals the dynamics of leukocyte behaviour during experimental cerebral malaria pathogenesis. PLoS Pathog 2014; 10: e1004236. [DOI] [PMC free article] [PubMed] [Google Scholar]
- 18. Haque A, Best SE, Unosson K et al. Granzyme B expression by CD8+ T cells is required for the development of experimental cerebral malaria. J Immunol 2011; 186: 6148–6156. [DOI] [PubMed] [Google Scholar]
- 19. Nitcheu J, Bonduelle O, Combadiere C et al. Perforin‐dependent brain‐infiltrating cytotoxic CD8+ T lymphocytes mediate experimental cerebral malaria pathogenesis. J Immunol 2003; 170: 2221–2228. [DOI] [PubMed] [Google Scholar]
- 20. Potter S, Chan‐Ling T, Ball HJ et al. Perforin mediated apoptosis of cerebral microvascular endothelial cells during experimental cerebral malaria. Int J Parasitol 2006; 36: 485–496. [DOI] [PubMed] [Google Scholar]
- 21. Shaw TN, Stewart‐Hutchinson PJ, Strangward P et al. Perivascular arrest of CD8+ T cells Is a signature of experimental cerebral malaria. PLoS Pathog 2015; 11: e1005210. [DOI] [PMC free article] [PubMed] [Google Scholar]
- 22. Ransohoff RM, Engelhardt B. The anatomical and cellular basis of immune surveillance in the central nervous system. Nat Rev Immunol 2012; 12: 623–635. [DOI] [PubMed] [Google Scholar]
- 23. Kawakami N, Flugel A. Knocking at the brain's door: intravital two‐photon imaging of autoreactive T cell interactions with CNS structures. Semin Immunopathol 2010; 32: 275–287. [DOI] [PMC free article] [PubMed] [Google Scholar]
- 24. Engelhardt B, Coisne C. Fluids and barriers of the CNS establish immune privilege by confining immune surveillance to a two‐walled castle moat surrounding the CNS castle. Fluids Barriers CNS 2011; 8: 4. 10.1186/2045-8118-8-4. [DOI] [PMC free article] [PubMed] [Google Scholar]
- 25. Williams K, Alvarez X, Lackner AA. Central nervous system perivascular cells are immunoregulatory cells that connect the CNS with the peripheral immune system. Glia 2001; 36: 156–164. [DOI] [PubMed] [Google Scholar]
- 26. Owens T, Bechmann I, Engelhardt B. Perivascular spaces and the two steps to neuroinflammation. J Neuropathol Exp Neurol 2008; 67: 1113–1121. [DOI] [PubMed] [Google Scholar]
- 27. Greter M, Heppner FL, Lemos MP et al. Dendritic cells permit immune invasion of the CNS in an animal model of multiple sclerosis. Nat Med 2005; 11: 328–334. [DOI] [PubMed] [Google Scholar]
- 28. Lapenna A, De Palma M, Lewis CE. Perivascular macrophages in health and disease. Nat Rev Immunol 2018; 18: 689–702. [DOI] [PubMed] [Google Scholar]
- 29. Davalos D, Ryu JK, Merlini M et al. Fibrinogen‐induced perivascular microglial clustering is required for the development of axonal damage in neuroinflammation. Nat Commun 2012; 3: 1227. [DOI] [PMC free article] [PubMed] [Google Scholar]
- 30. Nimmerjahn A, Kirchhoff F, Helmchen F. Resting microglial cells are highly dynamic surveillants of brain parenchyma in vivo . Science 2005; 308: 1314–1318. [DOI] [PubMed] [Google Scholar]
- 31. Barreiro O, Cibrian D, Clemente C et al. Pivotal role for skin transendothelial radio‐resistant anti‐inflammatory macrophages in tissue repair. eLife 2016; 5: e15251. [DOI] [PMC free article] [PubMed] [Google Scholar]
- 32. He H, Mack JJ, Guc E et al. Perivascular macrophages limit permeability. Arterioscler Thromb Vasc Biol 2016; 36: 2203–2212. [DOI] [PMC free article] [PubMed] [Google Scholar]
- 33. Barkauskas DS, Evans TA, Myers J, Petrosiute A, Silver J, Huang AY. Extravascular CX3CR1+ cells extend intravascular dendritic processes into intact central nervous system vessel lumen. Microsc Microanal 2013; 19: 778–790. [DOI] [PMC free article] [PubMed] [Google Scholar]
- 34. Stamatiades EG, Tremblay ME, Bohm M et al. Immune monitoring of trans‐endothelial transport by kidney‐resident macrophages. Cell 2016; 166: 991–1003. [DOI] [PMC free article] [PubMed] [Google Scholar]
- 35. Fantin A, Vieira JM, Gestri G et al. Tissue macrophages act as cellular chaperones for vascular anastomosis downstream of VEGF‐mediated endothelial tip cell induction. Blood 2010; 116: 829–840. [DOI] [PMC free article] [PubMed] [Google Scholar]
- 36. Baer C, Squadrito ML, Iruela‐Arispe ML, De Palma M. Reciprocal interactions between endothelial cells and macrophages in angiogenic vascular niches. Exp Cell Res 2013; 319: 1626–1634. [DOI] [PMC free article] [PubMed] [Google Scholar]
- 37. Medana IM, Chan‐Ling T, Hunt NH. Redistribution and degeneration of retinal astrocytes in experimental murine cerebral malaria: relationship to disruption of the blood‐retinal barrier. Glia 1996; 16: 51–64. [DOI] [PubMed] [Google Scholar]
- 38. Medana IM, Chan‐Ling T, Hunt NH. Reactive changes of retinal microglia during fatal murine cerebral malaria: effects of dexamethasone and experimental permeabilization of the blood‐brain barrier. Am J Pathol 2000; 156: 1055–1065. [DOI] [PMC free article] [PubMed] [Google Scholar]
- 39. Siffrin V, Radbruch H, Glumm R et al. In vivo imaging of partially reversible th17 cell‐induced neuronal dysfunction in the course of encephalomyelitis. Immunity 2010; 33: 424–436. [DOI] [PubMed] [Google Scholar]
- 40. Kawakami N, Nagerl UV, Odoardi F, Bonhoeffer T, Wekerle H, Flugel A. Live imaging of effector cell trafficking and autoantigen recognition within the unfolding autoimmune encephalomyelitis lesion. J Exp Med 2005; 201: 1805–1814. [DOI] [PMC free article] [PubMed] [Google Scholar]
- 41. Dorovini‐Zis K, Schmidt K, Huynh H et al. The neuropathology of fatal cerebral malaria in Malawian children. Am J Pathol 2011; 178: 2146–2158. [DOI] [PMC free article] [PubMed] [Google Scholar]
- 42. Hochman SE, Madaline TF, Wassmer SC et al. Fatal Pediatric cerebral malaria is associated with intravascular monocytes and platelets that are increased with HIV coinfection. MBio 2015; 6: e01390–e1315. [DOI] [PMC free article] [PubMed] [Google Scholar]
- 43. Pai S, Danne KJ, Qin J et al. Visualizing leukocyte trafficking in the living brain with 2‐photon intravital microscopy. Front Cell Neurosci 2013; 6: 67. 10.3389/fncel.2012.00067. [DOI] [PMC free article] [PubMed] [Google Scholar]
- 44. Mempel TR, Pittet MJ, Khazaie K et al. Regulatory T cells reversibly suppress cytotoxic T cell function independent of effector differentiation. Immunity 2006; 25: 129–141. [DOI] [PubMed] [Google Scholar]
- 45. Abtin A, Jain R, Mitchell AJ et al. Perivascular macrophages mediate neutrophil recruitment during bacterial skin infection. Nat Immunol 2014; 15: 45–53. [DOI] [PMC free article] [PubMed] [Google Scholar]
- 46. Mues M, Bartholomäus I, Thestrup T et al. Real‐time in vivo analysis of T cell activation in the central nervous system using a genetically encoded calcium indicator. Nat Med 2013; 19: 778–783. [DOI] [PubMed] [Google Scholar]
- 47. Kyratsous NI, Bauer IJ, Zhang G et al. Visualizing context‐dependent calcium signaling in encephalitogenic T cells in vivo by two‐photon microscopy. Proc Natl Acad Sci USA 2017; 114: e6381–e6389. [DOI] [PMC free article] [PubMed] [Google Scholar]
- 48. Moreau HD, Lemaître F, Garrod KR, Garcia Z, Lennon‐Duménil AM, Bousso P. Signal strength regulates antigen‐mediated T‐cell deceleration by distinct mechanisms to promote local exploration or arrest. Proc Natl Acad Sci USA 2015; 112: 12151–12156. [DOI] [PMC free article] [PubMed] [Google Scholar]
- 49. Cabrales P, Zanini GM, Meays D, Frangos JA, Carvalho LJM. Murine cerebral malaria is associated with a vasospasm‐like microcirculatory dysfunction, and survival upon rescue treatment is markedly increased by nimodipine. Am J Pathol 2010; 176: 1306–1315. [DOI] [PMC free article] [PubMed] [Google Scholar]
- 50. Masuzzo P, Huyck L, Simiczyjew A, Ampe C, Martens L, Van Troys M. An end‐to‐end software solution for the analysis of high‐throughput single‐cell migration data. Sci Rep 2017; 7: 42383. [DOI] [PMC free article] [PubMed] [Google Scholar]
- 51. Beltman JB, Marée AF, de Boer RJ. Analysing immune cell migration. Nat Rev Immunol 2009; 9: 789–798. [DOI] [PubMed] [Google Scholar]
- 52. Carvalho‐Tavares J, Hickey MJ, Hutchison J, Michaud J, Sutcliffe IT, Kubes P. A role for platelets and endothelial selectins in tumor necrosis factor‐alpha‐induced leukocyte recruitment in the brain microvasculature. Circ Res 2000; 87: 1141–1148. [DOI] [PubMed] [Google Scholar]
- 53. Lindquist RL, Shakhar G, Dudziak D et al. Visualizing dendritic cell networks in vivo . Nat Immunol 2004; 5: 1243–1250. [DOI] [PubMed] [Google Scholar]
- 54. Villegas‐Mendez A, Greig R, Shaw TN et al. IFN‐γ–producing CD4+ T cells promote experimental cerebral malaria by modulating CD8+ T cell accumulation within the brain. J Immunol 2012; 189: 968–979. [DOI] [PMC free article] [PubMed] [Google Scholar]
- 55. Tuteja R. Malaria ‐ an overview. FEBS J 2007; 274: 4670–4679. [DOI] [PubMed] [Google Scholar]
- 56. Grobusch MP, Kremsner PG. Uncomplicated malaria. Curr Top Microbiol Immunol 2005; 295: 83–104. [PubMed] [Google Scholar]
- 57. Galea I, Bernardes‐Silva M, Forse PA, van Rooijen N, Liblau RS, Perry VH. An antigen‐specific pathway for CD8 T cells across the blood‐brain barrier. J Exp Med 2007; 204: 2023–2030. [DOI] [PMC free article] [PubMed] [Google Scholar]
- 58. Bartholomaus I, Kawakami N, Odoardi F et al. Effector T cell interactions with meningeal vascular structures in nascent autoimmune CNS lesions. Nature 2009; 462: 94–98. [DOI] [PubMed] [Google Scholar]
- 59. Rescigno M, Urbano M, Valzasina B et al. Dendritic cells express tight junction proteins and penetrate gut epithelial monolayers to sample bacteria. Nat Immunol 2001; 2: 361–367. [DOI] [PubMed] [Google Scholar]
- 60. Patel SN, Serghides L, Smith TG et al. CD36 mediates the phagocytosis of Plasmodium falciparum‐infected erythrocytes by rodent macrophages. J Infect Dis 2004; 189: 204–213. [DOI] [PubMed] [Google Scholar]
- 61. Hansen DS, Bernard NJ, Nie CQ, Schofield L. NK cells stimulate recruitment of CXCR3+ T cells to the brain during Plasmodium berghei‐mediated cerebral malaria. J Immunol 2007; 178: 5779–5788. [DOI] [PubMed] [Google Scholar]
- 62. Howland SW, Poh CM, Gun SY et al. Brain microvessel cross‐presentation is a hallmark of experimental cerebral malaria. EMBO Mol Med 2013; 5: 916–931. [DOI] [PMC free article] [PubMed] [Google Scholar]
- 63. Howland SW, Poh CM, Renia L. Activated brain endothelial cells cross‐present malaria antigen. PLoS Pathog 2015; 11: e1004963. [DOI] [PMC free article] [PubMed] [Google Scholar]
- 64. Goldmann T, Wieghofer P, Jordao MJ et al. Origin, fate and dynamics of macrophages at central nervous system interfaces. Nat Immunol 2016; 17: 797–805. [DOI] [PMC free article] [PubMed] [Google Scholar]
- 65. Suidan GL, McDole JR, Chen Y, Pirko I, Johnson AJ. Induction of blood brain barrier tight junction protein alterations by CD8 T cells. PLoS One 2008; 3: e3037. [DOI] [PMC free article] [PubMed] [Google Scholar]
- 66. Nacer A, Movila A, Sohet F et al. Experimental cerebral malaria pathogenesis–hemodynamics at the blood brain barrier. PLoS Pathog 2014; 10: e1004528. [DOI] [PMC free article] [PubMed] [Google Scholar]
- 67. Prakash MD, Munoz MA, Jain R et al. Granzyme B promotes cytotoxic lymphocyte transmigration via basement membrane remodeling. Immunity 2014; 41: 960–972. [DOI] [PubMed] [Google Scholar]
- 68. Schumak B, Klocke K, Kuepper JM et al. Specific depletion of Ly6Chi inflammatory monocytes prevents immunopathology in experimental cerebral malaria. PLoS One 2015; 10: e0124080. [DOI] [PMC free article] [PubMed] [Google Scholar]
- 69. Belnoue E, Costa FT, Vigario AM et al. Chemokine receptor CCR2 is not essential for the development of experimental cerebral malaria. Infect Immun 2003; 71: 3648–3651. [DOI] [PMC free article] [PubMed] [Google Scholar]
- 70. Claser C, Malleret B, Gun SY et al. CD8+ T Cells and IFN‐γ mediate the time‐dependent accumulation of infected red blood cells in deep organs during experimental cerebral malaria. PLoS One 2011; 6: e18720. [DOI] [PMC free article] [PubMed] [Google Scholar]
- 71. Engwerda CR, Mynott TL, Sawhney S, De Souza JB, Bickle QD, Kaye PM. Locally up‐regulated lymphotoxin α, not systemic tumor necrosis factor α, is the principle mediator of murine cerebral malaria. J Exp Med 2002; 195: 1371–1377. [DOI] [PMC free article] [PubMed] [Google Scholar]
- 72. de Kossodo S, Grau GE. Profiles of cytokine production in relation with susceptibility to cerebral malaria. J Immunol 1993; 151: 4811–4820. [PubMed] [Google Scholar]
- 73. Purbhoo MA, Irvine DJ, Huppa JB, Davis MM. T cell killing does not require the formation of a stable mature immunological synapse. Nat Immunol 2004; 5: 524–530. [DOI] [PubMed] [Google Scholar]
- 74. Muzumdar MD, Tasic B, Miyamichi K, Li L, Luo L. A global double‐fluorescent Cre reporter mouse. Genesis 2007; 45: 593–605. [DOI] [PubMed] [Google Scholar]
- 75. Jayawardena AN, Targett GA, Carter RL, Leuchars E, Davies AJ. The immunological response of CBA mice to P. yoelii. I. General characteristics, the effects of T‐cell deprivation and reconstitution with thymus grafts. Immunology 1977; 32: 849–859. [PMC free article] [PubMed] [Google Scholar]
- 76. Meijering E, Dzyubachyk O, Smal I. Methods for cell and particle tracking. Meth Enzymol 2012; 504: 183–200. [DOI] [PubMed] [Google Scholar]
Associated Data
This section collects any data citations, data availability statements, or supplementary materials included in this article.
Supplementary Materials