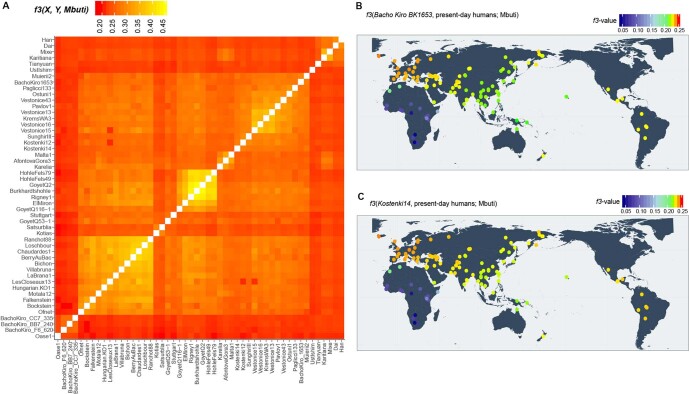
Extended Data Fig. 3. Heatmaps of outgroup f3-statistics corresponding to the amount of shared genetic drift between individuals and/or populations.
a, Genetic clustering of ancient individuals, including the IUP Bacho Kiro Cave, BK1653 and Oase1 individuals based on the amount of shared genetic drift and calculated as f3(ancient1, ancient2; Mbuti). Lighter colours in this panel indicate higher f3 values and correspond to higher shared genetic drift (nsnps = 2,056,573). b, c, Shared genetic drift between the approximately 35,000-year-old BK1653 (b; nsnps = 825,379) or approximately 38,000-year-old Kostenki14 individuals29,30 (c; nsnps = 1,676,430) and present-day human populations from the SGDP31 calculated as f3(Bacho Kiro BK1653/Kostenki14, present-day humans; Mbuti). Three Mbuti individuals from the same panel31 were used as an outgroup. Higher f3 values47 are indicated with warmer colours and correspond to higher shared genetic drift. Plotted f3 values were calculated using ADMIXTOOLS28 as implemented in admixr61. Coordinates for present-day humans were previously published31. The heatmap scale is consistent with those in Fig. 2a, Supplementary Figs. 5.1, 5.2.

