

Abstract
Mutations in genes regulating mTOR pathway signaling are now recognized as a significant cause of epilepsy. Interestingly, these mTORopathies are often caused by somatic mutations, affecting variable numbers of neurons. To better understand how this variability affects disease phenotype, we developed a mouse model in which the mTOR pathway inhibitor Pten can be deleted from 0 to 40% of hippocampal granule cells. In vivo, low numbers of knockout cells caused focal seizures, while higher numbers led to generalized seizures. Generalized seizures coincided with the loss of local circuit interneurons. In hippocampal slices, low knockout cell loads produced abrupt reductions in population spike threshold, while spontaneous excitatory postsynaptic currents and circuit level recurrent activity increased gradually with rising knockout cell load. Findings demonstrate that knockout cells load is a critical variable regulating disease phenotype, progressing from subclinical circuit abnormalities to electrobehavioral seizures with secondary involvement of downstream neuronal populations.
Keywords: mTOR, Pten, epileptogenesis, dentate granule cell, dentate gate, optogenetics
1. Introduction
Over the last decade, mutations in genes regulating the mechanistic target of rapamycin (mTOR) pathway have been identified as a significant cause of epilepsy, intellectual disability, and autism. To date, 14 genes have been identified, including tuberous sclerosis complex (TSC), phosphatase and tensin homologue (PTEN) and mTOR itself (Crino, 2020). In many of these conditions, mutations are the result of somatic mutations (Koh et al., 2018), producing pathological findings ranging from discrete regions of cortex characterized by dysplastic neurons (focal cortical dysplasia) to involvement of an entire brain hemisphere (hemimegaloencephaly). While gross lesion size correlates well with disease severity (Marsan and Baulac, 2018), exactly how lesions produce epilepsy - particularly lesions of smaller size - is not known. Understanding how focal mTORopathies produce epilepsy, establishing the lower bound for disease-producing lesion size and determining whether pathology is restricted to mutant neurons are all important questions (Nguyen et al., 2019) that remain to be fully addressed. In addition, excessive mTOR signaling is implicated in acquired epilepsies without an identified genetic cause (Macias et al., 2013; Okamoto et al., 2010; Sun et al., 2013; Talos et al., 2012; Zhang and Wong, 2012; Talos et al., 2018), so findings are likely to have relevance to these conditions as well.
To begin to elucidate the mechanisms of mTOR-driven pathology and dysfunction, we developed a tamoxifen-inducible Gli1-CreERT2, Ptenflox/flox mouse model of epilepsy. Gli1 is a transcription factor in the sonic hedgehog pathway that regulates neuronal progenitor cell proliferation. In postnatal brain, Gli1 expression is restricted to small numbers of astrocytes (<1%), neural progenitors in the subventricular zone, which produces olfactory neurons and neural progenitors in the hippocampal subgranular zone, which produces granule cells (Pun et al., 2012). Tamoxifen treatment of these animals activates CreERT2, leading to cre-mediated recombination of floxed target sequences in the progenitor cells and all subsequent daughter cells. Neurogenesis declines with age, so the number of recombined cells can be increased or decreased by injecting younger or older animals, respectively, and by altering tamoxifen dose. By manipulating these variables, we have been able to generate animals with variable percentages or “loads” of hippocampal granule cells lacking Pten. Pten KO granule cells exhibit somatic hypertrophy, excess axonal and dendritic growth and increased excitatory synaptic drive (LaSarge et al., 2015; 2016; 2019; Santos et al., 2017). The animals develop seizures, which originate from the hippocampus and can be inhibited with the mTOR antagonist rapamycin (Pun et al., 2012). For the present study, the load of abnormal, Pten knockout (KO) granule cells was modulated from 0–40%. Findings demonstrate that low KO cell loads produce a pre-clinical epileptic state characterized by behaviorally occult focal seizures and network hyperexcitability. Higher loads further enhance network excitability, lead to the onset of behavioral seizures and induce cell loss.
2. Methods and Materials
2.1. Mice
All animal studies were in accordance with the NIH Guide for the Care and Use of Laboratory Animals and were approved by the CCHMC Institutional Animal Care and Use Committee (IACUC).
Gli1-CreERT2-expressing mice (RRID: IMSR_ JAX STRAIN#007913; (Ahn and Joyner, 2004; Ahn and Joyner, 2005)) were crossed with Ptentm1Hwu/J mice (RRID: IMSR_JAX STRAIN #006440) which contain loxP sites on either side of exon 5 of the Pten gene (Pten “floxed” mice). Study animals were generated by crossing Gli1-CreERT2 hemizygous, Ptenflox/wt male mice with Ptenflox/wt female mice. Mice carrying the 129S-Gt(ROSA)26Sortm35.1(CAG-aop3/GFP)Hze/J gene for Archaerhodopsin with a GFP fusion protein (Arch; RRID: IMSR_JAX STRAIN #012735) were crossed with the Gli1-CreERT2, Ptenflox/wt line to create mice that selectively expressed Arch on dentate granule cells born following tamoxifen administration. In addition, a subset of mice carried a single copy of either a Cre inducible eGFP reporter (CAG-CAT-EGFP, (Nakamura et al., 2006)) or a tdTomato reporter (RRID: IMSR_JAX STRAIN #007914). Three mice used for EEG analysis carried the DREADD receptor (HA-hM4Di-pta-mCitrine, RRID: IMSR_JAX STRAIN #026219). These animals were controls for another study, and no animals in the present study received the DREADD receptor ligand (clozapine N-oxide [CNO]). Animal genotype data is provided in supplemental tables 1–5. All mice were maintained on a C57BL/6 background, and littermate controls were used when possible. All data collection and analyses were conducted with investigators blind to animal treatment and genotype.
2.2. EEG analysis
Animals for hippocampal and cortical seizure monitoring experiments ranged in age from 2–5 months, with an average age of 2.9 ± 0.53 months for hippocampal controls, 3.9 ± 0.37 for cortical controls, 4.3 ± 0.35 for hippocampal-recorded KOs and 3.9 ± 0.29 for cortical-recorded KOs (two way ANOVA for recording site [p=0.510] and group [p=0.106]). All hippocampal-recorded animals received a single subcutaneous 250 mg/kg dose of tamoxifen on P21. To generate a larger range of KO cell loads, animals implanted with cortical electrodes received either a single 250 mg/kg dose on P21 or two doses (one each on P21 and P23), except for Gli1-CreERT2 controls. Pooling data from hippocampal and cortical-recorded animals, single P21 injections (n=17) produced a mean KO cell load of 6.9 ± 1.3% of granule cells, while double injections (n=5) produced a mean load of 19.4 ± 1.2% (p<0.0001). Animal genotype and sex are provided in supplemental tables 1 and 2.
Control and Pten KO mice were implanted with cortical surface electrodes or hippocampal depth electrodes connected to wireless EEG transmitters (TA11ETA-F10, Data Sciences International, St. Paul, MN). Cortical electrodes were placed under the skull above the dura, bilaterally (1.5 mm lateral and 2.7 mm posterior to bregma). Hippocampal depth electrodes (2.2 mm in depth from skull) were implanted at 1.7 mm lateral and 1.8 – 2.0 mm posterior to bregma (Paxinos and Franklin, 2001). Mice were provided with Carprofen (40 mg/kg) for pain post-surgery, and antibacterial ointment was applied to the wound for 3 days. 24/7 video-EEG data was reviewed using Neuroscore software (Version 2.1.0, Data Sciences International) to identify seizures. EEG events scored as seizures were characterized by the sudden onset of high amplitude (>2x background) activity, signal progression (a change in amplitude and frequency over the course of the event) and a duration greater than 10 s. At the end of recording, mice were overdosed with pentobarbital (100 mg/kg) and perfused with phosphate buffered saline (PBS) +1U/ml heparin, followed by 2.5% paraformaldehyde with 4% sucrose in PBS (pH 7.4). Brains were post-fixed overnight, cryoprotected, frozen and stored at −80°C. Frozen brains were sectioned sagittally on a cryostat at 40 μm. Sections were mounted to gelatin-coated slides and stored at −80°C until use.
2.3. Hippocampal slice preparation for intracellular and extracellular recordings
Hippocampal slices were prepared for physiological recordings and histology as follows. Mice were anesthetized with pentobarbital (i.p., 0.05 ml, 100 mg/ml), perfused intracardially with ice-cold modified ACSF of the following composition (mM): NaCl (92); KCl (2.5); NaH2PO4 (1.25); NaHCO3 (30); MgSO4 (10); CaCl2 (0.5); sodium pyruvate (3); Thiourea (2); sodium ascorbate (5); Glucose (25); HEPES (20). The brain was removed and bisected. The right hemisphere was used for physiological recordings, while the left hemisphere was immediately put into fixative (2.5% formaldehyde in 4% sucrose with 0.1M PBS) for histological studies. Left hemispheres were fixed overnight, cryo-protected, frozen, and stored at −80°C.
For physiological recordings, 350 μm thick transverse slices were made from the right hemisphere as described by Jones and Heinemann (1988). Sections were prepared on a tissue slicer (Campden/Lafayette Instrument, IN). Individual slices were transferred to an oxygenated N-methyl-D-glutamine (NMDG)-based medium (similar to modified ACSF, except NaCl was substituted with NMDG (92mM)) and equilibrated for 60 minutes at room temperature (Ting et al., 2014). Slices were transferred into oxygenated recording ACSF for 60 minutes. Recording ACSF was of the following composition and concentration (mM): NaCl (124); KCl (3.5); MgSO4 (2); CaCl2 (2); NaH2PO4 (1.25); glucose (10); NaHCO3 (26).
2.4. Intracellular recordings
Animals used for intracellular recordings of spontaneous excitatory synaptic currents (sEPSCs) are described in detail in supplemental table 3. This experiment included 20 cells from 13 control mice (1–3 cells/mouse), and 38 cells from 28 KO mice (1–3 cells/mouse). Separate portions of this data set have been published previously (Santos et al., 2017). Animals were treated with 250 mg/kg tamoxifen on P14 or P21 (except for Gli1-CreERT2 +/− controls). Control mice were 4.1 ± 0.42 months old, while Pten KO mice were 3.38 ± 0.26 months (p=0.191, M-W RST) at the time of recordings. For intracellular experiments, individual slices were placed in a chamber on the stage of an upright microscope (Nikon, Eclipse FNI) and continuously perfused with ACSF oxygenated with 95% O2:5% CO2 at a rate of 3–4 ml/minute at room temperature. Recording electrodes were fabricated from thin-walled borosilicate glass pipettes with an outer diameter of 1.5 mm using a computer-controlled BB-CH-PC micropipette puller (Mecanex, Switzerland). Electrodes were filled with a solution composed (in mM) of K gluconate (135); KCl (5); NaCl (5); EGTA (5); HEPES (10); MgCl2 (2); glucose (10); supplemented with 2 mM ATP and 200 μM GTP (free Ca2+ level is estimated to be below 10nM). This solution had a pH of 7.2 and an osmolarity between 290–295 mOs. Whole cell (patch clamp) recording was conducted using a “blind” approach in which a blunt-tipped patch electrode (Pinault, 1996) was placed over the granule cell body layer. The electrode was then lowered into the cell body layer without the use of optics. The first cell for which a stable membrane seal was obtained was recorded at −70 mV to capture sEPSCs. Electrode resistance was 6–7 Mohms. Recordings were made with an Axopatch 200B amplifier (Molecular Devices) controlled by Clampex software (version 10.3) with a Digidata interface (Model 1440, Molecular Devices).
Following physiological recordings, cells were filled with 0.2% biocytin. Slices were fixed overnight in a solution of 2.5% paraformaldehyde with 4% sucrose in PBS. Biocytin labeling was revealed by incubating the slices for 2 hours at 25°C in 1:300 streptavidin-Alexa Fluor 488 conjugate (Molecular Probes Cat# S32354, RRID: AB_2315383). Slices were cover-slipped with ProLong Gold Antifade mounting media (Molecular Probes, Life Technologies, Cat# P10144) and stored at 4°C until imaging. Biocytin-filled cells were imaged using a Nikon A1Rsi inverted microscope (software RRID:SCR_014329) equipped with a 40X Plan Apo water immersion objective (NA=1.15; field size 317 × 317 μm; 0.5 μm z-step) to determine soma area. Pten KO cells were identified as cells with soma areas greater than two standard deviations above the mean soma area for control (Pten-expressing) cells. This criterion has been validated by Pten-immunohistochemistry in prior work (LaSarge et al., 2019).
The amplitude and frequency of sEPSCs was obtained using the Template Search program in Clampfit (Molecular Devices, version 10.7). Briefly, a template for the EPSC for each cell was generated by averaging many individual synaptic currents of similar time course from the first file. The method is based on the template search approach as described in Clements and Bekkers (Clements and Bekkers, 1997). This template was then used to screen for events in the remaining files from that cell (3–6 files/cell, 30 secs duration each). Events were manually selected to ensure that they were indeed of the appropriate fit (to the time course). The detection level was set at 2 pA. All the events from each cell were collected. The histogram was plotted and fit with Gaussian function to obtain the amplitude for that cell. Amplitudes from a total of 3101 sEPSCs were measured from control cells, and 6744 from KO cells. Measurements for each cell were then averaged, and averages were used for statistical analysis.
2.5. Extracellular recordings for optogenetic cell-silencing experiments
To silence Pten KO cells using optogenetics, Gli1-CreERT2, Ptenflox/flox, Archflox/flox mice were generated (Arch+ KO). Control groups included Gli1-CreERT2, Ptenwt/wt, Archflox/flox with Arch expression in a subset of wildtype (Pten+/+) granule cells (Arch+ control), and Gli1-CreERT2, Ptenflox/flox KO mice with no Arch expression (No Arch KO) to control for non-specific laser effects (Supplemental Table 4). All animals were treated with a single dose of 250 mg/kg tamoxifen on P14 or P21 to generate a range of KO cell loads. Animals for optogenetic studies ranged in age from 2 – 5.5 months, with mean ages of 4.79 ± 0.27 months for Arch+ controls, 4.33 ± 0.20 for no Arch KOs, and 3.46 ± 0.21 for Arch+ KOs (F=7.56, p=0.003, ANOVA). Arch+ KOs were significantly younger than Arch+ controls (p=0.005) and no Arch KOs (p=0.032). However, high KOs were previously shown to have a mean age of mortality around 2.2 months (Pun et al., 2012), and the younger ages of the Arch+ KOs are correlated with high KO percentages (R= −0.592, p=0.0123, Pearson Correlation with Arch+ KOs).
Hippocampal slices transferred to an interface chamber were maintained at 32–33°C with a 1.5 ml/min flow of oxygenated ACSF. A bipolar stimulating electrode connected to a constant current source was placed in the outer dentate molecular layer to activate the lateral perforant path. Evoked potentials were recorded with a ~1 mOhm ACSF-filled glass electrode placed in the dentate granule cell layer. Glass pipettes were fabricated from capillary tubing (external diameter, 1.5 mm) by a Mecanex-BB-CH puller. Evoked potentials were digitized with a Digidata 1400A A/D-D/A converter controlled by Clampex software (pClamp, RRID:SCR_011323; version 10.3, Molecular Devices, Sunnyvale, CA). For optogenetic light stimulation, a fiber optic cable (400μm diameter) attached to a TTL pulse controlled 100 mW 589nm yellow diode-pumped solid-state laser (Opto Engine, Midvale, UT) was positioned 2 cm above the dentate gyrus of the slice with laser power adjusted to 12 mW. The laser was controlled by the Clampex software. During the “laser on” condition the laser would turn on for one second prior to lateral perforant path stimulation, and it would remain on throughout the recording duration. Field potential response characteristics were obtained for each slice using increasing current stimulation, with 15 stimulations separated by 10 seconds, for each intensity (20 to 100 μA in 20 μA increments, followed by 100 to 600 μA in 100 μA increments). These 15 stimulations were separated into an initial 5 stimulations without the laser light (baseline), 5 stimulations with the light on, and a final 5 stimulations without the laser light (recovery).
fEPSPs were defined as an initial peak occurring within 5 msec of the stimulus artifact, with an exponential decay. The minimum intensity to evoke a fEPSP in the baseline condition was considered fEPSP threshold. Population spikes were defined as negative deflections following the EPSP of at least 200 μV (which was always greater than 5 times baseline), followed by a positive going signal. Population spike threshold was defined as the lowest amount of current necessary to evoke a population spike in the baseline condition. To calculate line length, the response from each stimulation was downloaded from pClamp into a Microsoft Excel file (v 2013, Microsoft Corp., RRID:SCR_016137), beginning from 20% into the fEPSP and for the following 100 msec. Line lengths were calculated from the baseline, laser on, and recovery responses for 100 and 400 μA of stimulation in MATLAB (v. 9.2; RRID:SCR_001622) using the time (sec) and signal (μV) variables.
2.6. Studies of inhibitory interneuron numbers
For stereological quantification of inhibitory interneurons, Gli1-CreERT2, Ptenflox/flox mice were compared to Gli1-CreERT2 negative, Ptenflox/flox (flox controls) mice. Both groups were injected with 250 mg/Kg tamoxifen on P14 (supplemental table 5). As an additional control group, Gli1-CreERT2, Ptenflox/flox that did not receive tamoxifen were also included. Within controls, tamoxifen injection did not significantly impact any measure presented here (data not shown), so groups were merged. Groups did not differ by age (Control, 11.04 ± 0.93 weeks; Pten KOs; 11.91 ± 0.84 weeks).
Somatostatin (SST), neuropeptide Y (NPY), and parvalbumin (PV) triple-immunostaining was performed on immersion fixed tissue. Tissue was selected from a 1:4 series of brain sections cut sagittally throughout dorsal hippocampus (approximately 0.36 – 2.28 mm lateral to the midline; (Paxinos and Franklin, 2001)). A complete series in each animal consisted of approximately twelve 40 μm thick tissue sections. Tissue was incubated overnight with rat anti-SST (1:200; Millipore Cat# MAB354, RRID:AB_2255365), rabbit anti-NPY (1:300; Sigma-Aldrich Cat# N9528, RRID:AB_260814), and guinea pig anti-PV (1:1000; Synaptic Systems Cat# 195 004, RRID:AB_2156476) antibodies in a 5% normal goat serum and 1.5% Triton-100 PBS solution. Tissue was washed and incubated for 4 hours in Alexa Fluor 488 goat anti-rat (Thermo Fisher Scientific Cat# A-11006, RRID:AB_2534074), 568 goat anti-rabbit (Thermo Fisher Scientific Cat# A-11011, RRID:AB_143157), and 647 goat anti-guinea pig (all 1:750, Thermo Fisher Scientific Cat# A-21450, RRID:AB_2735091) antibodies before coverslipping with ProLong Glass containing NucBlue (Thermo Fisher Scientific Cat #P36981).
The correlations between inhibitory interneurons and PTEN knockout cell percentages were investigated using tissue collected from mice in the optogenetic silencing physiology experiments (mouse details available in supplemental table 4). Sagittal cut sections (40 μm thick) that included the dorsal hippocampus were selected from a region located approximately 0.64 to 1.36 mm lateral to the midline. Tissue was incubated overnight in rat anti-SST, rabbit anti-NPY, and guinea pig anti-PV antibodies, as described earlier. Tissue was washed and incubated for 4 hours in Alexa Fluor 568 goat anti-rat (1:750, Thermo Fisher Scientific Cat# A-11077, RRID:AB_141874), Alexa Fluor 647 goat anti-rabbit (1:750, Thermo Fisher Scientific Cat# A-21244, RRID:AB_2535812) and DyLight 405 goat anti-guinea pig (1:750, Jackson Immuno Cat# 106-475-003, RRID: AB_2337432) antibodies. Tissue was counterstained with NeuroTrace 500/525 (1:750, Thermo Fisher Scientific Cat# N21480). Slides were coverslipped with ProLong Glass (Thermo Fisher Scientific Cat #P36980).
SST/ NPY/ PV triple-immunostaining in the dentate gyrus was imaged at a 0.5 μm step through the z-axis using a Nikon A1+ inverted microscope equipped with 10X (NA 0.45) and 60X (NA 1.27) water-immersion objectives (Nikon Instruments Inc.). Scanning began 3 μm below the tissue surface to exclude damaged areas. Image resolution was 0.21 μm/px. For analysis, image stacks were loaded into Neurolucida using the serial section manager. SST-, NPY- and PV-immunoreactive neurons were counted in each section throughout the dentate. Contours were used to distinguish the granule cell layer and hilus from the molecular layer. Data was exported into Microsoft Excel (v 2013, Microsoft Corp., RRID:SCR_016137), where cell counts were combined for each individual animal.
2.7. Immunohistochemistry to establish Pten KO cell loads
To establish Pten KO cell percentages in the dentate gyrus, brain sections were immunostained with rabbit anti-Pten (Phosphatase and tensin homolog, 1:250, Cell Signaling Technology Cat# 9559 RRID:AB_390810) followed by Alexa Fluor 594 goat anti-rabbit secondary antibodies (1:750, Thermo Fisher Scientific Cat# A11012 RRID: AB_10562717). Sections were counterstained with NeuroTrace 640/660 (1:300, Thermo Fisher Scientific Cat# N21483: AB_2572212). Between two and four 40 μm slide-mounted brain sections from each animal were examined. Brain sections corresponded to medial-lateral coordinates 1.3 – 1.7 mm (Paxinos and Franklin, 2001).
Pten/NeuroTrace imaging was used to estimate the percentage of knockout cells in each mouse. Pten/NeuroTrace immunostained sections were imaged with a Leica SP5 inverted microscope (software RRID: SCR_013673) equipped with 63X oil objective (NA=1.4, field size 248 × 248 μm) or a Nikon A1R inverted microscope (software RRID:SCR_014329) equipped with a 60X water objective (NA=1.27, field size 215 × 215 μm). Confocal z-series image stacks were collected through 11 μm of tissue at a 0.5 μm step, excluding the top 1–2 μm of tissue to avoid sectioning artifacts. Image stacks were imported into Neurolucida software (Microbrightfield Inc., RRID: SCR_001775) and a modification of the optical dissector method was used to determine the percentage Pten negative granule cells stained with NeuroTrace over the total number of NeuroTrace stained cells (Pun et al., 2012).
2.8. Statistics
Analysis of epilepsy phenotype by sex showed no differences (data not shown); therefore, males and females were added together in control and Pten KO groups. There were also no sex differences between control and Pten KOs for inhibitory cell densities (t=−0.228, n.s.), and males and females were grouped for all subsequent analyses. Due to low n’s, however, the lack of a sex effect should be interpreted cautiously. All results are presented as mean ± SEM or medians [range]. Statistical tests were performed using Sigma Plot software (version 14.0, Systat Software, Inc., RRID: SCR_003210). Parametric tests were used for data that met assumptions of normality and equal variance, and nonparametric equivalents were used for data that did not meet these assumptions. Specific tests were used as noted in the results. Results were considered significant if p <0.05.
2.9. Figure preparation
Microscopy images are either single confocal optical sections or confocal maximum projections, except for neuron images shown in Figure 1A. These are neuronal reconstructions generated using a process developed by Walter and colleagues (Walter et al., 2007). Graphs were prepared using GraphPad Prism (version 8.0.1, GraphPad Software, RRID:SCR_002798) and SigmaPlot Software. Figures were prepared using Adobe Photoshop (version 12.0.1, Adobe Photoshop, RRID:SCR_014199). Figures created using BioRender are specified in the legend. Some images were adjusted using Nikon NIS-Elements (NIS-Elements, RRID:SCR_014329) with a median filter (radius = 3) to reduce background artifact. Brightness and contrast of digital images were adjusted to optimize cellular detail. Identical adjustments were made to all images meant for comparison.
Figure 1. Increases in Pten KO cells are correlated with more severe epilepsy phenotype.
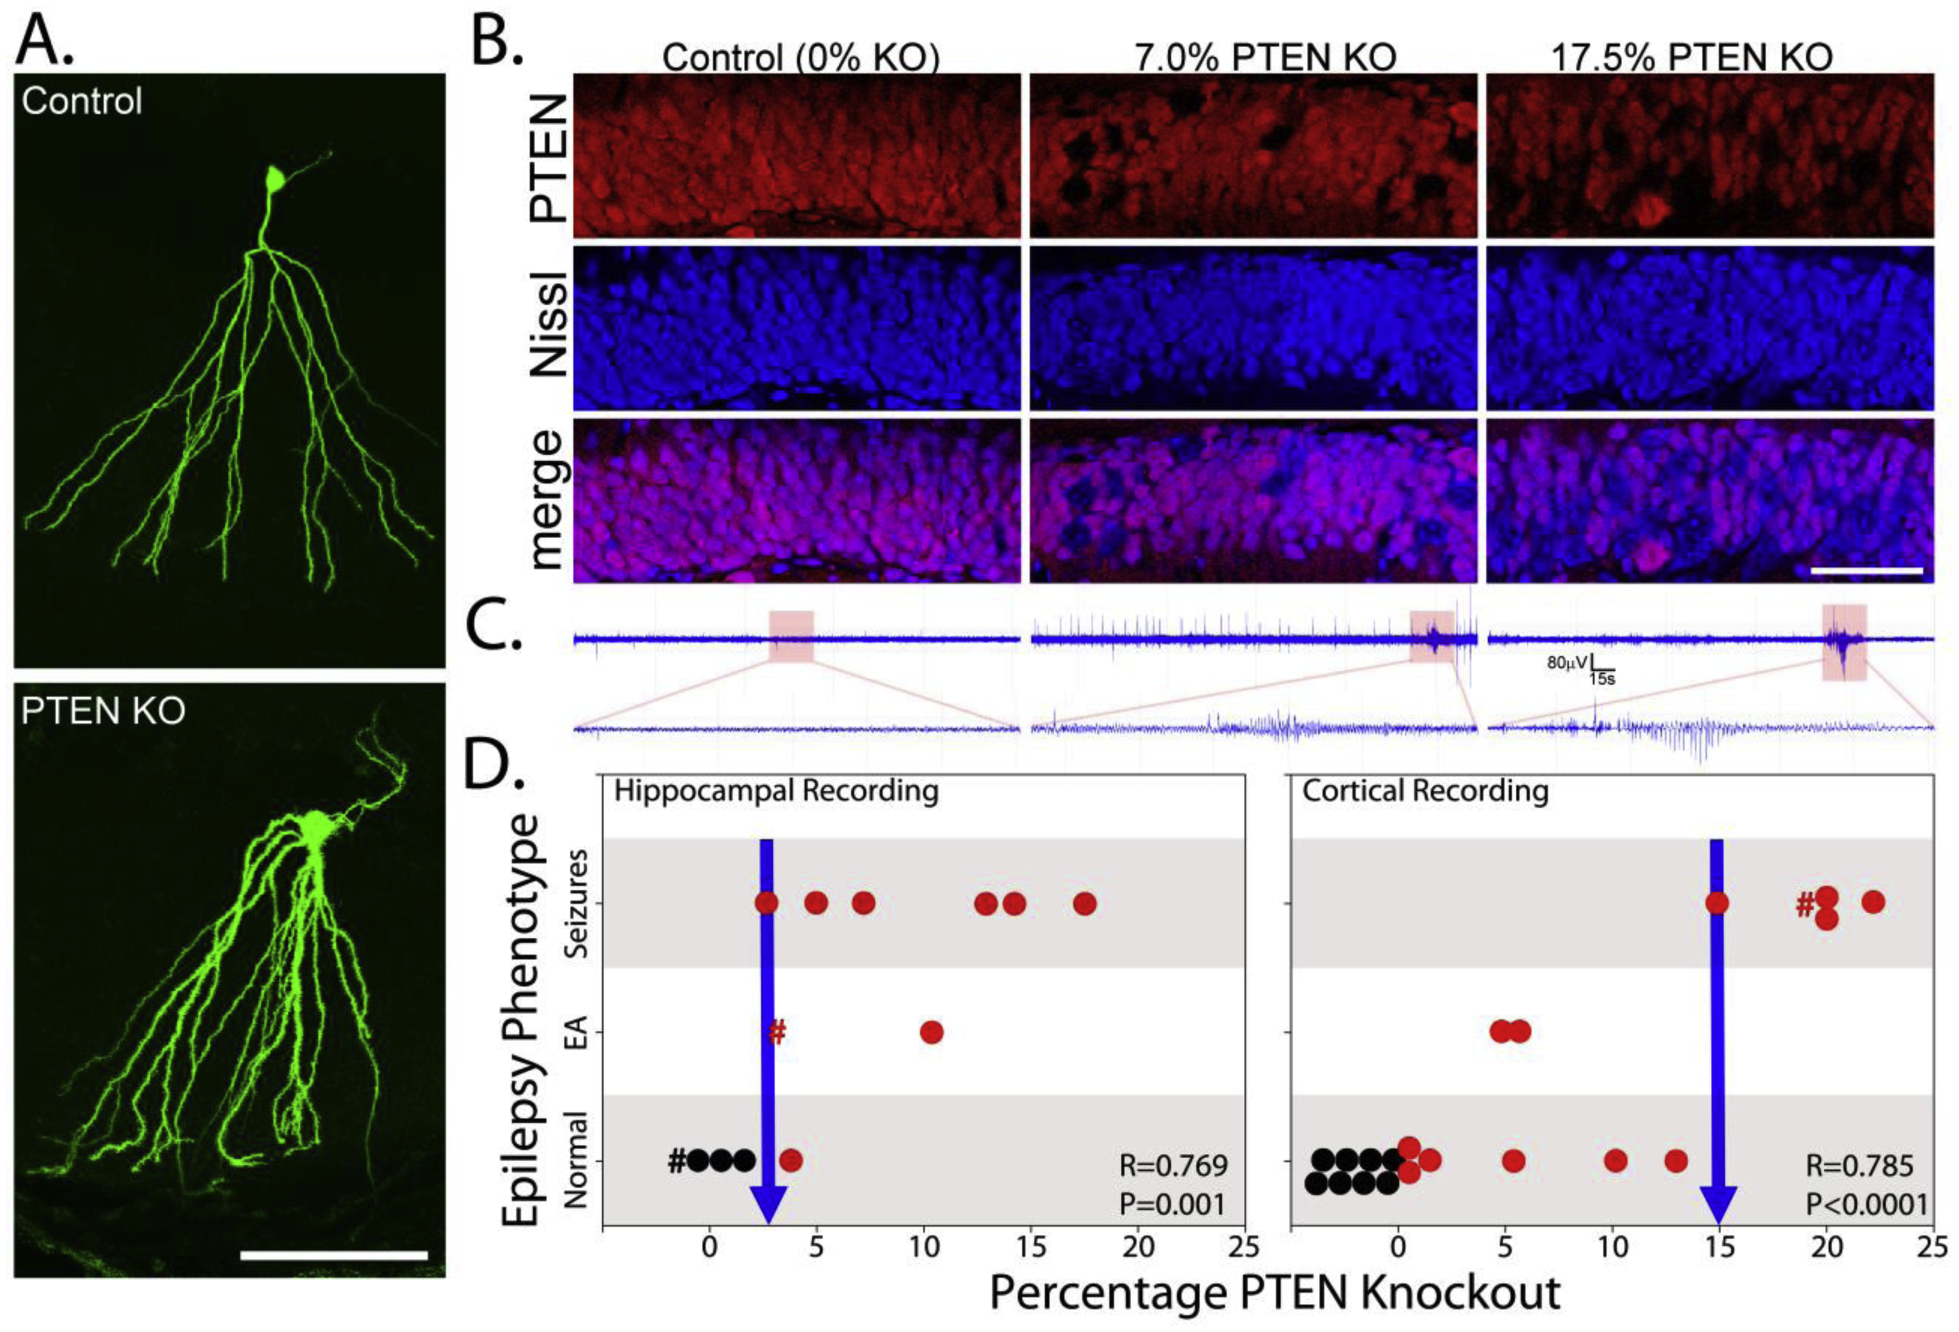
A: Examples of biocytin-filled control and Pten knockout (KO) cells. Scale bar = 100 μm. B: Micrographs show Pten immunoreactivity (red) and Nissl staining (blue) in the dentate granule cell body layer of a control mouse and two Pten KO mice. KO cells appear as dark holes in the Pten staining, and blue cells in the merged image. Scale bar = 50 μm. C: Hippocampal depth electrode recordings from each of the corresponding mice in panel B. The control animal shows a normal recording, the 7% KO shows epileptiform spikes and events, while the 17.5% KO has a seizure. D: Graphs show the correlation between the percentage of Pten KO granule cells and the animal’s phenotype (hippocampal: n=13; cortical n=21). Control animals (0% KO) are plotted in black, and KOs in red. Animals carrying the DREADD receptor, which was not activated in the present study, are denoted by “#”. Animals were categorized as normal, as having epileptiform activity (EA) only or seizures, as determined from hippocampal or cortical recordings.
3. Results
3.1. Linear regulation of an epileptogenic brain insult
To explore the impact of increasing the load of mTOR hyperactive neurons on hippocampal function and epileptogenesis, we utilized conditional, inducible Gli1CreERT2, Ptenflox/flox mice to delete Pten from quantifiable numbers of hippocampal granule cells. Consistent with prior studies, Pten immunohistochemistry and reporter gene expression (GFP, Arch-GFP, tdTomato) revealed Gli1-driven Pten deletion among olfactory neurons, hippocampal granule cells and small numbers (<1%) of glial cells (Pun et al., 2012; data not shown).
In the hippocampus, Pten deletion produced grossly abnormal granule cells, with enlarged somas, apical dendrites with impaired branch self-avoidance and aberrant hilar-projecting basal dendrites (Fig.1A; (Arafa et al., 2019; LaSarge et al., 2015; Pun et al., 2012)). Pten KO granule cells tended to be found in close proximity to the subgranular zone, where Gli1-expressing progenitors reside, but smaller numbers were also found close to the dentate molecular layer, consistent with reports showing that the KO cells migrate deeper into the granule cell body layer (Fig.1B) (Getz et al., 2016). Deletion rates were broadly controlled by varying the timing or dose of tamoxifen, while actual Pten knockout (KO) cell loads were determined histologically (Fig.1B). Deletion rates ranged from 0–40% of granule cells, with the maximum corresponding to the established time course of granule cell production during development. Specifically, granule cell production peaks by P7 in rodents (Mathews et al., 2010), so tamoxifen treatment after this age, as done here, can only lead to recombination among a minority of granule cells. The variable deletion rates produced by the approach allowed us to experimentally assess how increasing KO cell loads impact epilepsy severity and hippocampal physiology.
3.2. Increasing KO cell load regulates disease phenotype
We first defined the relationship between KO cell load and epileptiform brain activity. Animals were implanted with either a bipolar hippocampal depth electrode to capture focal seizures or cortical electrodes to capture generalized seizures (Fig.1C).
Hippocampal depth electrode recordings were made from four control (0% KO) and nine Pten KO (3.2 to 17.5% KO) mice. Mice were monitored 24/7 by video-EEG for at least two weeks (control, 19.8 ± 1.7 days; KO, 14.2 ± 1.0 days). Epileptiform activity and seizures were absent from control mice. Among KO mice, 22% (2 of 9) exhibited epileptiform activity without overt seizures, 56% (5 of 9) had sporadic hippocampal seizures, and one mouse had frequent periods of non-convulsive status epilepticus (seizures > 5 minutes). Only one KO mouse had a normal EEG (3.8% KO). Correlation analyses revealed a positive relationship between KO cell load and epilepsy phenotype when control animals were included (Fig.1D; R=0.769, p=0.001, Spearman rank order correlation), but not when only KO animals were examined (R=0.378, p=0.285). Behaviorally, seizures were typically associated with freezing or subtle head movements. Freezing behavior would begin abruptly at the onset of the electrographic seizure, and mice would resume normal movement following electrographic seizure termination. Most seizures were brief, except for the animal exhibiting non-convulsive status epilepticus. Among animals with seizures, seizure frequency was 2.3 ± 1.6 seizures/day.
Cortical ECoG recordings were made from eight control and 13 Pten KO (0.1–22.2% KO) mice. Mice were monitored 24/7 by video-EEG (control, 23.4 ± 7.5 days; KO, 21.5 ± 4.9 days). Epileptiform activity and seizures were absent from control mice. Among KO mice, 15% (2 of 13) exhibited epileptiform activity without overt seizures and 38% (5 of 13) had sporadic cortical seizures (0.9 ± 0.4 seizures/day). Spike frequency was 1.2 ± 0.4/hour in controls and 9.0 ± 4.5/hour in KOs, although the groups did not differ significantly (p=0.387, M-W RST). No animals developed status epilepticus, and epileptiform activity was absent from six animals. Epilepsy phenotype in the animals was positively correlated with KO cell load, with control animals included (Fig.1D; R=0.785, p<0.0001, Spearman rank order correlation) or only KO animals included (R=0.792, p=0.0003). Since Pten KO neurons are absent from cortex in this model (Pun et al., 2012), the presence of cortical seizures indicates that epilepsy has progressed to include the recruitment of normal tissue.
Analysis of the combined data sets indicates that hippocampal seizures and epileptiform changes were evident in animals with KO cell loads of 4 to 5%, while cortical seizures were not observed until loads reached 15% (Fig.1D, arrows). These observations support the conclusion that low KO cell loads are sufficient to cause focal seizures, while higher loads are required for generalized seizures.
3.3. Spontaneous excitatory activity and KO cell load
To determine whether synaptic inputs to KO cells change with increasing KO cell load, spontaneous excitatory postsynaptic currents (sEPSCs) were quantified during whole cell recordings of dentate granule cells in acute hippocampal slices from control and KO mice (Fig.2A). We first queried whether the frequency of sEPSCs recorded from granule cells was altered in slices from mice with KO cell loads >15% (above the threshold for cortical seizures). Consistent with previous studies (Santos et al., 2017), sEPSCs recorded from Pten KO cells were increased by 83% in high KO slices (Fig.2B; control, n=18 cells; KO, n=30 cells [KO cell load 15.3–36.5%]; F= 22.04, p<0.001, Two-way ANOVA with genotype and sex, no interaction [F=0.08, p= n.s.]). We also found a significant difference between males and females, with sEPSCs in females being more frequent (F= 11.47, p=0.002). Results were similar with the one outlier (>1.5x the interquartile range) in the KO data set removed (KO vs. control, F=20.09, p<0.001; male vs. female, F=8.05, p=0.007). We next conducted correlation analyses to determine the relationship between sEPSC frequency and KO cell load. To isolate KO cell load effects from changes resulting from Pten deletion, only Pten KO cells were included in correlation analyses. Correlation analysis revealed a significant positive relationship between KO cell load and sEPSC frequency (Fig.2C; n=37 KO cells, KO cell load 7.6–36.5%, R=0.391, p=0.017, Pearson product-moment correlation [PPM]). In this case, however, the single outlier drove the effect, which disappeared when the outlier was removed (R=0.246, p=0.147). The apparent increase in excitatory network activity with increasing KO cell load, therefore, should be interpreted cautiously. Finally, we examined the amplitude of sEPSCs. Amplitude did not differ significantly between slices from high KO animals and controls (Fig.2D; control, n=20 cells; KO, n=22 cells [KO cell load 15.3–36.5%]; F= 2.52, p=0.121, Two-way ANOVA with genotype and sex, no interaction [F=0.04, p= n.s.])). Males and females did not differ from each other (F=0.154, p=0.697). A correlation analysis of just cells from KO animals, however, did reveal a significant positive relationship between KO cell load and sEPSC amplitude (Fig.2E; n=26 KO cells, KO cell load 7.6–36.5%, R=0.474, p=0.015, PPM). This effect was also driven by a couple outliers, again justifying a cautious interpretation (R=0.337, p=0.107 with 2 outliers removed).
Figure 2. Pten KO cells have higher sEPSCs frequency.
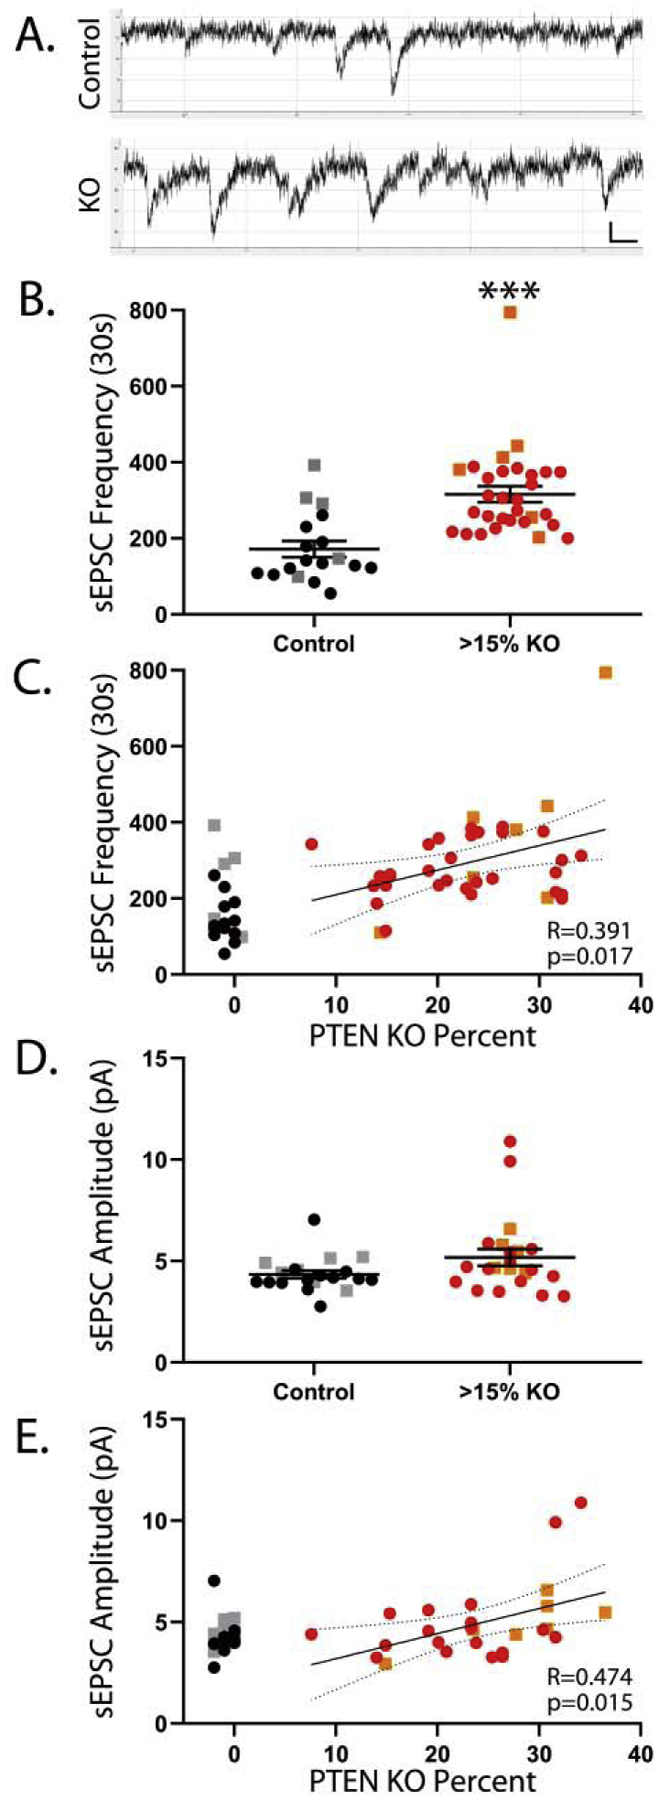
A: Example whole cell recordings from a control and a Pten KO cell. B: Recordings from high KO animals (>15%) reveal an increase in sEPSC frequency among KO cells. C: Among cells from KO animals, sEPSC frequency was positively correlated with the percentage of hippocampal granule cells that lacked Pten. D: sEPSC amplitude was statistically similar between control and high KO animals. E: Among cells from KO animals, sEPSC amplitude was positively correlated with the percentage of granule cells that lacked PTEN. Bars in B and D indicate mean ± sem. For C and E, best-fit lines with 95% confidence bands are shown. Black and red circles indicate male mice, while grey and orange squares denote female mice. ***, p<0.001.
3.4. Relationship between hippocampal circuit physiology and Pten KO cell load
To better understand how the accumulation of Pten KO cells promotes epileptogenesis, we conducted field potential recordings from acute hippocampal slices (1 slice per mouse; n=5 control mice and 24 KO mice [KO cell load 3.6–38.4%]). For these experiments, lateral perforant path was stimulated, targeting the projections from lateral entorhinal cortex that innervate the outer segments of granule cell dendrites (Fig.3A). Stimulation produces an excitatory postsynaptic field potential (fEPSP), followed by a population spike if above threshold (Fig.3B). To further define the role of Pten KO cells, the light-activated proton pump archaerhodopsin (Arch) was expressed in these neurons such that they could be selectively silenced. In each slice, the following parameters were quantified: 1) fEPSP threshold, 2) sEPSP slope, 3) population spike threshold, 4) population spike amplitude and 5) population spike dynamics.
Figure 3. Population spike thresholds, but not fEPSP thresholds, were lower in Pten KO slices.
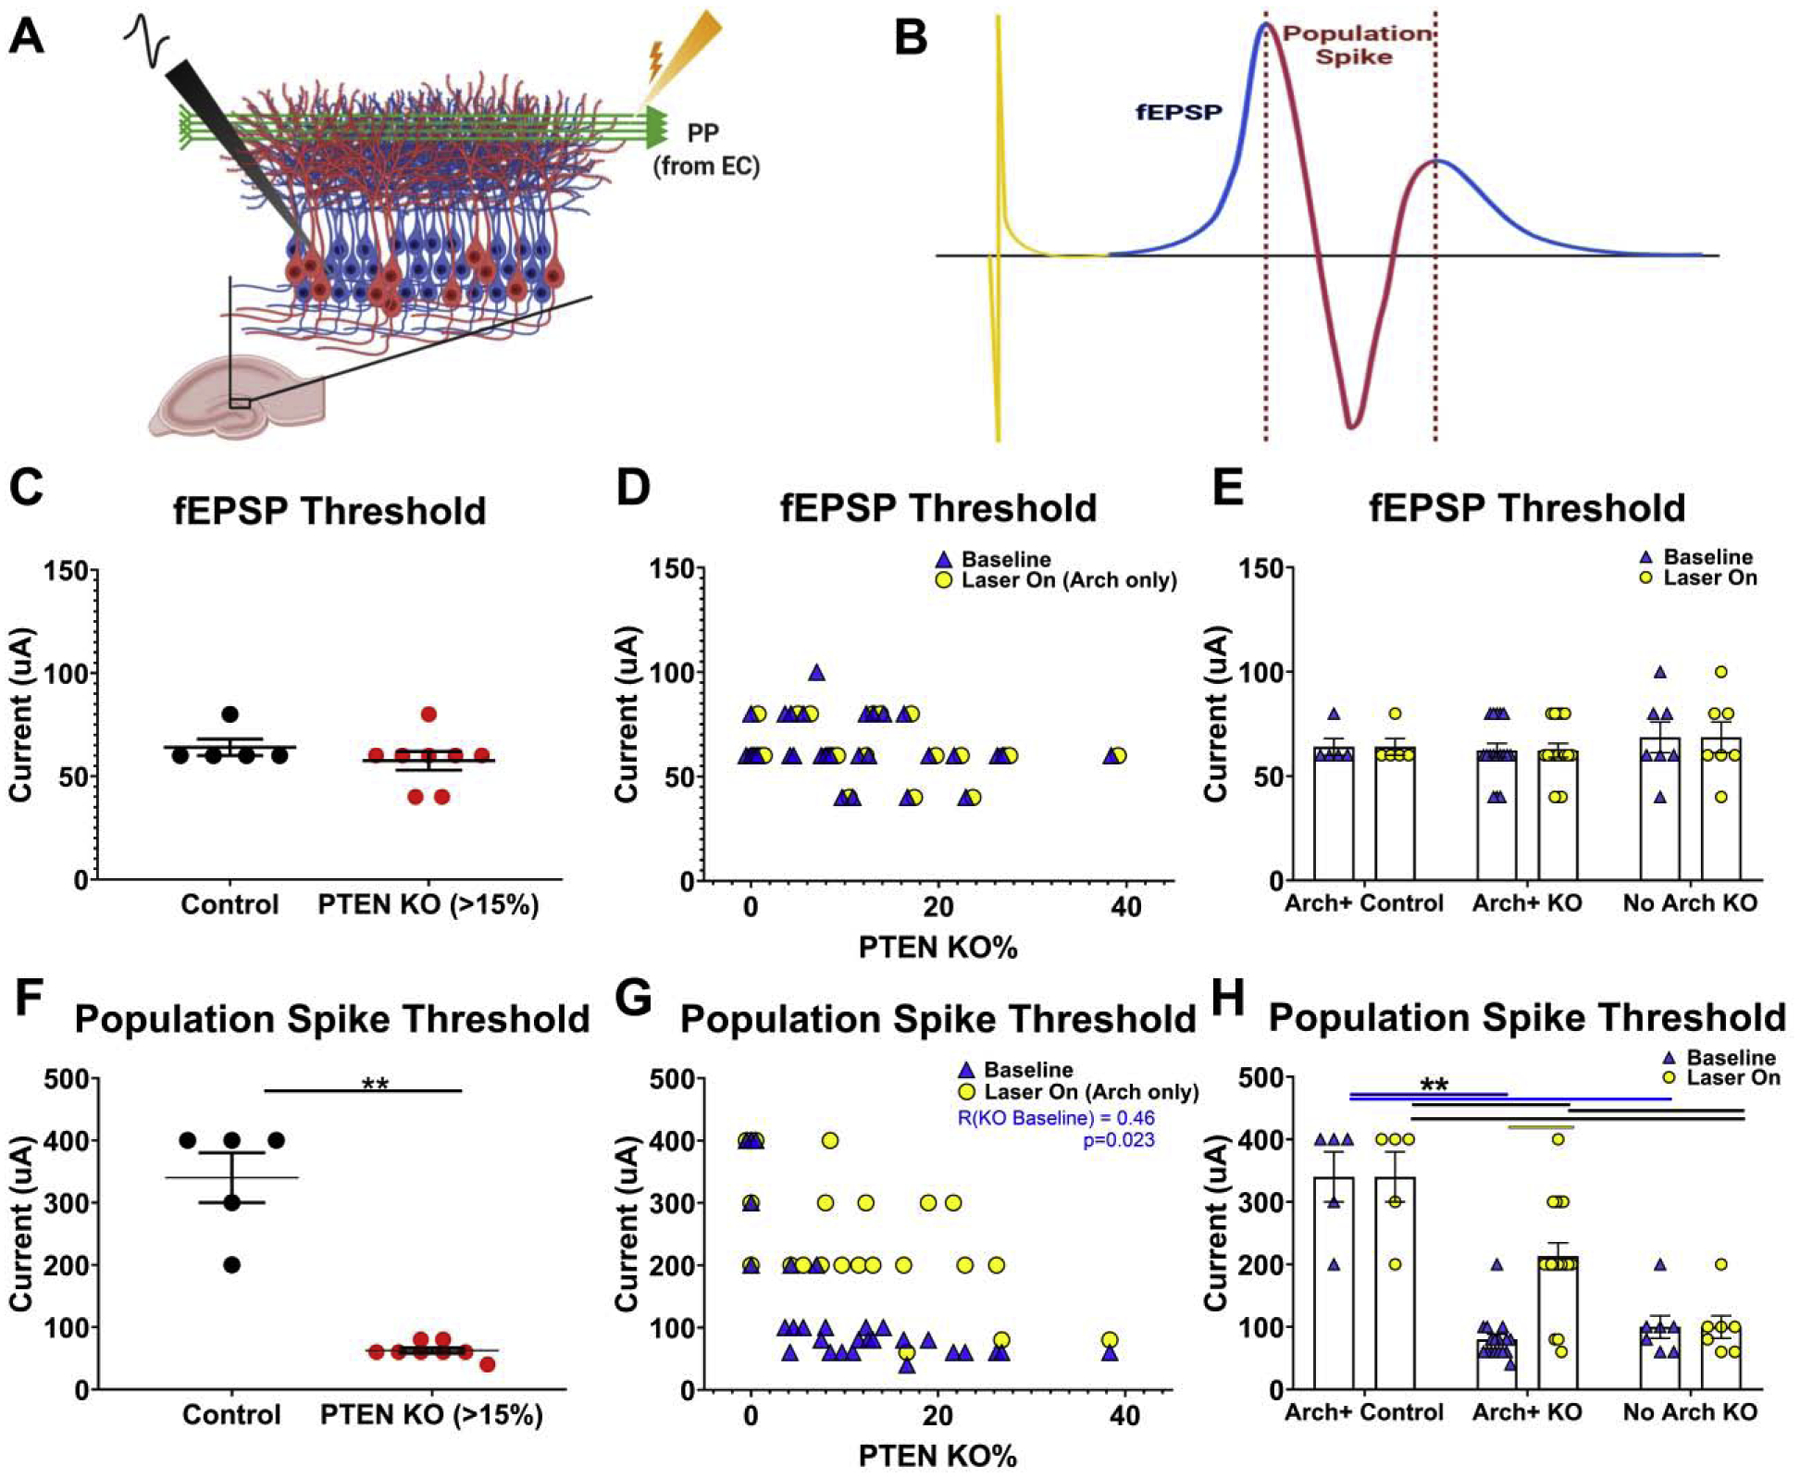
A: Schematic of the acute hippocampal slice protocol. Field potentials were generated by stimulating the perforant path (PP) while recording from the granule cell body layer. Created with BioRender.com B: Example field potential response, color coded to highlight the stimulus artifact (yellow), the excitatory postsynaptic current (fEPSP; Cyan), and the granule cell population spike (red). Created with BioRender.com C & F: Graphs depict fEPSP (C), or population spike (F), threshold for individual slices from control (black; n=5) and high knockout (>15%; red; n=8) animals. D &G: Scatterplots correlating fEPSP (D), or population spike (G), threshold with the percentage of KO granule cells in each slice (n=24). For each slice, two points are given: Blue arrowheads give baseline (laser off) values, while yellow dots give values for the Arch+ control and Arch+ KO slices with Arch+ cells silenced (laser on). E & H: Bar graphs show fEPSP (E), or population spike (H), baseline responses and responses with KO cells silenced for Arch+ control (n=5), Arch+ KO (n=17) and Arch-negative (No Arch) KO slices (n= 7). *p≤0.05; **p≤0.01.
3.5. Excitatory postsynaptic potential (fEPSP) threshold is unchanged in Pten KO mice
We first examined whether the current required to induce a fEPSP was altered by comparing control slices to slices from animals with KO cell loads >15% (Fig.3C). fEPSP threshold was identical in control (n=5; 64.0 ± 4.0 μA) and high KO (n=8; 57.5 ± 4.5 μA; p= n.s., t-test) slices. Subsequent analyses showed no relationship between fEPSP threshold and KO cell load among KO slices (Fig.3D, blue triangles); n=24 mice; R=−0.29, p=0.18). Finally, the effect of optogenetic silencing of Arch-expressing control (Arch+ Control, n=5 mice, baseline = 64.0 ± 4.0 μA, laser on = 64.0 ± 4.0 μA) and Arch+ KO (Arch+ KO, n=17 mice, baseline = 62.4 ± 3.4 μA, laser on = 62.4 ± 3.4 μA) cells on fEPSP threshold was examined (Fig.3D, E, compare blue triangles to yellow circles). To control for laser exposure, Arch-negative (No Arch) KO cells were also included (n=7 mice, baseline = 68.6 ± 7.4 μA, laser on = 68.6 ± 7.4 μA). Neither optogenetic silencing of Arch+ cells or laser exposure of No Arch cells had any effect on the fEPSP threshold (Group F=0.44, Light Stimulation F=0.00; p’s = n.s.; RM ANOVA, Fig.3E).
We next examined the slope of the fEPSP induced by perforant path stimulation. Arch+ PTEN knockouts slices were placed into high (>15%) or low (<15%) KO groups and compared to controls and Arch-negative knockouts. As expected, analyses revealed an interaction between increasing current and fEPSP slope (Supplemental Figure 1A; F=3.321, p<0.001; Two-Way RM ANOVA); all groups showed increasing slope with increasing current (F=33.220, p<0.001; 500μA vs 100μA p’s<0.05 for all groups). Replicating previous work (LaSarge et al., 2016), the high knockout slices had larger slopes than all other groups at 400μA (p’s<0.05) and 500μA (p’s<0.001), whereas responses at lower stimulation intensities did not differ. Perforant path stimulation during laser exposure produced the same fEPSP results, with an interaction between groups and increasing current (Supplemental Figure 1B; F=1.985, p=0.033; Two-Way RM ANOVA), increased slope with increased current (F=3.278, p=0.038, 500μA vs 100μA p’s<0.05 for all groups), and high knockout slices with greater slopes at 400 and 500 μA (p’s<0.05). A comparison between the laser on and baseline conditions showed no changes in the fEPSP slope while silencing granule cells (Supplemental Figure 1C; Current, F=1.188, p=0.321; Group, F=0.626, p=0.605; interaction, F=1.670, p=0.085). Further comparison between fEPSP slope ratios with increasing knockout cell load showed no laser effects on the fEPSP slopes (Supplemental Figure 1D; Pearson Correlations, R’s = −0.231 to 0.382, p’s>0.127).
3.6. Pten KO cells produce a reduction in population spike threshold
Perforant path stimulation of sufficient intensity induces an action potential among the granule cells, evident as a population spike. Population spike threshold was significantly reduced in slices from high KO animals (Fig.3F; n=8 mice; 60 [40–80] μA) relative to controls (n=5 mice; 400 [200–400] μA; p=0.002, MW RST). Correlation analysis among KO animals revealed a significant negative relationship between KO cell load and threshold (Fig.3G; n=24 mice; R= −0.46, p=0.023). Gross examination of the data (Fig.3G, blue triangles) suggests that population spike threshold drops abruptly, and levels off once even small numbers of KO cells are present.
Optogenetic inhibition of Arch+ KO cells significantly increased population spike thresholds (Fig.3G, compare blue triangles to yellow circles). Specifically, analyses of slices from control, Arch+ KO and No Arch KO mice revealed a significant interaction between group and light stimulation (Fig.3H; F=12.553, p<0.001, RM Two-way ANOVA). Among Arch+ KO slices, inhibition significantly increased threshold (213 ± 16 μA) relative to the no light condition in the same slices (80 ± 16 μA; t=7.79, p<0.001, t-test with Bonferroni corrections). KO cell inhibition did not, however, completely restore threshold to control levels (340 ± 30 μA, t=7.57, p<0.001). Silencing had no effect on Arch+ control slices, and laser exposure had no effect on No Arch KO slices (p’s = n.s.). Examination of individual Arch+ KO slice responses revealed that silencing increased thresholds to within the control range (>200 μA) in all but three high KO slices (Fig.3G).
Increasing perforant path stimulation led to increased population spike amplitude, without (Supplemental Figure 1E; current, F= 14.111, p<0.001; Group, F=2.118, p=0.123; Two-Way RM ANOVA) and with laser exposures (Supplemental Figure 1F; current, F= 14.244, p<0.001; Group, F=1.587, p=0.217) for all groups. However, the ratio of the population spike amplitude, with and without laser exposure, showed an interaction between the amount of current and group (Supplemental Figure 1G; F=2.603, p=0.005). Control slices (with Arch) and PTEN knockout slices without Arch showed no difference between current amounts, whereas low and high PTEN knockouts with Arch exhibited a reduction in the population spike with laser exposure at 100 μA of current (low Arch knockouts compared to 200–500 μA, p’s< 0.001; high knockouts compared to 300–500 μA, p≤ 0.002). Correlation analysis of the Arch PTEN knockout percentage and population spike ratio at 100 μA of current stimulation showed a positive relationship (Supplemental Figure 1H; R=0.324, p=0.017; Pearson Correlation), demonstrating that slices with low amounts of PTEN knockout cells had the greatest reductions in the population spike amplitude with laser exposure at low stimulation.
Together, these findings support several key conclusions. Firstly, only low numbers of Pten KO cells are required to reduce population spike threshold. Secondly, cell silencing experiments confirm that KO cells are driving this effect. When KO cells are optogenetically removed from the circuit, presumptive Arch negative, Pten+ cells with higher population spike thresholds dominate the response. Finally, the failure of cell silencing to restore the normal response in some high KO animals suggests secondary changes may be occurring.
3.7. Response pathology increases with KO cell load and stimulation intensity
In slices from control animals, granule cells fire only a single population spike (Andersen et al., 1966), as robust feedforward and feedback inhibition prevents further firing (Li et al., 2013; Ribak and Seress, 1983; Sloviter, 1991a). In many models of epilepsy - including our Pten KO model - stimulation produces secondary population spikes, indicative of the de novo formation of recurrent excitatory pathways (Hardison et al., 2000; LaSarge et al., 2016; Patrylo et al., 1999). For the present study, field potential and optogenetic experiments were designed to reveal the role of KO cells in producing this recurrent activity. Each hippocampal slice was stimulated in blocks of three (baseline, laser on to silence Arch+ cells, and recovery). Each block consisted of 5 stimulations each at 100, 200, 300, 400, 500 and 600 μA, for a total of 90 stimulations per slice. Slices were organized into 3 groups (control, n=5 mice; Arch+ Pten KO, n=17 mice [KO cell load 4 – 38%] and No Arch Pten KO, n=7 mice [KO cell load 4 – 14%]).
To capture the pertinent features, responses were closely examined at stimulation intensities of 100 and 400 μA (Fig.4). At 100 μA of current stimulation, 100% of slices from control animals (5 of 5) exhibited an EPSP-only (Fig.4A, B). At 400 μA, all five control slices transitioned to an EPSP plus a single population spike (Fig.4F, G). In slices from low KO animals (<15% KO), on the other hand, 100 μA stimulation produced an EPSP-only in 12.5% (2/16) of mice and multiple population spikes in 87.5% (14/16) of mice (Fig.4C, D). Interestingly, in all cases, population spikes in low KOs were of brief duration (1–2 msec), appeared inconsistently at variable latencies among stimulations, and had low amplitudes. At 400 μA, these responses became more robust, and slices from 25% of the low KO animals transitioned to larger amplitude, longer duration (2–4 msec) multiple population spike responses (Fig.4H). However, the majority of low KO slices (10/16) transitioned to a single large population spike, consistent with higher intensity stimulation, and maintained subsequent, occasional small spikes (Fig.4I). These results present the possibility that in many low KO slices, the dentate circuit can mitigate the impact from small KO cell groups and prevent them from influencing the larger hippocampal network - perhaps via activation of feedback inhibitory networks.
Figure 4: Optogenetic silencing of granule cells during perforant path stimulation.
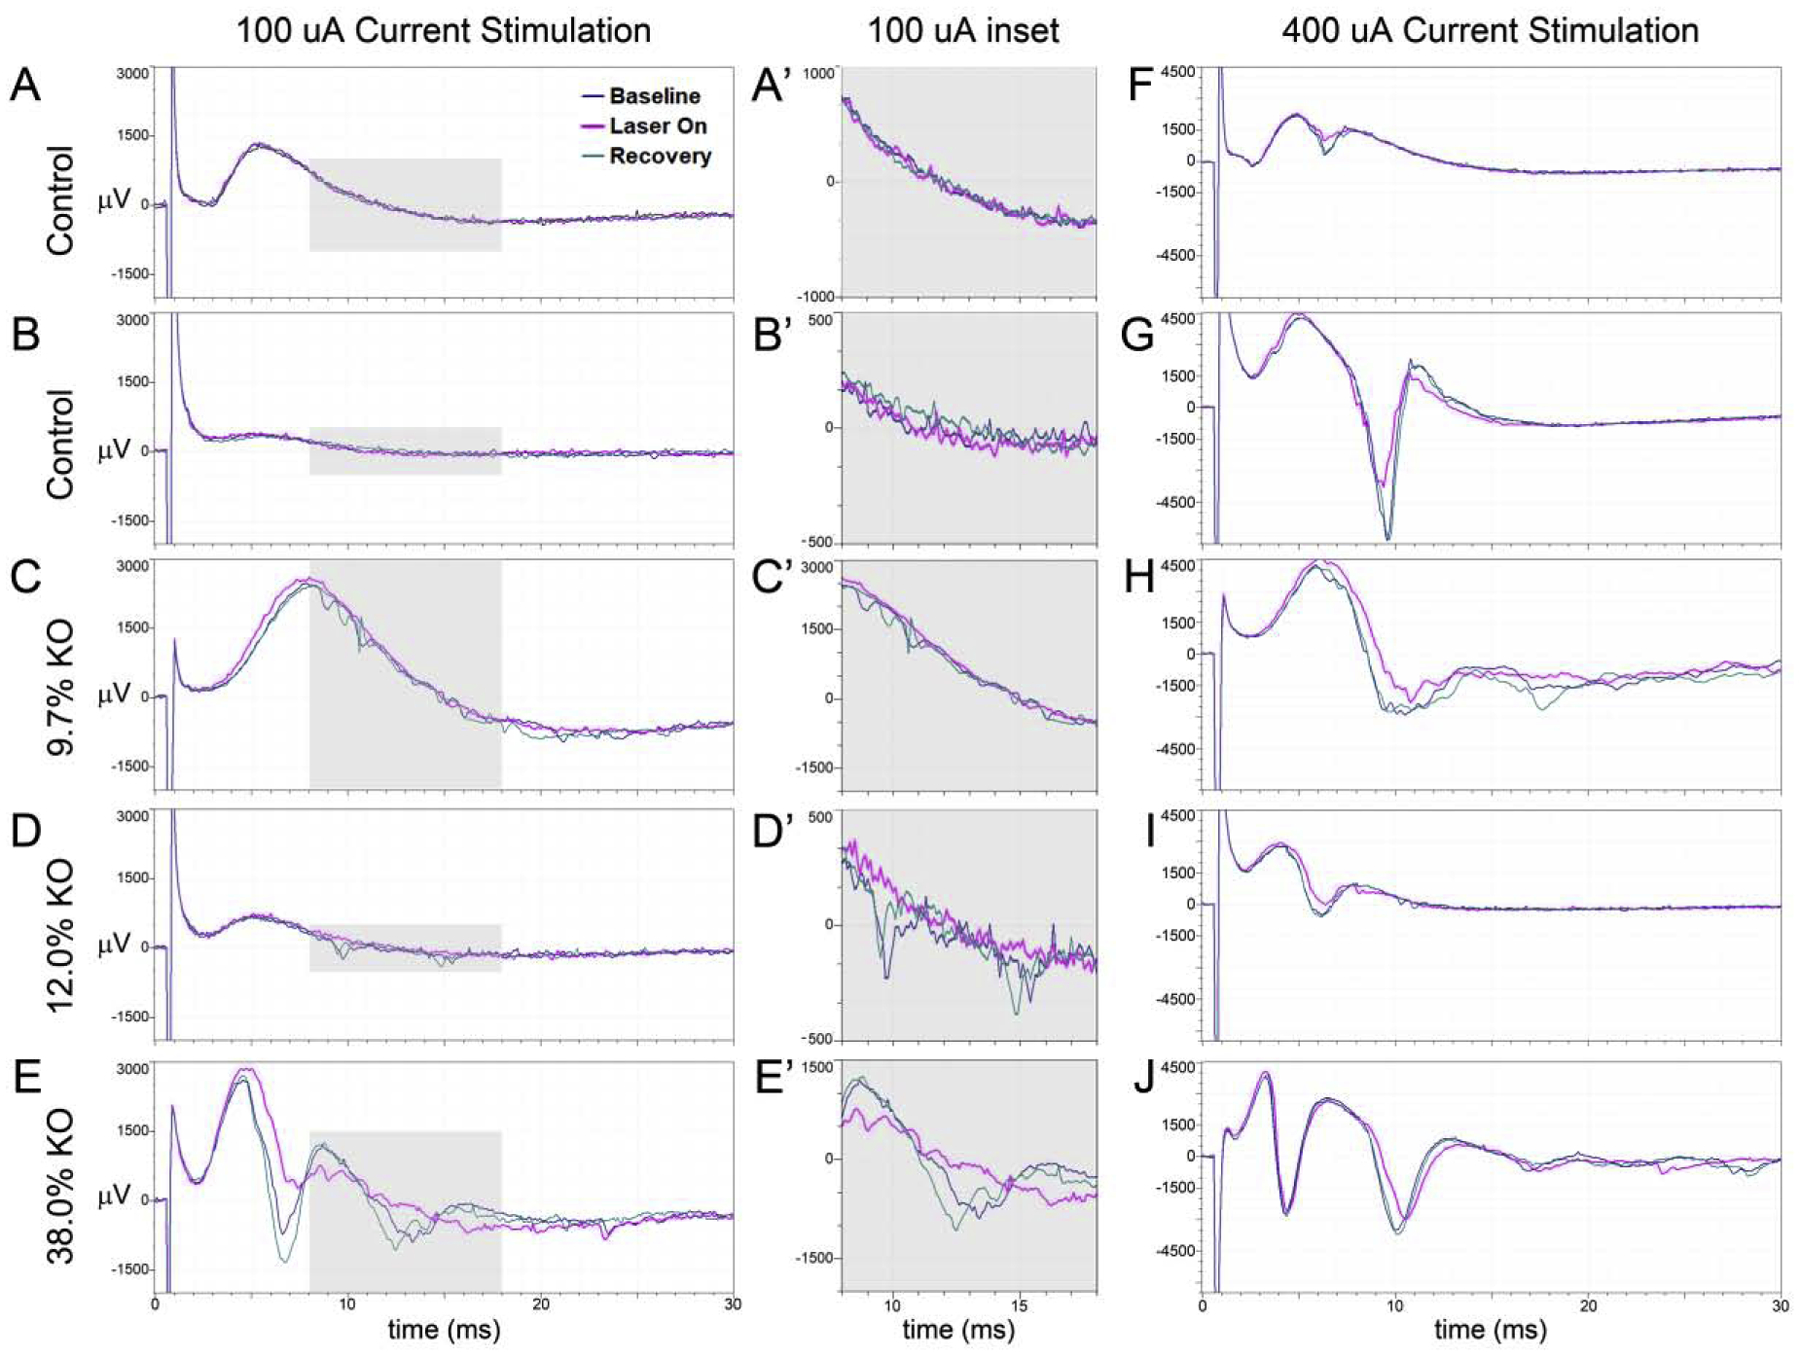
Representative field potential recordings from acute hippocampal slices from controls (A,B,F,G), or a 9.7% KO (C,H), a 12% KO (D, I) and a 38% KO (E,J) slice. Experiments were run sequentially, first capturing a baseline response (laser off, black trace), the response during optogenetic silencing of Arch+ control or KO cells (laser on, pink trace) and a recovery response (laser off, green trace). Shaded regions (A’ – E’) are expanded to the right of each panel.
In slices from high KO animals, 100 μA stimulation produced multiple population spikes in 100% (8 of 8) of the slices. Slices from half of the high KO animals exhibited multiple population spikes that were brief, appeared at variable latencies and had low amplitudes - similar to low KOs. The other half exhibited multiple spikes with consistent latencies, longer durations (2–4 msec) and larger amplitudes than low KOs at 100 μA (Fig.4E). Quantification of low and high KO response amplitudes revealed a significant difference at 100 μA (low KO, n=16 mice, −737 ± 132 μV; high KO, n=8 mice, −1559 ± 339 μV; t=2.73, p=0.012). At 400 μA, responses from high KOs simply became more robust (Fig.4J), and 62.5% (5 of 8) of slices had longer duration, higher amplitude spikes. Taken together, these findings demonstrate that as KO cell load increases, the secondary population spikes become larger, longer and more reliable.
3.8. KO cells mediate abnormal responses
To confirm that multiple population spikes were mediated by KO cells, data from optogenetic silencing experiments was examined. Gross examination of field potential traces revealed that optogenetic silencing consistently eliminated the lower amplitude, shorter duration population spikes predominant in slices from low KO animals (Fig.4C’, D’, pink traces). In high KOs, by contrast, silencing often (Fig.4E, E’, pink traces) but not always (Fig.4J, pink traces) eliminated the larger secondary spikes. The persistence of secondary spikes suggests circuit abnormalities extend beyond the KO cell population.
3.9. Quantitative analyses confirm that circuit pathology increases with KO cell load
To quantitatively assess our observations at 100 μA stimulation intensities, the first 100 msec of each field response was converted to line length. Line length is increased by population spike number and amplitude, so the approach provides an unbiased measure of response severity. Line length was significantly longer for high KOs (>15%) relative to controls at 100 μA (Fig.5A; controls: 24224 ± 2882; Pten KO: 36698 ± 2773; t=−2.97, p=0.013; t-test). Correlation analysis of slices from KO animals revealed a significant, positive relationship between line length and KO cell load (Fig. 5B; R=0.64, p<0.001). This increase in line length validates qualitative observations that population spikes increase in number, size and duration with increasing KO cell load.
Figure 5. Responses from Pten KO slices were more complex compared to controls, and silencing Arch+ cells decreased their line length.
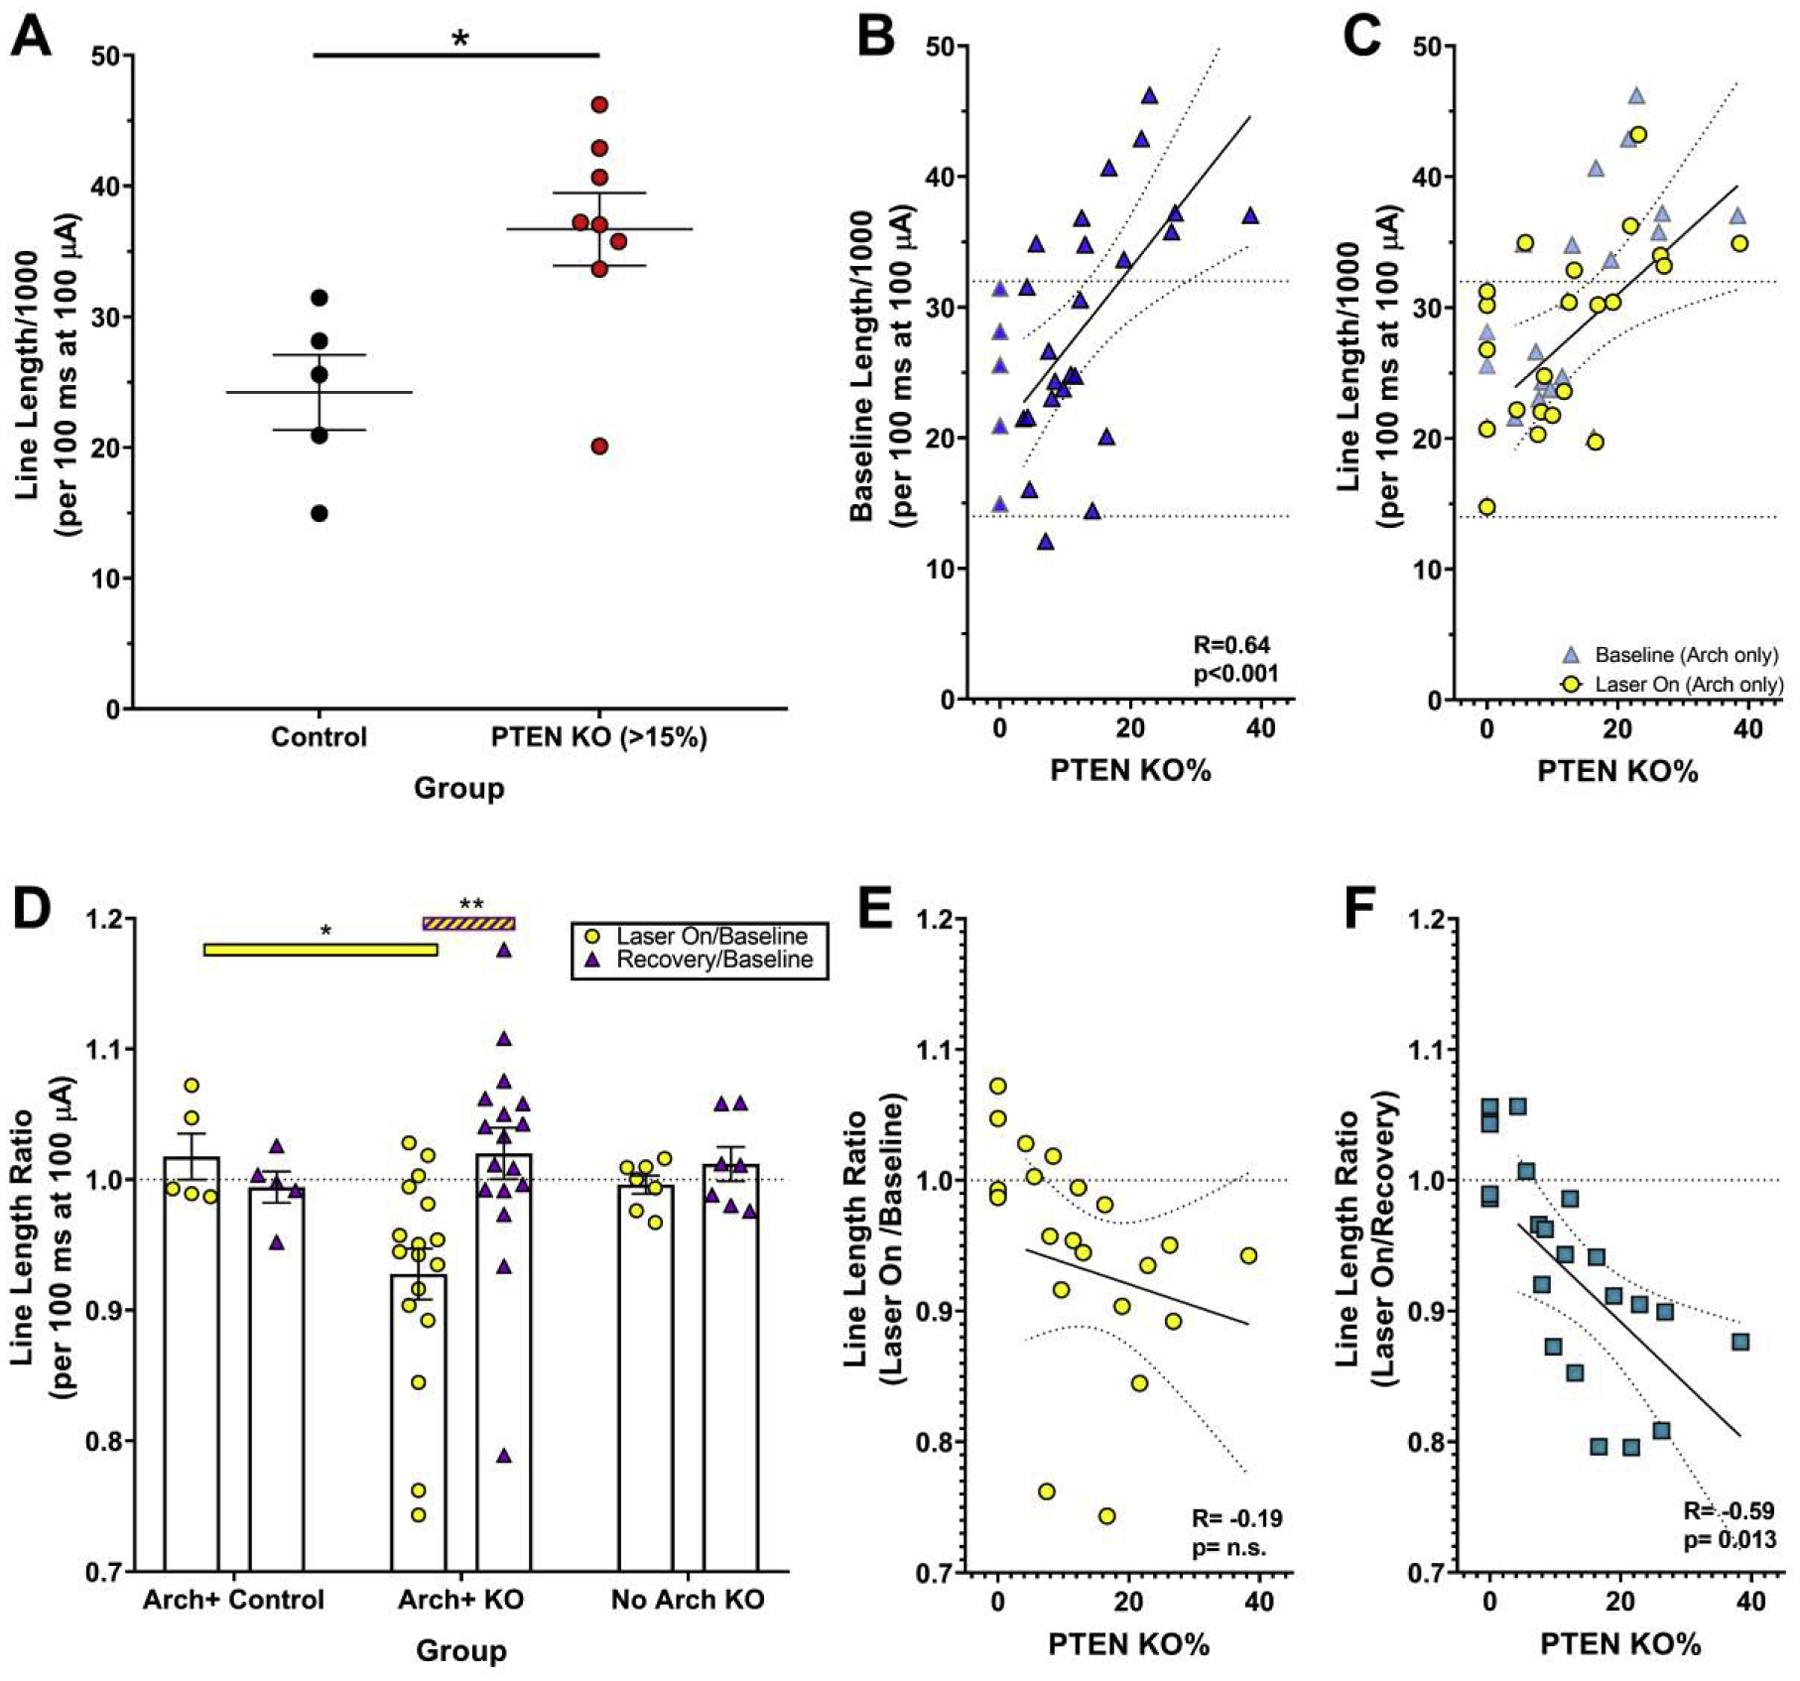
A: Field potential line lengths for the first 100 msec of baseline responses in slices from control (n=5) and high KO (>15%, n=8) animals. B: Baseline field response length and the percentage of Pten KO granule cells were positively correlated within KO animals (n=24), indicating responses become more abnormal with increasing KO cells. Control animals (n=5) were not included in statistics. C: Baseline length (blue triangles) and length following optogenetic silencing of Arch+ KO cells (n=17, yellow circles) for individual slices. D: Line length ratios for slices from Arch+ control (n=5), Arch+ KO (n=17), and Arch-negative (NO Arch) KO (n=7) mice. The response to optogenetic silencing was calculated by dividing laser-on by baseline response. Recovery/baseline responses show laser-induced changes or rebound effects. Bars denote mean ± SEM; dots show individual slice responses. E & F: Line lengths during optogenetic silencing were divided by either baseline (E) or recovery (F) line lengths to generate a ratio for each Arch+ KO slice (n=17). Greater reductions in line length correlated with higher KO cell loads relative to recovery (F) but not baseline (E) lengths. *, p<0.05; **, p<0.001. For B, C, E and F, best-fit lines with 95% confidence bands are shown.
Optogenetic silencing of KO cells significantly reduced line length at 100 μA. Effects of silencing are shown graphically in figure 5C, in which baseline responses are depicted as blue triangles, and silenced responses as yellow circles. Comparing baseline and silenced responses for each slice reveals that reductions were more pronounced in high KOs. Although elimination of secondary spikes was grossly more effective in low KOs (Fig.4C,D), the small size of these spikes produced only modest reductions in line length, while even partial elimination of larger secondary spikes in high KOs produced appreciable reductions in line length in 7/8 high KO animals (Fig.5C). Quantification of line length ratios (laser on [KO cells silenced]/laser off [baseline]) revealed a significant interaction (Fig.5D; F=7.48, p=0.003), such that KO slices had a significant reduction in line length when KO cells were silenced (t=5.768, p<0.001). No differences in light on and recovery line lengths ratios were evident in Arch+ controls, or No Arch KOs (all t’s<0.80, p’s= n.s.). There was also no difference between recovery (laser off) and baseline traces for any group (all t’s<0.77, p’s=n.s.), indicating that laser stimulation did not non-specifically reduce responses by injuring the slices. Finally, when silenced (laser on) responses are expressed as a percentage of the baseline or recovery responses, such that values of 1 indicate no change, while values less than 1 indicate reductions in line length, the resulting ratios show a pronounced negative relationship between line length and KO cell load relative to recovery (Fig.5F; R= −0.59, p=0.0126) and a similar trend relative to baseline (Fig.5E; R= −0.19, p=n.s.). These data confirm that KO cells are mediating the increase in line length, and that increasing KO cell load produces larger effects.
3.10. Interneurons loss in high KO mice
Cortical seizures appeared in animals with KO cell loads of 15% or more. The appearance of cortical seizures could be driven by secondary changes in the network. The reduced efficacy of optogenetic silencing in high KO slices also suggests secondary changes are present (Fig.4J, pink trace). A key change that could contribute to the change in phenotype is the loss of GABAergic hilar interneurons. Although hilar interneurons do not undergo Pten deletion in our model, they are directly innervated by granule cells. The occurrence of hippocampal seizures in KO animals, therefore, could provoke the loss of these local circuit neurons.
Triple-immunolabeling for parvalbumin (PV), somatostatin (SST), and neuropeptide Y (NPY) was stereologically quantified in the dentate hilus in control and high KO (>15%) animals (Fig.6A). We first established the overall number of interneurons immunoreactive for PV, SST or NPY. To avoid double-counting, for this measure cells were only counted once regardless of whether they expressed single or multiple markers. Overall interneuron number was decreased by 19% in Pten KOs (Fig.6B; 4,473 ± 339 cells) compared to controls (5,525 ± 340 cells; t= 2.19, p=0.0452, student’s t-test). Granule cell layer/hilar volume was not different between control (0.441 ± 0.02 mm3) and Pten KO tissue (0.498 ± 0.026 mm3; t= −1.73, p=0.105, t-test).
Figure 6. Inhibitory interneurons expressing neuropeptide Y (NPY), somatostatin (SST) and parvalbumin (PV) were quantified in the dentate hilus of control and KO mice.
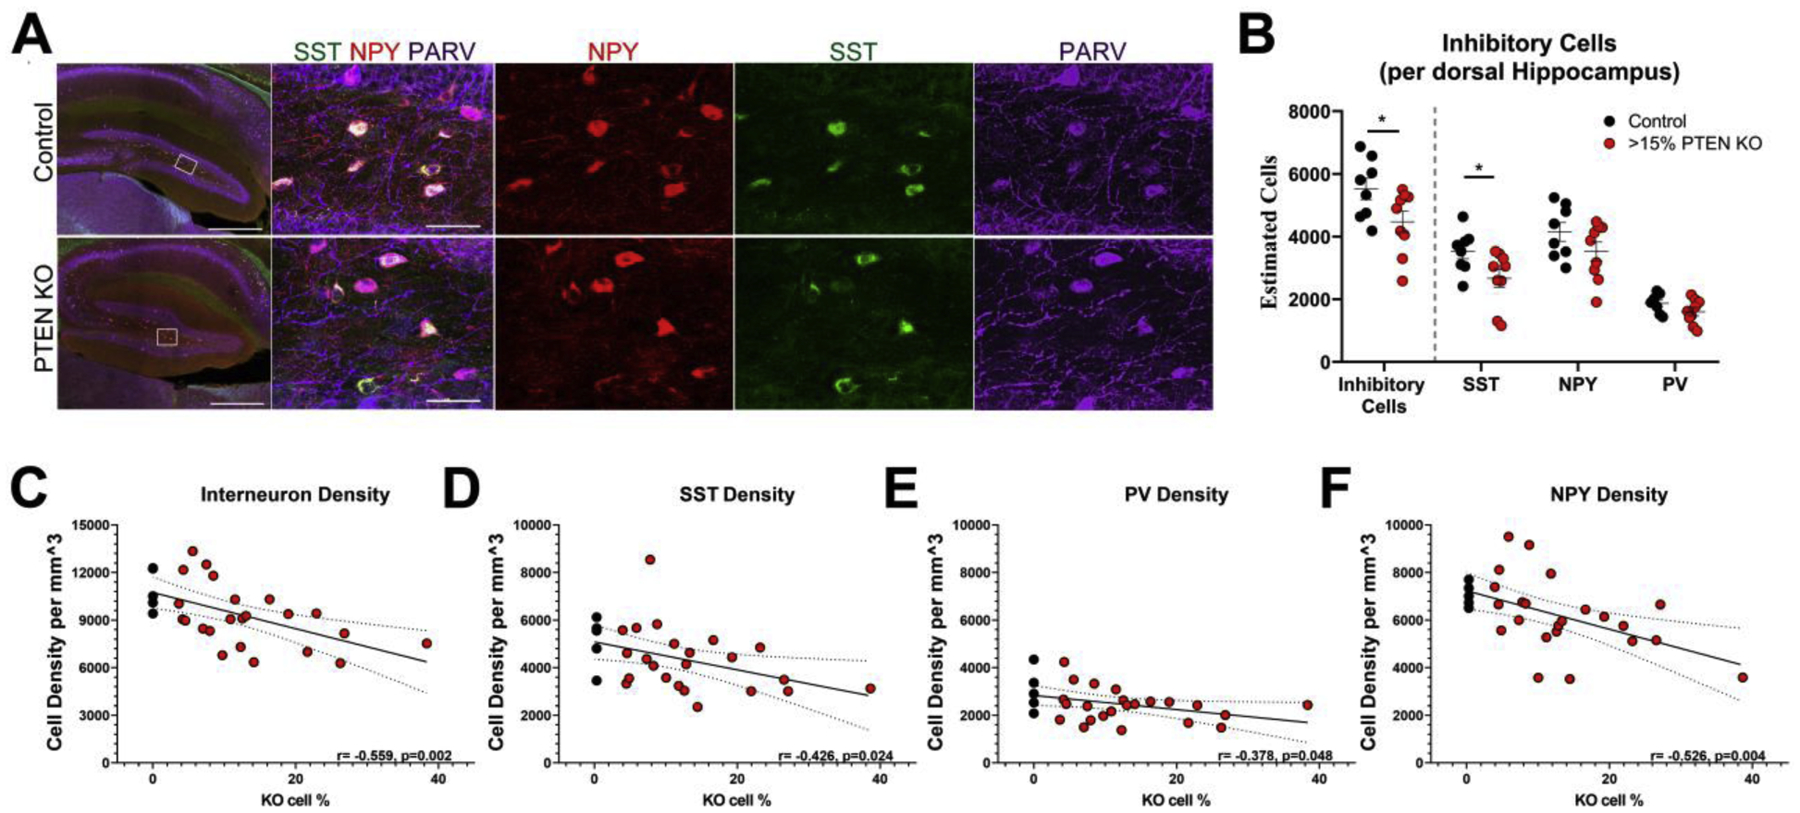
A: Low power images of the dentate gyrus in a control mouse and a KO mouse are shown in the left panels (Scale = 500 μm). Right panels show expansions of the dentate hilus (Scale = 50 μm). Immunolabeling for NPY (red), SST (green) and PV (blue) is shown individually and merged. B: Scatter plots show stereological estimates for SST, PV and NPY interneurons combined and individually in control vs. high KO (>15%) mice. *, p<0.05. C–F: Hilar interneuron density measurements from a separate group of control and PTEN KO mice show a negative relationship between KO cell load and SST, PV and NPY interneuron density combined (C) and individually (D–F).
We next queried whether interneuron loss was evenly distributed among PV-, SST-, or NPY-expressing cells, or whether specific subtypes were more vulnerable. Analyses revealed a vulnerability of SST interneurons (Control, 3,529±237; PTEN KO, 2,673±293; t=2.235, p=0.041; Student’s t-test), while PV- and NPY-immunoreactive neurons exhibited reductions that did not reach the level of significance (PV: Control, 1,873±103; PTEN KO, 1,603±130; t=1.593, p=0.132; NPY: Control, 4,151±296; PTEN KO, 3,528±300; t=1.469, p=0.162).
3.11. Interneuron density declines with increasing KO cell load
Having demonstrated that interneuron loss occurs in high KO animals, we next sought to ascertain the relationship between Pten KO cell load and interneuron density using a new set of animals with a wide range of KO cells (supplemental table 4; Control, n=5; KO, n=23 [3.63–38.36% KO]). Replicating the previous finding, mice in this dataset with greater than 15% Pten KO cells loads had lower interneuron densities than controls (control: 10,913±580 cells/mm3; Pten KO, n= 7: 8,302±553 cells/mm3; t=3.188, p=0.010; Student’s t-test). A correlational analysis between interneuron density and the full range of Pten KO cell loads revealed a significant negative relationship with (Fig. 6C; R = −0.559, p=0.002; Pearson Correlation) and without (R= −0.488, p=0.018) controls included. When examined by interneuron subtype, significant negative relationships between increasing KO cell load and density were found for SST (Fig. 6D; R= −0.426, p=0.024), PV (Fig. 6E; R= −0.378, p=0.048), and NPY (Fig. 6F; R= −0.526, p=0.004). Importantly, the overall decreases in inhibitory interneuron number and density observed here demonstrate that Pten KO cells can induce secondary changes in the dentate network.
4. Discussion
To begin to reveal the mechanisms underlying the development of epilepsy in mTORopathies, we incrementally increased the load of Pten KO hippocampal granule cells and examined how this tightly controlled insult altered key disease measures. Pten KO cells produced changes in circuit physiology and focal seizures at levels (5% KO) well below the amount needed to produce cortical seizures (15% KO). Pten KO cells also created recurrent excitatory circuits, which increased in strength and synchrony with increasing KO cell load. Additionally, high KO animals (>15%) had reductions in interneuron number and density. These findings support the conclusions that 1) increasing KO cell load drives increasingly severe pathology, 2) low KO cell loads can drive subclinical circuit level pathology and 3) high KO cell loads can initiate secondary changes among initially normal neurons (Fig.7A).
Figure 7. Modeling the impact of increasing Pten KO cell loads.
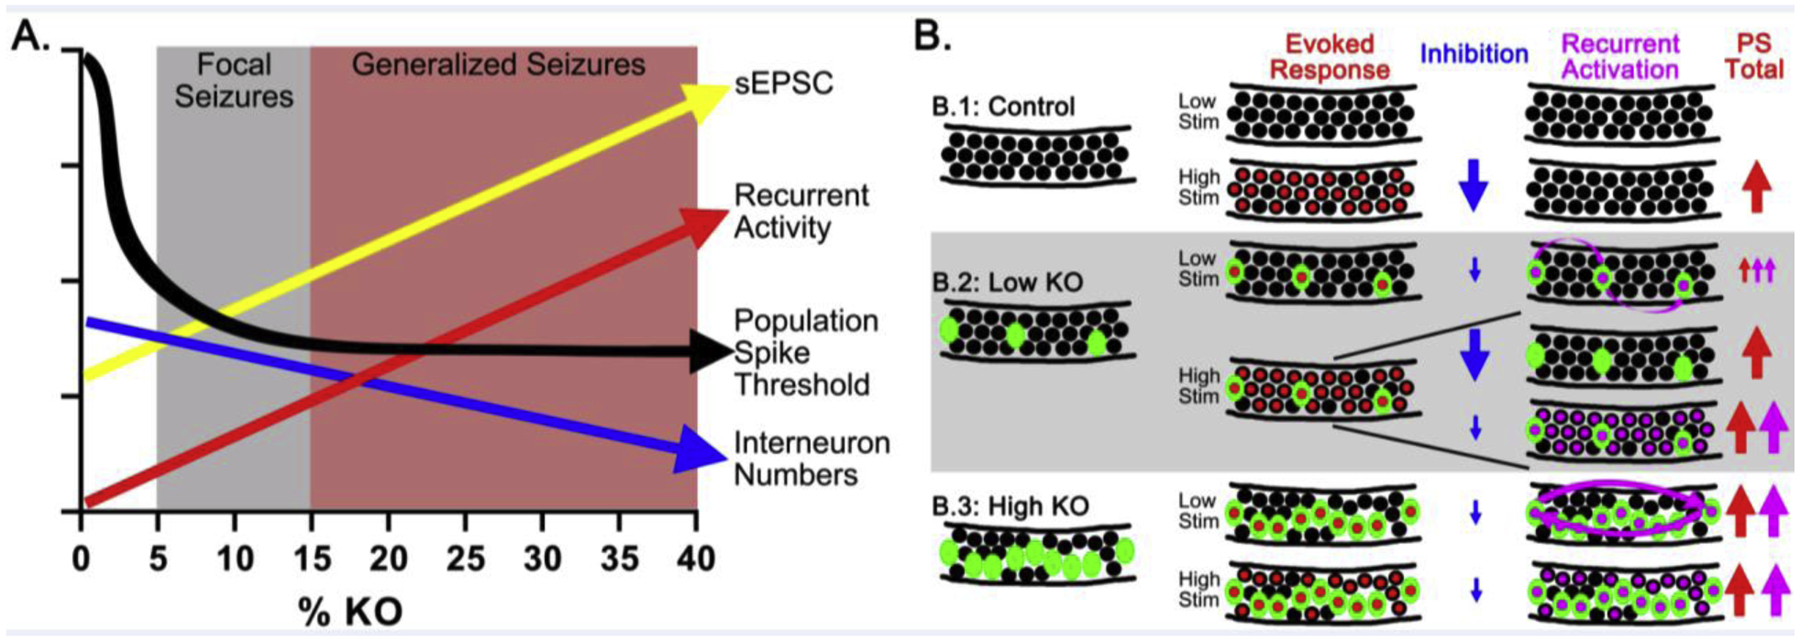
A: Increasing KO cell load (x axis) leads to the initial appearance of focal seizures followed by cortical seizures. Individual KO cells showed a progressive increase in sEPSC frequency (yellow arrow) with KO cell load. Population spike thresholds (black arrow) decreased abruptly in Pten KO slices, and population spike amplitude and recurrence (red arrow) became progressively more robust. Interneuron density shows a negative relationship with KO cell load (blue). B: Field potential responses become more abnormal with increasing Pten KO cells. B.1: Under control conditions, granule cells (black circles) have a high firing threshold, and do not generate a population spike (PS) with low stimulation. Red centers indicate cells firing a primary action potential, while red arrows indicate population spike size. Robust feedforward and feedback inhibition (large blue arrow) prevents secondary spikes. B.2: In slices from low KO animals, low current stimulation activates only KO cells due to their reduced firing threshold, producing a small population spike and multiple, small secondary spikes (cells with purple centers; purple arrows). Higher currents activate both KO and Pten-expressing cells, resulting in either (top) a single, large population spike with small, secondary spikes or (bottom) multiple large spikes. Inhibitory activation (large blue arrow, top) could account for the single population spike, versus a failure of inhibitory control in slices with multiple population spikes (small blue arrow, bottom). B.3: In slices from high KOs, interconnected pools of KO cells - combined with impaired inhibition - drive multiple population spikes with low current stimulation. Higher current stimulation strengthens these abnormal responses.
An addition to manipulating KO cell load, we also introduced the optogenetic inhibitor archaerhodopsin into the KO cells so that they could be silenced in vitro. The combination of these approaches allowed us to simultaneously assess KO cell load effects and to distinguish direct from indirect effects of the KO cells on hippocampal circuit behavior. Elimination of abnormal physiological responses by silencing KO cells provides strong evidence that KO cell activity is required for these effects, while an inability to fully block abnormal responses in some high KOs implies that they are mediated by changes in surrounding circuits; presumably as a secondary consequence of PTEN loss among granule cells. A key caveat, however, should be noted. While positive effects are straightforward, incomplete elimination of a response should be interpreted more cautiously. This could indicate that KO cells are not required; however, it could also reflect technical limitations, such as incomplete silencing due to inadequate archaerhodopsin expression or poor membrane control of hypertrophied KO cells (Arafa et al., 2019; LaSarge et al., 2015; Pun et al., 2012).
The present findings paint a clearer picture of how Pten KO granule cells alter the dentate circuit. In the normal dentate, low intensity stimulation (100 μA; Fig.7B) of the perforant path produces an fEPSP, but no population spike, as healthy granule cells have a high firing threshold (McNaughton et al., 1981). With higher intensity stimulation (400 μA; Fig.7B), control granule cells fire a single population spike; however, recurrent firing is prevented by robust feedback inhibition mediated by local circuit interneurons (Sloviter, 1991a).
The addition of even small numbers of Pten KO granule cells changes the circuit behavior dramatically. Low intensity stimulation is sufficient to induce a population spike, even in low KO animals (Fig.7B). Consistent with the reduced firing threshold, Pten KO granule cells receive increased excitatory synaptic drive, are hyperexcitable, and can show bursting behavior (Santos et al., 2017; Skelton et al., 2019; 2020). Low KO animals also exhibit secondary spikes, which are low amplitude and short duration; these spikes are indicative of recurrent circuitry. The characteristics of these secondary spikes are consistent with only KO cells being activated by the low current. Supporting this interpretation, spikes were consistently eliminated by silencing KO cells. More intense stimulation (>400 μA) usually produced more pronounced abnormal responses. Higher intensity stimulation is predicted to activate a mix of Pten-expressing and KO cells, and correspondingly, responses were more variable. Variable responses could reflect subtle differences that favor the dominance of either PTEN KO or PTEN-expressing cells. Taken together, these findings demonstrate that KO cells create a recurrent circuit that can be activated independently of adjacent Pten-expressing cells, suggesting the presence of complex circuit dynamics that will be fruitful to explore in future work.
In contrast to low KOs, responses in high KOs were consistently abnormal at all stimulus intensities, manifesting as either small asynchronous or large synchronous recurrent spikes. Optogenetic silencing only eliminated secondary spikes in a subset of cases. This suggests that Pten-expressing cells have been recruited into the recurrent circuit, although incomplete silencing of KO cells could contribute as well. These findings indicate that in high KO mice, pathological responses dominate the circuit behavior.
In the normal dentate, feedback and feed-forward inhibition prevents granule cells from firing recurrent population spikes. By contrast, even low KO slices exhibited multiple recurrent spikes. An impaired inhibition/excitation balance likely contributes to the persistent activity. Pten KO cells are known to have increased synaptic connectivity and more presynaptic partners (Barrows et al., 2017; Skelton et al., 2019), as well as increased excitatory synaptic transmission (Weston et al., 2012). Cultured Pten KO cells were shown to have heightened presynaptic connections with inhibitory cells as well (Barrows et al., 2017). While Pten KO cells in our model receive more excitatory input than normal granule cells, they have less inhibitory input (Santos et al., 2017). We suspect the difference in inhibitory input between cultured cells and our Pten KO cells is due to the decrease in inhibitory cell numbers in our model. Cell loss would result in weaker inhibitory feedback and feed-forward control of Pten KO cells and facilitate the appearance of secondary spikes.
In the present study we assessed the number and density of PV, SST and NPY-expressing interneurons. PV-expressing cells are responsible for both feed-forward and feedback inhibition onto granule cells, while SST cells provide feedback inhibition. NPY modulates transmission from mossy fiber axons and has anticonvulsive effects (Baraban et al., 1997; DePrato Primeaux et al., 2000; Marsh et al., 1999; Woldbye, 1998; Woldbye et al., 1997). Stereological counts in high KO animals (17–40%) revealed an overall 19% reduction when all three types were combined, while subtype-specific measures indicate that the SST subpopulation is most severely affected. The simplest explanation for the disappearance of these inhibitory cells is that they have died, although it is a formal possibility that relevant marker proteins have been downregulated, rendering them undetectable with these approaches. Dysfunction or loss of these cell populations has been shown to exacerbate dentate hyperexcitability (Andre et al., 2001; Buckmaster and Dudek, 1997; Ledri et al., 2012; Sloviter, 1991b).
Hilar interneurons are directly innervated by granule cells (Acsády et al., 1998). A plausible scenario for the disappearance of these cells, therefore, is that Pten KO cells hyperexcite and kill their target interneurons. Significantly, this reverses the sequence of changes observed in status epilepticus models of epilepsy, in which interneuron loss precedes granule cell dysmorphogenesis (Sloviter, 1992). The relevance of status epilepticus models to human epilepsy has been widely questioned (Klein et al., 2018), increasing the relevance of models that follow distinct trajectories. Indeed, if this sequence is recapitulated in human epilepsy, then strategies to prevent interneuron loss could be viable anti-epileptogenic approaches.
In conclusion, the present study demonstrates that increasing the load of Pten KO hippocampal granule cells drives a cascade of epileptogenic changes, evident as subtle shifts in circuit behavior in low KOs, progressing to convulsive seizures and cell loss in high KOs. Optogenetic silencing studies indicate that at least in low KOs, KO cells directly drive circuit pathology, while evidence of cell loss in high KOs suggests the cells can drive disease progression by disrupting initially healthy neighbors. This latter observation has important implication for translational therapies, as it implies that effective treatments for mTORopathies will need to address both direct effects of mTOR hyperactivation, and secondary impacts of the mutant neurons on the surrounding networks.
Supplementary Material
Supplemental Figure 1. Increasing perforant path stimulation increases fEPSP slope and population spike amplitude. A: Arch PTEN knockouts slices with high (>15%) and low (<15%) knockout cell loads, controls, and low PTEN knockouts without the Arch protein showed increasing slope with increasing current. The high knockout slices had larger slopes than all other groups at 400μA (p’s<0.05) and 500μA (p’s<0.001), whereas other groups did not differ. B: Perforant path stimulation during laser exposure produced the same fEPSP results, with an interaction between groups and increasing current, increased slope with increased current, and high knockout slices had larger slopes at 400 and 500 μA (p’s<0.05). C: The ratio of the fEPSP during laser stimulation to baseline showed no changes in the fEPSP slope when silencing granule cells. D: fEPSP slope ratios did not change as a function of PTEN knockout cell number. E, F: Increasing perforant path stimulation caused an increased population spike amplitude, without (E) and with laser exposures (F) for all groups, without group differences. G: The ratio of the population spike amplitude, with and without laser exposure, revealed no changes in control slices (with Arch) and PTEN knockout slices without Arch. Low and high PTEN knockouts with Arch had a decline in the population spike with laser exposure at 100 μA of current (low Arch knockouts compared to 200–500 μA, p’s< 0.001; high knockouts compared to 300–500 μA, p≤ 0.002). H: Arch PTEN knockout percentage was positively correlated to the population spike ratio at 100 μA of current stimulation, demonstrating that slices with low amounts of PTEN knockout cells had the greatest reductions in the population spike amplitude with laser exposure at low stimulation.
Highlights.
Low levels of Pten KO hippocampal granule cells produce subclinical brain hyperexcitability
High Pten KO granule cell loads are associated with generalized seizures and interneuron loss
Pten KO granule cells mediate the formation of recurrent excitatory circuits
Pten KO cells initiate secondary changes in surrounding, initially normal neuronal circuits
Acknowledgements
This work was supported by the National Institute of Neurological Disorders and Stroke (SCD, Awards R01NS065020 and R01NS062806; CLL, F32NS083239). The content is solely the responsibility of the authors and does not necessarily represent the official views of the National Institute of Neurological Disorders and Stroke or the National Institutes of Health. We would like to thank the Cincinnati Children’s Hospital Medical Center Confocal Imaging Core for their assistance with confocal image acquisition and analysis. We further thank Dr. Lili Ding for help with statistical analyses.
Footnotes
Publisher's Disclaimer: This is a PDF file of an unedited manuscript that has been accepted for publication. As a service to our customers we are providing this early version of the manuscript. The manuscript will undergo copyediting, typesetting, and review of the resulting proof before it is published in its final form. Please note that during the production process errors may be discovered which could affect the content, and all legal disclaimers that apply to the journal pertain.
The authors have declared that no conflict of interest exists.
References
- Acsády L, Kamondi A, Sik A, Freund T, Buzsaki G, 1998. GABAergic cells are the major postsynaptic targets of mossy fibers in the rat hippocampus. J Neurosci 18, 3386–3403. [DOI] [PMC free article] [PubMed] [Google Scholar]
- Ahn S, Joyner AL, 2004. Dynamic Changes in the Response of Cells to Positive Hedgehog Signaling during Mouse Limb Patterning. Cell 118, 505–516. [DOI] [PubMed] [Google Scholar]
- Ahn S, Joyner AL, 2005. In vivo analysis of quiescent adult neural stem cells responding to Sonic hedgehog. Nature 437, 894–897. [DOI] [PubMed] [Google Scholar]
- Andersen P, Holmqvist B, Voorhoeve PE, 1966. Entorhinal activation of dentate granule cells. Acta Physiol Scand 66, 448–460. [DOI] [PubMed] [Google Scholar]
- Andre V, Marescaux C, Nehlig A, Fritschy JM, 2001. Alterations of hippocampal GAbaergic system contribute to development of spontaneous recurrent seizures in the rat lithium-pilocarpine model of temporal lobe epilepsy. Hippocampus 11, 452–468. [DOI] [PubMed] [Google Scholar]
- Arafa SR, LaSarge CL, Pun RYK, Khademi S, Danzer SC, 2019. Self-reinforcing effects of mTOR hyperactive neurons on dendritic growth. Exp Neurol 311, 125–134. [DOI] [PMC free article] [PubMed] [Google Scholar]
- Baraban SC, Hollopeter G, Erickson JC, Schwartzkroin PA, Palmiter RD, 1997. Knock-out mice reveal a critical antiepileptic role for neuropeptide Y. J Neurosci 17, 8927–8936. [DOI] [PMC free article] [PubMed] [Google Scholar]
- Barrows CM, McCabe MP, Chen H, Swann JW, Weston MC, 2017. PTEN Loss Increases the Connectivity of Fast Synaptic Motifs and Functional Connectivity in a Developing Hippocampal Network. J Neurosci 37, 8595–8611. [DOI] [PMC free article] [PubMed] [Google Scholar]
- Buckmaster PS, Dudek FE, 1997. Neuron loss, granule cell axon reorganization, and functional changes in the dentate gyrus of epileptic kainate-treated rats. J Comp Neurol 385, 385–404. [PubMed] [Google Scholar]
- Clements JD, Bekkers JM, 1997. Detection of spontaneous synaptic events with an optimally scaled template. Biophys J 73, 220–229. [DOI] [PMC free article] [PubMed] [Google Scholar]
- Crino PB, 2020. mTORopathies: A Road Well-Travelled. Epilepsy Currents, 20.6 supplemental. [DOI] [PMC free article] [PubMed] [Google Scholar]
- DePrato Primeaux S, Holmes PV, Martin RJ, Dean RG, Edwards GL, 2000. Experimentally induced attenuation of neuropeptide-Y gene expression in transgenic mice increases mortality rate following seizures. Neurosci Lett 287, 61–64. [DOI] [PubMed] [Google Scholar]
- Getz SA, DeSpenza T Jr, Li M, Luikart BW., 2016. Rapamycin prevents, but does not reverse, aberrant migration in Pten knockout neurons. Neurobiol Dis 93:12–20. [DOI] [PMC free article] [PubMed] [Google Scholar]
- Hardison JL, Okazaki MM, Nadler JV, 2000. Modest increase in extracellular potassium unmasks effect of recurrent mossy fiber growth. J Neurophysiol 84, 2380–2389. [DOI] [PubMed] [Google Scholar]
- Jones RS, Heinemann U, 1988. Synaptic and intrinsic responses of medical entorhinal cortical cells in normal and magnesium-free medium in vitro. J Neurophysiol 59, 1476–1496. [DOI] [PubMed] [Google Scholar]
- Klein P, Dingledine R, Aronica E, Bernard C, Blumcke I, Boison D, Brodie MJ, Brooks-Kayal AR, Engel J Jr., Forcelli PA, Hirsch LJ, Kaminski RM, Klitgaard H, Kobow K, Lowenstein DH, Pearl PL, Pitkanen A, Puhakka N, Rogawski MA, Schmidt D, Sillanpaa M, Sloviter RS, Steinhauser C, Vezzani A, Walker MC, Loscher W, 2018. Commonalities in epileptogenic processes from different acute brain insults: Do they translate? Epilepsia 59, 37–66. [DOI] [PMC free article] [PubMed] [Google Scholar]
- Koh HY, Lee JH, 2018. Brain Somatic Mutations in Epileptic Disorders. Molecules and cells 41, 881–888. [DOI] [PMC free article] [PubMed] [Google Scholar]
- LaSarge CL, Pun RY, Muntifering MB, Danzer SC, 2016. Disrupted hippocampal network physiology following PTEN deletion from newborn dentate granule cells. Neurobiol Dis 96, 105–114. [DOI] [PMC free article] [PubMed] [Google Scholar]
- LaSarge CL, Santos VR, Danzer SC, 2015. PTEN deletion from adult-generated dentate granule cells disrupts granule cell mossy fiber axon structure. Neurobiol Dis 75, 142–150. [DOI] [PMC free article] [PubMed] [Google Scholar]
- LaSarge CL, Pun RY, Gu Z, Santos VR and Danzer SC, 2019. Impact of mTOR hyperactive neurons on the morphology and physiology of adjacent neurons: Do PTEN KO cells make bad neighbors? Experimental Neurology, 321:113029. [DOI] [PMC free article] [PubMed] [Google Scholar]
- Ledri M, Nikitidou L, Erdelyi F, Szabo G, Kirik D, Deisseroth K, Kokaia M, 2012. Altered profile of basket cell afferent synapses in hyper-excitable dentate gyrus revealed by optogenetic and two-pathway stimulations. Eur J Neurosci 36, 1971–1983. [DOI] [PubMed] [Google Scholar]
- Li Y, Stam FJ, Aimone JB, Goulding M, Callaway EM, Gage FH, 2013. Molecular layer perforant path-associated cells contribute to feed-forward inhibition in the adult dentate gyrus. Proceedings of the National Academy of Sciences of the United States of America 110, 9106–9111. [DOI] [PMC free article] [PubMed] [Google Scholar]
- Macias M, Blazejczyk M, Kazmierska P, Caban B, Skalecka A, Tarkowski B, Rodo A, Konopacki J, Jaworski J, 2013. Spatiotemporal characterization of mTOR kinase activity following kainic acid induced status epilepticus and analysis of rat brain response to chronic rapamycin treatment. PLoS One 8, e64455. [DOI] [PMC free article] [PubMed] [Google Scholar]
- Mathews EA, Morgenstern NA, Piatti VC, Zhao C, Jessberger S, Schinder AF, Gage FH., 2010. A distinctive layering pattern of mouse dentate granule cells is generated by developmental and adult neurogenesis. J Comp Neurol 518(22):4479–90. [DOI] [PMC free article] [PubMed] [Google Scholar]
- Marsan E, Baulac S., 2018. Mechanistic target of rapamycin (mTOR) pathway, focal cortical dysplasia and epilepsy. Neuropathol Appl Neurobiol 44(1):6–17. [DOI] [PubMed] [Google Scholar]
- Marsh DJ, Baraban SC, Hollopeter G, Palmiter RD, 1999. Role of the Y5 neuropeptide Y receptor in limbic seizures. Proceedings of the National Academy of Sciences 96, 13518–13523. [DOI] [PMC free article] [PubMed] [Google Scholar]
- McNaughton BL, Barnes CA, Andersen P, 1981. Synaptic efficacy and EPSP summation in granule cells of rat fascia dentata studied in vitro. Journal of Neurophysiology 46, 952–966. [DOI] [PubMed] [Google Scholar]
- Nakamura T, Colbert MC, Robbins J, 2006. Neural crest cells retain multipotential characteristics in the developing valves and label the cardiac conduction system. Circulation research 98, 1547–1554. [DOI] [PubMed] [Google Scholar]
- Nguyen LH, Mahadeo T, Bordey A., 2019. mTOR Hyperactivity Levels Influence the Severity of Epilepsy and Associated Neuropathology in an Experimental Model of Tuberous Sclerosis Complex and Focal Cortical Dysplasia. J Neurosci 39(14):2762–2773. [DOI] [PMC free article] [PubMed] [Google Scholar]
- Okamoto OK, Janjoppi L, Bonone FM, Pansani AP, da Silva AV, Scorza FA, Cavalheiro EA, 2010. Whole transcriptome analysis of the hippocampus: toward a molecular portrait of epileptogenesis. BMC genomics 11, 230. [DOI] [PMC free article] [PubMed] [Google Scholar]
- Patrylo PR, Schweitzer JS, Dudek FE, 1999. Abnormal responses to perforant path stimulation in the dentate gyrus of slices from rats with kainate-induced epilepsy and mossy fiber reorganization. Epilepsy research 36, 31–42. [DOI] [PubMed] [Google Scholar]
- Paxinos G, Franklin KBJ, 2001. The Mouse Brain in Stereotaxic Coordinates. Academic Press: San Diego. [Google Scholar]
- Pinault D, 1996. A novel single-cell staining procedure performed in vivo under electrophysiological control: morpho-functional features of juxtacellularly labeled thalamic cells and other central neurons with biocytin or Neurobiotin. Journal of neuroscience methods 65, 113–136. [DOI] [PubMed] [Google Scholar]
- Pun RY, Rolle IJ, Lasarge CL, Hosford BE, Rosen JM, Uhl JD, Schmeltzer SN, Faulkner C, Bronson SL, Murphy BL, Richards DA, Holland KD, Danzer SC, 2012. Excessive activation of mTOR in postnatally generated granule cells is sufficient to cause epilepsy. Neuron 75, 1022–1034. [DOI] [PMC free article] [PubMed] [Google Scholar]
- Ribak CE, Seress L, 1983. Five types of basket cell in the hippocampal dentate gyrus: a combined Golgi and electron microscopic study. J Neurocytol 12, 577–597. [DOI] [PubMed] [Google Scholar]
- Santos VR, Pun RYK, Arafa SR, LaSarge CL, Rowley S, Khademi S, Bouley T, Holland KD, Garcia-Cairasco N, Danzer SC, 2017. PTEN deletion increases hippocampal granule cell excitability in male and female mice. Neurobiol Dis 108, 339–351. [DOI] [PMC free article] [PubMed] [Google Scholar]
- Skelton PD, Frazel PW, Lee D, Suh H, Luikart BW, 2019. Pten loss results in inappropriate excitatory connectivity. Molecular psychiatry 24(11):1627–1640. [DOI] [PMC free article] [PubMed] [Google Scholar]
- Skelton PD, Stan RV, Luikart BW., 2020. The Role of PTEN in Neurodevelopment. Mol Neuropsychiatry 5(Suppl 1):60–71. [DOI] [PMC free article] [PubMed] [Google Scholar]
- Sloviter RS, 1991a. Feedforward and feedback inhibition of hippocampal principal cell activity evoked by perforant path stimulation: GABA-mediated mechanisms that regulate excitability in vivo. Hippocampus 1, 31–40. [DOI] [PubMed] [Google Scholar]
- Sloviter RS, 1991b. Permanently altered hippocampal structure, excitability, and inhibition after experimental status epilepticus in the rat: the “dormant basket cell” hypothesis and its possible relevance to temporal lobe epilepsy. Hippocampus 1, 41–66. [DOI] [PubMed] [Google Scholar]
- Sloviter RS, 1992. Possible functional consequences of synaptic reorganization in the dentate gyrus of kainate-treated rats. Neuroscience Letters 137, 91–96. [DOI] [PubMed] [Google Scholar]
- Sun H, Kosaras B, Klein PM, Jensen FE, 2013. Mammalian target of rapamycin complex 1 activation negatively regulates Polo-like kinase 2-mediated homeostatic compensation following neonatal seizures. Proc Natl Acad Sci U S A 110, 5199–5204. [DOI] [PMC free article] [PubMed] [Google Scholar]
- Talos DM, Sun H, Zhou X, Fitzgerald EC, Jackson MC, Klein PM, Lan VJ, Joseph A, Jensen FE, 2012. The interaction between early life epilepsy and autistic-like behavioral consequences: a role for the mammalian target of rapamycin (mTOR) pathway. PLoS One 7, e35885. [DOI] [PMC free article] [PubMed] [Google Scholar]
- Talos DM, Jacobs LM, Gourmaud S, Coto CA, Sun H, Lim KC, Lucas TH, Davis KA, Martinez-Lage M, Jensen FE., 2018. Mechanistic target of rapamycin complex 1 and 2 in human temporal lobe epilepsy. Ann Neurol 83(2):311–327. [DOI] [PMC free article] [PubMed] [Google Scholar]
- Ting JT, Daigle TL, Chen Q, Feng G, 2014. Acute brain slice methods for adult and aging animals: application of targeted patch clamp analysis and optogenetics. Methods in molecular biology (Clifton, N.J.) 1183, 221–242. [DOI] [PMC free article] [PubMed] [Google Scholar]
- Walter C, Murphy BL, Pun RYK, Spieles-Engemann AL, Danzer SC, 2007. Pilocarpine-Induced Seizures Cause Selective Time-Dependent Changes to Adult-Generated Hippocampal Dentate Granule Cells. The Journal of Neuroscience 27, 7541–7552. [DOI] [PMC free article] [PubMed] [Google Scholar]
- Weston MC, Chen H, Swann JW, 2012. Multiple roles for mammalian target of rapamycin signaling in both glutamatergic and GABAergic synaptic transmission. J Neurosci 32, 11441–11452. [DOI] [PMC free article] [PubMed] [Google Scholar]
- Woldbye DP, 1998. Antiepileptic effects of NPY on pentylenetetrazole seizures. Regul Pept 75–76, 279–282. [DOI] [PubMed] [Google Scholar]
- Woldbye DP, Larsen PJ, Mikkelsen JD, Klemp K, Madsen TM, Bolwig TG, 1997. Powerful inhibition of kainic acid seizures by neuropeptide Y via Y5-like receptors. Nat Med 3, 761–764. [DOI] [PubMed] [Google Scholar]
- Zhang B, Wong M, 2012. Pentylenetetrazole-induced seizures cause acute, but not chronic, mTOR pathway activation in rat. Epilepsia 53, 506–511. [DOI] [PMC free article] [PubMed] [Google Scholar]
Associated Data
This section collects any data citations, data availability statements, or supplementary materials included in this article.
Supplementary Materials
Supplemental Figure 1. Increasing perforant path stimulation increases fEPSP slope and population spike amplitude. A: Arch PTEN knockouts slices with high (>15%) and low (<15%) knockout cell loads, controls, and low PTEN knockouts without the Arch protein showed increasing slope with increasing current. The high knockout slices had larger slopes than all other groups at 400μA (p’s<0.05) and 500μA (p’s<0.001), whereas other groups did not differ. B: Perforant path stimulation during laser exposure produced the same fEPSP results, with an interaction between groups and increasing current, increased slope with increased current, and high knockout slices had larger slopes at 400 and 500 μA (p’s<0.05). C: The ratio of the fEPSP during laser stimulation to baseline showed no changes in the fEPSP slope when silencing granule cells. D: fEPSP slope ratios did not change as a function of PTEN knockout cell number. E, F: Increasing perforant path stimulation caused an increased population spike amplitude, without (E) and with laser exposures (F) for all groups, without group differences. G: The ratio of the population spike amplitude, with and without laser exposure, revealed no changes in control slices (with Arch) and PTEN knockout slices without Arch. Low and high PTEN knockouts with Arch had a decline in the population spike with laser exposure at 100 μA of current (low Arch knockouts compared to 200–500 μA, p’s< 0.001; high knockouts compared to 300–500 μA, p≤ 0.002). H: Arch PTEN knockout percentage was positively correlated to the population spike ratio at 100 μA of current stimulation, demonstrating that slices with low amounts of PTEN knockout cells had the greatest reductions in the population spike amplitude with laser exposure at low stimulation.