Abstract
Metabolic deregulation, a hallmark of cancer, fuels cancer cell growth and metastasis. Here, we show that phosphoserine phosphatase (PSPH), part of the serine metabolism pathway, is upregulated in patient-derived melanoma samples. PSPH knockdown using short hairpin RNAs (shRNAs) blocks melanoma tumor growth and metastasis in both cell culture and mice. To elucidate the mechanism underlying PSPH action, we evaluated PSPH shRNA-expressing melanoma cells using global metabolomics and targeted mRNA expression profiling. Metabolomics analysis showed increase in 2-hydroxyglutarate (2-HG) levels in PSPH knockdown cells. 2-HG inhibits the TET family of DNA demethylases and the Jumonji family of histone demethylases (KDM and JMJD), which is known to impact gene expression. Consistent with these data, PSPH knockdown in melanoma cells showed reduced DNA 5-hydroxymethylcytosine (5hmC) and increased histone H3K4me3 modifications. 2-HG treatment also inhibited melanoma growth. The nCounter PanCancer Pathways Panel–based mRNA expression profiling revealed attenuation of a number of cancer-promoting pathways upon PSPH knockdown. In particular, PSPH was necessary for nuclear receptor NR4A1 expression. Ectopic NR4A1 expression partly rescued growth of melanoma cells expressing PSPH shRNA. Collectively, these results link PSPH to facilitation of melanoma growth and metastasis through suppression of 2-HG and thus activation of pro-oncogenic gene expression.
INTRODUCTION
Melanoma is the most lethal form of skin cancer and accounts for over 80% of skin- cancer–related deaths [1, 2]. Genome-wide approaches examining melanoma patient samples have led to four major molecular classifications: NRAS mutant, BRAF mutant, NF1-deficient, and triple wild-type (BRAF, NRAS, and NF1 wild-type) [3]. Current therapies for metastatic melanoma include using BRAF kinase and MEK kinase inhibitors to target BRAF-mutant melanomas [4, 5]. However, the benefits of BRAFi and MEKi are short-lived due to the rapid emergence of drug resistance [6]. Similarly, although immunotherapies lead to a durable therapeutic response in metastatic melanoma patients, they are only effective in a subset of melanoma patients, and resistance to these immunotherapies is not uncommon [7, 8]. Thus, further understanding of melanoma is required to more effectively treat this deadly disease.
Metabolic alterations, such as aerobic glycolysis (i.e., fermentation of glucose to produce lactate even in the presence of oxygen, also known as the Warburg effect), were among the earliest observed metabolic hallmarks of cancer cells [9]. Melanoma cells are known to be metabolically heterogeneous and capable of utilizing different metabolites for ATP production and macromolecule synthesis, facilitating tumor growth and metastasis [10]. MAPK pathway activation, along with other factors, including the transcription factors MYC, HIF1α, and MITF, enables metabolic reprogramming of melanoma cells that allows growth, even under nutrient-depleted conditions [11].
Enhanced serine biosynthesis is one of the most important metabolic adaptations and is observed in several cancer types [12, 13]. 3-Phosphoglycerate dehydrogenase (PHGDH) catalyzes the transition of 3-phosphoglycerate into 3-phosphohydroxypyruvate, the rate-limiting, first step in the phosphorylation pathway of serine biosynthesis. In addition, PHGDH catalyzes the conversion of α-ketoglutarate to the oncometabolite D-2-hydroxyglutarate (D-2-HG) through NADH-dependent reduction, thus serving as one source of D-2-HG [14]. PHGDH is amplified in ~39% of melanomas and PHGDH overexpression has been shown to promote the growth of tumors in mouse models of melanoma and breast cancer [15]. PHGDH-amplified melanoma cells divert glycolytic flux toward serine and glycine metabolism, which contributes to oncogenesis by supporting increased melanoma cell proliferation [16–18]. Similarly, overexpression of PSAT1 and PSPH, two other enzymes of the serine synthesis pathway, has been shown to occur in several cancer types [19–23]. However, unlike PHGDH, the roles of PSAT1 and PSPH in cancer are less well understood.
The PSPH gene encodes phosphoserine phosphatase, which catalyzes the final, irreversible step of L-serine synthesis and thus lies downstream of PHGDH in the serine biosynthesis pathway. Here, we show that PSPH is overexpressed in patient-derived melanoma samples, and that it is necessary for tumor growth and metastasis. Mechanistically, we show that PSPH loss results in altered histone H3 and DNA methylation that dampens oncogenic gene expression, including repression of the melanoma-promoting nuclear receptor, NR4A1. We link these changes to increased 2-HG levels in melanoma cells that block melanoma growth. Through these data, we gain insight into changes in serine metabolism that contribute to the growth of melanoma cells and thereby reveal the complex interplay between metabolism and epigenetics that regulates transcriptional output to promote melanoma growth and metastasis.
Results
PSPH is upregulated in patient-derived melanoma samples
The serine biosynthesis pathway is one of the most important metabolic adaptations in cancer cells [12, 13]. Previous studies have shown that PHGDH is important for growth and progression of several cancers, including melanoma [16–18]. However, the role of PSPH has not been explored in melanoma. Therefore, with the goal of understanding the function of PSPH in melanoma, we first analyzed a number of different publicly available gene expression datasets of patient-derived melanoma to identify possible facilitators of melanoma growth and metastasis. During this analysis, we discovered a significant increase in the expression of PSPH mRNA in patient-derived melanoma samples compared to those derived from normal skin (Fig. 1a). PSPH expression was also significantly higher in samples of metastatic melanoma compared to samples of primary melanoma (Fig. 1b). Furthermore, we found that PSPH expression was also significantly upregulated in The Cancer Genome Atlas (TCGA) melanoma dataset (Fig. 1c). To confirm the results of our findings, we also measured PSPH protein levels in melanoma samples. Immunohistochemical (IHC) analysis was conducted using a melanoma tissue microarray (TMA) consisting of 148 samples from malignant melanoma and 10 normal skin controls using automated quantitative analysis (AQUA). AQUA can quantitatively measure protein expression in tumor tissues [24]. AQUA-based analysis revealed significant upregulation of PSPH in melanoma cancer patients (Fig. 1d–e, Fig. S1a, and Table S1). Collectively, these results show that PSPH is upregulated in melanoma and its expression increases with metastatic progression.
Fig. 1. PSPH is overexpressed in melanoma.
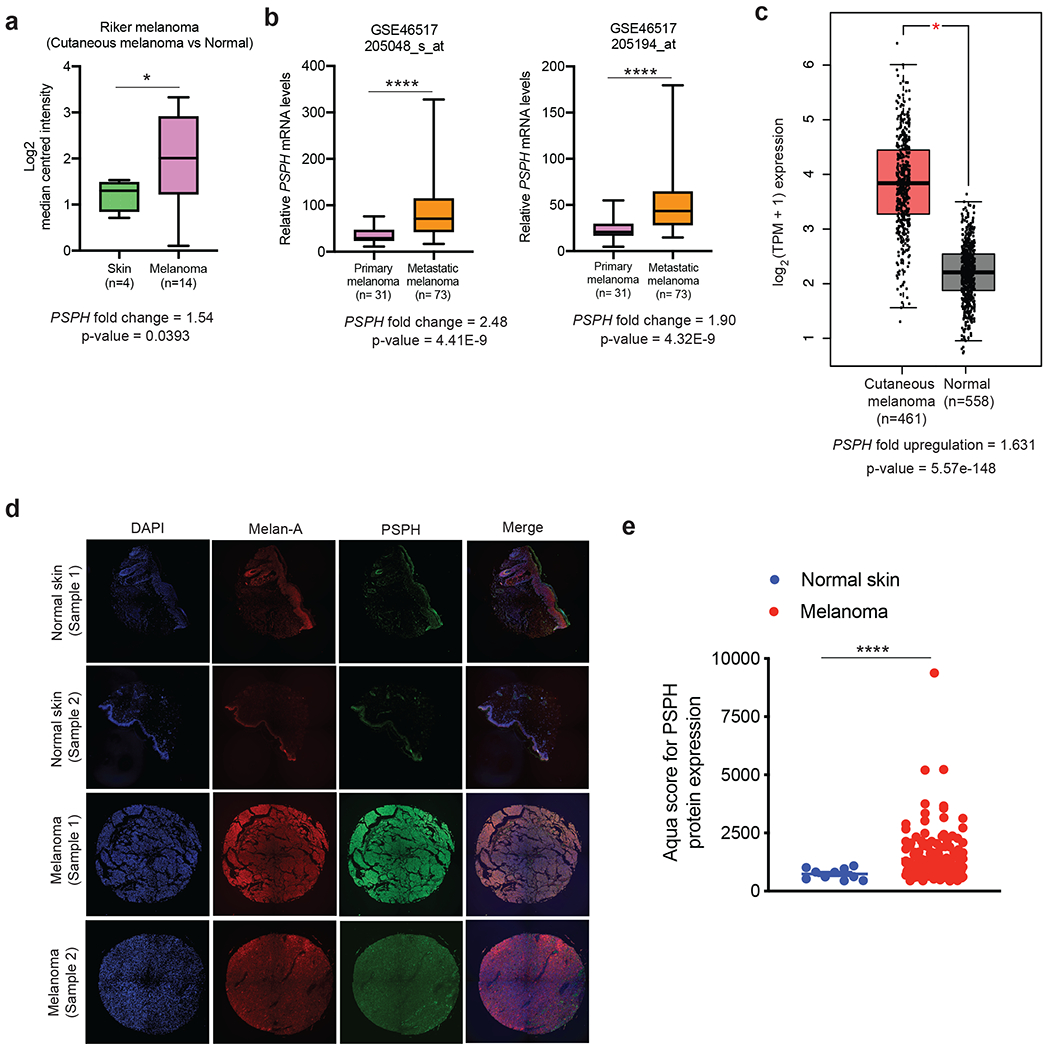
a. The indicated melanoma datasets were analyzed for PSPH mRNA expression. The relative PSPH mRNA expression in patient-derived melanoma samples was compared with normal skin. b. Comparison of PSPH expression in patient-derived melanoma samples from subjects with metastatic melanoma and those with primary melanoma. c. Comparison of PSPH mRNA expression in TCGA melanoma samples with GTEx and TCGA normal samples combined. d. Quantitative immunofluorescence analysis of Tissue Microarray (TMA) with melanoma and normal skin samples. Representative AQUA immunofluorescence images of the indicated melanoma cell type and normal skin samples. Samples are stained for DAPI, Melan-A, and PSPH as indicated. e. The average AQUA scores for melanoma and normal skin samples are plotted and presented as the mean ± standard error of the mean (SEM). * and **** represent P < 0.05 and P < 0.0001, respectively.
PSPH is necessary for tumor growth and for maintaining metastatic characteristics
The finding that PSPH is upregulated in melanoma, and that its expression increases with metastatic progression, suggested a potentially important role for PSPH in melanoma tumor biology. Therefore, we knocked down PSPH expression in melanoma cell lines representing different BRAF/NRAS subgroups (A375, M14, MeWo, and YUGASP) (Fig. S1b–c). These knockdown cells were then analyzed for various tumor-cell–associated phenotypes using cell and mouse-based assays. First, we monitored the ability of PSPH knockdown melanoma cells to form colonies in an anchorage-independent manner using soft-agar assay. Fig. 2a and 2b show that PSPH knockdown significantly reduced the ability of various melanoma cells to form colonies compared with cells expressing nonspecific control shRNA. To confirm the specificity of PSPH knockdown and its effect on melanoma tumor growth, we knocked down the expression of PSPH using 3’-UTR–targeting shRNAs in melanoma cell lines (A375 and MeWo) and ectopically expressed the PSPH open-reading frame (ORF) that lacks the 3’-UTR and, thus, is not subject to degradation by the 3’-UTR–targeting PSPH shRNAs (Fig. S2a and S2b). Using these stable cell lines, we performed a soft-agar assay. We found that ectopic expression of PSPH in melanoma cell lines (A375 and MeWo) expressing the 3-UTR–targeting PSPH shRNAs rescued their growth in soft agar (Fig. S2c and S2d). These results further confirm the role of PSPH in driving melanoma growth.
Fig. 2. PSPH is necessary for melanoma tumor growth and metastasis.
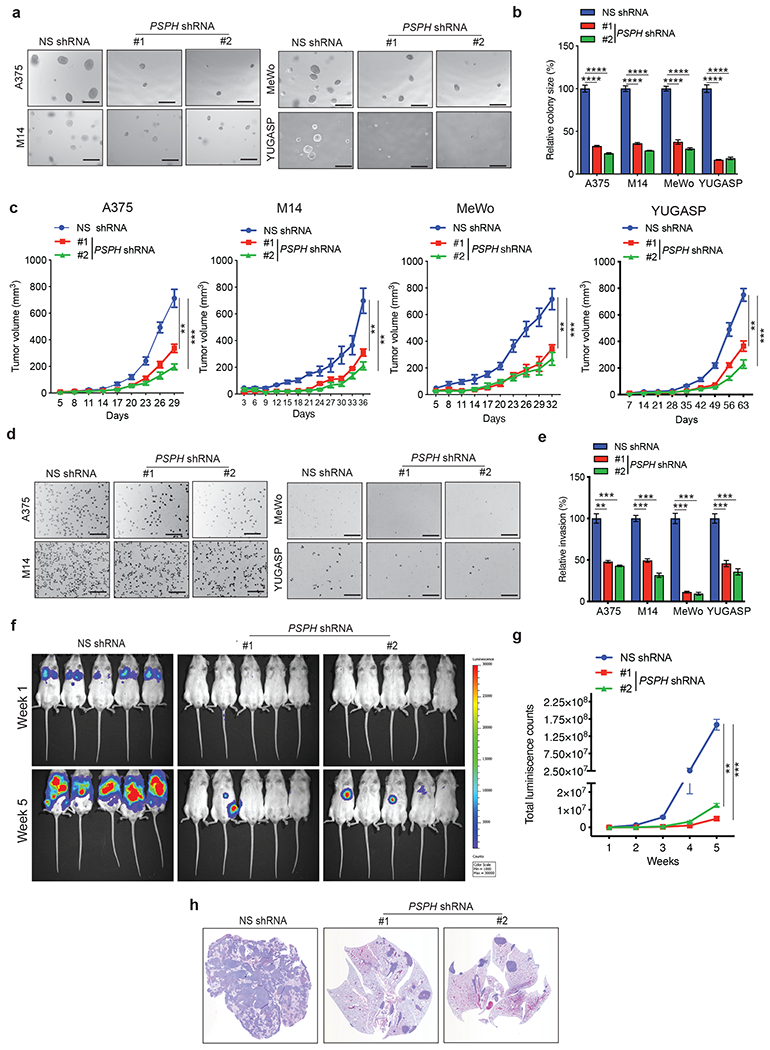
a. Anchorage-independent growth was measured using the soft-agar assay in indicated cell lines expressing either PSPH short hairpin RNA (shRNA) or a nonspecific (NS) control shRNA. Representative images of soft-agar colonies from the indicated melanoma cell lines are shown. Scale bar, 500 μm. b. Plot showing relative colony sizes from the soft-agar assay presented in panel A. c. Indicated melanoma cell lines expressing either PSPH shRNA or NS shRNA were subcutaneously injected into the flanks of athymic nude mice (n = 3). Average tumor volumes at the indicated time points are shown. d. Matrigel invasion assays with the indicated melanoma cell lines expressing PSPH shRNA or NS shRNA; representative images are shown. Scale bar, 200 μm. e. Relative invasion (%) from Matrigel assays shown in panel D. f. A375-MA2-F-Luc cells expressing PSPH shRNA or NS shRNA were administered to NSG mice (n = 5) via tail vein injection. Bioluminescence images of mice from the indicated groups at weeks 1 and 5 are shown. g. Quantitation of bioluminescence in the mice at the indicated time points. h. Representative images of hematoxylin-and-eosin (H&E)–stained lung sections showing the histology of lungs with tumor metastasis. Data are presented as the mean ± SEM; **, ***, and **** represent P < 0.01, P < 0.001 and P < 0.0001, respectively.
To further verify the role of PSPH in melanoma tumor growth in vivo, we injected melanoma cell lines (A375, M14, MeWo, and YUGASP) expressing either PSPH shRNAs or a nonspecific control shRNA subcutaneously into the flanks of athymic nude mice and monitored melanoma tumor growth. Consistent with the soft-agar assay results, PSPH knockdown significantly attenuated melanoma tumor growth in mice (Fig. 2c).
Because PSPH expression was significantly increased in metastatic melanoma samples, compared to primary melanoma, we assessed the effects of PSPH knockdown on invasion using a Matrigel invasion assay. Increased invasiveness is one of the characteristics of metastatic tumors [25]. We found that PSPH knockdown resulted in reduced invasion by melanoma cells (Fig. 2d and 2e). Furthermore, to verify the specificity of PSPH knockdown and its effect on melanoma cell invasion, we performed an invasion assay after ectopically expressing the PSPH ORF in melanoma cells expressing PSPH shRNAs targeting the 3’-UTR. We found that ectopic expression of PSPH in cells expressing the 3’-UTR–targeting PSPH shRNAs rescued their invasive ability in the matrigel invasion assay (Fig. S3). These results further confirm the role of PSPH in driving melanoma metastatic attributes.
Based on these findings, we asked if PSPH knockdown inhibits metastatic melanoma growth in mice. To this end, we administered firefly luciferase-labelled (F-Luc) metastatic melanoma (F-Luc-A375-MA2 or F-Luc-MeWo) cell lines expressing either a nonspecific shRNA or PSPH shRNAs to mice via tail vein injection to recapitulate lung metastatic growth. We found that PSPH knockdown significantly decreased the metastatic growth of melanoma cells in the lungs compared to the cells expressing a nonspecific shRNA (Fig. 2f–2h and Fig. S4). Collectively, these results demonstrate that PSPH knockdown significantly attenuates melanoma tumor growth and metastasis.
PSPH knockdown in melanoma cells leads to changes in serine and other metabolic pathways
PSPH is the metabolic enzyme that catalyzes the last step in the serine biosynthesis pathway [12, 13]. To understand the mechanism underlying the effects of PSPH knockdown on melanoma, we performed a global metabolomics analysis using capillary electrophoresis time-of-flight mass spectrometry (CE-TOFMS). A375 cells expressing PSPH shRNAs or an NS control shRNA were used for these studies. A total of 232 metabolites were detected using this analysis (119 metabolites in cation mode and 113 metabolites in anion mode) (Fig. 3a and Table S2). Remarkably, the metabolites associated with central carbon metabolism, lipid and amino acid metabolism, nucleic acid metabolism, urea cycle, coenzymes, and auxiliary metabolites were altered upon PSPH knockdown in A375 cells (Fig. 3b–c, Fig. 4a, Table S2 and Table S3). We also observed a decrease in arginine, serine, and N-methyllysine consistently in A375 cells expressing all three PSPH shRNAs, as determined by global metabolomics analysis (Fig. 4b and Table S2). Similarly, 2,3-DPG, malic acid, 6-phosphogluconic acid, sedoheptulose 7-phosphate, 2-hydroxyglutaric acid, and isovaleryl carnitine levels were consistently increased in cells expressing PSPH shRNAs compared to the control cells expressing nonspecific shRNA (Fig. 4c). Collectively, these data suggest that PSPH knockdown in A375 cells induces alterations in metabolites of several different metabolic pathways, including those linked to the serine synthesis pathway.
Fig. 3. PSPH loss results in widespread changes in metabolic pathways.
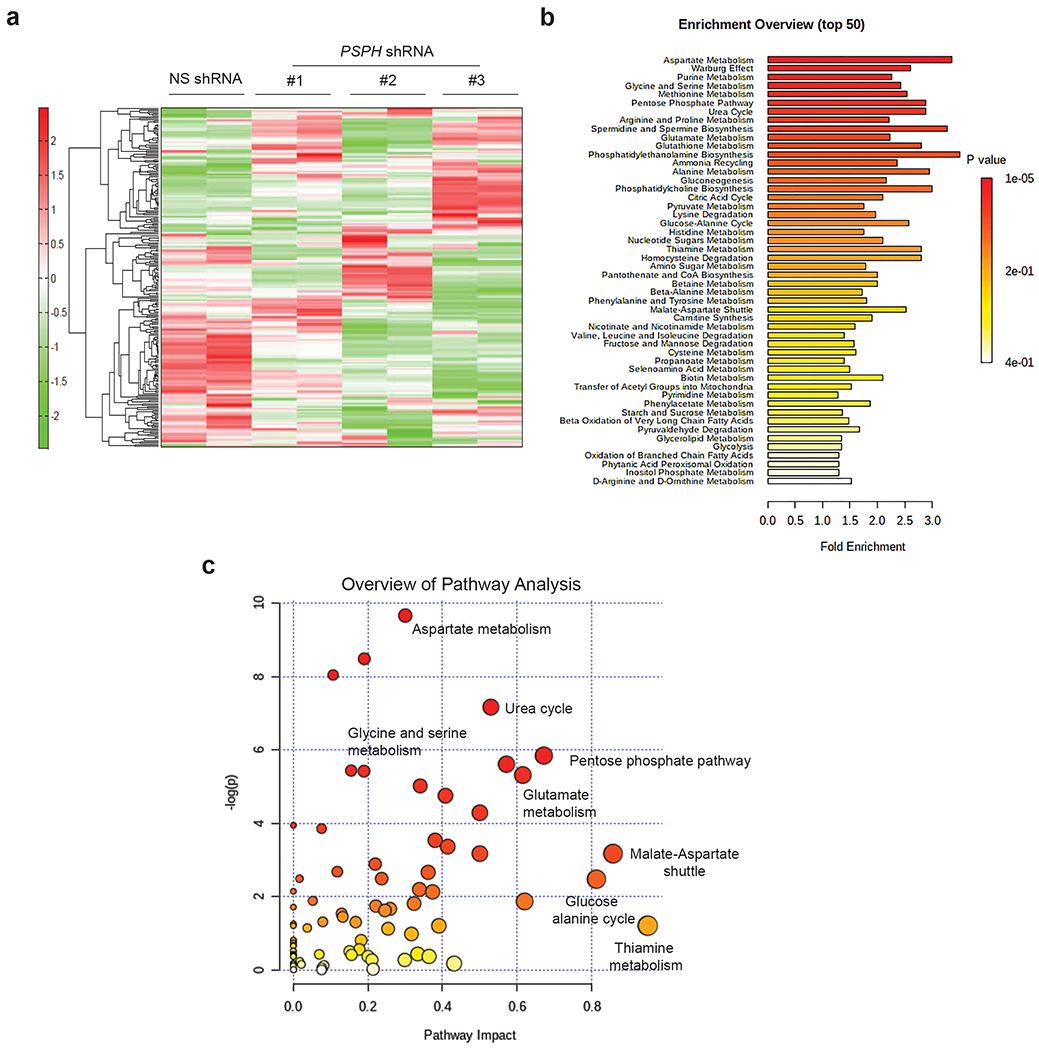
a. Heatmap showing the metabolite profile of A375 cells expressing PSPH shRNAs or a nonspecific (NS) control shRNA. b. Pathway enrichment analysis showing the top 50 metabolic pathways altered in A375 cells expressing PSPH shRNAs or a nonspecific (NS) shRNA using the MetaboAnalyst metabolic pathway analysis tool. c. Plot showing the calculated metabolic pathway impact score and relative log(p)-values of metabolic pathways altered in A375 cells as a result of shRNA-mediated PSPH knockdown. The indicated metabolic pathways associated with different metabolic processes using MetaboAnalyst, a metabolomics tool for pathway analysis and visualization.
Fig. 4. PSPH loss affects global changes in metabolic pathways.
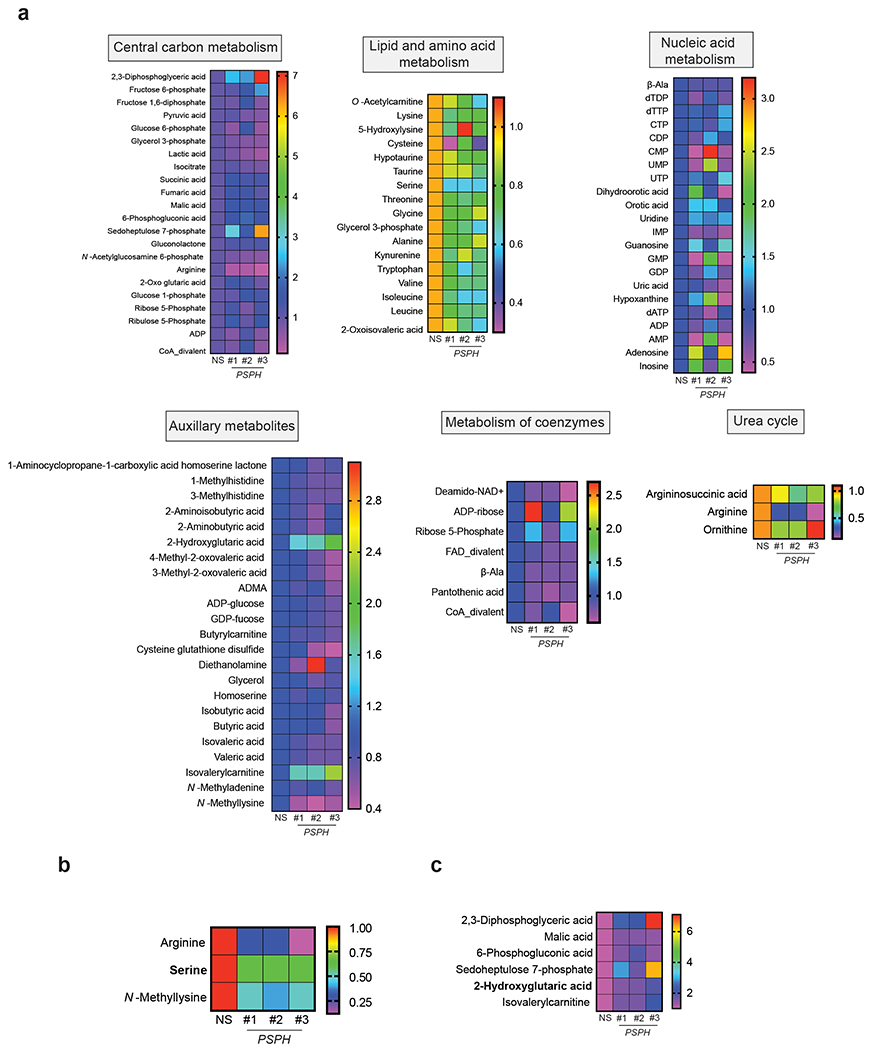
a. Heatmap showing the levels of indicated metabolites from indicated pathways in A375 cells expressing PSPH shRNAs or a nonspecific (NS) shRNA. The global metabolomics analysis was performed using biological replicates for each sample. b-c. The relative level of the indicated metabolites in A375 cells expressing PSPH shRNAs or a nonspecific (NS) shRNA.
Serine supplementation does not rescue PSPH-knockdown–induced melanoma growth inhibition
Because metabolomics analysis of PSPH-knockdown melanoma cells revealed reduced serine levels, we asked if exogenous serine supplementation can rescue PSPH knockdown-induced tumor-growth inhibition. To this end, we tested the growth of melanoma cells (A375, M14, and MeWo) expressing either a control NS shRNA or PSPH shRNA, with or without serine supplementation. Our results showed that exogenous serine supplementation did not rescue the effect of PSPH-knockdown–induced tumor growth inhibition (Fig. S5). These results are consistent with a previously reported study in which the effect of loss of another enzyme of the serine metabolism pathway, PHGDH, was also not rescued by exogenous serine supplementation [26]. These results can be explained by the fact that serine synthesis is one of the processes used by the cell to obtain alpha-ketoglutarate (a tricarboxylic acid [TCA] cycle intermediate), which acts as a co-factor for dioxygenases to regulate gene expression and adapt to hypoxia [26, 27]. In addition, in yeast, serine synthesis pathway enzymes are part of a complex that also contains enzymes linked to one-carbon metabolism, suggesting a nonenzymatic, scaffolding role for these proteins [28]. Collectively, our results show that serine supplementation does not rescue PSPH-knockdown–induced melanoma growth inhibition.
PSPH knockdown in melanoma cells leads to a reduction in global 5-hydroxymethylcytosine (5hmC) and increased H3K4me3 levels
A key finding in our metabolomics analysis is that 2-HG levels increase in melanoma cells expressing PSPH shRNAs compared to cells expressing a control NS shRNA (Fig. 3, Fig. 4 and Table S2). 2-HG is a competitive inhibitor of multiple α-ketoglutarate (KG)-dependent dioxygenases, and has been shown to inhibit the activity of TET family 5-methylcytosine (5mC) hydroxylases as well as histone demethylases [29, 30].
Because TET protein and histone demethylase activities are inhibited by 2-HG, we measured global levels of 5-hydroxymethylcytosine (5hmC) DNA modification and the H3K4me3 histone mark in PSPH shRNA-expressing melanoma cells. PSPH knockdown in melanoma cells resulted in reduced levels of the 5hmC DNA mark (Fig. 5a) and increased levels of histone H3K4me3 (Fig. 5b). Collectively, these results show that PSPH knockdown mimics the genetic aspects of increased 2-HG levels, which also result in a reduction in 5hmC and increase in H3K4me3 modifications. Next, to ask whether changes in 2-HG levels were directly linked to reduced levels of the 5hmC DNA mark and increased levels of histone H3K4me3 in PSPH knockdown cells, we performed a rescue experiment. To this end, we measured levels of 2-HG, 5hmC, and histone H3K4me3 in melanoma cells expressing the PSPH ORF and 3’-UTR–targeting PSPH shRNAs. Consistent with our PSPH knockdown results, 2-HG levels were lower in PSPH-ORF–expressing cells (Fig. S6a) and, further, corresponded to the levels of 5hmC and H3K4me3 (Fig. S6b–c). Finally, to directly measure that the reduced 5hmC and increased H3K4me3 are the result of increased 2-HG levels, we treated melanoma cell line A375 with 2-HG and measured the levels of 5hmC and H3K4me3 in these cells. Consistent with loss of PSPH expression in melanoma cells, treatment of melanoma cells with 2-HG resulted in reduced 5hmC levels (Fig. S6d) and increased H3K4me3 in melanoma cells (Fig. S6e).
Fig. 5. PSPH loss results in the inhibition of H3K4me3 and 5hmC marks.
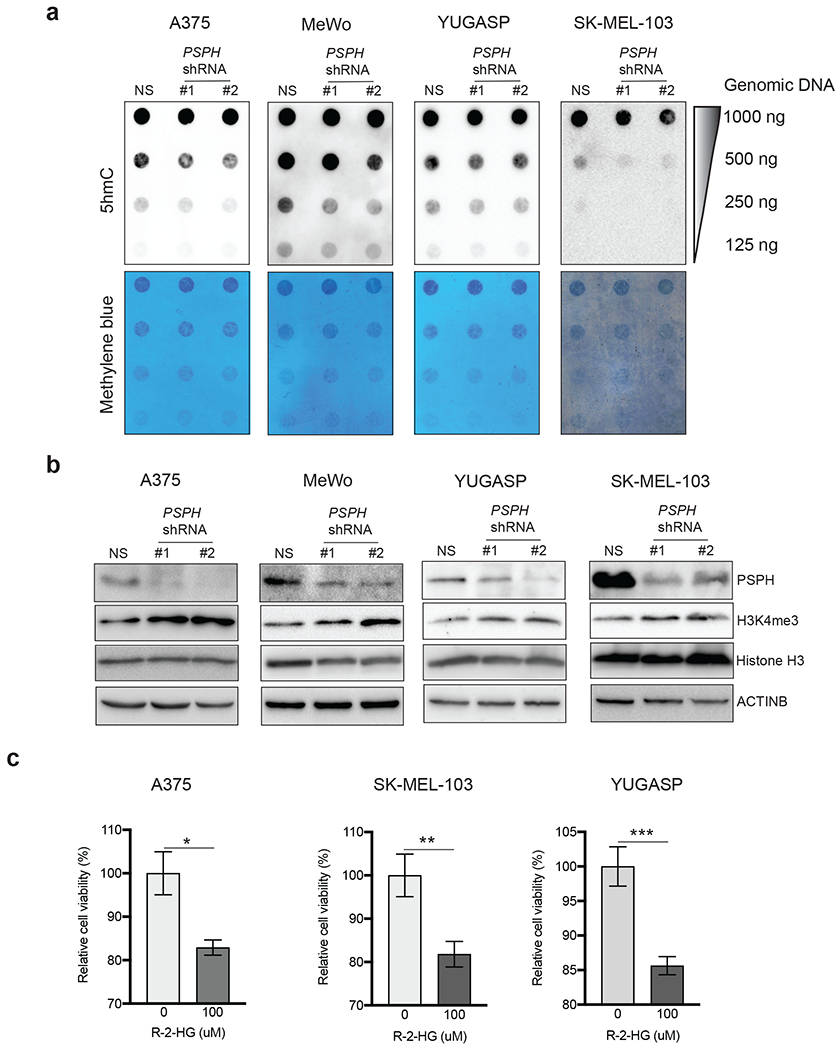
a. Dot blot analysis for 5-hydroxymethylcytosine (5hmC) in melanoma cells expressing either PSPH shRNAs or NS shRNA. Methylene blue-staining of membranes serves as a loading control. b. Expression of indicated proteins was analyzed in melanoma cells expressing either PSPH shRNAs or NS shRNA by immunoblotting. ACTINB was used as a loading control. c. Indicated melanoma cell lines were treated with indicated concentrations of 2-HG for 72 h. Survival was measured using the MTT assay. Percent (%) relative survival compared to untreated cells is shown. Data are presented as the mean ± SEM; *, ** and ***, represent P < 0.05, P < 0.01, P < 0.001, and P < 0.0001, respectively.
Interestingly, a previous study has shown that PHGDH catalyzes the conversion of α-ketoglutarate to 2-HG) through NADH-dependent reduction, thus serving as one source of 2-HG [14]. Based on this study, we rationalized that the loss of PSPH might feed-back to an increase in promiscuous PHGDH activity that might in turn result in increased 2-HG production. Therefore, we went on to analyze the effect of PHGDH knockdown on 2-HG levels in melanoma cells expressing PSPH shRNAs. Notably, we observed that simultaneous knockdown of PHGDH and PSPH resulted in reduced 2-HG levels compared to the PSPH knockdown alone (Fig. S7a–b). These results indicate that increase in the levels of 2-HG in melanoma cells after PSPH knockdown was dependent upon PHGDH.
Because a previous study linked 2-HG to an anti-leukemic activity [31], we hypothesized that 2-HG might also inhibit the growth of melanoma cells. Therefore, we treated three different melanoma cell lines (A375, SK-MEL-103, and YUGASP) with R-2HG, which is a naturally occurring cellular metabolite, and monitored cell survival. We found that treatment with R-2HG resulted in a significant reduction in cell viability (Fig. 5c). Collectively, these results showed that PSPH knockdown in melanoma cells causes reduced global levels of 5hmC and increased H3K4me3 as a result of increased 2-HG levels and that 2-HG inhibits the growth of melanoma cells.
PSPH knockdown in melanoma cells reduces the cancer-promoting gene expression signature
Melanoma cells expressing PSPH shRNA showed increased 2-HG levels and changes in DNA and histone modification, which is known to regulate gene transcription. Therefore, we speculated that PSPH-loss–mediated changes in DNA and histone modification might result in alteration in gene expression that contributes to PSPH-loss–induced tumor growth inhibition. In order to determine such changes in gene expression, we performed a Nanostring-based gene expression analysis using nCounter PanCancer Pathways Panel for Gene Expression. The nCounter PanCancer Pathways Panel can monitor the expression of over 700 genes, spread across 13 canonical cancer hallmark pathways (Fig. 6a and Table S4).
Fig. 6. PSPH loss results in reduced expression of cancer-promoting pathways and gene signatures.
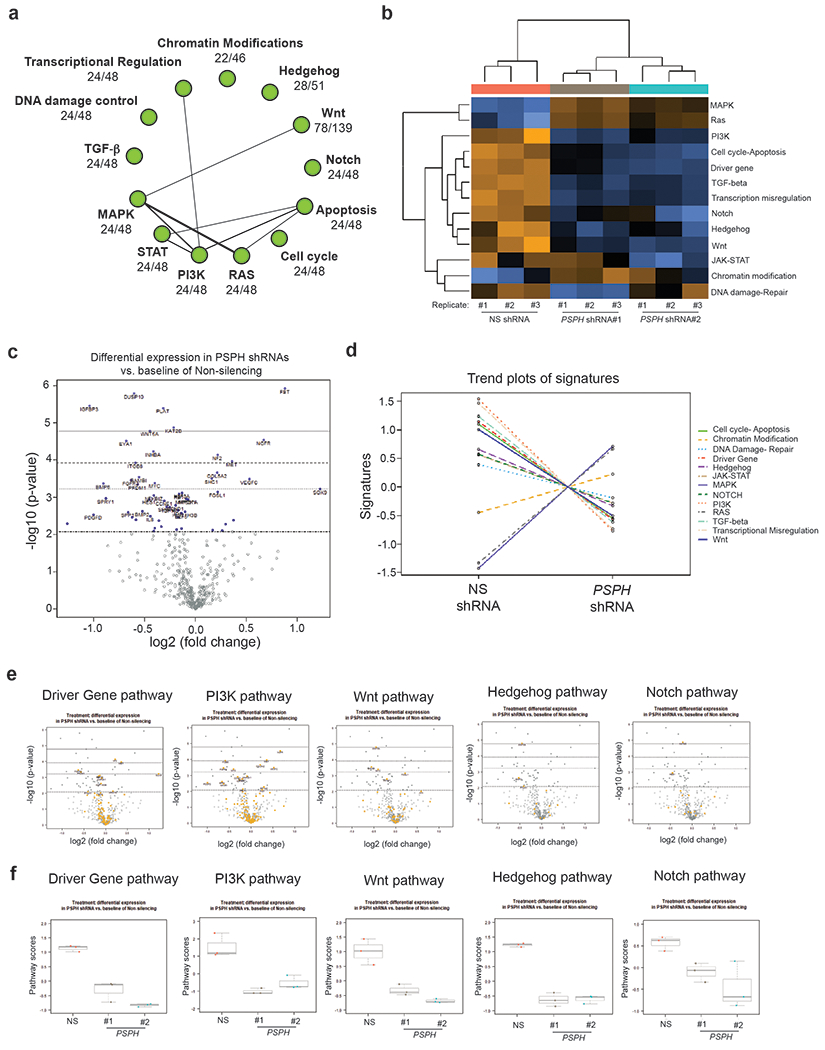
a. The signaling network regulated by PSPH was identified using NanoString analysis of gene expression in A375 cells after PSPH knockdown. b. A heatmap showing the gene expression profile of A375 cells expressing PSPH shRNAs or an NS shRNA by NanoString analysis. c. Volcano plot illustrating the gene expression profile of A375 cells expressing PSPH shRNAs or a nonspecific (NS) shRNA, as analyzed by NanoString. d. Trend plots of pathway signatures from NanoString analysis performed in A375 cells expressing PSPH shRNAs relative to a nonspecific (NS) shRNA. e. Volcano plot showing the gene expression profile of candidate pathways in A375 cells expressing PSPH shRNAs or a nonspecific (NS) shRNA. f. Pathway scores for the indicated pathways from NanoString analysis performed in A375 cells expressing PSPH shRNAs or a nonspecific (NS) shRNA.
We found that PSPH knockdown resulted in the downregulation of several cancer-promoting pathways, including the WNT, TGF-β, Notch, and Hedgehog signaling pathways (Fig. 6b–f, Fig. S8, Table S5, Table S6 and Table S7), indicating a widespread reduction in growth-promoting pathways as a result of PSPH knockdown. One of the factors downregulated as a result of PSPH knockdown is nuclear receptor subfamily 4, group A, member 1 (NR4A1), also known as NUR77. NR4A1 has been shown to act as a nuclear transcription factor and participate in energy homeostasis by sequestering the kinase STK11 in the nucleus, thereby inhibiting cytoplasmic activation of the AMPK pathway [32]. One of the reasons that we focused on NR4A1 was based on its previously described role in melanoma. It has been shown that NR4A1 is overexpressed in melanoma and necessary for survival under metabolic stress, and for melanoma metastasis [33]. We first confirmed that PSPH knockdown results in reduced NR4A1 at both the mRNA and protein levels (Fig. 7a–b). 2-HG levels were increased in PSPH knockdown A375 cells, and we found that this affects DNA demethylation, as observed by reduced 5hmC mark in melanoma cell lines. Therefore, we asked if PSPH knockdown causes increased NR4A1 promoter methylation that would, in turn, provide a mechanism for the loss of NR4A1 expression after PSPH knockdown. To test this, we first asked if the NR4A1 promoter contains a CpG island. Analysis of NR4A1 revealed the presence of a CpG island (Fig. S9). Furthermore, consistent with the role of NR4A1 regulation by DNA methylation, we found that in PSPH knockdown A375 cells, NR4A1 promoter DNA methylation levels were significantly higher than in the nonspecific-shRNA–expressing cells (Fig. 7c). These results indicate that PSPH-loss–mediated NR4A1 repression occurs due to increased promoter methylation.
Fig. 7. Ectopic expression of NR4A1 partially rescues PSPH knockdown-induced inhibition of melanoma growth.
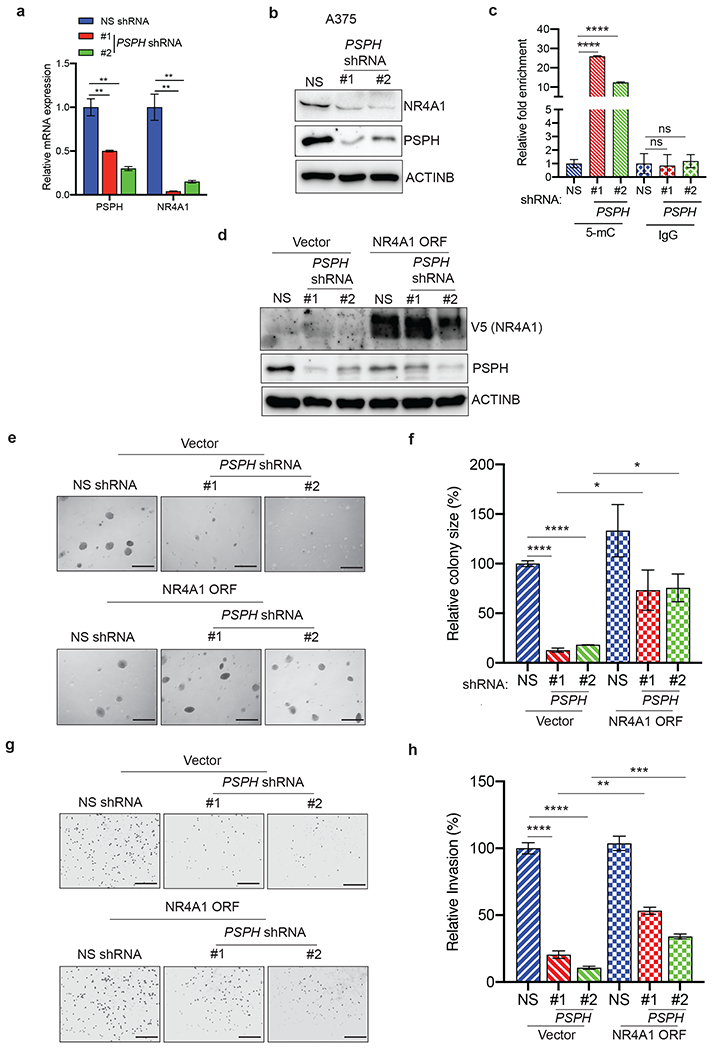
a. mRNA expression of the indicated genes was measured by quantitative PCR (qPCR) in A375 cells expressing either PSPH shRNA or NS shRNA control; expression of mRNA of the indicated genes in PSPH shRNA-expressing cells is plotted relative to expression in NS shRNA-expressing cells. ACTINB was used for normalization. b. Expression of the indicated proteins was measured by immunoblot analysis in A375 cells expressing PSPH shRNA or NS control shRNA. ACTINB was used as a loading control. c. Methylated DNA immunoprecipitation (MeDIP) analysis was performed on the NR4A1 promoter using anti-5mC antibody or anti-IgG as control. Fold difference in the DNA methylation levels in A375 cells expressing PSPH shRNA or NS control shRNA is shown for anti-5mC or anti-IgG antibodies. d. Expression of the indicated proteins was measured by immunoblot analysis in A375 cells expressing PSPH shRNA or NS control shRNA in combination with the NR4A1 expression vector or empty vector (pLX304) control. ACTINB was used as a loading control. e. Anchorage-independent growth was measured using the soft-agar assay in A375 cells expressing PSPH shRNA or NS control shRNA in combination with the NR4A1 expression vector or empty vector (pLX304) control. Representative images of soft-agar colonies for the indicated conditions are shown. Scale bar, 500 μm. f. Plot showing relative colony sizes from the soft-agar assay shown in panel e. g. Matrigel invasion assays in A375 cells expressing PSPH shRNA or NS control shRNA in combination with the NR4A1 expression vector or empty vector (pLX304) control. Representative images for the indicated conditions are shown. Scale bar, 200 μm. h. Relative invasion (%) from Matrigel assays shown in panel g. Data are presented as the mean ± SEM; *, **, ***, ****, and ns represent P < 0.05, P < 0.01, P < 0.001, P < 0.0001, and not significant P-value, respectively.
Based on these findings, we asked if NR4A1 is a potentially important downstream mediator of melanoma-growth–promoting PSPH function. Ectopic expression of NR4A1 in melanoma cells (Fig. 7d), was able to rescue the loss of growth inhibition resulting from PSPH knockdown (Fig. 7e–f) as well as the invasive ability of PSPH knockdown melanoma cells (Fig. 7g–h). Collectively, these results show that PSPH-regulated genes, such as NR4A1, play a decisive role in facilitating PSPH-induced melanoma growth and progression.
DISCUSSION
Deregulation of metabolic pathways has been shown to contribute significantly to cancer initiation and progression. Metabolic enzymes have, therefore, emerged as potentially useful therapeutic targets for treating cancer [34, 35]. We found that PSPH is necessary for melanoma tumor growth and metastasis, which occurs, in part, due to its previously undocumented role in repressing 2-HG levels, and the consequent alteration of DNA and histone modifications. These changes translate into repression of pro-oncogenic genes and pathways, such as NR4A1, resulting from PSPH knockdown, which in turn leads to reduced melanoma growth and inhibition of metastasis (Fig. 8).
Fig. 8. Model.
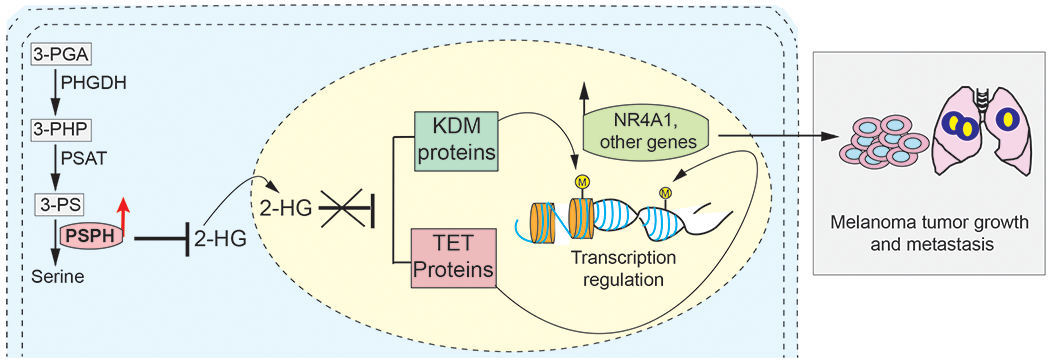
A model showing the mechanism by which PSPH facilitates melanoma tumor growth and metastasis. We find that PSPH promotes melanoma tumor growth and metastasis by regulating the activity of DNA and histone demethylases (e.g., TET and JMJD/KDM) by repressing the levels of 2-HG and by activating tumor-promoting pathways and expression of NR4A1 and other genes.
PSPH is the last enzyme in the L-serine metabolism pathway and diverts 3-phosphoglycerate (3-PG) toward the L-serine synthesis pathway using three enzymes, PHGDH, phosphoserine aminotransferase (PSAT1), and PSPH [36]. PSPH expression in lacrimal gland adenoid cystic carcinoma (ACC) was shown to correlate with shorter disease-free survival [37]. PSPH overexpression has been detected in non-small–cell lung cancer patients treated with erlotinib that show a better response compared to patients with a poor response to erlotinib [38].
The serine synthesis pathway (SSP) is deregulated in several cancer types, in part due to the overexpression of enzymes involved in SSP. In particular, PHGDH has been shown to be overexpressed in breast cancer and melanoma and to play an important role in breast and melanoma tumor growth [17, 18]. Indeed, a relatively large amount of glycolytic carbon is diverted into serine and glycine metabolism by PHGDH [18]. Based on these results, it has been proposed that the diversion of glycolytic flux into a specific alternate pathway is selected during tumor development and might contribute to cancer development and progression [18].
Similar to these studies, PHGDH overexpression has been observed in several other cancer types, including lung adenocarcinoma, in which PHGDH defines a poor prognosis subtype [39], and pancreatic cancer, in which it contributes to tumor growth and metastatic characteristics [40]. However, the precise role of SSPs in promoting cancer growth and metastasis is still not fully understood. Similarly, the role of other enzymes of the SSP, such as PSAT1 and PSPH, in cancer has not previously been well understood. Our study shows that PSPH is upregulated in melanoma samples, and that PSPH knockdown in melanoma cell lines inhibited their growth in culture and in mice. Consistent with our findings, PSPH expression has also been shown to be increased in breast cancer [41] and colorectal cancer and correlate with enhanced invasion and metastasis [42]. Furthermore, PSPH has also been shown to be important for proliferation and metastasis of non-small–cell lung cancer and cutaneous squamous cell carcinoma [21, 43].
Using metabolomics analysis, we found reduced serine levels in the melanoma cells expressing PSPH shRNA. However, ectopic supplementation of serine was not able to rescue this PSPH-loss–induced tumor growth inhibition. This is consistent with findings from other groups in which ectopic supplementation of serine was not able to rescue loss of other SSP enzymes such as PHGDH [44, 45]. Also, this is consistent with in vivo findings indicating that serine biosynthesis is important for several cancer types [46]. This could also be due to the fact that the flux through the SSP may enhance cell proliferation beyond supplying serine [44, 45]. Furthermore, a previous study showed that PHGDH suppression does not significantly affect intracellular serine levels, but causes a drop in the levels of α-KG, another output of the pathway, and a TCA cycle intermediate [45].
Our metabolic analysis also revealed increased 2-HG levels in PSPH knockdown melanoma cells. 2-HG is a competitive inhibitor of multiple α-KG–dependent dioxygenases, including the Jumonji family of histone demethylases and the TET family of DNA dioxygenases [29, 47]. Interestingly, PHGDH has been found to generate 2-HG [14, 30, 48]. We find that PSPH knockdown cells showed increased 2-HG levels, and that this increase correlates with reduced TET and Jumonji family histone demethylase activity, as observed by reduced global 5hmC and increased histone H3K4me3. Furthermore, we show that an increase in 2-HG levels as a result of PSPH knockdown was dependent upon PHGDH because knockdown of PHGDH resulted in reduced 2-HG levels in PSPH knockdown cells.
Because global changes in methylation and histone modifications can affect transcription, we analyzed over 700 genes in pathways that are known to promote cancer growth and metastasis, and found several pro-oncogenic pathways (e.g., WNT, TGF-β, Notch, and PI3K pathways) with reduced activity in PSPH knockdown melanoma cells. In particular, we found that expression of NR4A1 was reduced in PSPH-shRNA–expressing melanoma cells due to increased promoter DNA methylation. The NR4A1 gene codes for a member of the steroid-thyroid hormone-retinoid receptor superfamily and functions as a transcription factor [49]. NR4A1 is overexpressed in melanoma and has been shown to promote survival and metastasis in melanoma, and is important for melanoma growth under nutrient-deprivation conditions [33]. These results indicate a direct role for PSPH in stimulating NR4A1 expression via its ability to repress 2-HG level. Furthermore, ectopic NR4A1 expression was able to partly rescue loss-of-PSPH–induced melanoma growth and metastatic attribute inhibition, suggesting its importance in PSPH-induced melanoma growth and metastasis. We note that attenuation of other pro-oncogenic pathways was also observed in PSPH knockdown melanoma cells, indicating that genes and pathways other than NR4A1 may also be involved in mediating the effect of PSPH on melanoma tumor growth and metastasis. Further studies are required to determine the relative contribution of these genes and pathways in mediating the effect of PSPH in melanoma.
Collectively, these results show the importance of PSPH in melanoma growth and metastasis through control of 2-HG levels. The increased level of 2-HG further impacts gene expression by altering the levels of several genes, including NR4A1. Altogether, this analysis opens up new avenues that may prove to be important in controlling melanoma and other cancers, and help us better understand the changes in metabolic pathways linked to these diseases.
MATERIALS AND METHODS
Cell culture
A375 (BRAF-mutant), M14 (BRAF-mutant), MeWo (NF1-deficient), SK-MEL-103 (NRAS-mutant), and A375-MA2 (BRAF-mutant) cell lines were obtained from American Type Culture Collection (ATCC, Manassas, VA, USA) and maintained as recommended by ATCC. The YUGASP (NRAS-mutant) cell line was obtained from Yale SPORE in Skin Cancer and maintained in Dulbecco’s Modified Eagle Medium (DMEM; Life Technologies, Thermo Fisher Scientific, Waltham, MA, USA), supplemented with 10% fetal bovine serum (FBS; Life Technologies, Thermo Fisher Scientific) and 1% penicillin/streptomycin (Life Technologies), at a CO2 concentration of 5%. Also see Table S8 for reagent details.
Metabolomic analysis
A375 cells expressing PSPH or nonspecific shRNAs were analyzed for alterations in metabolic pathways using the CE-TOFMS-based basic-scan profiling method developed by Human Metabolome Technologies (Boston, MA, USA) using the Agilent CE-TOFMS system (Agilent Technologies, Santa Clara, CA, USA). Briefly, cells were incubated in duplicate, and 1 × 10⁶ cells for each condition were analyzed. Samples were prepared according to the recommendations of Human Metabolome Technologies. Metabolome analysis was performed in samples of cultured cells using CE-TOFMS in two modes for cationic and anionic metabolites. For data analysis, peaks detected during spectrometric analysis were extracted using MasterHands version 2.17.1.11 automated integration software (developed at Keio University, Tokyo, Japan) to determine mass/charge ratio (m/z), migration time, and peak area. Peak area was converted to relative peak area using the following equation: relative peak area = metabolite peak area/internal-standard peak area × number of cells. The peak detection limit was determined based on a signal-to-noise ratio of 3. Putative metabolites were assigned based on the m/z and migration time using Human Metabolomic Technologies’ standard and known-unknown peak libraries on the basis of m/z and migration time. The tolerance was ±0.5 min in migration time and ±10 ppm in m/z. Hierarchical cluster analysis (HCA) and principal component analysis (PCA) were performed using statistical analysis software (developed at Human Metabolome Technologies). A total of 232 metabolites was detected (119 metabolites in cation mode and 113 metabolites in anion mode) on the basis of Human Metabolomic Technologies’ standard library. All metabolite concentrations were calculated by normalizing the peak area of each metabolite to the area of the internal standard and by comparing with standard curves obtained from a 100-μM single-point calibration. The peak profile of putative metabolites was represented on metabolic pathway maps using the Visualization and Analysis of Networks containing Experimental Data (VANTED) software (http://vanted.ipk-gatersleben.de/). The pathway map was prepared based on the metabolic pathways that are known to exist in human cells according to the information in the KEGG database (http://www.genome.jp/kegg/). The list of fold changes for metabolites altered in A375 cells expressing PSPH shRNAs compared to the cells expressing nonspecific shRNA is shown in Table S2.
NanoString nCounter PanCancer Pathways panel analysis
RNA was analyzed using the NanoString nCounter platform (Seattle, WA, USA) through the UAB NanoString Laboratory (www.uab.edu/medicine/radonc/en/nanostring). All RNA samples had A260/A280 and A260/A230 ratios in the range 1.8–2.3, as recommended by the manufacturer and determined using a DeNovix DS-11 spectrophotometer (Wilmington, DE, USA). Briefly, 100 ng of each sample was hybridized for 18 h with the reporter and capture probes specific to the human PanCancer Pathways panel, and then processed on the NanoString nCounter Flex system according to the manufacturer’s instructions. This commercially available panel contains 730 genes involved in 13 hallmark cancer pathways (Apoptosis, Cell Cycle, Chromatin Modification, DNA Damage Control, Hedgehog, MAPK, Notch, P13K, RAS, STAT, TGF-β, Transcriptional Regulation, Wnt) as well as 40 housekeeping genes, which serve as internal normalization controls (also see Table S4). The samples were read at the standard 280 FOV count; the resultant RCC data files were imported into NanoString nSolver 4.0; and the raw data was used to run through the advanced analysis module. This module selects the best housekeeping genes to use in the analysis through the Gnorm program, and those selected were used to normalize the data.
Statistical analysis
All experiments were conducted with at least three biological replicates. Results for individual experiments are expressed as mean ± standard error of the mean (SEM). For the analysis of tumor progression in mice, statistical assessment was performed using the area under the curve (AUC) method on GraphPad Prism, version 9.0 for Macintosh (GraphPad Software, San Diego, CA, USA; www.graphpad.com). The P values for the rest of the experiments were calculated using the two-tailed unpaired Student’s t-test in GraphPad Prism version 9.0 for Macintosh (GraphPad Software). ns, *, **, ***, and **** indicate non-significant P-value, P < 0.05, < 0.01, < 0.001, and < 0.0001, respectively.
Supplementary Material
Footnotes
CONFLICT OT INTEREST
The authors declare that they have no conflict of interest
REFERENCES
- 1.Chin L, Garraway LA, Fisher DE. Malignant melanoma: genetics and therapeutics in the genomic era. Genes Dev 2006; 20: 2149–2182. [DOI] [PubMed] [Google Scholar]
- 2.Tsao H, Chin L, Garraway LA, Fisher DE. Melanoma: from mutations to medicine. Genes Dev 2012; 26: 1131–1155. [DOI] [PMC free article] [PubMed] [Google Scholar]
- 3.Cancer Genome Atlas N Genomic Classification of Cutaneous Melanoma. Cell 2015; 161: 1681–1696. [DOI] [PMC free article] [PubMed] [Google Scholar]
- 4.Larkin J, Ascierto PA, Dreno B, Atkinson V, Liszkay G, Maio M et al. Combined vemurafenib and cobimetinib in BRAF-mutated melanoma. N Engl J Med 2014; 371: 1867–1876. [DOI] [PubMed] [Google Scholar]
- 5.Long GV, Stroyakovskiy D, Gogas H, Levchenko E, de Braud F, Larkin J et al. Combined BRAF and MEK inhibition versus BRAF inhibition alone in melanoma. N Engl J Med 2014; 371: 1877–1888. [DOI] [PubMed] [Google Scholar]
- 6.Kakadia S, Yarlagadda N, Awad R, Kundranda M, Niu J, Naraev B et al. Mechanisms of resistance to BRAF and MEK inhibitors and clinical update of US Food and Drug Administration-approved targeted therapy in advanced melanoma. Onco Targets Ther 2018; 11: 7095–7107. [DOI] [PMC free article] [PubMed] [Google Scholar]
- 7.Luke JJ, Flaherty KT, Ribas A, Long GV. Targeted agents and immunotherapies: optimizing outcomes in melanoma. Nat Rev Clin Oncol 2017; 14: 463–482. [DOI] [PubMed] [Google Scholar]
- 8.Nowicki TS, Hu-Lieskovan S, Ribas A. Mechanisms of Resistance to PD-1 and PD-L1 Blockade. Cancer J 2018; 24: 47–53. [DOI] [PMC free article] [PubMed] [Google Scholar]
- 9.Warburg O, Wind F, Negelein E. The Metabolism of Tumors in the Body. J Gen Physiol 1927; 8: 519–530. [DOI] [PMC free article] [PubMed] [Google Scholar]
- 10.Fischer GM, Vashisht Gopal YN, McQuade JL, Peng W, DeBerardinis RJ, Davies MA. Metabolic strategies of melanoma cells: Mechanisms, interactions with the tumor microenvironment, and therapeutic implications. Pigment Cell Melanoma Res 2018; 31: 11–30. [DOI] [PMC free article] [PubMed] [Google Scholar]
- 11.Ratnikov BI, Scott DA, Osterman AL, Smith JW, Ronai ZA. Metabolic rewiring in melanoma. Oncogene 2017; 36: 147–157. [DOI] [PMC free article] [PubMed] [Google Scholar]
- 12.Amelio I, Cutruzzola F, Antonov A, Agostini M, Melino G. Serine and glycine metabolism in cancer. Trends Biochem Sci 2014; 39: 191–198. [DOI] [PMC free article] [PubMed] [Google Scholar]
- 13.Yang M, Vousden KH. Serine and one-carbon metabolism in cancer. Nat Rev Cancer 2016; 16: 650–662. [DOI] [PubMed] [Google Scholar]
- 14.Fan J, Teng X, Liu L, Mattaini KR, Looper RE, Vander Heiden MG et al. Human phosphoglycerate dehydrogenase produces the oncometabolite D-2-hydroxyglutarate. ACS Chem Biol 2015; 10: 510–516. [DOI] [PMC free article] [PubMed] [Google Scholar]
- 15.Sullivan MR, Mattaini KR, Dennstedt EA, Nguyen AA, Sivanand S, Reilly MF et al. Increased Serine Synthesis Provides an Advantage for Tumors Arising in Tissues Where Serine Levels Are Limiting. Cell Metab 2019; 29: 1410–1421 e1414. [DOI] [PMC free article] [PubMed] [Google Scholar]
- 16.Beroukhim R, Mermel CH, Porter D, Wei G, Raychaudhuri S, Donovan J et al. The landscape of somatic copy-number alteration across human cancers. Nature 2010; 463: 899–905. [DOI] [PMC free article] [PubMed] [Google Scholar]
- 17.Mullarky E, Mattaini KR, Vander Heiden MG, Cantley LC, Locasale JW. PHGDH amplification and altered glucose metabolism in human melanoma. Pigment Cell Melanoma Res 2011; 24: 1112–1115. [DOI] [PubMed] [Google Scholar]
- 18.Locasale JW, Grassian AR, Melman T, Lyssiotis CA, Mattaini KR, Bass AJ et al. Phosphoglycerate dehydrogenase diverts glycolytic flux and contributes to oncogenesis. Nat Genet 2011; 43: 869–874. [DOI] [PMC free article] [PubMed] [Google Scholar]
- 19.Gao S, Ge A, Xu S, You Z, Ning S, Zhao Y et al. PSAT1 is regulated by ATF4 and enhances cell proliferation via the GSK3beta/beta-catenin/cyclin D1 signaling pathway in ER-negative breast cancer. J Exp Clin Cancer Res 2017; 36: 179. [DOI] [PMC free article] [PubMed] [Google Scholar]
- 20.Jin HO, Hong SE, Kim JY, Jang SK, Kim YS, Sim JH et al. Knock-down of PSAT1 Enhances Sensitivity of NSCLC Cells to Glutamine-limiting Conditions. Anticancer Res 2019; 39: 6723–6730. [DOI] [PubMed] [Google Scholar]
- 21.Liao L, Ge M, Zhan Q, Huang R, Ji X, Liang X et al. PSPH Mediates the Metastasis and Proliferation of Non-small Cell Lung Cancer through MAPK Signaling Pathways. Int J Biol Sci 2019; 15: 183–194. [DOI] [PMC free article] [PubMed] [Google Scholar]
- 22.Park SM, Seo EH, Bae DH, Kim SS, Kim J, Lin W et al. Phosphoserine Phosphatase Promotes Lung Cancer Progression through the Dephosphorylation of IRS-1 and a Noncanonical L-Serine-Independent Pathway. Mol Cells 2019; 42: 604–616. [DOI] [PMC free article] [PubMed] [Google Scholar]
- 23.Kampen KR, Fancello L, Girardi T, Rinaldi G, Planque M, Sulima SO et al. Translatome analysis reveals altered serine and glycine metabolism in T-cell acute lymphoblastic leukemia cells. Nat Commun 2019; 10: 2542. [DOI] [PMC free article] [PubMed] [Google Scholar]
- 24.McCabe A, Dolled-Filhart M, Camp RL, Rimm DL. Automated quantitative analysis (AQUA) of in situ protein expression, antibody concentration, and prognosis. J Natl Cancer Inst 2005; 97: 1808–1815. [DOI] [PubMed] [Google Scholar]
- 25.van Zijl F, Krupitza G, Mikulits W. Initial steps of metastasis: cell invasion and endothelial transmigration. Mutat Res 2011; 728: 23–34. [DOI] [PMC free article] [PubMed] [Google Scholar]
- 26.Pacold ME, Brimacombe KR, Chan SH, Rohde JM, Lewis CA, Swier LJ et al. A PHGDH inhibitor reveals coordination of serine synthesis and one-carbon unit fate. Nat Chem Biol 2016; 12: 452–458. [DOI] [PMC free article] [PubMed] [Google Scholar]
- 27.Hausinger RP. FeII/alpha-ketoglutarate-dependent hydroxylases and related enzymes. Crit Rev Biochem Mol Biol 2004; 39: 21–68. [DOI] [PubMed] [Google Scholar]
- 28.Li S, Swanson SK, Gogol M, Florens L, Washburn MP, Workman JL et al. Serine and SAM Responsive Complex SESAME Regulates Histone Modification Crosstalk by Sensing Cellular Metabolism. Mol Cell 2015; 60: 408–421. [DOI] [PubMed] [Google Scholar]
- 29.Xu W, Yang H, Liu Y, Yang Y, Wang P, Kim SH et al. Oncometabolite 2-hydroxyglutarate is a competitive inhibitor of alpha-ketoglutarate-dependent dioxygenases. Cancer Cell 2011; 19: 17–30. [DOI] [PMC free article] [PubMed] [Google Scholar]
- 30.Ye D, Guan KL, Xiong Y. Metabolism, Activity, and Targeting of D- and L-2-Hydroxyglutarates. Trends Cancer 2018; 4: 151–165. [DOI] [PMC free article] [PubMed] [Google Scholar]
- 31.Su R, Dong L, Li C, Nachtergaele S, Wunderlich M, Qing Y et al. R-2HG Exhibits Anti-tumor Activity by Targeting FTO/m(6)A/MYC/CEBPA Signaling. Cell 2018; 172: 90–105 e123. [DOI] [PMC free article] [PubMed] [Google Scholar]
- 32.Zhan YY, Chen Y, Zhang Q, Zhuang JJ, Tian M, Chen HZ et al. The orphan nuclear receptor Nur77 regulates LKB1 localization and activates AMPK. Nat Chem Biol 2012; 8: 897–904. [DOI] [PubMed] [Google Scholar]
- 33.Li XX, Wang ZJ, Zheng Y, Guan YF, Yang PB, Chen X et al. Nuclear Receptor Nur77 Facilitates Melanoma Cell Survival under Metabolic Stress by Protecting Fatty Acid Oxidation. Mol Cell 2018; 69: 480–492 e487. [DOI] [PubMed] [Google Scholar]
- 34.DiNardo CD, Stein EM, de Botton S, Roboz GJ, Altman JK, Mims AS et al. Durable Remissions with Ivosidenib in IDH1-Mutated Relapsed or Refractory AML. N Engl J Med 2018; 378: 2386–2398. [DOI] [PubMed] [Google Scholar]
- 35.Cao L, Weetall M, Trotta C, Cintron K, Ma J, Kim MJ et al. Targeting of Hematologic Malignancies with PTC299, A Novel Potent Inhibitor of Dihydroorotate Dehydrogenase with Favorable Pharmaceutical Properties. Mol Cancer Ther 2019; 18: 3–16. [DOI] [PMC free article] [PubMed] [Google Scholar]
- 36.Mattaini KR, Sullivan MR, Vander Heiden MG. The importance of serine metabolism in cancer. J Cell Biol 2016; 214: 249–257. [DOI] [PMC free article] [PubMed] [Google Scholar]
- 37.Koo JS, Yoon JS. Expression of metabolism-related proteins in lacrimal gland adenoid cystic carcinoma. Am J Clin Pathol 2015; 143: 584–592. [DOI] [PubMed] [Google Scholar]
- 38.Tan EH, Ramlau R, Pluzanska A, Kuo HP, Reck M, Milanowski J et al. A multicentre phase II gene expression profiling study of putative relationships between tumour biomarkers and clinical response with erlotinib in non-small-cell lung cancer. Ann Oncol 2010; 21: 217–222. [DOI] [PMC free article] [PubMed] [Google Scholar]
- 39.Zhang B, Zheng A, Hydbring P, Ambroise G, Ouchida AT, Goiny M et al. PHGDH Defines a Metabolic Subtype in Lung Adenocarcinomas with Poor Prognosis. Cell Rep 2017; 19: 2289–2303. [DOI] [PubMed] [Google Scholar]
- 40.Song Z, Feng C, Lu Y, Lin Y, Dong C. PHGDH is an independent prognosis marker and contributes cell proliferation, migration and invasion in human pancreatic cancer. Gene 2018; 642: 43–50. [DOI] [PubMed] [Google Scholar]
- 41.Wang CY, Chiao CC, Phan NN, Li CY, Sun ZD, Jiang JZ et al. Gene signatures and potential therapeutic targets of amino acid metabolism in estrogen receptor-positive breast cancer. Am J Cancer Res 2020; 10: 95–113. [PMC free article] [PubMed] [Google Scholar]
- 42.Sato K, Masuda T, Hu Q, Tobo T, Kidogami S, Ogawa Y et al. Phosphoserine Phosphatase Is a Novel Prognostic Biomarker on Chromosome 7 in Colorectal Cancer. Anticancer Res 2017; 37: 2365–2371. [DOI] [PubMed] [Google Scholar]
- 43.Bachelor MA, Lu Y, Owens DM. L-3-Phosphoserine phosphatase (PSPH) regulates cutaneous squamous cell carcinoma proliferation independent of L-serine biosynthesis. J Dermatol Sci 2011; 63: 164–172. [DOI] [PMC free article] [PubMed] [Google Scholar]
- 44.Chen J, Chung F, Yang G, Pu M, Gao H, Jiang W et al. Phosphoglycerate dehydrogenase is dispensable for breast tumor maintenance and growth. Oncotarget 2013; 4: 2502–2511. [DOI] [PMC free article] [PubMed] [Google Scholar]
- 45.Possemato R, Marks KM, Shaul YD, Pacold ME, Kim D, Birsoy K et al. Functional genomics reveal that the serine synthesis pathway is essential in breast cancer. Nature 2011; 476: 346–350. [DOI] [PMC free article] [PubMed] [Google Scholar]
- 46.Locasale JW. Serine, glycine and one-carbon units: cancer metabolism in full circle. Nat Rev Cancer 2013; 13: 572–583. [DOI] [PMC free article] [PubMed] [Google Scholar]
- 47.Chowdhury R, Yeoh KK, Tian YM, Hillringhaus L, Bagg EA, Rose NR et al. The oncometabolite 2-hydroxyglutarate inhibits histone lysine demethylases. EMBO Rep 2011; 12: 463–469. [DOI] [PMC free article] [PubMed] [Google Scholar]
- 48.Zhao G, Winkler ME. A novel alpha-ketoglutarate reductase activity of the serA-encoded 3-phosphoglycerate dehydrogenase of Escherichia coli K-12 and its possible implications for human 2-hydroxyglutaric aciduria. J Bacteriol 1996; 178: 232–239. [DOI] [PMC free article] [PubMed] [Google Scholar]
- 49.Hazel TG, Nathans D, Lau LF. A gene inducible by serum growth factors encodes a member of the steroid and thyroid hormone receptor superfamily. Proc Natl Acad Sci U S A 1988; 85: 8444–8448. [DOI] [PMC free article] [PubMed] [Google Scholar]
Associated Data
This section collects any data citations, data availability statements, or supplementary materials included in this article.


