

Targeting the p53-MDM2 pathway to reactivate tumor p53 is a chemotherapeutic approach. However, the involvement of this pathway in CD8+ T cell-mediated anti-tumor immunity is unknown. Here, we report that mice with MDM2 deficiency in T cells exhibited an accelerated tumor progression and a decrease in tumor infiltrating CD8+ T cell survival and function. Mechanistically, MDM2 competed with c-Cbl for STAT5 binding, reduced c-Cbl-mediated STAT5 degradation, and enhanced STAT5 stability in tumor infiltrating CD8+ T cells. Targeting the p53-MDM2 interaction with a pharmacological-agent, APG115, augmented MDM2 in T cells, thereby stabilizing STAT5, boosting T cell immunity, and synergizing with cancer immunotherapy. Unexpectedly, these effects of APG115 were dependent on p53 and MDM2 in T cells. Clinically, MDM2 abundance correlated with T cell function and IFNγ-signature in cancer patients. Thus, the p53-MDM2 pathway controls T cell immunity and targeting this pathway may treat cancer patients regardless of tumor p53 status.
Loss of tumor-suppressive function of p53 through TP53 gene deletion or mutation is the most frequent event in human cancers. Approximately 50% of human cancers retain a wild-type TP53 allele, but the tumor suppressive function of p53 is attenuated by mouse double minute 2 (MDM2) and other signaling modules. Because MDM2 inhibits p53 activity through its direct interaction, one cancer therapeutic approach is the development of small-molecule inhibitors of the p53-MDM2 interaction to reactivate p53 in tumor cells1–4. Indeed, a number of small-molecule inhibitors of the MDM2-p53 interaction are in clinical development. MDM2 also has oncogenic activity independent of p53. Other therapeutic approaches targeting MDM2 have also been pursued1, 5, 6. In spite of these efforts, no therapy targeting MDM2 has been approved. Therefore, we reason the frustration of cancer therapeutic application exists due to a gap in the substantial knowledge of the p53 and MDM2 pathway in the fields of tumor biology and oncology, and the limited understanding of this pathway in T cells in the context of tumor immunology.
Immunotherapy is an effective remedy to treat patients with cancer7–9. CD8+ T cells play a central role in immunotherapy-induced tumor immunity, and are a decisive factor of therapeutic efficacy and cancer patient outcome7–10. Despite extensive research in the MDM2 and p53 pathway, it remains unknown whether this pathway affects CD8+ T cell-mediated anti-tumor immunity. Furthermore, systemic and mechanistic studies on whether targeting this pathway can alter the host immune system and in turn shape the targeted therapy efficacy, are missing. This deficiency and the aforementioned gap prompted us to investigate a hypothetical connection between the p53-MDM2 pathway and CD8+ T cells in the context of cancer immunity and targeted therapy.
Here, we present biochemical, genetic, and functional evidence that MDM2 regulates T cell STAT5 stability, T cell survival and anti-tumor immunity. Moreover, pharmacologically targeted the p53-MDM2 interaction synergizes cancer immunotherapy. These important insights would inform the novel design, screening, and selection of MDM2-targeted agents, and the patient stratification for future clinical trials.
MDM2 controls CD8+ T cell-mediated anti-tumor immunity
Because MDM2 interacts with p53 and regulates p53 stability and activity, targeting the p53 and MDM2 interaction offers a potential therapeutic approach through reactivation of p53 in tumor cells retaining wild-type p53 status2. CD8+ T cells mediate anti-tumor immunity and are associated with cancer patient outcome and therapy efficacy7, 8, 11. To date, the role of MDM2 in CD8+ T cell-mediated anti-cancer immunity is unknown. To explore this, we first examined MDM2 expression in CD8+ T cells. Naive human and mouse CD8+ T cells expressed negligible levels of MDM2 protein. TCR-engagement induced MDM2 expression in human (Fig. 1a, Extended Data Fig. 1a) and mouse (Fig. 1b, Extended Data Fig. 1b) CD8+ T cells. Then, we crossed Mdm2fl/fl mice with Cd4-Cre mice and generated mice with specific Mdm2 deficiency in CD4+ and CD8+ T cells. These mice are referred to as Mdm2fl/flCd4-Cre. T cells from Mdm2fl/flCd4-Cre and Mdm2+/+Cd4-Cre mice are referred to as Mdm2−/− and Mdm2+/+ T cells, respectively (Extended Data Fig. 1c–d). Mdm2fl/flCd4-Cre mice at the age of 4-12 weeks exhibited similar body sizes and appearance (Extended Data Fig. 1e), and comparable lymphoid organs (Extended Data Fig. 1f). Moreover, the percentages of CD8+ T cells in lymphoid organs and colon tissues were comparable in Mdm2fl/flCd4-Cre and Mdm2+/+Cd4-Cre mice (Extended Data Fig. 1g–h). We detected < 10% CD25+ and < 15% PD-1+ cells in Mdm2+/+ and Mdm2−/− CD4+ and CD8+ T cells in lymphoid organs (Extended Data Fig. 1i). However, the percentages of CD25+ and PD-1+ T cells were higher in Mdm2fl/flCd4-Cre than Mdm2+/+Cd4-Cre mice (Extended Data Fig. 1i). Furthermore, we observed a decrease in the amounts of T cells in lymphoid organs (Extended Data Fig. 1j). There were less Ki67+ T cells in Mdm2−/−CD8+ T cells in response to homeostatic T cell cytokine and mitogen stimulation in vitro when compared to Mdm2+/+CD8+ T cells (Extended Data Fig. 1k–l). Thus, the data suggests a protective role of MDM2 in T cells in homeostasis.
Fig. 1: MDM2 controls CD8+ T cell-mediated anti-tumor immunity.
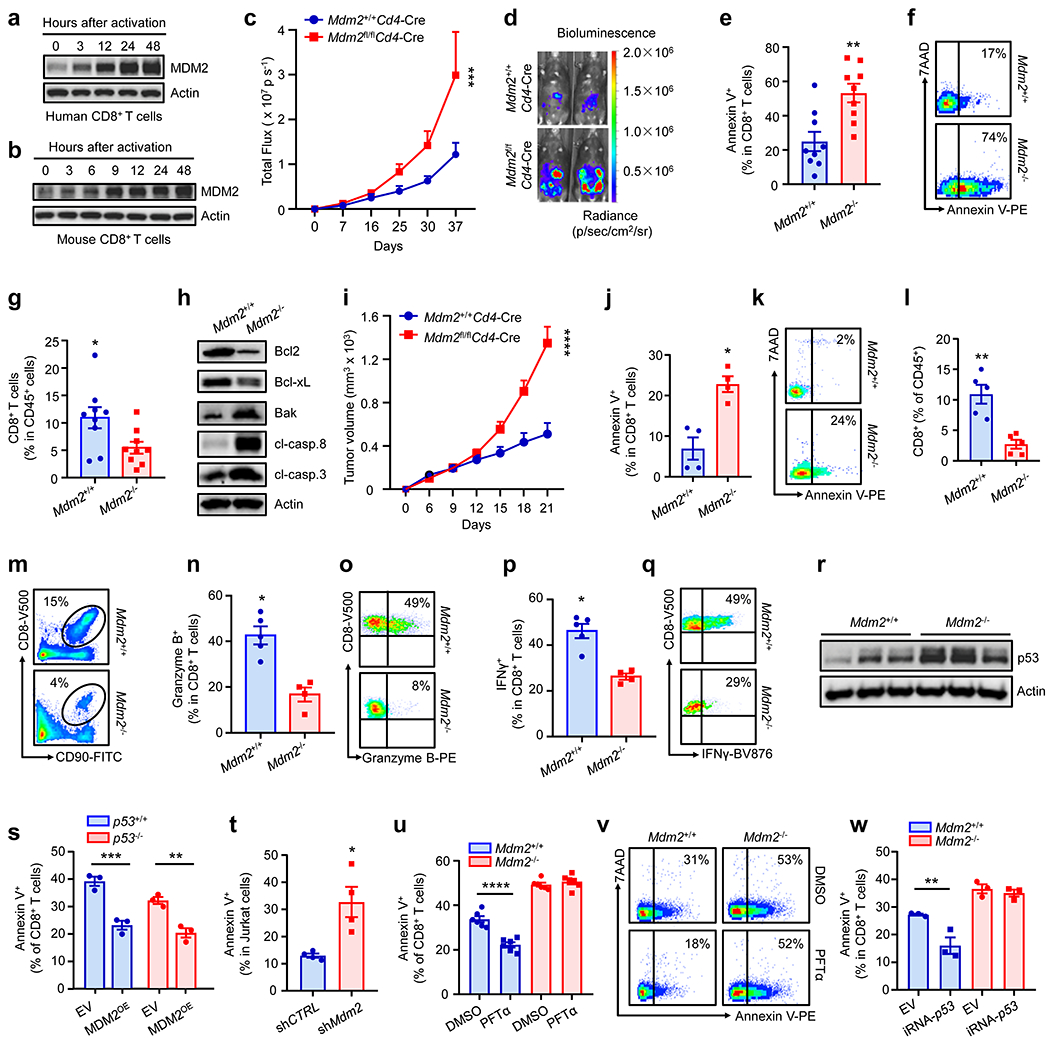
a-b, Effect of TCR-engagement on MDM2 in CD8+ T cells. Human (a) and mouse (b) CD8+ T cells were stimulated with anti-CD3 and anti-CD28 mAbs. Expression of MDM2 was determined by Western blotting. One of 5 experiments is shown.
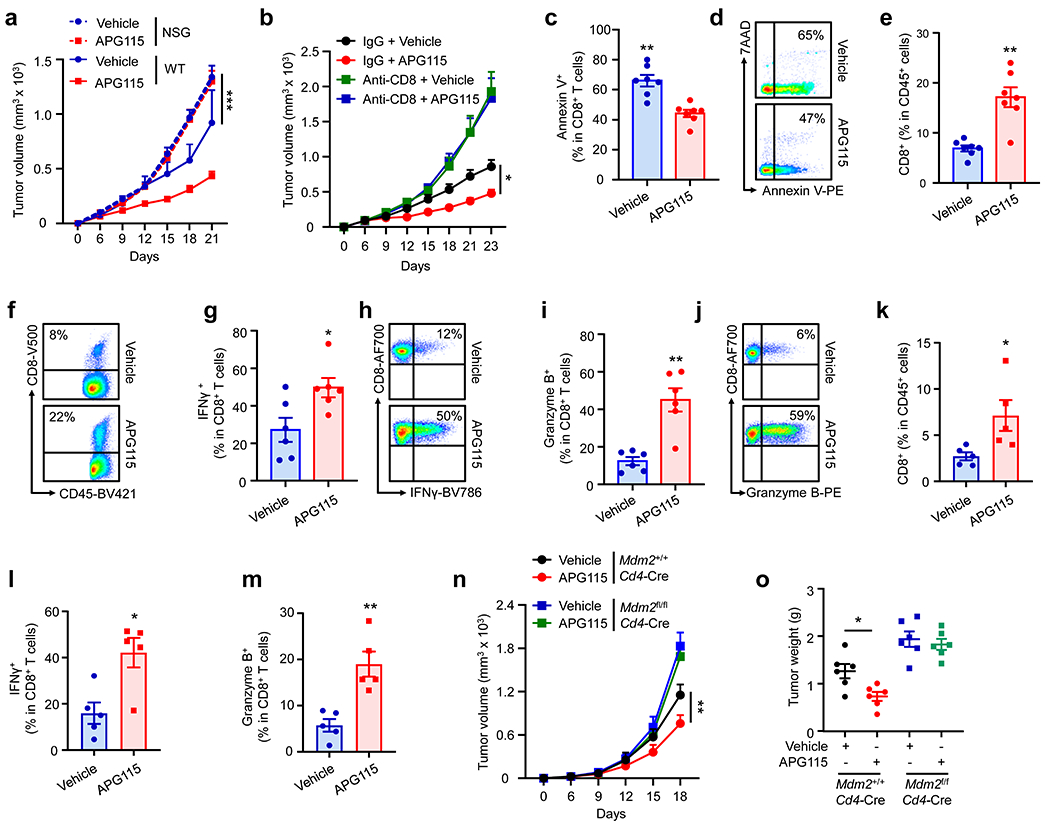
c-d, Effect of MDM2 deficiency on ID8 tumor progression. ID8 tumors were inoculated into Mdm2+/+Cd4-Cre and Mdm2fl/flCd4-Cre mice. Tumor volume (c) and tumor representative bioluminescence images (d) are shown. mean ± SEM, n = 9, ***p < 0.001, two-way ANOVA.
e-h, Role of MDM2 deficiency in ID8 tumor infiltrating CD8+ T cells. The percentages of Annexin V+ cells in CD8+ T cells (e, f) and CD8+ T cells in CD45+ immune cells (g) were analyzed by FACS. The pro- and anti-apoptotic proteins were detected in tumor infiltrating CD8+ T cells by Western blotting (h). (e-g) mean ± SEM, n = 9, *p < 0.05, **p < 0.01, Mann Whitney test.
i, Effect of MDM2 deficiency on MC38 tumor progression. MC38 tumors were inoculated into Mdm2+/+Cd4-Cre and Mdm2fl/flCd4-Cre mice. Tumor volume was monitored. mean ± SEM, n = 5, ****p < 0.0001, two-way ANOVA.
j-q, Role of MDM2 deficiency in MC38 tumor infiltrating CD8+ T cells. The percentages of Annexin V+ cells in CD8+ T cells (j, k), CD8+ T cells in CD45+ immune cells (l, m), and granzyme B+ (n, o) and IFNγ+ (p, q) cells in CD8+ T cells were analyzed by FACS. mean ± SEM, n = 4 – 5, *p < 0.05, **p < 0.01, Mann Whitney test.
r, Level of p53 protein was determined in Mdm2+/+ and Mdm2−/− T cells by Western blotting.
s-w, Role of p53 in MDM2-regulated T cell survival. Activated p53+/+ and p53−/− CD8+ T cells were transduced by MDM2 (MDM2OE) or empty vector (EV) using a retrovirus. Annexin V+CD8+ T cells (GFP positive) were determined by FACS (s). Jurkat T cells were transfected with shMdm2 or shCTRL. Annexin V+ Jurkat T cells were determined by FACS (t). Activated Mdm2+/+ and Mdm2−/− CD8+ T cells were treated with 30 μM Pifithrin α (PFTα) for 5 hours (u, v), or transduced with p53-specific interfering RNA (iRNA-p53) or EV using a retrovirus (w). Annexin V+CD8+ T cells (GFP positive) were determined by FACS. mean ± SEM, n = 3 – 6, *p < 0.05, **p < 0.01, ***p < 0.001, ****p < 0.0001, one-way ANOVA (s, u, w) or Mann Whitney test (t).
To explore the effect of MDM2 on T cells in vivo in response to pathological stress, we challenged Mdm2+/+Cd4-Cre and Mdm2fl/flCd4-Cre mice with ID8 ovarian cancer cell peritoneal inoculation. We found that Mdm2fl/flCd4-Cre mice were less efficient than Mdm2+/+Cd4-Cre mice in controlling ID8 tumor progression (Fig. 1c–d). This was accompanied by a substantial amount of tumor infiltrating CD8+ T cell apoptosis, as shown by Annexin V+ staining (Fig. 1e–f) and less CD8+ T cell tumor infiltration (Fig. 1g) in Mdm2fl/flCd4-Cre mice, compared to Mdm2+/+Cd4-Cre mice. In support of this, tumor infiltrating Mdm2−/−CD8+ T cells expressed low levels of anti-apoptotic proteins (Bcl2 and Bcl-xL), and high levels of pro-apoptotic proteins (Bak, cleaved (cl)-caspase 8, and cl-caspase 3), compared to Mdm2+/+CD8+ T cells (Fig. 1h, Extended Data Fig. 1m–q). We extended these observations to a different tumor type. We challenged Mdm2+/+Cd4-Cre and Mdm2fl/flCd4-Cre mice with MC38 colon carcinoma cell subcutaneous inoculation. Again, loss of MDM2 in T cells resulted in enhanced tumor growth compared to wild-type mice, as shown by tumor size (Fig. 1i) and weight (Extended Data Fig. 1r). In line with this result, there were higher levels of tumor infiltrating CD8+ T cell apoptosis (Fig. 1j–k), lower percentages of tumor infiltrating CD8+ T cells (Fig. 1l–m), Ki67+CD8+ T cells (Extended Data Fig. 1s–t), granzyme B+CD8+ T cells (Fig. 1n–o), and IFNγ+CD8+ T cells (Fig. 1p–q) in Mdm2fl/flCd4-Cre mice, compared to Mdm2+/+Cd4-Cre mice. Thus, MDM2 positively regulates CD8+ T cell survival and functional potency in cancer.
MDM2 interacts with p53 and alters p53 expression in tumor cells1–3. As expected, we detected an increase in p53 expression in Mdm2−/− T cells as compared to Mdm2+/+ T cells (Fig. 1r). We questioned whether the effect of MDM2 on T cells was dependent on p53. To this end, we intended to genetically and biochemically manipulate p53 in T cells. We crossed p53flox/flox mice with Cd4-Cre mice, and created mice with specific p53 deficiency in both CD4+ and CD8+ T cells. These mice and their littermates are referred to as p53fl/flCd4-Cre and p53+/+Cd4-Cre mice, respectively. T cells isolated from p53fl/flCd4-Cre and p53+/+Cd4-Cre mice are referred to as p53−/− and p53+/+ T cells, respectively (Extended Data Fig. 1u). It has been reported that body weight loss is noticeable at 4 months of age and inflammatory symptoms manifest at 6-9 months of age in p53fl/flCd4-Cre mice12. p53fl/flCd4-Cre mice at the age of 6-8 weeks exhibited comparable physical appearance, similar lymphoid organs, and matching levels of CD8+ T cells when compared to p53+/+Cd4-Cre (Extended Data Fig. 1v–x). We isolated p53−/− T cells from p53fl/flCd4-Cre mice at the age of 6-8 weeks and ectopically expressed MDM2 in p53+/+ and p53−/− T cells. Forced expression of MDM2 (MDM2OE) resulted in a decrease in Annexin V+ T cells in both p53+/+ and p53−/− T cells (Fig. 1s). In addition to the gain-of-function study, we performed a loss-of-function experiment. We used specific small hairpin RNA (shRNA) to silence Mdm2 in Jurkat T cells, which lack p53 expression13. Knocking down Mdm2 increased Annexin V+ cells in Jurkat T cells (Fig. 1t). Moreover, we cultured Mdm2−/− T cells with Pifithrin α (PFTα), a p53 activity inhibitor14. PFTα failed to reduce Annexin V+ cells in Mdm2−/−CD8+ T cells (Fig. 1u–v). Finally, we knocked down p53 in Mdm2−/−CD8+ T cells with p53-specific interfering RNA (iRNA). Similarly, genetic inhibition of p53 did not reduce Annexin V+ cells in Mdm2−/−CD8+ T cells (Fig. 1w). Thus, MDM2 can affect CD8+ T cell survival in the absence of p53.
MDM2 regulates STAT5 protein expression in T cells
We next explored the mechanism by which MDM2 affected CD8+ T cell immunity. The JAK-STAT pathway often regulates T cell survival and effector function15, 16. We hypothesized that MDM2 might regulate the JAK-STAT pathway to affect CD8+ T cell survival and function. To test this hypothesis, we silenced Mdm2 in colorectal cancer cell line LS 174T cells with several short hairpin RNAs against Mdm2 (shMdm2 #1-3). Knocking down Mdm2 had no consistent effect on STAT1, STAT2, STAT3, STAT6, and JAK1, JAK2, and JAK3, but dramatically reduced STAT5 expression levels (Fig. 2a, Extended Data Fig. 2a–h). Similarly, knocking down Mdm2 caused a reduced STAT5 expression in Jurkat T cells (Fig. 2b–c). We transfected 293T cells with DDK-STAT5 and different amounts of plasmids expressing HA-MDM2. We observed that ectopic MDM2 expression resulted in an increase in STAT5 protein in a dose dependent manner (Fig. 2d–e). To directly examine the role of MDM2 in primary CD8+ T cells, we analyzed mouse Mdm2+/+ and Mdm2−/−CD8+ T cells. The levels of STAT5 protein were lower in Mdm2−/− CD8+ T cells than Mdm2+/+ CD8+ T cells (Fig. 2f). In line with the observation that MDM2 deficiency impaired CD8+ T cell-mediated anti-tumor immunity (Fig. 1), we detected lower levels of STAT5 in MC38 tumor infiltrating Mdm2−/−CD8+ T cells compared to Mdm2+/+CD8+ T cells, whereas the levels of STAT1 expression were comparable in Mdm2+/+ and Mdm2−/−T cells (Fig. 2g–h). Furthermore, Mdm2+/+ and Mdm2−/− T cells expressed similar levels of Stat5α and Stat5β (Extended Data Fig. 2i, j) transcripts. We extended our studies to human tumor infiltrating T cells17. Gene Set Enrichment Analysis (GSEA) of single cell sequencing data demonstrated an enrichment of the STAT5 signaling pathway in tumor infiltrating T cells with high Mdm2 expression as compared to low Mdm2 expression (Fig. 2i). Thus, MDM2 promotes both mouse and human STAT5 protein expression in T cells.
Fig. 2: MDM2 regulates STAT5 protein expression in T cells.
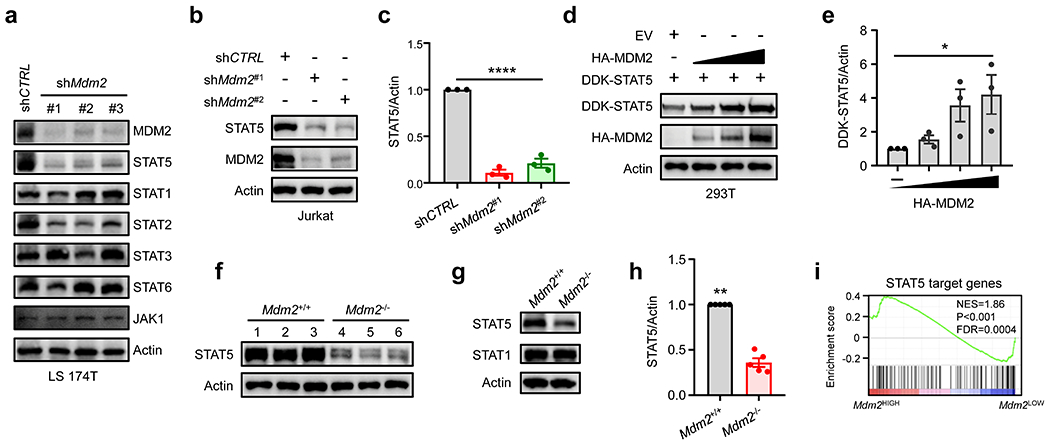
a-c, Effect of MDM2 knockdown on STAT5 expression. LS 174T (a) and Jurkat T (b, c) cells were transfected with shRNAs against Mdm2 or control. Cell lysates were analyzed by immunoblots. (a, b) One of 3 experiments is shown. (c) Results are expressed as the relative mean density of STAT5 ± SEM, n = 3, ****p < 0.0001, one-way ANOVA.
d-e, Effect of MDM2 on STAT5 expression. 293T cells were transfected with a fixed concentration of DDK-STAT5 and increased concentrations of HA-MDM2. (d) Western blotting showed STAT5 and MDM2 expression. One of 3 experiments is shown. (e) Results are expressed as the relative mean density of STAT5 ± SEM, n = 3, *p < 0.05, one-way ANOVA.
f-h, Effect of MDM2 deletion on STAT5 expression. Immunoblots showed STAT5 expression in normal (f) and MC38 tumor infiltrating (g, h) CD8+ T cells. T cells were isolated from Mdm2+/+Cd4-Cre and Mdm2fl/flCd4-Cre mice. 3 - 5 mice per condition. (h) Results are expressed as the relative mean density of STAT5 ± SEM, n = 5, **p < 0.01, Mann Whitney test.
i, STAT5 signaling genes in tumor infiltrating T cells. Based on high and low Mdm2 expression, STAT5 target gene signature was analyzed in single T cell RNA-sequencing data in human melanoma infiltrating T cells.
MDM2 prevents c-Cbl-mediated STAT5 degradation
MDM2 mediates ubiquitin ligase activity and often leads to protein degradation in tumor cells1. However, it is unknown if similar biological activity of MDM2 is operative in T cells. The fact that MDM2 maintained and supported STAT5 protein expression in T cells (Fig. 2) is unexpected. This prompts us to explore the mechanism by which MDM2 regulates STAT5 protein expression in T cells. To this end, we treated Jurkat T cells and LS 174T cells with MG132, a proteasome inhibitor. MG132 increased STAT5 protein levels in Jurkat T cells (Extended Data Fig. 3a–b) and LS 174T cells (Fig. 3a, Extended Data Fig. 3c), and prevented STAT5 protein reduction in shMdm2-LS 174T cells (Fig. 3a, Extended Data Fig. 3c). The data suggest that MDM2 may protect STAT5 from proteasome-dependent degradation.
Fig. 3: MDM2 prevents c-Cbl-mediated STAT5 degradation.
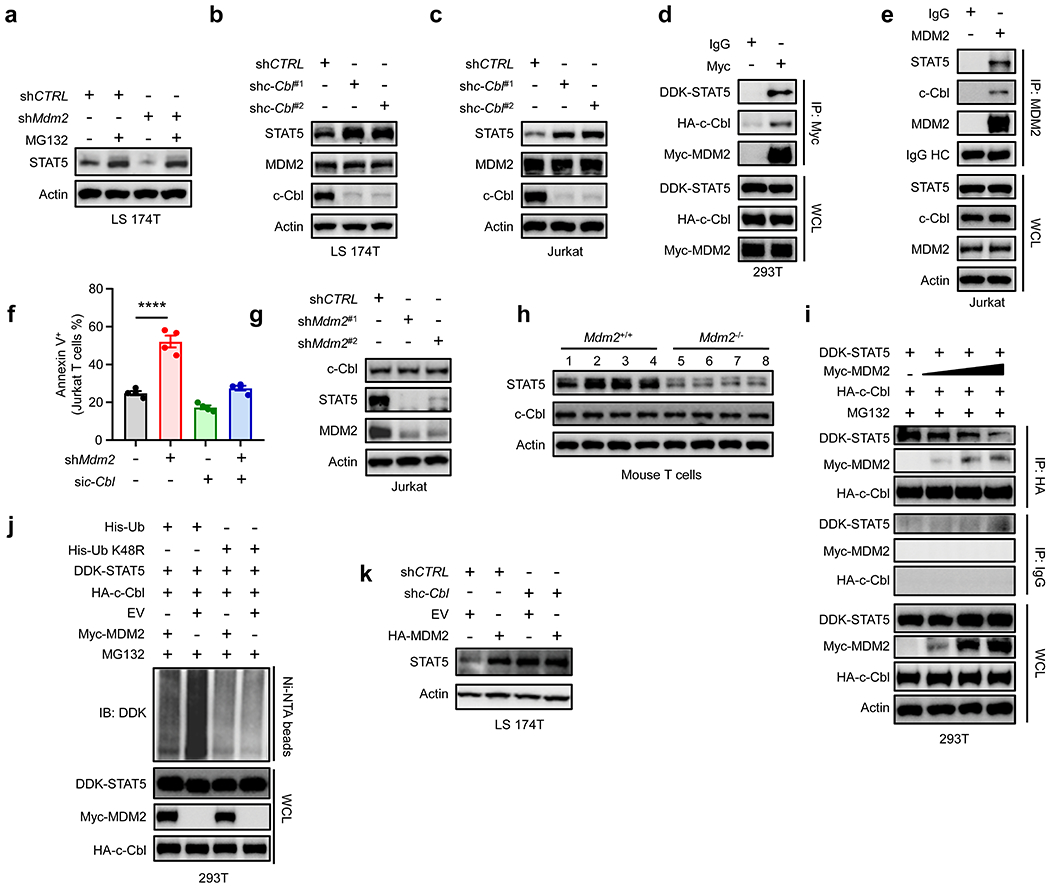
a, Effect of MDM2 on STAT5 degradation. Wild-type and MDM2 knockdown LS 174T cells were treated with MG132. Immunoblots showed STAT5 expression. One of 3 experiments is shown.
b-c, Effect of c-Cbl on STAT5 and MDM2 expression. LS 174T (b) and Jurkat T (c) cells were transfected with 2 shRNAs against c-Cbl or control. Immunoblots showed c-Cbl, STAT5, and MDM2 expression. One of 3 experiments is shown.
d, Interaction among MDM2, STAT5, and c-Cbl. 293T cells were transfected with DDK-STAT5, HA-c-Cbl, and Myc-MDM2, and followed by IP with Myc antibody. One of 3 experiments is shown.
e, Interaction among MDM2, STAT5, and c-Cbl. Jurkat T cells were lysed and followed by IP with anti-MDM2 mAb. Immunoblots were conducted with indicated antibodies. One of 3 experiments is shown.
f, Effect of MDM2 and c-Cbl on T cell survival. The percentages of Annexin V+ cells were analyzed with FACS in shMdm2-Jurkat T cells and si-c-Cbl-Jurkat T cells. mean ± SEM, n = 4, ****p < 0.0001, one-way ANOVA.
g, Immunoblots showed c-Cbl, STAT5, and MDM2 in Jurkat T cells transfected with shMdm2 or control. One of 3 experiments is shown.
h, Immunoblots showed c-Cbl, and STAT5 in Mdm2+/+ and Mdm2−/− T cells. 4 mice per condition.
i, Immunoblots showed the binding of MDM2 and c-Cbl to STAT5. 293T cells were transfected with a fixed concentration of DDK-STAT5, HA-c-Cbl, and increased concentrations of Myc-MDM2 in the presence of MG132. One of 3 experiments is shown.
j, Role of MDM2 in STAT5 ubiquitination. 293T cells were transfected with indicated plasmids, lysed, and followed by Ni-beads pull down. Immunoblots showed STAT5 polyubiquitylation. One of 3 experiments is shown.
k, Role of MDM2 in STAT5 expression. c-Cbl+/+ and c-Cbl−/− LS 174T cells were transfected with HA-MDM2 and empty vector (EV). Immunoblots showed STAT5 expression. One of 3 experiments is shown.
c-Cbl, an E3 ligase, mediates the ubiquitination and degradation of STAT5 in mouse NIH3T3 and human mesenchymal stromal cells18, 19. We hypothesized that MDM2 interacted with c-Cbl and inhibited c-Cbl-mediated STAT5 degradation in T cells. To test this hypothesis, we first knocked down c-Cbl with shc-Cbl in human LS 174T and Jurkat T cells. c-Cbl knockdown (Fig. 3b–c, Extended Data Fig. 3d–e) resulted in increased STAT5 levels in both cell lines (Fig. 3b–c, Extended Data Fig. 3f–g). Interestingly, c-Cbl knockdown did not affect MDM2 expression (Fig. 3b–c, Extended Data Fig. 3h–i). The data indicated that c-Cbl mediates STAT5 degradation, but has no effect on MDM2 expression. Next, we ectopically expressed DDK-STAT5, Myc-Mdm2, and HA-c-Cbl in 293T cells, and performed a reciprocal co-immunoprecipitation (IP) assay. We detected a co-existence of STAT5, MDM2, and c-Cbl in one complex (Fig. 3d). We validated that endogenous MDM2, c-Cbl, and STAT5 also interacted with each other in human Jurkat T cells (Fig. 3e). To test the effect of this interaction on T cell function, we silenced c-Cbl in shMdm2-Jurkat T cells and mouse primary Mdm2−/− T cells. As expected, silencing Mdm2 resulted in an increase in Annexin V+ cells in Jurkat T cells (Fig. 3f). Interestingly, silencing c-Cbl rescued Ki67 expression in Mdm2−/− primary mouse T cells and shMdm2-Jurkat T cells (Extended Data Fig. 3j–k). The data suggest that MDM2 regulates T cell function through c-Cbl.
To test whether and how the interaction between MDM2 and c-Cbl could modify the ability of c-Cbl to mediate STAT5 degradation, we initially questioned if MDM2 regulated c-Cbl protein expression. Knocking down Mdm2 reduced STAT5 expression and had no effect on c-Cbl protein in both Jurkat T cells (Fig. 3g, Extended Data Fig. 3l) and LS 174T cells (Extended Data Fig. 3m, n). Furthermore, the levels of c-Cbl protein were comparable in mouse Mdm2+/+ and Mdm2−/− T cells (Fig. 3h, Extended Data Fig. 3o, p). Thus, MDM2 does not regulate c-Cbl protein expression. Then, we asked whether MDM2 inhibited the interaction between STAT5 and c-Cbl. We transfected 293T cells with different amounts of Myc-MDM2 along with HA-c-Cbl and DDK-STAT5. When c-Cbl was immunoprecipitated, following the increased levels of MDM2, we detected a dose dependent reduction of STAT5 in the c-Cbl-immunoprecipitated complex (Fig. 3i). The results indicate that increased MDM2 causes less STAT5 binding to c-Cbl, thereby less c-Cbl-mediated STAT5 degradation. Finally, we overexpressed HA-c-Cbl and DDK-STAT5, along with His-ubiquitin (His-Ub, His-Ub K48R) with or without MDM2 in 293T cells. We noticed that the STAT5 ubiquitination occurred mostly through K48, which was inhibited by forced MDM2 expression (Fig. 3j). Furthermore, knocking down c-Cbl resulted in increased STAT5 levels, which could not be modified by ectopic MDM2 expression in LS 174T cells (Fig. 3k, Extended Data Fig. 3q). Thus, MDM2 antagonizes the interaction between c-Cbl and STAT5, prevents c-Cbl mediated-STAT5 degradation, and stabilizes STAT5 expression.
Targeting p53-MDM2 interaction elicits tumor p53 independent anti-tumor activity
Given that MDM2 prevented STAT5 degradation in T cells (Fig. 2 and 3) and contributed to T cell-mediated anti-tumor immunity (Fig. 1), we reasoned that pharmacologically enhancing MDM2 protein in T cells would trigger T cell-mediated anti-tumor immunity and treat cancer. AA-115 (APG-115) (Extended Data Fig. 4a) is a potent small-molecule inhibitor of the MDM2-p53 interaction in tumor cells carrying functional p5320. It is unknown if APG115 would affect MDM2 expression and function in T cells. To answer this question, we treated human and mouse T cells with APG115. We observed a dose-dependent upregulation of MDM2 protein, accompanied with p53 induction (Fig. 4a–b, Extended Data Fig. 4b–e). Based on MDM2 expression, we referred to APG115 as an MDM2 enhancer, rather than an inhibitor.
Fig. 4: Targeting p53 and MDM2 interaction elicits tumor p53 independent anti-tumor activity.
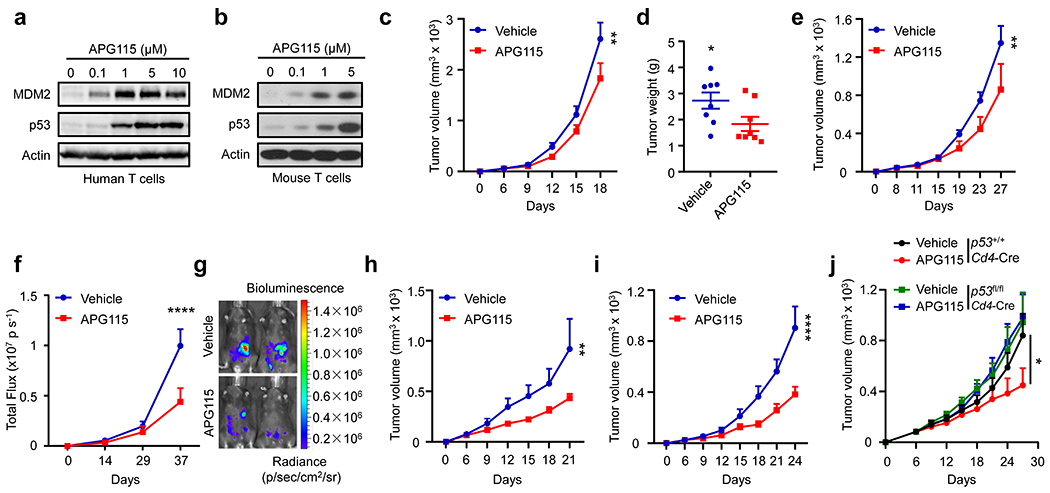
a-b, Effect of APG115 on MDM2 expression in T cells. Human (a) and mouse (b) T cells were stimulated with anti-CD3 and anti-CD28 mAbs in the presence of different concentrations of APG115. Expression of MDM2 and p53 was measured with immunoblotting. One of 3 experiments is shown.
c-i, Effect of APG115 on tumor immunotherapy. Mice were inoculated with B16F10 (c-d), CT26 (e), ID8 (f-g), MC38 (h), and 4T1 (i) tumor cells and treated with APG115 or vehicle. Tumor volume and weight were monitored. mean ± SEM, c-d, n = 8; e, n = 6; f, n = 9-10; h, n = 7; i, n = 5. *p < 0.05, **p < 0.01, ****p < 0.0001, Mann Whitney test (d) or two-way ANOVA (c, e, f, h, i).
j, Effect of T cell p53 deficiency on MC38 tumor progression. p53+/+Cd4-Cre or p53fl/flCd4-Cre mice were inoculated with MC38 tumor cells and treated with APG115 or vehicle. mean ± SEM, n = 7. *p < 0.05, two-way ANOVA.
Given that genetic deficiency of MDM2 in T cells impaired T cell-mediated tumor immunity (Fig. 1), we posited that APG115, an MDM2 enhancer, played an immune stimulatory role in tumor bearing mice in vivo. To test this hypothesis, we inoculated B16F10 melanoma into C57BL/6J mice and treated them with APG115. Mice received APG115 manifested slower tumor progression (Fig. 4c) and had smaller tumor weight (Fig. 4d). Similar results were obtained in mice bearing CT26 colorectal carcinoma (Fig. 4e) and ID8 ovarian cancer (Fig. 4f–g). Notably, B16F10, CT26, and ID8 tumor cells expressed wild-type p53 protein (Extended Data Fig. 4f–h) and responded to APG115, as demonstrated by upregulated expression of p53 and p21 protein, a typical p53 target gene (Extended Data Fig. 4f–h). To determine whether APG115-mediated anti-tumor effect was dependent on p53 in tumor cells, we treated mice bearing MC38 colorectal cancer cells with APG115. MC38 colorectal cancer cells expressed mutated p53 and were not responsive to APG115, as shown by unchanged expression of markers of p53 activation - such as MDM2, p53, and poly (ADP-ribose) polymerase 1 (PARP1) (Extended Data Fig. 4i). To our surprise, APG115 manifested a potent anti-tumor role in MC38 tumor bearing mice (Fig. 4h). Then, we tested mice bearing 4T1 breast cancer cells. 4T1 breast cancer cells didn’t express p53 and were not responsive to APG115 (Extended Data Fig. 4j). Again, treatment with APG115 resulted in potent tumor inhibition (Fig. 4i). Thus, tumor p53 status is not relevant to the anti-tumor effect of APG115 in multiple tumor models (Fig. 4c–i). MDM2 is essential for T cell-mediated anti-tumor immunity (Fig. 1 and 2). We wondered if p53 in T cells is involved in APG115-induced anti-tumor responses. To test this, we isolated p53−/− T cells from p53fl/flCd4-Cre mice and treated them with APG115. APG115 failed to protect p53−/− T cells from apoptosis (Extended Data Fig. 4k). Next, we treated MC38 bearing p53+/+Cd4-Cre and p53fl/flCd4-Cre mice with APG115. p53+/+Cd4-Cre mice responded to APG115 treatment while p53fl/flCd4-Cre mice did not, as shown by tumor volume (Fig. 4j). Thus, APG115 targets the p53 and MDM2 interaction to elicit T cell p53-dependent anti-tumor activity regardless of p53 status in tumor cells.
Targeting p53-MDM2 interaction activates CD8+ T cell-mediated anti-tumor immunity
APG115 and other MDM2-p53 interaction inhibitors, such as Nutlins, were designed to target the interaction between wild type p53 and MDM2 in tumor cells and are thought to be potential tumor chemotherapeutic agents1, 20, 21. The role of MDM2 in T cell survival and function (Fig. 1 and 2) and the nature of tumor p53 independent anti-tumor effect induced by APG115 (Fig. 4) prompted us to examine whether APG115 could also be an immune modulator, rather than only a chemotherapeutic agent. First, treatment with APG115 failed to manifest anti-tumor effect in NOD-scid IL2Rgnull (NSG) mice bearing MC38 tumors, as shown by tumor volume and weight (Fig. 5a, and Extended Data Fig. 5a–b). Furthermore, when we depleted CD8+ T cells using anti-CD8 monoclonal antibody (mAb), APG115 therapy was no longer effective at controlling MC38 tumor progression in wild type C57BL/6J mice (Fig. 5b). In contrast, depletion of CD4+ T cells with anti-CD4 mAb did not affect tumor growth, and treatment with APG115 showed similar anti-tumor efficacy in mice with or without CD4+ T cell depletion (Extended Data Fig. 5c–d). Hence, CD8+ T cells are essential for APG115-mediated anti-tumor immunity. In further support of this conclusion, when we observed an anti-tumor effect of APG115 in mice bearing B16F10 tumors (Fig. 4c), we detected a decrease in tumor infiltrating CD8+ T cell apoptosis (Fig. 5c–d), and an increase in tumor infiltrating CD8+ T cell levels (Fig. 5e–f) and effector cytokine expression (Fig. 5g–j). Similar immunological results were observed in mice bearing 4T1 tumor cells treated with APG115 (Fig. 5k–m, and Extended Data Fig. 5e–f). Thus, regardless of p53 status in tumor cells, treatment with APG115 improves tumor infiltrating CD8+ T cell survival and function.
Fig. 5: Targeting p53 and MDM2 interaction activates CD8+ T cell-mediated anti-tumor immunity.
a, Effect of APG115 on tumor growth in wild-type and NSG mice. MC38 tumor bearing wild-type and NSG mice were treated with APG115 or vehicle. Tumor volume was monitored. mean ± SEM, n = 7 - 11. ***p < 0.001, two-way ANOVA. The group of wild type mice treated with APG115 is identical in Fig 4h.
b, Effect of APG115 and anti-CD8 on tumor immunotherapy. C57BL/6J mice were inoculated with MC38 and treated with APG115 or anti-CD8. Tumor volume was monitored. mean ± SEM, n = 8. *p < 0.05, two-way ANOVA.
c-j, Role of APG115 in B16F10 tumor infiltrating CD8+ T cells. The percentages of Annexin V+ cells in CD8+ T cells (c, d), CD8+ T cells in CD45+ immune cells (e, f), and IFNγ+ (g, h) and granzyme B+ (i, j) cells in CD8+ T cells were analyzed by FACS. mean ± SEM, n = 6 - 7, *p < 0.05, **p < 0.01, Mann Whitney test.
k-m, Role of APG115 in 4T1 tumor infiltrating CD8+ T cells. The percentages of CD8+ T cells in CD45+ immune cells (k) and IFNγ+ (l) and granzyme B+ (m) cells in CD8+ T cells were analyzed by FACS. mean ± SEM, n = 5, *p < 0.05, **p < 0.01, Mann Whitney test.
n-o, Effect of APG115 on tumor immunotherapy in tumor bearing Mdm2+/+Cd4-Cre and Mdm2fl/flCd4-Cre mice. Mdm2+/+Cd4-Cre and Mdm2fl/flCd4-Cre mice were inoculated with B16F10 tumor cells and treated with APG115 or vehicle. Tumor volume (n) and weight (o) were monitored. mean ± SEM, n = 6. *p < 0.05, **p < 0.01, two-way ANOVA (n) or one-way ANOVA (o).
As MDM2 controls CD8+ T cell-mediated anti-tumor immunity (Fig. 1), we questioned if MDM2 in T cells was a functional target and responsible for APG115 therapy in tumor bearing mice. To test this, we treated B16F10 bearing Mdm2+/+Cd4-Cre and Mdm2fl/flCd4-Cre mice with APG115. As expected, treatment with APG115 inhibited tumor growth (Fig. 5n–o) and recovered tumor infiltrating CD8+ T cell survival, as shown by reduced Annexin V+ staining (Extended Data Fig. 5g–h) in Mdm2+/+Cd4-Cre mice. However, the effects of APG115 on tumor growth (Fig. 5n–o) and tumor infiltrating T cell survival (Extended Data Fig. 5g–h) were abolished in Mdm2fl/flCd4-Cre mice. Thus, APG115 targets MDM2 in CD8+ T cells to mediate anti-tumor immunity.
Targeting p53-MDM2 interaction stabilizes T cell STAT5 and synergizes with immunotherapy
As APG115 targets MDM2 in CD8+ T cells to mediate anti-tumor immunity (Fig. 5) and MDM2 controls STAT5 expression in T cells (Fig. 2 and 3), we assessed a mechanistic connection between MDM2, STAT5, and function in T cells under APG115 treatment. We activated Mdm2+/+ and Mdm2−/− CD8+ T cells in vitro in the presence of APG115. Addition of APG115 enhanced STAT5 (Fig. 6a, Extended data Fig. 6a) and Bcl-xL (Fig. 6b, Extended data Fig. 6b) expression, and reduced cl-caspase 8 expression (Fig. 6b, Extended data Fig. 6c) in Mdm2+/+ CD8+ T cells. However, these effects were diminished in Mdm2−/− CD8+ T cells (Fig. 6a–b, Extended data Fig. 6a–c). Furthermore, when we treated MC38 tumor bearing mice with APG115, we detected upregulated STAT5 proteins in tumor infiltrating CD8+ T cells in vivo. The effect of APG115 on STAT5 was most pronounced among multiple STATs we tested in vivo (Fig. 6c, Extended data Fig. 6d). In addition, we cultured and activated human CD8+ T cells in the presence of APG115. Similar to mouse T cells, we observed an increase in STAT5 in human T cells in the presence of APG115 (Fig. 6d, Extended data Fig. 6e). Accordingly, APG115 improved T cell effector function as indicated by IFNγ, TNFα, and IL-2 levels compared to controls (Extended Data Fig. 6f–h). In order to examine whether APG115 can target antigen specific CD8+ T cells, we transferred OT-I cells into B16F10-OVA tumor bearing mice and treated these mice with APG115. Again, APG115 improved the anti-tumor effect of OT-I cells as shown by tumor volume (Fig. 6e). To investigate a direct role of STAT5 in APG115-dependent T cell function, we expressed a constitutively active STAT5 mutant (STAT5CA) in Mdm2+/+ and Mdm2−/−CD8+ T cells. We found STAT5CA prevented Mdm2−/−CD8+ T cells from apoptosis (Extended Data Fig. 6i). Furthermore, STAT5CA expressing Mdm2+/+ and Mdm2−/− CD8+ T cells lost their sensitivity to APG115 treatment (Extended Data Fig. 6i). Next, we transfected OT-I cells with STAT5CA or vector control, transferred these T cells into B16F10-OVA tumor bearing mice, and treated these mice with APG115. As expected, vector-OT-I cells and STAT5CA-OT-I cells slowed down tumor growth. STAT5CA-OT-I cells controlled tumor growth more efficiently than vector-OT-I cells (Fig. 6f). Interestingly, APG115 treatment failed to further enhance the anti-tumor activities mediated by STAT5CA-OT-I cells (Fig. 6f). Accordingly, APG115 did not additionally improve STAT5CA-OT-I survival (Fig. 6g–h) and effector function (Fig. 6i–j) in the tumor microenvironment. These gain-of-function data suggest that T cell STAT5 is involved in APG115-medaited anti-tumor immunity. To further validate this notion in the loss-of-function system, we biochemically and genetically inhibited STAT5 in OT-I cells. We pretreated (primed) OT-I cells with DMSO or a STAT5 inhibitor, subsequently transferred these OT-I cells into B16F10-OVA bearing mice, and treated mice with APG115. Priming with STAT5 inhibitor largely diminished the anti-tumor impact of OT-I on tumor growth (Fig. 6k). More importantly, while APG115 treatment improved the anti-tumor efficacy of OT-I cells, APG115 failed to support the anti-tumor effect mediated by OT-I cells primed with STAT5 inhibitor (Fig. 6k). Next, we silenced Stat5 in OT-I cells with specific siRNA (siStat5), transferred these T cells to B16F10-OVA bearing mice, and treated these mice with APG115. siStat5 OT-I cells showed weak anti-tumor efficacy (Fig. 6l). Treatment with APG115 reduced tumor growth mediated by OT-I cells, but not by siStat5-OT-I cells (Fig. 6l). In line with this, siStat5 OT-I cells manifested weak tumor killing capacity in vitro compared to controlled OT-I cells (Extended Data Fig. 6j). APG115 increased the in vivo functionality of OT-I cells, but not siStat5-OT-I cells (Fig. 6m). Thus, APG115 regulates CD8+ T cell survival and function through MDM2-controlled STAT5.
Fig. 6: Targeting p53 and MDM2 interaction stabilizes T cell STAT5 and synergizes with immunotherapy.
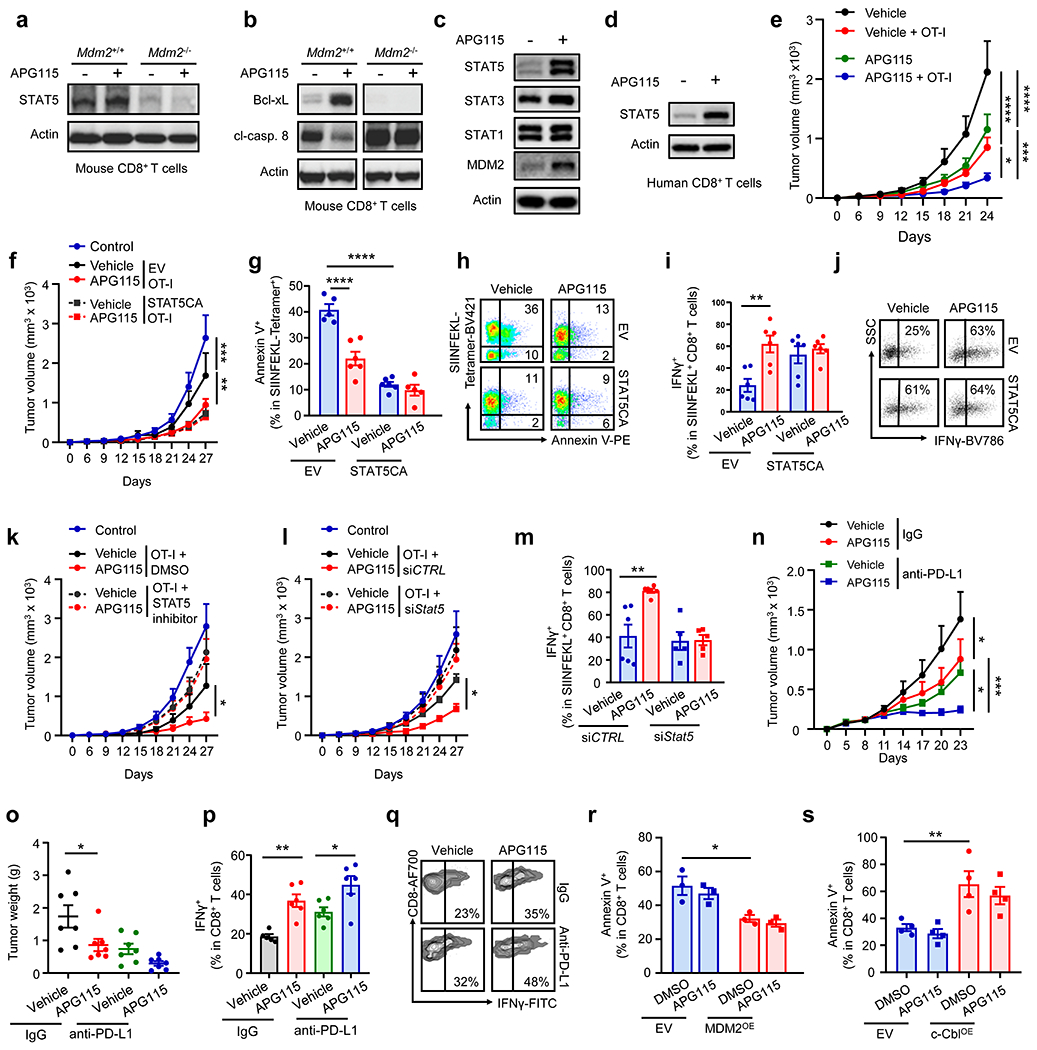
a-d, Role of APG115 in CD8+ T cells. (a, b) Mouse Mdm2+/+Cd4-Cre and Mdm2fl/flCd4-Cre mice CD8+ T cells were stimulated with anti-CD3 and anti-CD28 in the presence of APG115. Western blots showed STAT5 (a), Bcl-xL (b), and cl-caspase 8 (p43) (b) in T cells. 2 of 6 mice are shown. (c) Western blots showed expression of STATs and MDM2 in MC38 tumor infiltrating CD8+ T cells in mice treated with APG115. n = 6/group. (d) Western blots showed STAT5 expression in human CD8+ T cells stimulated with anti-CD3 and anti-CD28 in the presence of APG115. n = 4.
e, Effect of APG115 on OT-I cell-mediated tumor regression. OT-I cells were transferred into mice bearing B16F10-OVA. Mice were treated with APG115. Tumor volume was monitored. n = 7, *p < 0.05, ***p < 0.001, ****p < 0.0001, two-way ANOVA. OVA, ovalbumin.
f-j, Role of STAT5 activation in APG115-regulated T cell immunity. Activated OT-I cells were transduced with a constitutive active STAT5 (STAT5CA) and empty vector (EV) using a retrovirus. GFP positive OT-I cells were sorted and transferred into B16F10-OVA bearing mice. Tumor volume was monitored (f). The percentages of Annexin V+ (g-h) or IFNγ+ (i-j) in SIINFEKL-tetramer+CD8+ T cells were analyzed by FACS. one representative dot-plot is shown. n = 5 – 6, mean ± SEM, **p < 0.01, ***p < 0.001, ****p < 0.0001, two-way ANOVA (f) or one-way ANOVA (g, i).
k, Role of STAT5 inhibitor in APG115-mediated T cell immunity. Activated OT-I cells were incubated with STAT5 inhibitor or DMSO, and transferred into B16F10-OVA bearing mice. Tumor volume was monitored. n = 6, mean ± SEM, *p < 0.05, two-way ANOVA.
l-m, Role of STAT5 knocking down in APG115-regulated T cell immunity. Activated OT-I cells were transfected with STAT5 specific siRNA (FAM labeled with siStat5) or siCTRL. FAM positive OT-I cells were sorted and transferred into B16F10-OVA bearing mice. Tumor volume was monitored (l). The percentages of IFNγ+ cells in SIINFEKL-tetramer+CD8+ T cells were analyzed by FACS (m). n = 5 – 6, mean ± SEM, *p < 0.05, **p < 0.01, two-way ANOVA (l), and one-way ANOVA (m).
n-q, Effect of APG115 on anti-PD-L1 therapy. MC38 tumor bearing mice were treated with APG115, anti-PD-L1, and their combination. Tumor volume (n) and weight (o) were monitored. The percentages of IFNγ+ (p-q) cells in tumor-infiltrating CD8+ T cells were analyzed by FACS. mean ± SEM, n = 5 - 7, *p < 0.05, **p < 0.01, ***p < 0.001, two-way ANOVA (n), and one-way ANOVA (o-p).
r-s, Effect of MDM2 and c-Cbl on p53−/− T cell survival. Activated p53−/−CD8+ T cells were transduced with MDM2 (MDM2OE) or c-Cbl (c-CblOE) expressing retrovirus. The percentages of Annexin V+ cells were analyzed by FACS. mean ± SEM, n = 3 - 4, *p < 0.05, **p < 0.01, one-way ANOVA.
Given that APG115 promotes CD8+ T cell tumor infiltration and function, we hypothesized that APG115 treatment could improve tumor response to checkpoint blockade and adoptive T cell transfusion therapy. First, we treated MC38 tumor bearing mice with anti-PD-L1, APG115, and their combination. Anti-PD-L1 and APG115 alone slowed down tumor growth, while their combination completely inhibited tumor progression as shown by tumor volume (Fig. 6n) and weight (Fig. 6o). As expected, the combinatorial therapy resulted in increased levels of tumor infiltrating CD8+ T cell effector function as assessed by expression of IFNγ (Fig. 6p–q), compared to the groups with single agent therapy.
We showed that MDM2 inhibited c-Cbl-dependent degradation of STAT5 in T cells (Fig. 3) and regulated T cell survival and function in the absence of p53 (Fig. 1s–w). APG115 targets the interaction between MDM2 and p53 to increase MDM2 expression and enhance p53+/+ T cell survival and function in vitro and in vivo (Fig. 3f, Fig. 4a–b, Fig. 5c). We next tested the effect of APG115 on p53−/− T cells isolated from p53fl/flCd4-Cre mice. As expected, APG115 treatment failed to affect expression of MDM2, c-Cbl, and STAT5 in p53−/− T cells (Extended Data Fig. 6k). Next, we overexpressed MDM2 in p53−/− T cells. While overexpression of MDM2 resulted in reduced Annexin V+ T cells, APG115 failed to alter p53−/− T cell survival regardless of MDM2 levels (Fig. 6r). Moreover, we overexpressed c-Cbl in p53−/− T cells and treated them with APG115. As expected, overexpression of c-Cbl increased T cell apoptosis, but APG115 did not change p53−/− T cell apoptosis regardless of c-Cbl levels (Fig. 6s). Thus, APG115 upregulates MDM2 expression to promote T cell survival in p53 dependent manner.
Mdm2 expression correlates with immune gene signatures in patients with cancer
Finally, we attempted to validate our major experimental observations in patients with cancers. Based on tumor infiltrating T cell single cell RNA sequence data17, GSEA demonstrated enrichment of several immune effector gene pathways in tumor infiltrating T cells with high Mdm2 expression, compared to low Mdm2 expression. These pathways included the Th1-type immune response, cytotoxic T cell response (Fig. 7a–b), IFNγ response (Fig. 7c), T cell receptor signaling (Extended Data Fig. 7a), T cell activation gene signature (Extended Data Fig. 7b), and cytokine production signature (Extended Data Fig. 7c). On the contrary, the apoptotic gene signature was enriched in T cells expressing low Mdm2 expression (Fig. 7d). Therefore, MDM2 expression may regulate CD8+ T cell survival and functional potency in human cancer. Altogether, we demonstrate that MDM2 competes with c-Cbl and prevents c-Cbl binding to STAT5, thereby reducing c-Cbl-mediated STAT5 degradation, supporting CD8+ T cell-mediated immunity and immunotherapy (Extended Data Fig. 7d).
Fig. 7: Mdm2 expression correlates with immune gene signatures in patients with cancer.
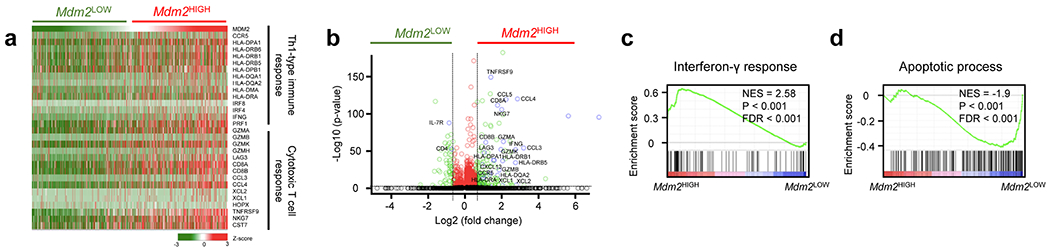
a, Heat map showing correlation between T cell gene pathways and Mdm2 expression in human melanoma infiltrating T cells. Cells were grouped by the average expression level of Mdm2. Z-score was used to represent the relative expression of each gene in all cells.
b, Volcano plots showing differentially expressed genes in human melanoma infiltrating T cells with high vs low Mdm2 expression.
c-d, GSEA analysis showing enriched IFNγ response gene signature (c) and T cell apoptosis pathway (d) in human melanoma infiltrating T cells with high vs low Mdm2 expression.
Discussion
In this work, we have revealed a key role of the MDM2-c-Cbl-STAT5 axis in CD8+ T cell function, and generated novel insights into the p53 and MDM2 pathway in the context of CD8+ T cell-mediated anti-tumor immunity.
Despite the identification of p53, MDM2, and their interaction in tumor cells in past years, along with substantial published tumor biological and genetic studies, there are limited works on the role of the p53-MDM2 pathway in the immune system. Previous studies have reported that p53 plays a role in murine CD4+ T cell proliferation and apoptosis22, 23, and p53-expressing senescent stellate cells help to polarize mouse M1 macrophages24. However, the mechanistic and functional connection of the MDM2-c-Cbl-STAT5 axis in CD8+ T cells remains to be defined in the context of tumor immunity. Using tumor bearing mouse models with Mdm2 conditional knock out in T cells, we have found that MDM2 is essential for CD8+ T cell survival and effector function in the tumor microenvironment and is critical for CD8+ T cell-mediated anti-tumor immunity. This conclusion has been supported by the data generated in the in vitro and ex vivo activated human and mouse CD8+ T cells, and complemented by studies on several tumor bearing mouse models treated with specific pharmacologic agent targeting the p53-MDM2 interaction. As an extension to cancer patients, single cell sequence analysis has uncovered a positive correlation between MDM2 abundance and effector function in human tumor infiltrating T cells. Hence, we have filled one of the knowledge gaps on MDM2 - namely, the functional importance of MDM2 in CD8+ T cells and cancer immunity.
MDM2 has intrinsic E3 ubiquitin ligase activity and usually leads to protein degradation1, 25. Our unexpected finding suggests a possibility that MDM2 may target a key STAT5 degrader and consequently stabilizes STAT5 protein. c-Cbl can bind to STAT5 and degrade STAT5 in fibroblast cell types18, 19. We have demonstrated that the interplay among MDM2, STAT5, and c-Cbl is functionally relevant in determining mouse and human T cell survival and function. Therefore, we have discovered a surprising role and its related mechanism for MDM2 in stabilizing STAT5 in T cells.
Given that MDM2 interacts with p53 and mediates p53 degradation in tumor cells1, we have demonstrated that MDM2 can regulate T survival and function in the absence of p53. Thus, in addition to its p53-dependent and -independent oncogenic activities, our work reveals a previously unknown, p53-independent, immunological function for MDM2 in T cells.
To explore a translation of the new role of MDM2 in CD8+ T cells, we turn our attention to the recently reported drug candidate, APG115, which is currently in Phase I/II clinical trials20. APG115 is designed to be a chemotherapeutic agent - blocking the p53-MDM2 interaction, reactivating wild-type p53, and directly inducing tumor cell apoptosis20. In line with a previous report in tumor cells20, APG115 promotes both p53 and MDM2 expression in mouse and human T cells. Interestingly, treatment with APG115 inhibits tumor growth in mice bearing multiple tumor histology types. Although the involvement of the MDM2-c-Cbl-STAT5 axis and its mechanistic link with p53 in CD8+ T cells are unexplored, a recent report has shown that treatment with APG115 resulted in an increase in IFNγ expression in CD4+ T cells and slowed down tumor progression in murine models26. However, we found the anti-tumor effect of APG115 is accompanied with increased CD8+ T cell survival and function in the tumor microenvironment and depends on CD8+ T cells, but not CD4+ T cells. Furthermore, the anti-tumor role of APG115 is independent of tumor p53 genetic status, but is completely dependent on the presence of host CD8+ T cells, and p53 and MDM2 in CD8+ T cells. Given the defined oncogenic activity of MDM2 itself and its inhibitory role in p53, reducing tumor MDM2 expression or its ubiquitin ligase activity has been also considered an anti-cancer approach27, 28. However, MDM2 is essential for CD8+ T cell survival and function. Systemic administration of an MDM2-targeted drug will inevitably impact CD8+ T cells in vivo. If an MDM2-targeted drug reduces MDM2 expression in CD8+ T cells, especially in cancers with mutated or deleted p53, such a drug may impair STAT5 stability and CD8+ T cell immunity, and be clinically questionable. Indeed, in vivo targeting the p53 - MDM2 interaction increases both p53 and MDM2 in T cells, analogously enhances T cell-mediated anti-tumor immunity, and synergizes immunotherapy. Furthermore, these effects do not rely on tumor p53. Thus, effective development and selection of MDM2-targeted drugs may be expanded to include not only p53 and MDM2 status in tumor cells, but also MDM2 protein levels in T cells. MDM2 in T cells may serve as a patient selection indicator for future clinical trials with MDM2-targeted drug therapy, including those p53-MDM2 inhibitors currently in clinical development.
In summary, we have discovered that MDM2 controls STAT5 stability in CD8+ T cells and is critical for effective anti-tumor immunity. Targeting the p53 and MDM2 interaction induces tumor regression via p53 and MDM2 in CD8+ T cells, independent of tumor p53 status. These novel findings will inform the search for MDM2-targeted agents and help launch relevant clinical trials.
Methods
Antibodies, Plasmids, shRNA and Reagents
For T cell activation, anti-human CD3ε (clone HIT3 α, Catalog No. 555336), anti-human CD28 (clone CD28.2, Catalog No. 555725), anti-mouse CD3ε (clone 145-2C11, Catalog No. 553057) and anti-mouse CD28 (clone 37.51, Catalog No. 553294) were purchased from BD Biosciences. For flow cytometry analysis, anti-mouse CD45 (clone 30-F11, Catalog No. 560501, 550994), anti-mouse-CD90 (clone 53-2.1, Catalog No. 553004), anti-mouse CD8 (clone 53-6.7, Catalog No. 560774, 557959), anti-mouse-IFNγ (clone XMG1.2, Catalog No.563773), anti-granzyme B (clone GB11, Catalog No. 561142), anti-mouse-Ki67(clone B56, Catalog No. 563462, 561277) and anti-mouse-IL-2 (clone JES6-5H4, Catalog No. 562483) were purchased from BD Biosciences. Anti-mouse-TNFα (clone MP6-XT22, Catalog No. 25-7321-82), anti-mouse CD3 (clone 145-2C11, Catalog No. 35-0031-82), anti-mouse-CD4 (clone RM4-5, Catalog No. 47-0042-82) were purchased from Thermo Fisher Scientific. For Western blots, anti-β-actin (8H10D1, #3700, 1:1000), anti-STAT5 (D2O6Y, #94205, 1:1000), anti-STAT1 (D1K9Y, #14994, 1:1000), anti-STAT2 (D9J7L, #72604, 1:1000), anti-STAT3 (D1A5, #8768, 1:1000), anti-STAT6 (D3H4, #5397, 1:1000), anti-p53 (1C12, #2524, 1:1000), anti-PARP (46D11, 9532, 1:1000), anti-cl-Caspase 3 (5A1E, #9664, 1:1000), anti-cl-Caspase8 (D5B2, #8592, 1:1000), anti-JAK1 (6G4, #3344, 1:1000), anti-JAK2 (D2E12, 3230, 1:1000), anti-JAK3 (D7B12, #8863, 1:1000), anti-Bcl2 (D17C4, #3498, 1:1000), anti-Bcl-xL (54H6, #2764, 1:1000), anti-Bak (D4E4, #12105, 1:1000), anti-c-Cbl (D4E10, #2747, 1:1000), ant-HA-tag (6E2, #2367, 1:1000), mouse-anti-DDK (9A3, #8146, 1:1000), rabbit-anti-DDK (D6W5B, #14793, 1:1000), mouse-anti-Myc-tag (9B11, #2276, 1:1000), rabbit-anti-Myc-tag (71D10, #2278, 1:1000), mouse-IgG (G3A1, #5415), and normal rabbit-IgG (#2729) were from Cell Signaling Technology. Anti-p21 (clone SX118, Catalog No. 556430, 1: 1000) was from BD Biosciences. Anti-HA (3F10, Catalog No. 11867423001, 1:1000) and anti-MDM2 (SMP14, Catalog No. M4308, 1:1000) were from Millipore Sigma. HRP horse anti-mouse IgG antibody (PI-2000-1, 1:5000), HRP goat anti-rabbit IgG (PI-1000-1, 1:5000), and HRP goat anti-rat IgG (PI-9400-1, 1:5000) were from Vector Laboratories. For the in vivo experiments, anti-mouse CD8 (clone YTS 169.4, Catalog No. BE0117), anti-mouse CD4 (clone GK 1.5, Catalog No. BE0003-1), anti-mouse PD-L1 (clone 10F.9G2, Catalog No. BE0101), and anti-IgG2b (clone LTF-2, Catalog No. BE0090) were from BioXcell. MG132 (M7449) and STAT5 inhibitor (573108) were purchased from Sigma-Aldrich. Pifithrin-α hydrobromide (PFT α) (sc-45050) was from Santa Cruz Biotechnology. APG115 was from Dr. Shaomeng Wang (University of Michigan).
Myc-DDK-MDM2 (RC219518) and Myc-DDK-STAT5 (RC205753) were from OriGene Technologies, Myc-MDM2 and DDK-STAT5 were generated by PCR from Myc-DDK-MDM2 and Myc-DDK-STAT5. pBABE-STAT5a1*6 (STAT5CA) (#130668), pBABE GFP (#10668), MSCV-MDM2-IRES-GFP (#66954), and MSCV P2Gm p53 (#19751) retroviral constructs were from Addgene. c-Cbl (MMLV-c-Cbl-IRES-GFP) retroviral constructs were from VectorBuilder. STAT5CA (constitutively active stat5) was inserted into a pBABE GFP Vector. Retroviruses were produced by the Vector Core at the University of Michigan. Transfected T cells were gated and sorted with GFP expression (FACS Aria, BD Biosciences).
HA-MDM2 was obtained from Dr. Wenyi Wei (Harvard Medical School). His-Ubiquitin and His-Ubiquitin K48R were from Dr. Yi Sun (University of Michigan Medical School). HA-c-Cbl was from Dr. Fang Hua (Chinese Academy of Medical Sciences and Peking Union Medical College). All constructs were validated by DNA sequencing.
Plasmids expressing short hairpin RNAs (shRNA) targeting Mdm2 (TRCN0000355728, TRCN0000003377, and TRCN0000003380) and c-Cbl (TRCN0000295905 and TRCN0000039727) were from Sigma-Aldrich. 6FAM-labeled siRNA duplexes targeted to Stat5 (siRNA 1, 5’-CACCUUCAGAUCAACCAAA-3’; siRNA 2, 5’-AGCUGAAUGUGCACAUGAA-3’; siRNA 3, 5’-CGCUCAACAUGAAAUUCAA-3’) and 6FAM-labeled siRNA duplexes targeted to c-Cbl (siRNA 1, 5’-GAUCUGACCUGCAAUGAUU-3’; siRNA 2, 5’-GGCGAAACCUGACCAAAUU-3’) were from Sigma-Aldrich.
Cell culture
LS 174T, 293T, B16-F10, CT26, and 4T1 cells were purchased from the American Type Culture Collection (ATCC). MC38 mouse colon cancer cell line29, ovarian cancer cell line luciferase-ID830 and OVA-expressing B16 mouse melanoma cells30 were previously reported. All cell lines were tested for mycoplasma contamination by MycoAlert™ Mycoplasma detection kit and confirmed negative for mycoplasma.
Human CD3+ and CD8+ T cells were isolated from peripheral blood mononuclear cells using the EasySep human CD3+ and CD8+ T cell Isolation Kit (Stemcell Technologies), and then stimulated with immobilized anti-CD3 (clone HIT3α, BD Biosciences) and anti-CD28 (clone CD28.2, BD Biosciences) antibody for indicated times. Mouse CD3+ and CD8+ T cells were isolated from spleen and lymph nodes using EasySep mouse CD3+ and CD8+ T Cell Isolation Kit (Stemcell Technologies), and then stimulated with anti-CD3 (clone 145-2C11, BD Biosciences) and anti-CD28 (clone 37.51, BD Biosciences) antibodies for the indicated times. OT-I cells were activated with OVA257-264 peptides (Sigma-Aldrich) in the presence of 10 ng/ml IL-2 (R&D Systems) or cultured with B16-OVA tumor cells at a ratio 4:1. All cells were cultured at 37°C in a humidified atmosphere containing 5% CO2.
Generation of genetically modified cell lines
293T cells were transfected with packaging plasmids and non-targeted lentivirus vector, or a lentivirus vector encoding shRNA targeting Mdm2 and c-Cbl. The virus containing supernatant was harvested 72 hours after transfection. LS 174T cells and Jurkat T cells were transfected with the lentivirus for 96 hours. Then, the cell lysates were analyzed by immunoblotting.
For overexpression, the cells were transfected with indicated plasmids by Lipofectamine 2000 reagent (Invitrogen) according to the instructions. 48 hours after transfection, the cell lysates were analyzed by immunoblotting.
For knockdown, the 6FAM labeled siRNA transfection method was used. Activated T cells were transfected in Nucleofector device using mouse T cell Nucleofector kit (VPA-1006, Lonza) according to the manufacturer instructions. Transfected cells were enriched and sorted based on 6FAM fluorescence (FACS Aria, BD Biosciences). For retronectin-mediated transduction, the virus-containing supernatants were loaded by centrifugation (2000 g, 2 hours at 32°C) onto 12-well plates pre-coated with RetroNectin (T100B, Takara). Activated T cells were transduced by centrifugation at 1000 g for 30 minutes at 32°C. Transfection was repeated after 24-hours incubation at 37°C in a humidified atmosphere containing 5% CO2. Transfected GFP+ T cells were sorted by flow cytometry sorter (FACS Aria, BD Biosciences).
Immunoblots and immunoprecipitation
Cells were lysed in RIPA buffer (Thermo Fisher Scientific) supplemented with Halt protease and phosphatase inhibitors cocktail (Thermo Fisher Scientific). The protein concentrations of cell lysates were determined by BCA protein assay kit (Thermo Fisher Scientific). Equivalent amounts of total cellular protein were separated by SDS-PAGE, transferred to PVDF membranes and immunoblotted with indicated antibodies. The western blot band intensity analysis was done by ImageJ (NIH, ImageJ).
The epitope-tagged construct was transiently transfected into cells. Cells were lysed in IP lysis buffer (50 mM Tris-HCl pH 7.5, 120 mM NaCl, 1 mM EDTA, 0.5% NP-40) and supplemented with Halt protease and phosphatase inhibitors cocktail (Thermo Fisher Scientific). Cells were repeatedly passed through a 21-gauge needle and sonication. 1,000 μg total cell lysates were incubated with the appropriate antibody (2 μg) with rotation overnight at 4°C, followed by a 3-hour incubation with protein A/G Sepharose beads (Santa Cruz Biotechnology). Immuno-complexes were washed three times with wash buffer (20 mM Tris-HCl pH 7.5, 100 mM NaCl, 1 mM EDTA, 0.5% NP-40); then, the immunoprecipitated proteins were denatured by the addition of sample buffer (BIO-RAD) and boiled for 10 minutes, resolved by SDS-PAGE, and immunoblotted with indicated antibodies.
Ubiquitination assays
293T cells were transfected with His-Ub and the indicated constructs. 36 hours after transfection, cells were treated with 10 μM MG132 for 2 hours and lysed in buffer A (6 M guanidine-HCl, 0.1 M Na2HPO4/NaH2PO4, 10 mM imidazole pH 8.0). After sonication, the lysates were incubated with Ni-NTA beads (QIAGEN) at room temperature for 4 hours. Subsequently, the His pull-down products were washed twice with buffer A, twice with buffer A/TI (1 volume buffer A and 3 volumes buffer TI), and once with buffer TI (25 mM Tris-HCl and 20 mM imidazole pH 6.8). The pull-down proteins were boiled and resolved by SDS-PAGE for immunoblotting.
Quantitative PCR analysis RNA Experiment
Total RNA was isolated from cells by column purification (Direc-zol RNA Miniprep Kit, Zymo Research) with DNase treatment. cDNA was synthesized using High-Capacity cDNA Reverse Transcription Kit (Thermo Fisher Scientific) with poly-dT or random hexamer primers. Quantitative PCR (qPCR) was performed on cDNA using Fast SYBR Green Master Mix (Thermo Fisher Scientific) on a QuantStudio 3 Real-Time PCR System (Thermo Fisher Scientific). Gene expression was quantified using the following primers: mouse Stat5α Forward: CCTGTTTGAGTCTCAGTTCAGCG, mouse Stat5α reverse: TGGCAGTAGCATTGTGGTCCTG; mouse Stat5β Forward: CACAGTTCAGCGTCGGTGGAAA, mouse Stat5β reverse: CTGTGGCATTGTTGTCCTGGCT; mouse ACTB Forward: CATTGCTGACAGGATGCAGAAGG, mouse ACTB reverse: TGCTGGAA GGTGGACAGTGAGG (OriGene Technologies). Fold changes in mRNA expression were calculated by the ΔΔCt method using ACTB as an endogenous control. Results are expressed as fold change by normalizing to the controls.
In vivo mouse experiments
Animal studies were approved by the Institutional Animal Care and Use Committee at the University of Michigan. All mice were maintained under SPF housing (Temperatures of ~22°C with ~40% humidity) on a 12 h dark/light cycle. Six to eight week old female C57BL/6J (Jackson laboratory), BALB/cJ (Jackson laboratory), NOD-scid IL2Rgnull (NSG) mice (Jackson laboratory), C57BL/6-Tg (TcraTcrb) 1100Mjb/J (OT-I) mice (Jackson laboratory), CD45.1+CD45.2+ OT-I mice bred internally by crossing CD45.2+ OT-I mice and CD45.1+ C57BL/6 mice, B6.129P2-Trp53tm1Brn/J (p53flox/flox) mice (Jackson laboratory), and Mdm2flox/flox mice31 were used for this study. Mdm2flox/flox mice were crossed with Cd4-Cre mice to obtain specific Mdm2 deficiency in T cells (Mdm2fl/flCd4-Cre mice). p53flox/flox mice were crossed with Cd4-Cre mice to obtain specific p53 deficiency in T cells (p53fl/flCd4-Cre mice).
ID8 luciferase cells (2 × 10⁶) were injected into the peritoneal cavity of age-and sex-matched Mdm2+/+Cd4-Cre or Mdm2fl/flCd4-Cre mice (6 - 8 weeks). Tumor progression was monitored by Xenogen IVIS Spectrum in vivo bioluminescence imaging system. MC38 (2 × 10⁶) cells were inoculated subcutaneously into age-and sex-matched Mdm2+/+Cd4-Cre or Mdm2fl/flCd4-Cre mice (6 - 8 weeks). Tumor size was measured every three days using calipers fitted with Vernier scale. Tumor volume was calculated based on the formula (length x width x width/2) as previously described32.
APG11520 was used to target the MDM2 and p53 interaction in the in vivo experiment. MC38 (2 × 10⁶), CT26 (105), B16F10 (105) cells, and 4T1 cells (5 ×10⁴) were injected subcutaneously into 6-8-week-old C57BL/6J female mice, BALB/cJ, or NSG mice (Jackson laboratory). On day 5, APG115 was administered orally at 10 mg/kg or 30 mg/kg every two days. Subsequently, tumors were collected and analyzed by FACS or immunoblotting. For the ID8 tumor model, 2 × 10⁶ luciferase expressing ID8 cells were injected into the peritoneal cavity of each female mouse. Starting on day 8, 30 mg/kg APG115 was administered orally every two days. Age-and sex-matched Mdm2+/+Cd4-Cre, Mdm2fl/flCd4-Cre, p53+/+Cd4-Cre, p53fl/flCd4-Cre mice (6 - 8 weeks) were subcutaneously injected with MC38 (2 × 10⁶). Starting on day 5, 10 mg/kg or 30 mg/kg APG115 was administered orally every two days.
For the immunotherapy experiments, we treated tumor bearing mice with anti-PD-L1 or IgG (i.p. 150 μg per mouse) on day 6, then repeated every 3 days. For CD4+ and CD8+ T cell depletion experiments, we treated tumor bearing mice with 200 μg anti-CD4 mAb, 200 μg anti-CD8 mAb, or IgG (i.p) every three days. For adoptive cell T cell transfusion experiments, we intravenously transferred activated OT-I cells (4 × 10⁶) into OVA-expressing tumor-bearing mice.
Flow cytometry analysis
Single-cell suspensions were prepared from fresh mouse tumor tissues or spleen, and lymphocytes were enriched by density gradient centrifugation. For intracellular cytokine and granzyme B staining, lymphocytes were incubated in culture medium containing PMA (phorbol 12-myristate-13-acetate, 5 ng/ml, Sigma Aldrich), Ionomycin (500 ng/ml, Sigma Aldrich), Brefeldin A (1: 1000, BD Biosciences). and Monensin (1: 1000, BD Biosciences) at 37°C for 4 hours. Antibodies (0.6 μg) were added for 20 minutes for surface staining. The cells were then washed and resuspended in 1 ml of freshly prepared Fix/Perm solution (BD Biosciences) at 4°C for overnight. After being washed with Perm/Wash buffer (BD Biosciences), the cells were stained with 0.6 μg antibodies against intracellular proteins for 30 minutes, washed, and fixed in 4% formaldehyde (Sigma Aldrich). For apoptosis detection, lymphocytes were stained with Anti-CD45 (30-F11), anti-CD90 (53-2.1), anti-CD3 (145-2C11), anti-CD4 (RM4-5) and anti-CD8 (53-6.7), washed and resuspended in 100 μl 1 × binding buffer, Annexin V and 7-AAD staining solution was added for 20 minutes at room temperature in the dark, and then cells were analyzed by flow cytometry. All flow samples were acquired through Fortessa (BD). Data were analyzed with DIVA software (BD Biosciences). Side-scatter and forward-scatter profiles were used to eliminate cell doublets.
Bioinformatics Analysis
Single-cell RNA-seq counts were obtained from GEO database with the accession number of GSE7205617. The “SAVER”33 package was used to perform the expression recovery with the counts data. Gene expression estimates output from SAVER was used for downstream analysis. Cells were grouped by the average expression level of Mdm2. Gene sets for heatmap presentation and GSEA were obtained from MSigDB34 and Reactome database. Heatmap visualization was performed by an R package of GENE-E. Gene Set Enrichment Analysis (GSEA)34 was used to determine whether the related gene sets were statistically enriched in Mdm2 high or low groups with the SAVER recovered values and gene sets downloaded from the two databases mentioned above. Gene set enrichment P, NES, and FDR values were calculated with 1,000 permutations in the GSEA software and ran in Signal2Noise mode.
Statistical Analysis
Data were shown as mean ± SEM. Statistical analysis was performed using Mann-Whitney test to compare 2 independent experimental groups, one-way ANOVA test to compare 3 groups or more, and two-way ANOVA test to compare tumor growth curves. For all tests, p < 0.05 was considered significant. Analyses were carried out with GraphPad Prism software.
Further information on research design is available in the Nature Research Reporting Summary linked to this article.
Statistics and reproducibility
Figure 1 a–b, n = 5 biologically independent experiments. The experiments were performed 5 repeats with similar results. Figure 1c, n = 9 biologically independent mice, ***p = 0.0007 by two-way ANOVA. Figure 1e, n = 9 biologically independent samples, **p = 0.0056 by unpaired two-tailed Mann-Whitney test. Figure 1g, n = 9 biologically independent samples, *p = 0.04, unpaired two-tailed Mann-Whitney test. Figure 1i, n = 5 biologically independent mice, ****p < 0.0001, two-way ANOVA. Figure 1j, n = 4 biologically independent samples, *p = 0.0286, unpaired two-tailed Mann-Whitney test. Figure 1l, n = 5 biologically independent samples, **p=0.0079, unpaired two-tailed Mann-Whitney test. Figure 1n, Mdm2+/+, n = 5 biologically independent samples; Mdm2−/−, n = 4 biologically independent samples. *p = 0.0159 by unpaired two-tailed Mann-Whitney test. Figure 1p, Mdm2+/+, n = 5 biologically independent samples; Mdm2−/−, n = 4 biologically independent samples, *p = 0.0159 by unpaired two-tailed Mann-Whitney test. Figure 1r, Mdm2+/+, n = 3 biologically independent samples; Mdm2−/−, n = 3 biologically independent samples. Figure 1s, n = 3 biologically independent samples, p53+/+ + EV vs. p53+/+ + MDM2OE, ***p = 0.0003, one-way ANOVA. p53−/− + EV vs. p53−/− + MDM2OE, **p = 0.0019 by one way ANOVA. Figure 1t, n = 4 biologically independent samples, *p = 0.0286, unpaired two-tailed Mann-Whitney test. Figure 1u, n = 6 biologically independent samples, ****p < 0.0001, one-way ANOVA. Figure 1w, n = 3 biologically independent samples, **p = 0.006, one-way ANOVA.
Figure 2a, n = 3 biologically independent experiments. The experiments were performed 3 repeats with similar results. Figure 2b–c, n = 3 biologically independent experiments. The experiments were performed 3 repeats with similar results. ****p < 0.0001, one-way ANOVA. Figure 2d–e, n = 3 biologically independent experiments, *p = 0.0432, one-way ANOVA. Figure 2f, n = 3 biologically independent samples. Figure 2g–h, n = 5 biologically independent samples, **p = 0.0079, unpaired two-tailed Mann-Whitney test.
Figure 3a–e, n = 3 biologically independent experiments. The experiments were performed 3 repeats with similar results. Figure 3f, n = 4 biologically independent samples, ****p < 0.0001, one-way ANOVA.
Figure 3g, n = 3 biologically independent experiments. The experiments were performed 3 repeats with similar results. Figure 3h, n = 4 biologically independent samples. Figure 3i–k, n = 3 biologically independent experiments. The experiments were performed 3 repeats with similar results.
Figure 4a–b, n = 3 biologically independent experiments. The experiments were performed 3 repeats with similar results. Figure 4c, n = 8 biologically independent mice, **p = 0.0014, two-way ANOVA. Figure 4d, n = 8 biologically independent samples, *p = 0.0281, unpaired two-tailed Mann-Whitney test. Figure 4e, n = 6 biologically independent mice, **p = 0.0062, two-way ANOVA. Figure 4f, Vehicle, n=10 biologically independent mice; APG115, n = 9 biologically independent mice, ****p < 0.0001, two-way ANOVA. Figure 4h, n = 7 biologically independent mice, **p = 0.0053, two-way ANOVA. Figure 4i, n = 5 biologically independent mice, ****p < 0.0001, two-way ANOVA. Figure 4j, n = 7 biologically independent mice, *p = 0.0106, two-way ANOVA.
Figure 5a, NSG + Vehicle, n = 9 biologically independent animals; NSG + APG115, n = 11 biologically independent animals; WT + Vehicle, n = 7 biologically independent animals; WT + APG115, n = 7 biologically independent animals. NSG + Vehicle vs. WT + Vehicle, ***p = 0.0008, two-way ANOVA. Figure 5b, n = 8 biologically independent mice, *p = 0.0424, two-way ANOVA. Figure 5c, n = 7 biologically independent samples, **p = 0.0012, unpaired two-tailed Mann-Whitney test. Figure 5e, n = 7 biologically independent samples, **p = 0.0017, unpaired two-tailed Mann-Whitney test. Figure 5g, n = 6 biologically independent samples, *p = 0.0433, unpaired two-tailed Mann-Whitney test. Figure 5i, n = 6 biologically independent samples, **p = 0.0022, unpaired two-tailed Mann-Whitney test. Figure 5k, n = 5 biologically independent samples, *p = 0.0159, unpaired two-tailed Mann-Whitney test. Figure 5l, n = 5 biologically independent samples, *p = 0.0317, unpaired two-tailed Mann-Whitney test. Figure 5m, n = 5 biologically independent samples, **p = 0.0079, unpaired two-tailed Mann-Whitney test. Figure 5n, n = 6 biologically independent mice, **p = 0.0079, two-way ANOVA. Figure 5o, n = 6 biologically independent samples, *p = 0.0278, one-way ANOVA.
Figure 6a–b, n = 3 biologically independent experiments. The experiments were performed 3 repeats with similar results. Figure 6c, n = 6 biologically independent samples. The experiments were performed 6 repeats with similar results. Figure 6d, n = 4 biologically independent samples. The experiments were performed 4 repeats with similar results. Figure 6e, n = 7 biologically independent mice. Vehicle vs. Vehicle + OT-I, ****p < 0.0001; Vehicle vs. APG115, ****p < 0.0001; Vehicle + OT-I vs. APG115 + OT-I, *p = 0.033; APG115 vs. APG115 + OT-I, ***p = 0.0001, two-way ANOVA. Figure 6f, n = 6 biologically independent mice, Control vs. EV OT-I Vehicle, ***p = 0.0002; EV OT-I Vehicle vs. EV OT-I APG115, **p = 0.0072, two-way ANOVA. Figure 6g, EV + Vehicle, n = 5 biologically independent samples; EV + APG115, n = 6 biologically independent samples; STAT5CA + Vehicle, n = 6 biologically independent samples; STAT5CA + APG115, n = 5 biologically independent samples. EV + Vehicle vs. EV + APG115, ****p < 0.0001; EV + Vehicle vs. STAT5CA + Vehicle, ****p < 0.0001; one-way ANOVA. Figure 6 i, n = 6 biologically independent samples, **p = 0.0016, one-way ANOVA. Figure 6k, n = 6 biologically independent mice, *p = 0.0403, two-way ANOVA. Figure 6l, n = 6 biologically independent mice, *p = 0.043, two-way ANOVA. Figure 6m, siCTRL Vehicle, n = 6 biologically independent samples; siCTRL APG115, n = 6 biologically independent samples; siStat5 Vehicle, n = 5 biologically independent samples; siStat5 APG115, n = 5 biologically independent samples; siCTRL Vehicle vs. siCTRL APG115, **p = 0.0015, one-way ANOVA. Figure 6n, n = 7 biologically independent mice. IgG + Vehicle vs. IgG + APG115, *p = 0.0144; anti-PD-L1 + Vehicle vs. anti-PD-L1 + APG115, *p = 0.024; IgG + APG115 vs. anti-PD-L1 + APG115, ***p = 0.0008. two-way ANOVA. Figure 6o, n = 7 biologically independent samples, *p = 0.0214, one-way ANOVA. Figure 6p, IgG + Vehicle, n = 5 biologically independent samples; IgG +APG115, n = 6 biologically independent samples; Anti-PD-L1 + Vehicle, n = 6 biologically independent samples; Anti-PD-L1 + APG115, n = 6 biologically independent samples. IgG + Vehicle vs. IgG + APG115, **p = 0.0024; anti-PD-L1 + Vehicle vs. anti-PD-L1 + APG115, *p = 0.0158. one-way ANOVA. Figure 6r, n = 3 biologically independent samples, *p = 0.0117, one-way ANOVA. Figure 6s, n = 4 biologically independent samples, **p = 0.0083, one-way ANOVA.
Extended Data Figure 1a, n = 5 biologically independent samples, 0 h vs. 12 h, *p = 0.0186; 0 h vs. 24 h, **p = 0.001; 0 h vs 48 h, ****p<0.0001. one-way ANOVA. Extended Data Figure 1b, n = 5 biologically independent samples, 0 h vs 9 h, **p = 0.0029; 0 h vs. 12 h, ****p < 0.0001; 0 h vs. 24 h, ****p < 0.0001; 0 h vs.48 h, ****p < 0.0001. one-way ANOVA. Extended Data Figure 1c–d, n = 6 biologically independent samples, **p = 0.0022, unpaired two-tailed Mann-Whitney test. Extended Data Figure 1k, n = 5 biologically independent samples, **p = 0.0079, unpaired two-tailed Mann-Whitney test. Extended Data Figure 1m, n = 4 biologically independent samples, *p = 0.0286, unpaired two-tailed Mann-Whitney test. Extended Data Figure 1n, n = 4 biologically independent samples, *p = 0.0286, unpaired two-tailed Mann-Whitney test. Extended Data Figure 1o, n= 4 biologically independent samples, *p = 0.0286, unpaired two-tailed Mann-Whitney test. Extended Data Figure 1p, n = 4 biologically independent samples, *p = 0.0286, unpaired two-tailed Mann-Whitney test. Extended Data Figure 1q, n = 4 biologically independent samples, *p =0.0286, unpaired two-tailed Mann-Whitney test. Extended Data Figure 1r, n = 5 biologically independent samples, **p = 0.0079, unpaired two-tailed Mann-Whitney test. Extended Data Figure 1s, Mdm2+/+, n = 5 biologically independent samples; Mdm2−/−, n = 4 biologically independent samples; *p = 0.0159, unpaired two-tailed Mann-Whitney test.
Extended Data Figure 2a, n = 3 biologically independent experiments, ****p < 0.0001, one-way ANOVA.
Extended Data Figure 2b, n = 3 biologically independent experiments, ****p < 0.0001, one-way ANOVA.
Extended Data Figure 2c, n = 3 biologically independent experiments. Extended Data Figure 2d, n = 3 biologically independent experiments. Extended Data Figure 2e, n = 3 biologically independent experiments. Extended Data Figure 2f, n = 3 biologically independent experiments. Extended Data Figure 2g, n = 3 biologically independent experiments. Extended Data Figure 2i, n = 5 biologically independent samples. Extended Data Figure 2j, n = 5 biologically independent samples.
Extended Data Figure 3a–b, n = 5 biologically independent experiments. **p = 0.0079, unpaired two-tailed Mann-Whitney test. Extended Data Figure 3c, n = 3 biologically independent experiments, shCTRL vs. shCTRL+MG132, ***p = 0.0001; shCTRL vs. shMdm2, *p = 0.0138, one-way ANOVA. Extended Data Figure 3d, n = 3 biologically independent experiments, shCTRL vs. shc-Cbl#1, **p = 0.0022. one-way ANOVA. Extended Data Figure 3e, n = 3 biologically independent experiments, shCTRL vs. shc-Cbl#1, ****p < 0.0001, one-way ANOVA. Extended Data Figure 3f, n = 3 biologically independent experiments, shCTRL vs. shc-Cbl#1, **p = 0.0018; shCTRL vs. shc-Cbl#2, ***p = 0.0004. one-way ANOVA. Extended Data Figure 3g, n = 3 biologically independent experiments, shCTRL vs. shc-Cbl#1, *p = 0.0415, shCTRL vs. shc-Cbl#2, *p = 0.0112, one-way ANOVA. Extended Data Figure 3h, n = 3 biologically independent experiments. Extended Data Figure 3i, n = 3 biologically independent experiments. Extended Data Figure 3j, n = 3 biologically independent samples. Mdm2+/+ + siCTRL vs. Mdm2−/− + siCTRL, **p = 0.0052; Mdm2−/− + siCTRL vs. Mdm2−/− + sic-Cbl, ***p = 0.0002. one-way ANOVA. Extended Data Figure 3k, n = 3 biologically independent samples. shCTRL+ siCTRL vs. shMdm2 + siCTRL, ***p = 0.0002; shMdm2+ siCTRL vs. shMdm2 + sic-Cbl, ****p < 0.0001. one-way ANOVA. Extended Data Figure 3l, n = 3 biologically independent experiments. Extended Data Figure 3m–n, n = 3 biologically independent experiments. Extended Data Figure 3o, n = 4 biologically independent samples, *p = 0.0286, unpaired two-tailed Mann-Whitney test. Extended Data Figure 3p, n = 4 biologically independent samples. Extended Data Figure 3q, n = 3 biologically independent experiments, Control vs. HA-MDM2, *p = 0.0321; Control vs. shc-Cbl, **p = 0.0014. one-way ANOVA.
Extended Data Figure 4b, n = 3 biologically independent experiments, 0 vs. 1, **p = 0.0015; 0 vs. 5, ***p = 0.0006; 0 vs. 10, **p = 0.0015, one-way ANOVA. Extended Data Figure 4c, n = 3 biologically independent experiments, 0 vs. 5, *p = 0.0106; 0 vs. 10, **p = 0.0026. one-way ANOVA. Extended Data Figure 4d, n = 3 biologically independent experiments, 0 vs. 1, **p = 0.0034; 0 vs. 5, ***p = 0.0005. one-way ANOVA. Extended Data Figure 4e, n = 3 biologically independent experiments, 0 vs 1, *p = 0.0194; 0 vs. 5, ***p = 0.0002. one-way ANOVA. Extended Data Figure 4f–j, the experiments were performed 3 repeats with similar results. Extended Data Figure 4k, n = 4 biologically independent samples.
Extended Data Figure 5a–b, Vehicle, n = 9 biologically independent samples; APG115, n = 11 biologically independent samples. Extended Data Figure 5c, n = 6 biologically independent mice. ****p < 0.0001, two-way ANOVA. Extended Data Figure 5e, n = 5 biologically independent samples, *p = 0.0476, unpaired two-tailed Mann-Whitney test. Extended Data Figure 5f, n = 5 biologically independent samples, **p = 0.0079, unpaired two-tailed Mann-Whitney test. Extended Data Figure 5g, Mdm2+/+ + Vehicle, n = 6 biologically independent samples; Mdm2+/+ + APG115, n = 6 biologically independent samples; Mdm2−/− + Vehicle, n = 4 biologically independent samples; Mdm2−/− + APG115, n = 4 biologically independent samples. Mdm2+/+ + Vehicle vs. Mdm2+/+ + APG115, *p = 0.0153; Mdm2+/+ +Vehicle vs. Mdm2−/− + Vehicle, *p = 0.0244. one-way ANOVA.
Extended Data Figure 6a, n = 3 biologically independent experiments, Mdm2+/+ vs. Mdm2+/+ + APG115, **p = 0.0011; Mdm2+/+ vs. Mdm2−/−, *p = 0.0139. one-way ANOVA. Extended Data Figure 6b, n = 3 biologically independent experiments, ****p < 0.0001, one-way ANOVA. Extended Data Figure 6c, n = 3 biologically independent experiments, Mdm2+/+ vs. Mdm2+/+ + APG115, *p = 0.0498; Mdm2+/+ vs. Mdm2−/−, **p = 0.0033. one-way ANOVA. Extended Data Figure 6d, n = 6 biologically independent samples, ***p = 0.0003, one-way ANOVA. Extended Data Figure 6e, n = 4 biologically independent samples, *p = 0.0286, unpaired two-tailed Mann-Whitney test. Extended Data Figure 6f, n = 4 biologically independent samples, *p = 0.0286, unpaired two-tailed Mann-Whitney test. Extended Data Figure 6g, n = 4 biologically independent samples. *p = 0.0286, unpaired two-tailed Mann-Whitney test. Extended Data Figure 6h, n = 4 biologically independent samples, *p = 0.0286, unpaired two-tailed Mann-Whitney test. Extended Data Figure 6i, n = 4 biologically independent samples, Mdm2+/+ + EV + DMSO vs. Mdm2−/− + EV + DMSO, ****p < 0.0001; Mdm2+/+ + EV + DMSO vs. Mdm2+/+ + EV + APG115, *p = 0.0312; Mdm2+/+ + EV + APG115 vs. Mdm2−/− + EV + APG115, ****p < 0.0001. one-way ANOVA. Extended Data Figure 6j, n = 4 biologically independent samples, ***p = 0.0006, one-way ANOVA.
Extended Data
Extended Data Fig. 1. MDM2 controls CD8+ T cell-mediated anti-tumor immunity. Related to Fig. 1.
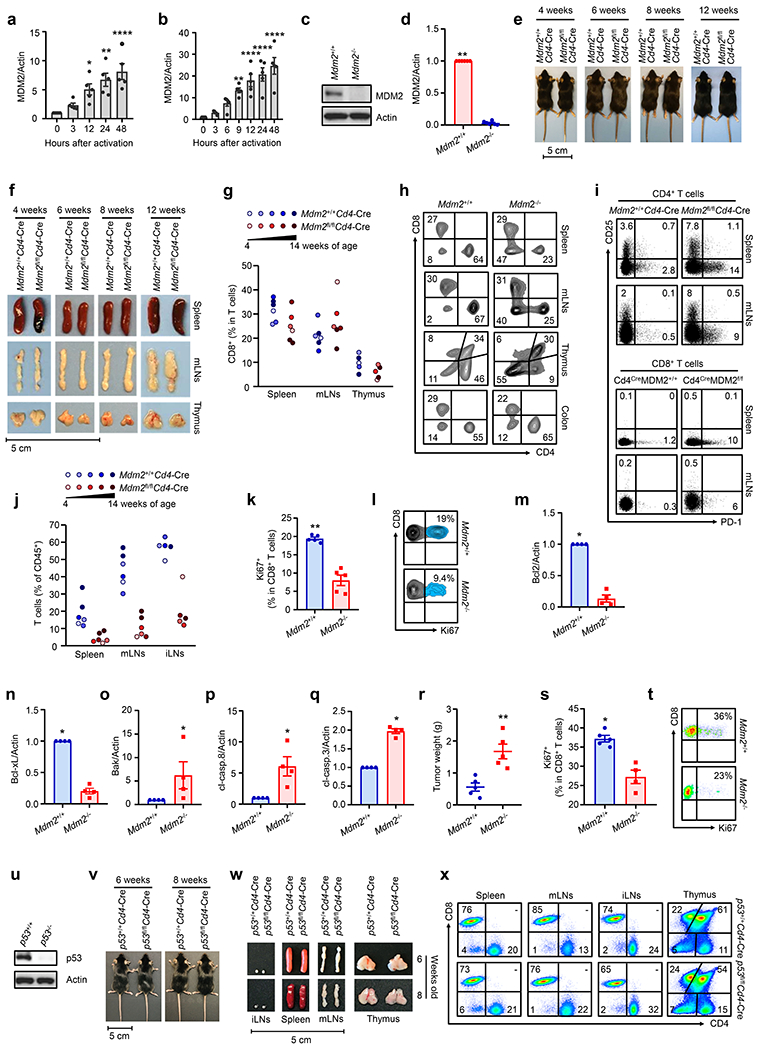
a-b, Effect of TCR-engagement on MDM2 in CD8+ T cells. Human (a) and mouse (b) CD8+ T cells were stimulated with anti-CD3 and anti-CD28 mAbs. Expression of MDM2 was determined by Western blotting. mean ± SEM, n = 5, *p < 0.05, **p < 0.01, ****p < 0.0001, one-way ANOVA.
c-d, Protein levels of MDM2 in T cells from Mdm2+/+Cd4-Cre and Mdm2fl/flCd4-Cre mice. Results are expressed as the relative mean density of MDM2 ± SEM, n = 6, **p < 0.01, Mann Whitney test.
e-j, Phenotype of Mdm2fl/flCd4-Cre mice. The representative images show the body size (e) and the lymphoid organs (f) of Mdm2+/+Cd4-Cre and Mdm2fl/flCd4-Cre mice. The percentages of CD8+ T cells in T cells (g), the representative images of flow dot plots (h), PD-1+ and CD25+ cells in T cell subsets (i) in different organs, and T cells in CD45+ immune cells (j) were analyzed by FACS.
k-l, Effect of MDM2 deficiency on T cell proliferation under the homeostatic stimulation. Mdm2+/+ and Mdm2−/− CD8+ T cells were cultured with IL-7 and IL-15 in response to PMA. Ki67 expression was analyzed by FACS. mean ± SEM, n = 5, **p < 0.05, Mann Whitney test.
m-q, Role of MDM2 deficiency in ID8 tumor infiltrating CD8+ T cells. The anti-apoptotic (Bcl2 and Bcl-xL) and pro-apoptotic (Bak, cl-caspase 8, and cl-caspase 3) proteins were detected in tumor infiltrating CD8+ T cells by Western blotting. Results are expressed as the relative mean density of specific proteins ± SEM, n = 4, *p < 0.05, Mann Whitney test.
r-t, Effect of MDM2 deficiency on MC38 tumor progression and T cell proliferation. MC38 tumors were inoculated into Mdm2+/+Cd4-Cre and Mdm2fl/flCd4-Cre mice. Tumor weight was measured on day 21 (r). The percentages of Ki67+ cells in tumor infiltrating CD8+ T cells were analyzed by FACS (s-t). mean ± SEM, n = 4 – 5, *p < 0.05, **p < 0.01, Mann Whitney test.
u. Protein levels of p53 in T cells isolated from p53+/+Cd4-Cre and p53fl/flCd4-Cre mice. One of 6 experiments is shown
v-w, Phenotype of p53fl/flCd4-Cre mice. The representative images show the body size (v) and lymphoid organs (w) of p53+/+Cd4-Cre and p53fl/flCd4-Cre mice.
x, T cell subset distribution in p53+/+Cd4-Cre and p53fl/flCd4-Cre mice. One of 3 representative dot-plots is shown.
Extended Data Fig. 2. MDM2 regulates STAT5 protein expression in T cells. Related to Fig. 2.
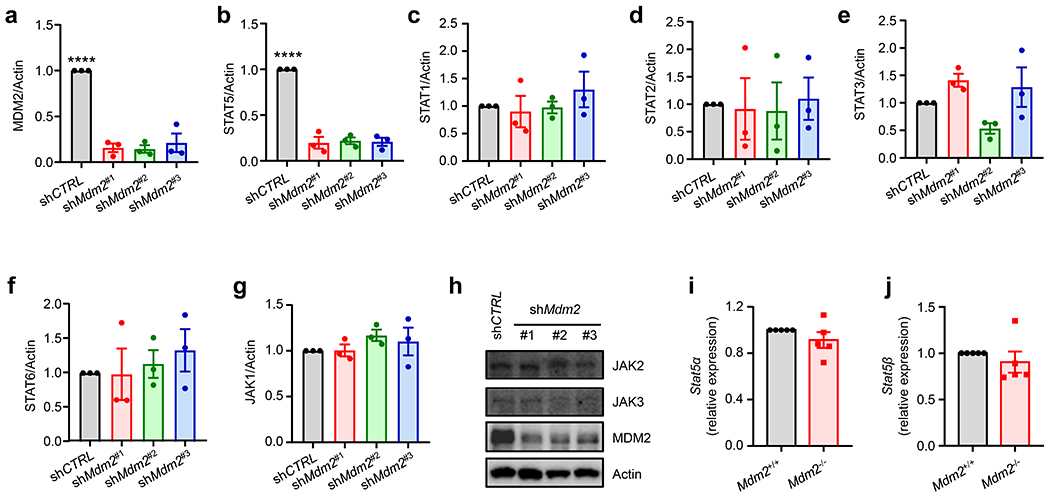
a-h, Effect of MDM2 knockdown on MDM2, STAT, and JAK expression. LS 174T cells were transfected with 3 different shRNAs against Mdm2 or control. The relevant proteins were detected by immunoblots. Results are expressed as the relative mean density of specific protein ± SEM, n = 3, ****p < 0.0001, one-way ANOVA.
i-j, Effect of Mdm2 deficiency on Stat5 transcripts. Real time PCR showed Stat5α and Stat5β mRNAs in Mdm2+/+ and Mdm2−/− T cells. Five biological replicates.
Extended Data Fig. 3. MDM2 prevents c-Cbl-mediated STAT5 degradation. Related to Fig. 3.
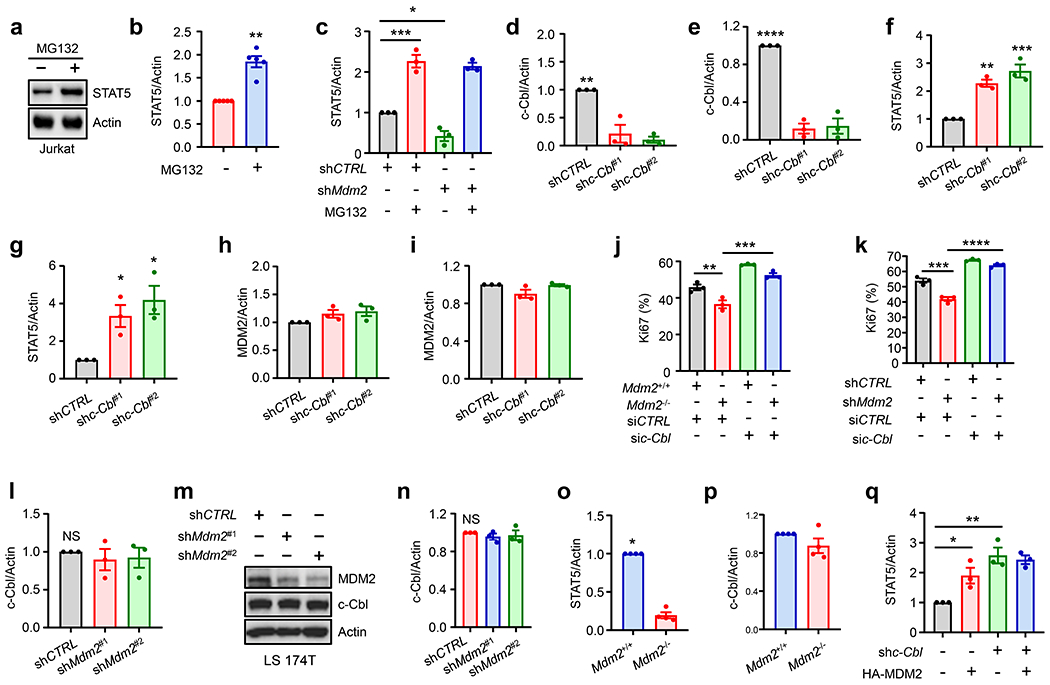
a-b, Immunoblots showed STAT5 in Jurkat T cells in the presence of MG132. mean ± SEM, n = 5, **p < 0.01, Mann Whitney test.
c, Effect of MDM2 on STAT5 protein expression. Wild-type and shMdm2-LS 174T cells were treated with or without MG132. STAT5 levels were measured by Western blotting. Results are expressed as the relative mean density of STAT5 ± SEM, n = 3, *p < 0.05, ***p < 0.001, one way-ANOVA.
d-i, Effect of c-Cbl on STAT5 and MDM2 expression. LS 174T and Jurkat T cells were transfected with 2 shRNAs against c-Cbl or control. c-Cbl (d-e), STAT5 (f-g), and MDM2 (h-i) expression was detected by Western blotting. Results are expressed as the relative mean density of specific protein ± SEM, n = 3, *p < 0.05, **p < 0.01, ***p < 0.001, ****p < 0.0001, one-way ANOVA.
j-k, Effect of c-Cbl and MDM2 on T cell proliferation. Activated mouse Mdm2−/− CD8+ T cells (j) and shMdm2-Jurkat T (k) cells were transfected with si-c-Cbl. Ki67 expression was determined by FACS. mean ± SEM, n = 3, **p < 0.01, ***p < 0.001, ****p < 0.0001, one-way ANOVA.
l-n, Effect of MDM2 on c-Cbl expression in Jurkat T and LS 174T cells. Jurkat T and LS 174T cells were transfected with shRNAs against Mdm2 or control. Immunoblots showed c-Cbl expression. Results are expressed as the relative mean density of c-Cbl ± SEM, n = 3, NS, not significant.
o-p, Role of MDM2 deficiency in mouse T cells. CD3+ T cells were isolated from Mdm2+/+Cd4-Cre and Mdm2fl/flCd4-Cre mice. STAT5 (o) and c-Cbl (p) expression were determined by Western blotting. Results are expressed as the relative mean density of specific protein ± SEM, n = 4, *p < 0.05, Mann Whitney test.
q, Role of MDM2 in STAT5 expression. c-Cbl+/+ and c-Cbl−/− LS 174T cells were transfected with HA-MDM2 and empty vector. STAT5 levels were determined by Western blotting. Results are expressed as the relative mean density of STAT5 ± SEM, n = 3, *p < 0.05, **p < 0.01, one-way ANOVA.
Extended Data Fig. 4. Targeting p53-MDM2 interaction elicits tumor p53 independent anti-tumor activity. Related to Fig. 4.
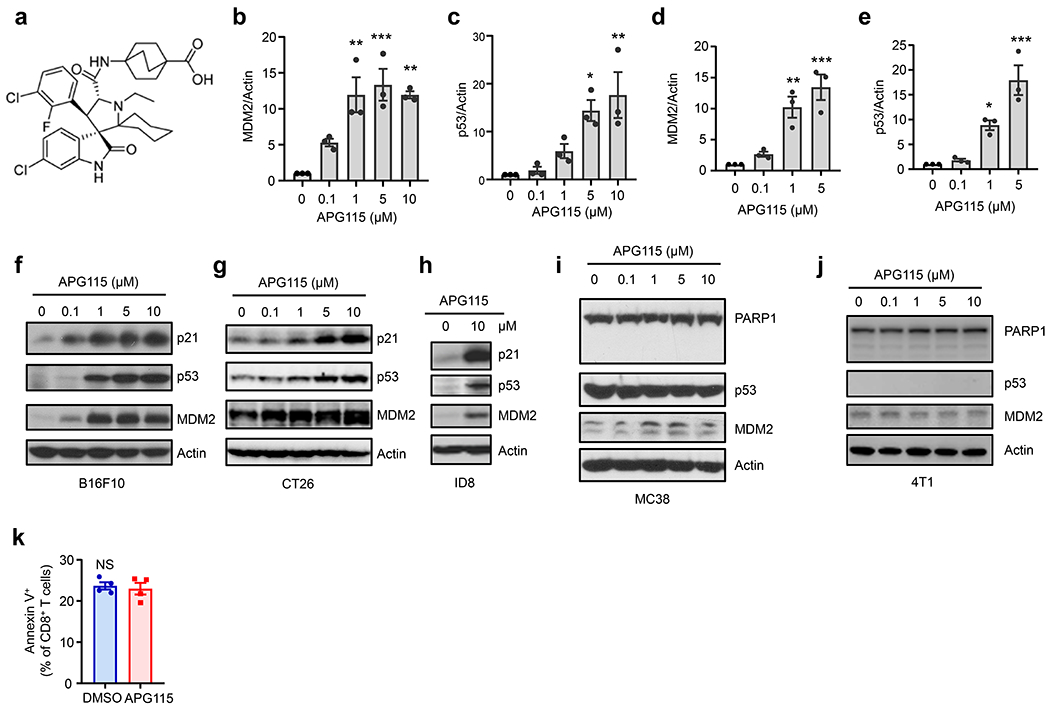
a, APG115 structure is shown.
b-e, Effect of APG115 on MDM2 and p53 expression in T cells. Human (b-c) and mouse (d-e) T cells were stimulated with anti-CD3 and anti-CD28 mAbs in the presence of different concentrations of APG115. MDM2 (b, d) and p53 (c, e) expression was determined by Western blotting. Results are expressed as the relative mean density of MDM2 and p53 ± SEM, n = 3, *p < 0.05, **p < 0.01, ***p < 0.001, one-way ANOVA.
f-h, Effect of APG115 on p53 wild-type tumor cells. B16F10 (f), CT26 (g) and ID8 (h) cells were treated with different concentrations of APG115. Immunoblots showed MDM2, p53, and p21 expression.
i, Effect of APG115 on p53 mutant tumor cells. MC38 cells were treated with different concentrations of APG115. Immunoblots showed PARP1, p53, and MDM2 expression.
j, Effect of APG115 on p53-null 4T1 tumor cells. 4T1 tumor cells were treated with different concentrations of APG115. Immunoblots showed PARP1, p53, and MDM2 expression.
k, Effect of APG115 on p53−/−CD8+ T cell survival. p53−/−CD8+ T cells were treated with APG115. Annexin V+ expression was analyzed by FACS. mean ± SEM, n = 4, NS, not significant.
Extended Data Fig. 5. Targeting p53-MDM2 interaction activates CD8+ T cell-mediated anti-tumor immunity. Related to Fig. 5.
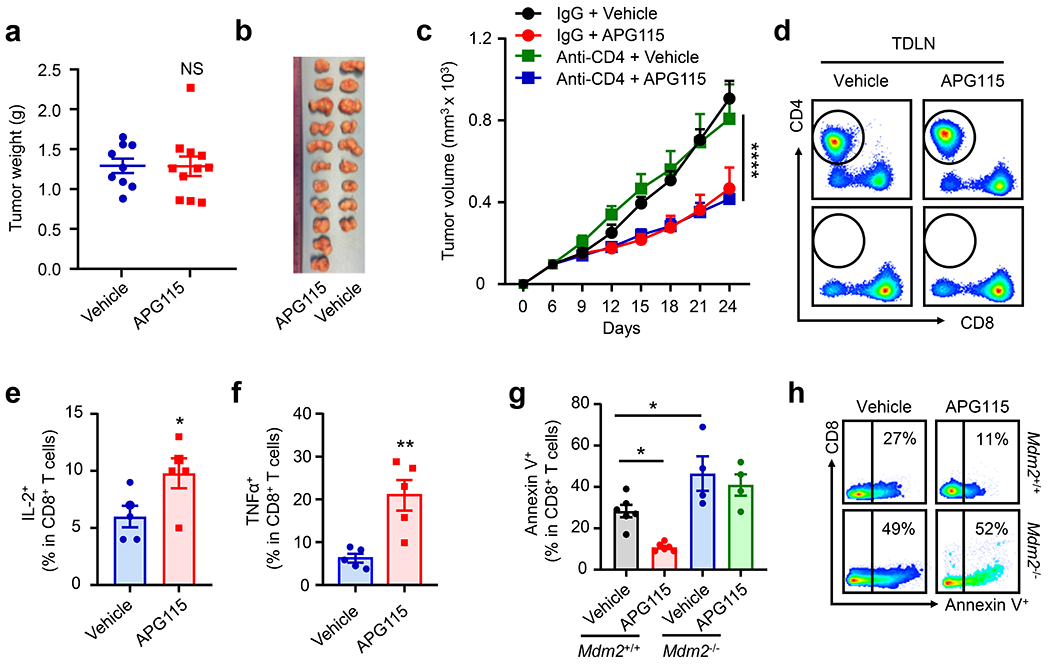
a-b, Effect of APG115 on tumor growth in NSG mice. MC38 tumor bearing NSG mice were treated with APG115. Tumor weight (a) and image (b) are shown after 21 days. mean ± SEM, Vehicle, n = 9; APG115, n = 11, NS, not significant.
c-d, Effect of CD4+ T cell depletion on APG15-mediated anti-tumor activity. MC38 tumor bearing C57BL/6J mice were treated with APG115 and/or anti-CD4. (c) Tumor volume was monitored. mean ± SEM, n = 6. **** p < 0.0001, two-way ANOVA. (d) The efficacy of CD4+ T cell depletion. Tumor draining lymph node (TDLN) T cells were analyzed by FACS. One of 5 dot-plots is shown
e-f, Role of APG115 on 4T1 tumor infiltrating CD8+ T cells. The percentages of IL-2+ and TNFα+ cells in CD8+ T cells were determined by FACS. mean ± SEM, n = 5, *p < 0.05, **p < 0.01, Mann Whitney test.
g-h, Effect of MDM2 on APG115-regulated T cell apoptosis. B16F10 tumor bearing Mdm2+/+Cd4-Cre or Mdm2fl/flCd4-Cre mice were treated with APG115. The percentages of Annexin V+ cells in tumor infiltrating CD8+ T cells were determined by FACS. mean ± SEM, n = 4 - 6; *p < 0.05, one-way ANOVA.
Extended Data Fig. 6. Targeting p53-MDM2 interaction stabilizes T cell STAT5 and synergizes with immunotherapy. Related to Fig. 6.
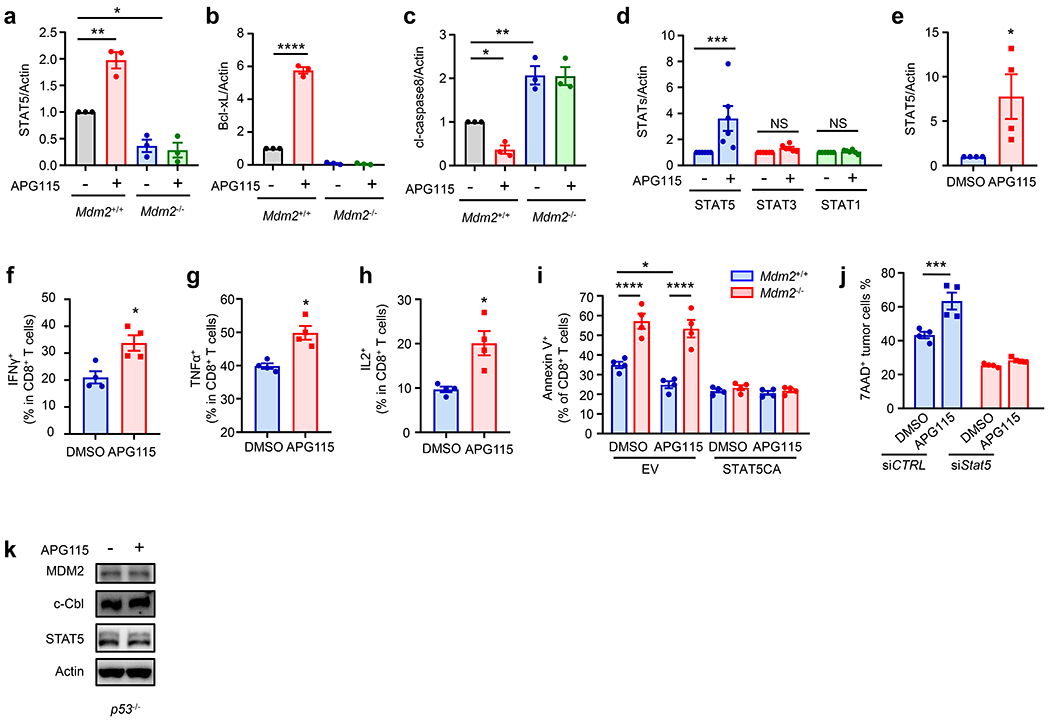
a-e, Role of APG115 in CD8+ T cells. (a, c) Mouse Mdm2+/+Cd4-Cre and Mdm2fl/flCd4-Cre CD8+ T cells were stimulated with anti-CD3 and anti-CD28 in the presence of APG115. Western blots showed STAT5 (a), Bcl-xL (b), and cl-caspase 8 (c) in T cells. mean ± SEM, n = 3, *p < 0.05, **p < 0.01, ****p < 0.0001, one-way ANOVA, (d) Western blots showed expression of STATs and MDM2 in MC38 tumor infiltrating CD8+ T cells in mice treated with APG115. mean ± SEM, n = 6, ***p < 0.001, one-way ANOVA. (e) Western blots showed STAT5 expression in human CD8+ T cells stimulated with anti-CD3 and anti-CD28 in the presence of APG115. mean ± SEM, n = 4, *p < 0.05, Mann Whitney test.
f-h, Role of APG115 in CD8+ T cells. Mouse CD8+ T cells were stimulated with anti-CD3 and anti-CD28 in the presence of APG115. IFNγ+ (f), TNFα+ (g), and IL-2+ (h) cells in CD8+ T cells were analyzed by FACS. mean ± SEM, n = 4, *p < 0.05, Mann Whitney test.
i. Effect of STAT5CA expression on MDM2-mediated T cell survival. Activated Mdm2+/+ and Mdm2−/− CD8+ cells were transduced with STAT5CA or vector expressing retrovirus, and treated with APG115. The percentages of Annexin V+ cells in Mdm2+/+ or Mdm2−/− CD8+ T cells were determined by FACS. mean ± SEM, n = 4, *p < 0.05, ****p < 0.0001, one-way ANOVA.
j. Effect of STAT5 knock down in OT-I-mediated tumor killing. B16F10-OVA cells were cultured with STAT5 deficiency OT-I T cells for 24 hours. Tumor cell apoptosis was determined by flow cytometry analysis. Results are shown as the percentages of 7AAD+ tumor cells. mean ± SEM, n = 4, ***p < 0.001, one-way ANOVA.
k, Role of APG115 on MDM2, c-Cbl, and STAT5 expression in p53−/− T cells. p53−/−CD8+ T cells were treated with APG115. MDM2, c-Cbl, and STAT5 levels were analyzed by Western Blotting. One of 3 experiments is shown.
Extended Data Fig. 7. Mdm2 expression correlates with immune gene signatures in patients with cancer. Related to Fig. 7.
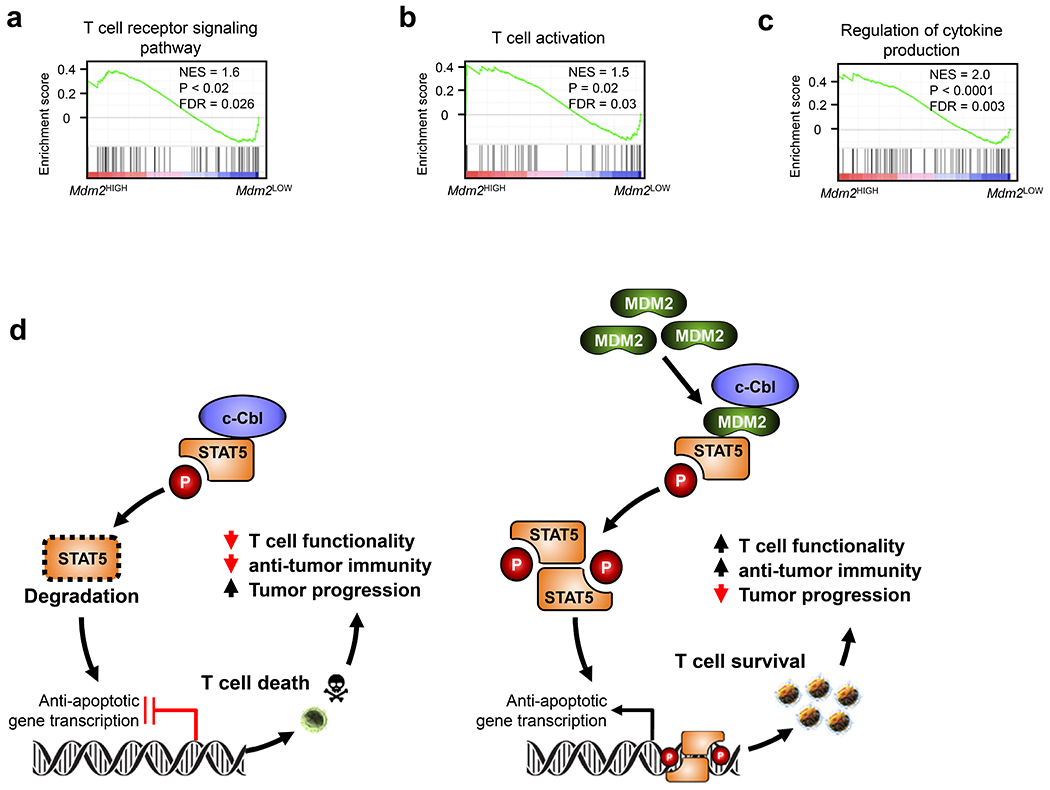
a-c, GSEA analysis showed differentially expressed gene signatures - including T cell receptor signaling pathway (a), T cell activation (b), and cytokine production regulation (c) - in human melanoma infiltrating T cells with high vs low Mdm2 expression.
d, Schematic diagram illustrates that MDM2 competes with c-Cbl and prevents c-Cbl binding to STAT5, thereby reducing c-Cbl-mediated STAT5 degradation and supporting CD8+ T cell-mediated immunity and immunotherapy.
Supplementary Material
Acknowledgements
We thank Y. Sun for providing His-Ub and His-Ub K48R plasmids, W. Wei for providing HA-MDM2 plasmid, F. Hua for providing HA-c-Cbl plasmid, and G. Lozano for providing Mdm2flox/flox mice. We are grateful for Y. Sun and W. Wei for their scientific input. This work was supported in part by research grants from the NIH/NCI grants for WZ (CA248430, CA217648, CA123088, CA099985, CA193136, and CA152470) and the NIH through the University of Michigan Rogel Cancer Center Support Grant (P30CA46592).
Footnotes
Competing Interests Statement
The University of Michigan has filed patent applications on APG115 and its analogues, which have been licensed to Ascentage Pharma International Group for clinical development. Shaomeng Wang is a co-founder and a paid consultant of Ascentage Pharma International Group and owns stock in Ascentage. The University of Michigan also owns stock in Ascentage.
Data Availability Statement
Single-cell RNA sequencing data that support the findings of this study have been deposited in NCBI Gene Expression Omnibus (GEO) under the accession number GSE72056. All other data that support the findings of this study are available from the corresponding author upon reasonable request. Source data are provided with the paper.
References
- 1.Wade M, Li YC & Wahl GM MDM2, MDMX and p53 in oncogenesis and cancer therapy. Nat Rev Cancer 13, 83–96 (2013). [DOI] [PMC free article] [PubMed] [Google Scholar]
- 2.Chene P Inhibiting the p53-MDM2 interaction: an important target for cancer therapy. Nat Rev Cancer 3, 102–109 (2003). [DOI] [PubMed] [Google Scholar]
- 3.Shangary S & Wang S Small-molecule inhibitors of the MDM2-p53 protein-protein interaction to reactivate p53 function: a novel approach for cancer therapy. Annu Rev Pharmacol Toxicol 49, 223–241 (2009). [DOI] [PMC free article] [PubMed] [Google Scholar]
- 4.Khoo KH, Verma CS & Lane DP Drugging the p53 pathway: understanding the route to clinical efficacy. Nat Rev Drug Discov 13, 217–236 (2014). [DOI] [PubMed] [Google Scholar]
- 5.Karni-Schmidt O, Lokshin M & Prives C The Roles of MDM2 and MDMX in Cancer. Annu Rev Pathol 11, 617–644 (2016). [DOI] [PMC free article] [PubMed] [Google Scholar]
- 6.Zhang Z, Li M, Wang H, Agrawal S & Zhang R Antisense therapy targeting MDM2 oncogene in prostate cancer: Effects on proliferation, apoptosis, multiple gene expression, and chemotherapy. Proc Natl Acad Sci U S A 100, 11636–11641 (2003). [DOI] [PMC free article] [PubMed] [Google Scholar]
- 7.Topalian SL, Drake CG & Pardoll DM Immune checkpoint blockade: a common denominator approach to cancer therapy. Cancer Cell 27, 450–461 (2015). [DOI] [PMC free article] [PubMed] [Google Scholar]
- 8.Zou W, Wolchok JD & Chen L PD-L1 (B7-H1) and PD-1 pathway blockade for cancer therapy: Mechanisms, response biomarkers, and combinations. Sci Transl Med 8, 328rv324 (2016). [DOI] [PMC free article] [PubMed] [Google Scholar]
- 9.Ribas A & Wolchok JD Cancer immunotherapy using checkpoint blockade. Science 359, 1350–1355 (2018). [DOI] [PMC free article] [PubMed] [Google Scholar]
- 10.Gajewski TF, Schreiber H & Fu YX Innate and adaptive immune cells in the tumor microenvironment. Nat Immunol 14, 1014–1022 (2013). [DOI] [PMC free article] [PubMed] [Google Scholar]
- 11.Zou W Immunosuppressive networks in the tumour environment and their therapeutic relevance. Nat Rev Cancer 5, 263–274 (2005). [DOI] [PubMed] [Google Scholar]
- 12.Kawashima H et al. Tumor suppressor p53 inhibits systemic autoimmune diseases by inducing regulatory T cells. J Immunol 191, 3614–3623 (2013). [DOI] [PubMed] [Google Scholar]
- 13.Pan Y & Haines DS The pathway regulating MDM2 protein degradation can be altered in human leukemic cells. Cancer Res 59, 2064–2067 (1999). [PubMed] [Google Scholar]
- 14.Komarov PG et al. A chemical inhibitor of p53 that protects mice from the side effects of cancer therapy. Science 285, 1733–1737 (1999). [DOI] [PubMed] [Google Scholar]
- 15.Waldmann TA & Chen J Disorders of the JAK/STAT Pathway in T Cell Lymphoma Pathogenesis: Implications for Immunotherapy. Annu Rev Immunol 35, 533–550 (2017). [DOI] [PMC free article] [PubMed] [Google Scholar]
- 16.O’Shea JJ, Gadina M & Schreiber RD Cytokine signaling in 2002: new surprises in the Jak/Stat pathway. Cell 109 Suppl, S121–131 (2002). [DOI] [PubMed] [Google Scholar]
- 17.Tirosh I et al. Dissecting the multicellular ecosystem of metastatic melanoma by single-cell RNA-seq. Science 352, 189–196 (2016). [DOI] [PMC free article] [PubMed] [Google Scholar]
- 18.Goh EL, Zhu T, Leong WY & Lobie PE c-Cbl is a negative regulator of GH-stimulated STAT5-mediated transcription. Endocrinology 143, 3590–3603 (2002). [DOI] [PubMed] [Google Scholar]
- 19.Dieudonne FX et al. Promotion of osteoblast differentiation in mesenchymal cells through Cbl-mediated control of STAT5 activity. Stem Cells 31, 1340–1349 (2013). [DOI] [PubMed] [Google Scholar]
- 20.Aguilar A et al. Discovery of 4-((3′R,4′S,5′R)-6″-Chloro-4′-(3-chloro-2-fluorophenyl)-1′-ethyl-2″-oxodispiro[ cyclohexane-1,2′-pyrrolidine-3′,3″-indoline]-5′-carboxamido)bicyclo[2.2.2]octane -1-carboxylic Acid (AA-115/APG-115): A Potent and Orally Active Murine Double Minute 2 (MDM2) Inhibitor in Clinical Development. J Med Chem 60, 2819–2839 (2017). [DOI] [PMC free article] [PubMed] [Google Scholar]
- 21.Brown CJ, Lain S, Verma CS, Fersht AR & Lane DP Awakening guardian angels: drugging the p53 pathway. Nat Rev Cancer 9, 862–873 (2009). [DOI] [PubMed] [Google Scholar]
- 22.Watanabe M, Moon KD, Vacchio MS, Hathcock KS & Hodes RJ Downmodulation of tumor suppressor p53 by T cell receptor signaling is critical for antigen-specific CD4(+) T cell responses. Immunity 40, 681–691 (2014). [DOI] [PMC free article] [PubMed] [Google Scholar]
- 23.Banerjee A et al. Lack of p53 Augments Antitumor Functions in Cytolytic T Cells. Cancer Res 76, 5229–5240 (2016). [DOI] [PMC free article] [PubMed] [Google Scholar]
- 24.Lujambio A et al. Non-cell-autonomous tumor suppression by p53. Cell 153, 449–460 (2013). [DOI] [PMC free article] [PubMed] [Google Scholar]
- 25.Tsai NP et al. Multiple autism-linked genes mediate synapse elimination via proteasomal degradation of a synaptic scaffold PSD-95. Cell 151, 1581–1594 (2012). [DOI] [PMC free article] [PubMed] [Google Scholar]
- 26.Fang DD et al. MDM2 inhibitor APG-115 synergizes with PD-1 blockade through enhancing antitumor immunity in the tumor microenvironment. J Immunother Cancer 7, 327 (2019). [DOI] [PMC free article] [PubMed] [Google Scholar]
- 27.Itahana K et al. Targeted inactivation of Mdm2 RING finger E3 ubiquitin ligase activity in the mouse reveals mechanistic insights into p53 regulation. Cancer Cell 12, 355–366 (2007). [DOI] [PubMed] [Google Scholar]
- 28.Li Y et al. Discovery of MD-224 as a First-in-Class, Highly Potent, and Efficacious Proteolysis Targeting Chimera Murine Double Minute 2 Degrader Capable of Achieving Complete and Durable Tumor Regression. J Med Chem 62, 448–466 (2019). [DOI] [PMC free article] [PubMed] [Google Scholar]
Methods-only References
- 29.Lin H et al. Host expression of PD-L1 determines efficacy of PD-L1 pathway blockade-mediated tumor regression. J Clin Invest 128, 805–815 (2018). [DOI] [PMC free article] [PubMed] [Google Scholar]
- 30.Wang W et al. CD8(+) T cells regulate tumour ferroptosis during cancer immunotherapy. Nature 569, 270–274 (2019). [DOI] [PMC free article] [PubMed] [Google Scholar]
- 31.Grier JD, Yan W & Lozano G Conditional allele of mdm2 which encodes a p53 inhibitor. Genesis 32, 145–147 (2002). [DOI] [PubMed] [Google Scholar]
- 32.Wang D et al. Controllable synthesis of dual-MOFs nanostructures for pH-responsive artemisinin delivery, magnetic resonance and optical dual-model imaging-guided chemo/photothermal combinational cancer therapy. Biomaterials 100, 27–40 (2016). [DOI] [PubMed] [Google Scholar]
- 33.Huang M et al. SAVER: gene expression recovery for single-cell RNA sequencing. Nat Methods 15, 539–542 (2018). [DOI] [PMC free article] [PubMed] [Google Scholar]
- 34.Subramanian A et al. Gene set enrichment analysis: a knowledge-based approach for interpreting genome-wide expression profiles. Proc Natl Acad Sci U S A 102, 15545–15550 (2005). [DOI] [PMC free article] [PubMed] [Google Scholar]
Associated Data
This section collects any data citations, data availability statements, or supplementary materials included in this article.